Dynamics and Management of Rising Outbreak Spruce Budworm Populations


1
Natural Resources Canada, Canadian Forest Service, P.O. Box 10380 Stn Ste-Foy, Quebec, QC G1V-4C7, Canada
2
Natural Resources Canada, Canadian Forest Service, 1219 Queen St E, Sault Ste Marie, ON P6A-2E6, Canada
3
Société de Protection des Forêts contre les Insectes et Maladies, 1780 Rue Semple, Quebec, QC G1N 4B8, Canada
4
Ministère des Forêts, de la Faune et des Parcs du Québec, 2700 rue Einstein, Quebec, QC G1P 3W8, Canada
*
Author to whom correspondence should be addressed.
Forests 2019, 10(9), 748; https://0-doi-org.brum.beds.ac.uk/10.3390/f10090748
Submission received: 12 August 2019
/
Revised: 28 August 2019
/
Accepted: 30 August 2019
/
Published: 1 September 2019
(This article belongs to the Special Issue Protection Strategy against Spruce Budworm)
Abstract
:Management of spruce budworm, Choristoneura fumiferana (Clem.), outbreak spread requires understanding the demographic processes occurring in low, but rising populations. For the first time, detailed observations were made in the early stages of outbreak development. We sampled populations over a three-year period in both treated and untreated populations in the Lower St-Lawrence region of Quebec, Canada, and measured the density-dependence of survival and population growth rates, and the impact of natural enemies and insecticides. Insecticides tested were Bacillus thuringiensis (Berliner 1915) and tebufenozide. We recorded strong density-dependence of survival between early larval stages and adult emergence, explained largely by the variation of natural enemy impacts and overcrowding. We also observed inverse density-dependence of apparent fecundity: net immigration into lower-density populations and net emigration from the higher, linked to a threshold of ~25% defoliation. Because of high migration rates, none of the 2013 treatments reduced egg populations at the end of summer. However lower migration activity in 2014 allowed population growth to be reduced in treated plots. This evidence lends support to the conclusion that, for a budworm population to increase to outbreak density, it must be elevated via external perturbations, such as immigration, above a threshold density of ~4 larvae per branch tip (L4). Once a population has increased beyond this threshold, it can continue growing and itself become a source of further spread by moth migration. These findings imply that populations can be brought down by insecticide applications to a density where mortality from natural enemies can keep the reduced population in check, barring subsequent immigration. While we recognize that other factors may occasionally cause a population to exceed the Allee threshold and reach outbreak level, the preponderance of immigration implies that if all potential sources of significant numbers of moths are reduced on a regional scale by insecticide applications, a widespread outbreak can be prevented, stopped or slowed down by reducing the supply of migrating moths.
1. Introduction
Knowing how an insect outbreak starts is central to the development of any preventative management strategy. The spruce budworm (SBW), Choristoneura fumiferana (Clem.), is the most destructive forest insect pest of eastern North America [1]. Millions of dollars were spent during the last outbreak cycle (1975–1995) trying to predict what would happen, and to mitigate the damage [2,3]. A new cycle of spruce budworm outbreak has recently emerged in the province of Quebec [4] so the time is right to ask how best to manage this emerging threat. However, despite the considerable investment in population ecology research over the last cycle, we still have only a meagre understanding of the dynamics of rising outbreak SBW populations. This is due to the fact that funding for pest research typically lags a few years behind the development of an outbreak. Consequently, entomologists frequently have little opportunity to study the early phase of outbreak development.
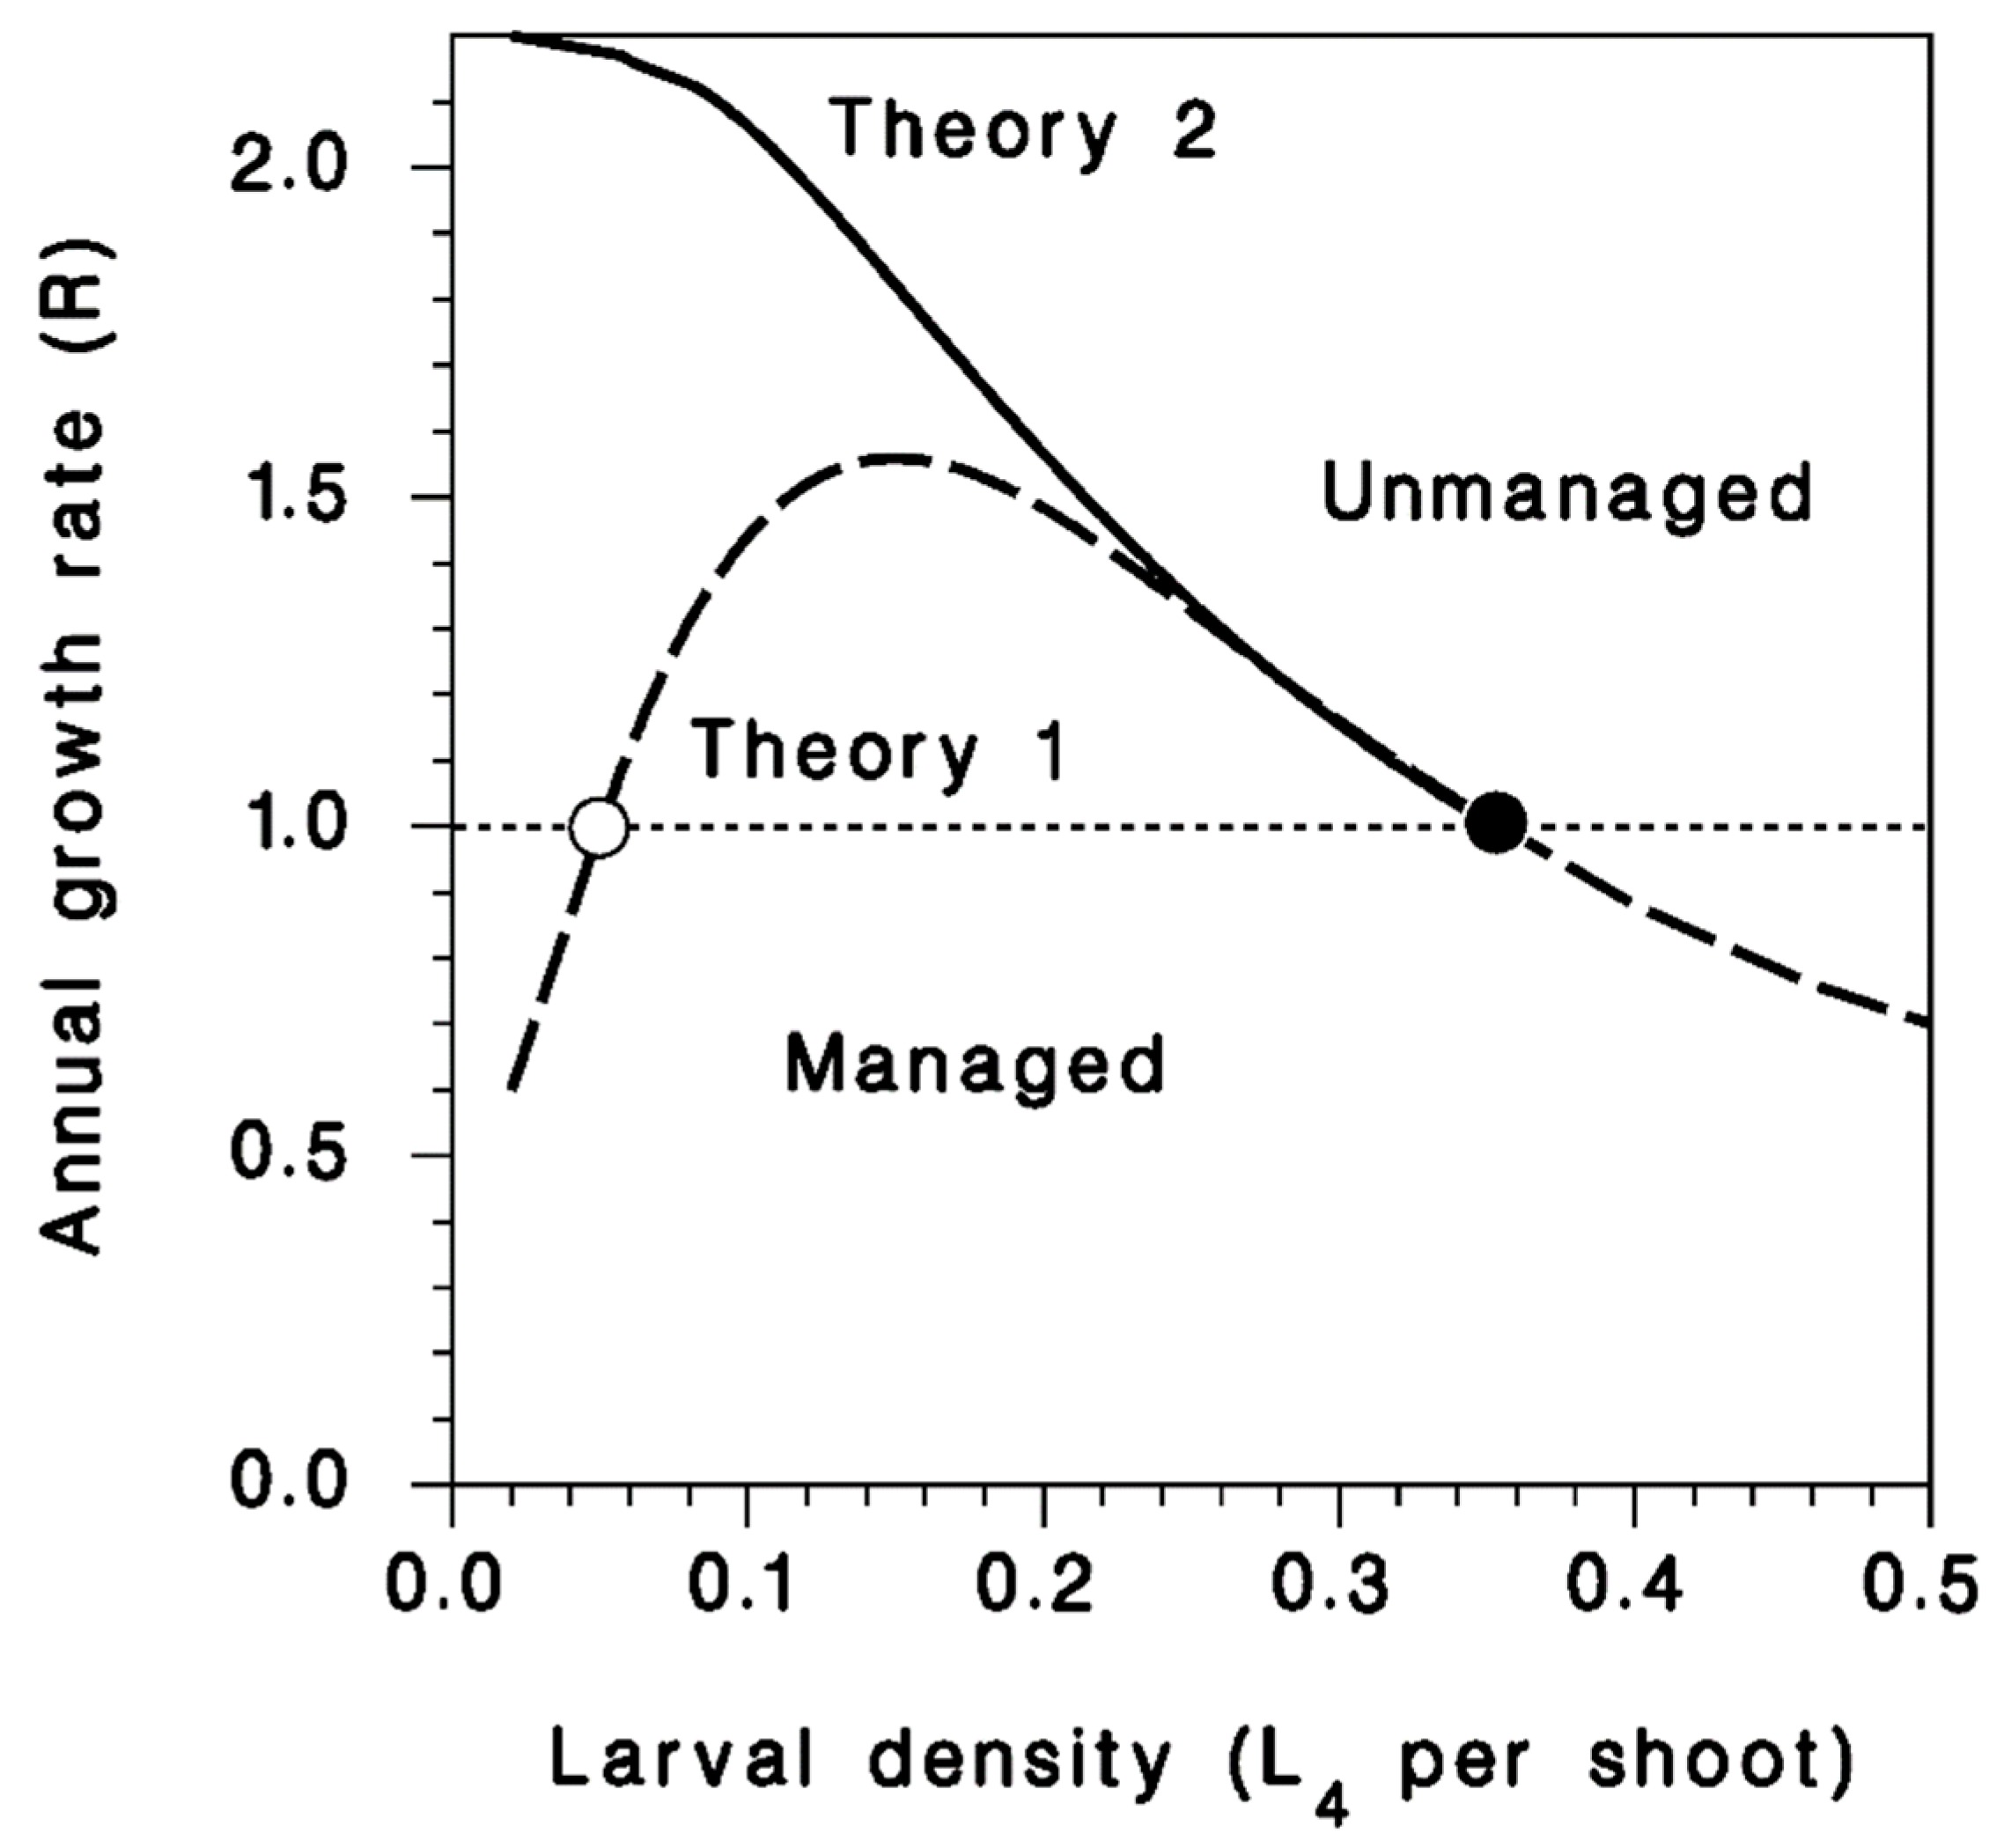
There are two distinct views on how spruce budworm outbreaks start, and what controls their pattern of termination and recurrence (Figure 1; for a good description of these two contrasting theories, see Table SI1 in [5]). One theory dates back to the 1960′s and was formalized in the 1970′s as “Double-equilibrium theory” [6]. It was based on life-table studies done in Green River, NB (Canada) in the 1950s and 1960s [7]. The second, which is dubbed the “oscillatory theory” here, was formulated in the early 1980’s after a thorough re-analysis of the same Green River life tables that formed the basis of the earlier double-equilibrium theory [8]. The Green River data, rather crucially, lacked any observations relating to the start of the outbreak, so both these theories suffer from a lack of empirical foundation.
The distinction between the two theories of periodic outbreaks matters for its practical as well as theoretical significance. If recurring spruce budworm outbreaks are the result of a triggered eruption (Theory 1) then there are significant opportunities for delaying, or even preventing, outbreaks—either through population management (i.e., direct control) or forest management (i.e., indirect control). If, instead, spruce budworm outbreaks are the result of a periodic predator-prey cycling process (Theory 2), then there is little opportunity to alter the timing or the trajectory that populations will follow; all that is possible is to reduce peak populations somewhat, to limit forest damage below some modest threshold. In the former case, the earlier the intervention, the more likely it is to maintain populations below the eruption threshold. In the latter case, the best one can hope for with early intervention is to modulate cycle amplitude through a continual series of population reductions that are suspended once the population cycle peaks [9,10]. If the first is true, then management can aim at preventing or retarding the development of an outbreak [11].
In sum, a great deal hinges on our understanding of the early phase of outbreak initiation, which is why so much effort has been invested recently in understanding outbreak initiation from incipience. The results of population dynamics studies done since the 1980s in Ontario and Quebec have brought important new data to bear on our understanding of the outbreak process, particularly the terminal stage of outbreak collapse. First, the “gradual” nature of changes in larval survival from natural enemies at the end of outbreaks is questionable. Evidence suggests that mortality increases in sufficiently old outbreaks only after an initial drop in the budworm population, caused by disease, starvation, emigration, low survival among dispersing larvae or theoretically pesticide applications. Natural enemies then take control and an endemic period starts. This was well documented during the collapse of the 1975–1995 spruce budworm outbreak in Ontario and Quebec (see Figure 7 in [12]). Second, over nearly three decades of observations in endemic populations starting in the mid 1980′s in Quebec indicate that mortality from natural enemies remains very high for long periods after collapse. And there are no signs yet of any natural enemy rarefication that would allow the budworm to begin rising from endemic levels. Clearly, the outbreak process is not strictly sinusoidal, or populations in this part of Quebec would have risen a decade or more ago. Finally, a strong Allee effect [13,14] has recently been documented in spruce budworm mating success, whereby females in low-density populations have a very low probability of attracting a male and mating [15]. This density-dependent mating success, combined with very high mortality among larvae in endemic populations raises the possibility that budworm actually goes extinct locally or regionally between outbreaks—a result that is more consistent with the older eruptive theory of budworm population dynamics than with the newer oscillatory theory.
But how do these observations on population collapse and endemicity through the 1990s and 2000s relate to what happens during the rising phase of the outbreak cycle? We sought to characterize the nature of population growth in incipient populations of spruce budworm in the Lower St. Lawrence (LSL) region of Quebec in 2012–2014 by examining detailed patterns of population change in a set of monitoring plots where moderately low, but rising populations were divided into two groups: (a) Those to be treated with a suppression tactic, and (b) those to be left alone. Our expectations are expressed in Figure 1. We predicted that spruce budworm would not exhibit the monotonic growth functions consistent with Theory 2 (solid line), but would instead exhibit positive density dependence and non-monotonic growth more consistent with Theory 1 (dashed line). In other words, we predicted eruptive, rather than cyclic patterns of growth. We also predicted that our suppression tactics would lead to consistently low rates of recruitment across all density classes (below the dotted horizontal line), leading to the overall conclusion that there may be circumstances where early intervention could lead to the prolonged suppression of budworm populations.
The research reported here had two main objectives: (1) To observe the dynamics of early rising outbreak populations, over as wide a range of densities as possible, from endemic to full outbreak; (2) to conduct efficacy trials of three common suppression tools: (i) A bacterial insecticide, (ii) a molting hormone analog, and (iii) a pheromone-based mating disruptant. Here, we report measurements of population levels, defoliation, survival and recruitment recorded in treated and untreated locations in the LSL between 2012 and 2014, as a regional outbreak was rising. We were particularly interested in whether the three suppression treatments were equally efficacious across the population density spectrum. If the treatments varied in patterns of efficacy then the existence of eruptive patterns of early population growth would lead to a complex interaction that could serve as a specific guide for optimal suppression. The main objective of pheromone mating disruption as a population management tool is to reduce egg recruitment by preventing local females from mating. The disappointing results of those trials are presented elsewhere [16]. Suffice it to state that mating disruption had no measurable effect of SBW demographics, and those treatments will not be further discussed here.
2. Materials and Methods
2.1. Plots
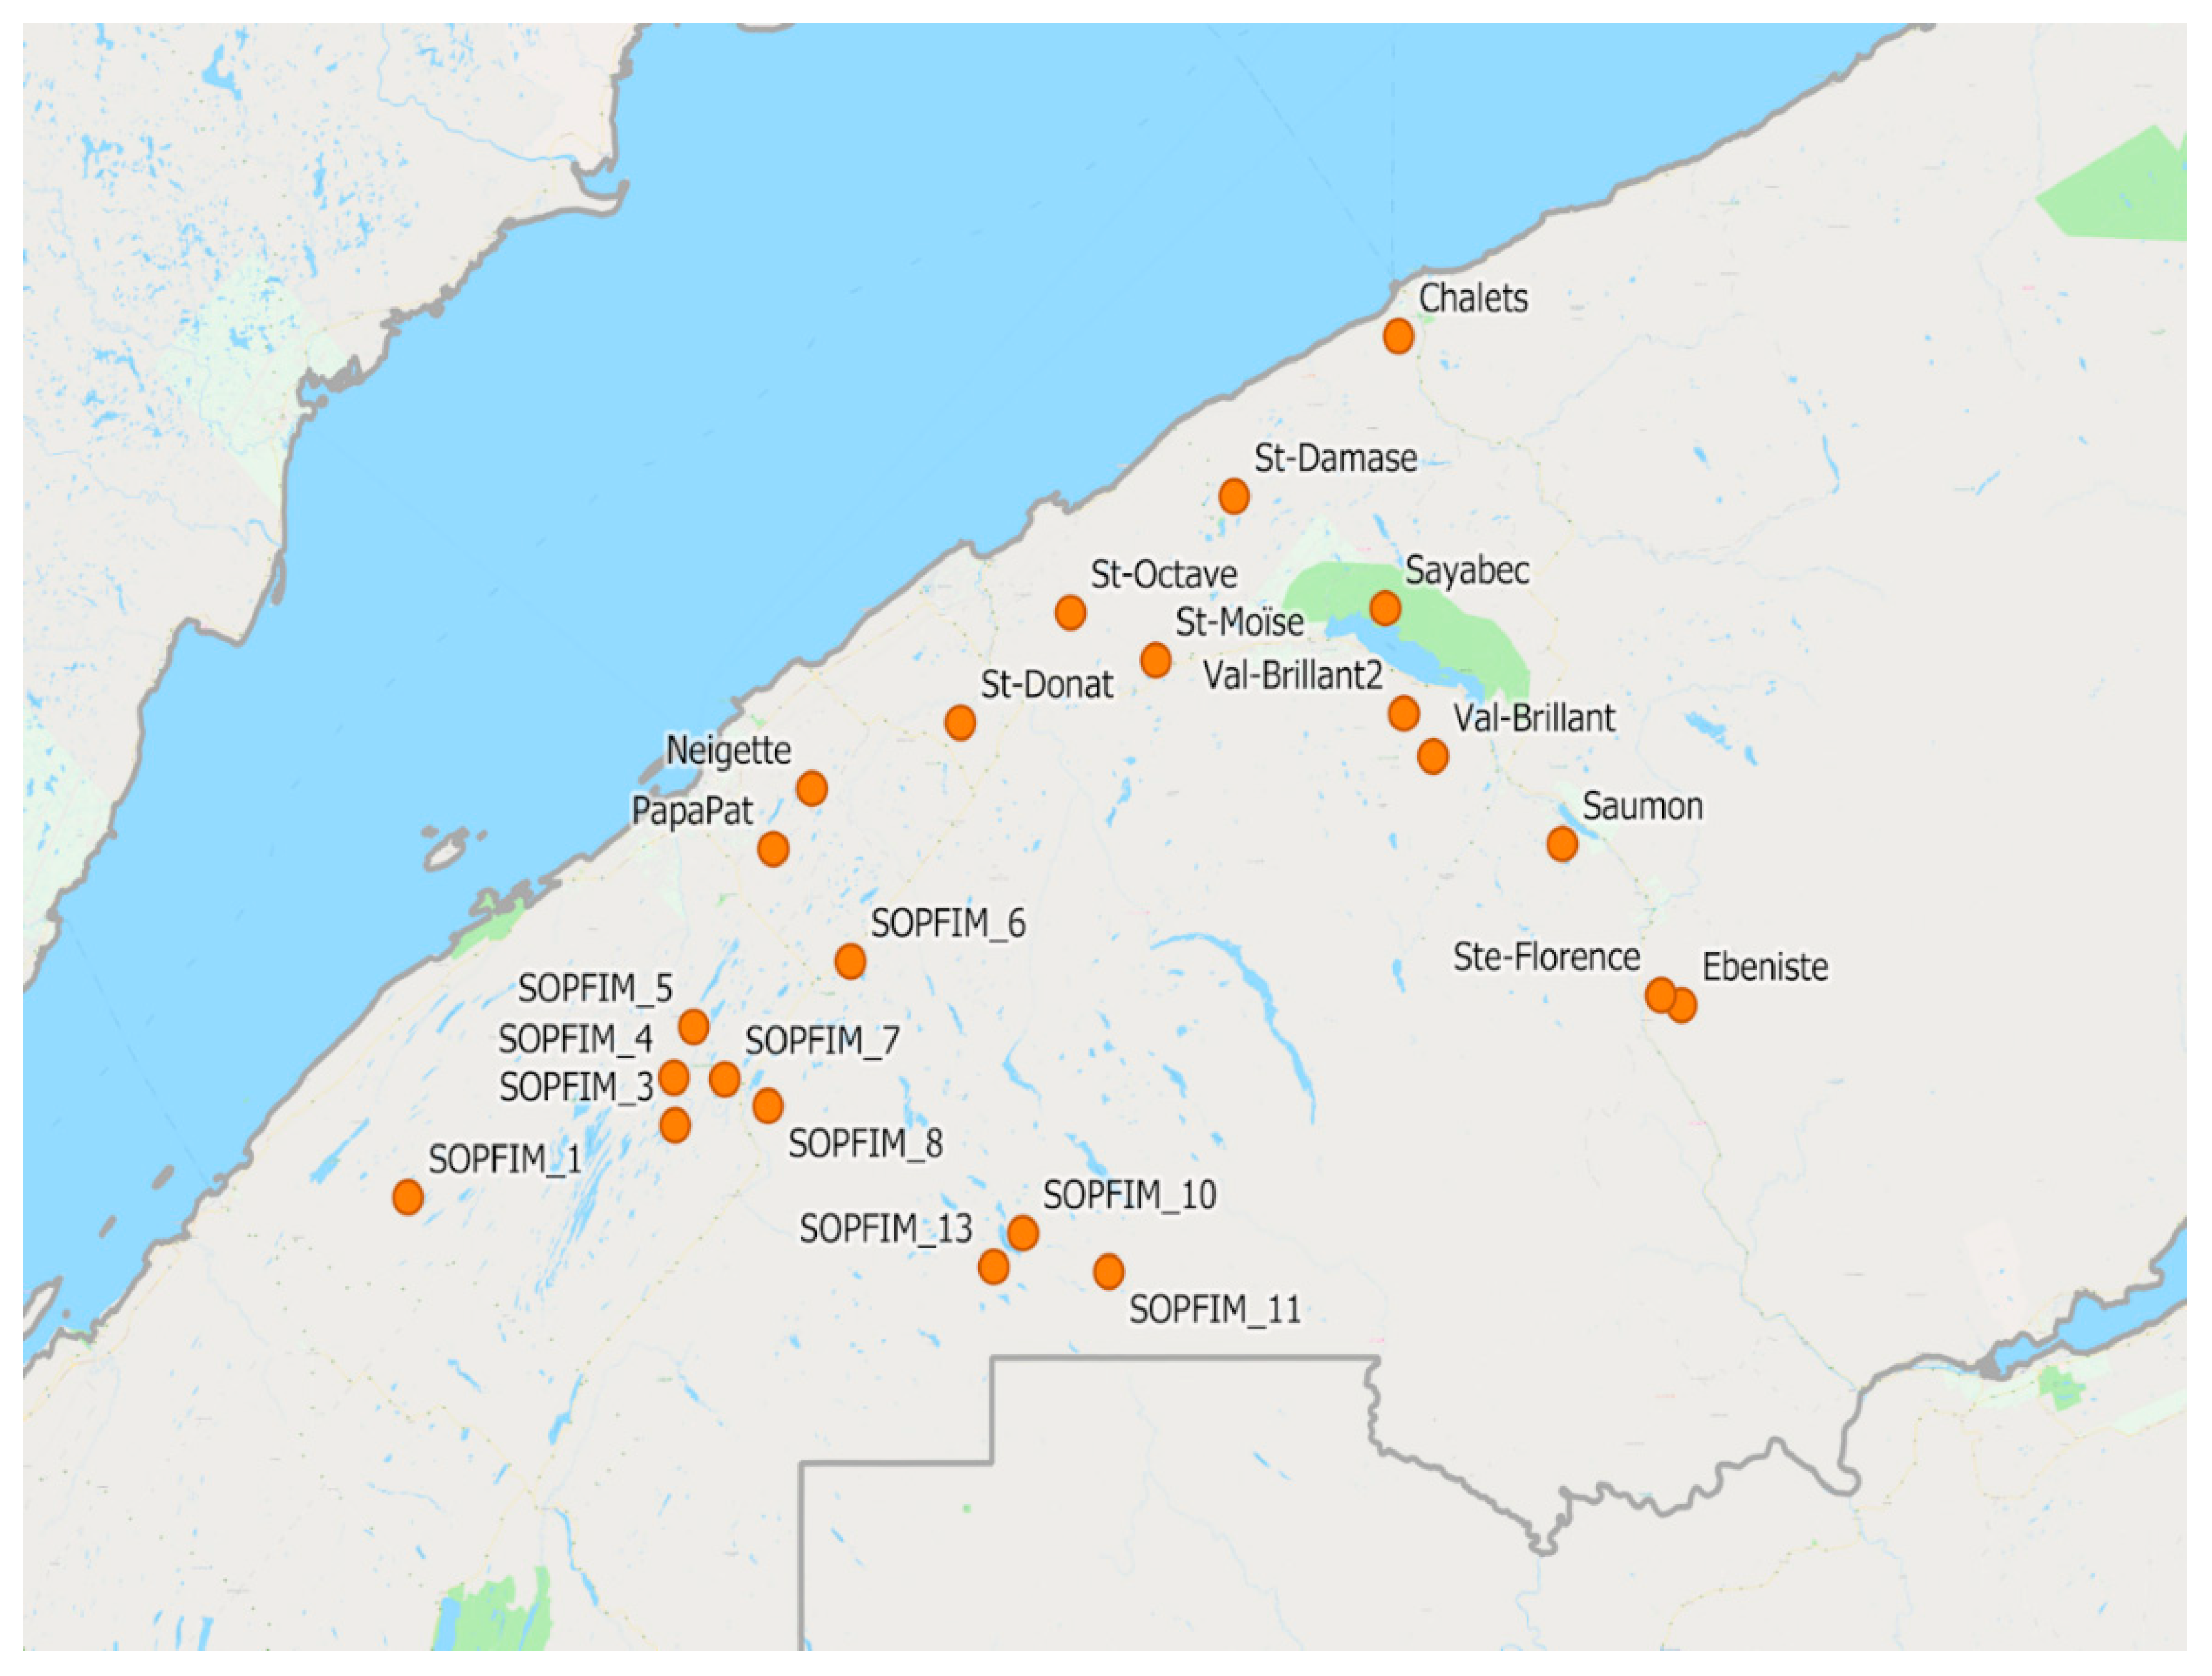
Our observations were made between 2012 and 2015, in a series of plots located in a broad triangle on the south shore of the St-Lawrence River in Quebec, Canada, between Rimouski to the west, Matane to the east, and Causapscal to the south (Figure 2). This region was chosen because it harboured spruce budworm populations that were in the early stages of outbreak development starting in 2011. Three criteria were used to select those plots: (1) Spruce budworm population density, (2) stand composition (sufficient conifer content, tree size and age), and (3) accessibility. Plots were between 30 and 100 ha. In 2012, we used 6 plots, three untreated and three treated with Bacillus thuringiensis (Berliner 1915) var kurstaki (Btk), a naturally-occurring bacterial pathogen of insects. In 2013, a total of 12 plots were sampled, four untreated, four treated with tebufenozide, a synthetic insecticide that mimics the insect hormone ecdysone, and four treated with a synthetic pheromone as a mating disruptant (“Disrupt Bioflake”). In 2014 our observations were made in 13 plots, nine of which were untreated and four treated with Btk. The Société de Protection des Forêts contre les Insectes et Maladies (SOPFIM) sampled an additional ten sites, located further to the south west at the edge of the developing outbreaks. In 2015, we used 13 plots, this time with no treatments.
2.2. Treatments
In 2012, a standard aerial application of Btk (Foray 76B, Valent BioSciences) was applied on 7 June 2012 between 5:00 and 7:00 AM. The application was made under calm, stable air conditions, at the rate of 30 BIU/ha in 1.5 l/ha by a Cessna 188 fixed-wing aircraft equipped with four Micronair AU4000 atomizers (Micron Sprayers Limited, Bromyard, United Kingdom). The aircraft was guided by on-board GPS through the Accuair Aerial Management System, using deposit-optimization software based on meteorological information collected in flight by the AIMMS 20 system (McLeod et al. 2012). There was no assessment of insecticide deposit.
In 2013, tebufenozide (Mimic®, Valent BioSciences) was applied aerially in the second half of June, when larvae had reached the 5th instar (see [17] for details). Disrupt Bioflakes® (Hercon Environmental) were applied in four plots (see [16] for details).
In 2014, a standard aerial application of Btk (Foray 76B; 30 BIU/ha in 1.5 l/ha). Two plots were treated with an AT-502 (4 ASC-A10 atomizers at 9000 RPM) on 10 June (AM) at peak L4 with on-board AG-NAV GUIA system. The other two were treated on 16 June, slightly later at average instar 4.5, with an AT-802F (10 Micronair AU4000 atomizers at 8000 RPM) was guided by on-board GPS through the Accuair Aerial Management System, using deposit-optimization software. Deposit was assessed using an ELISA-based assay. In each treated plot, 15 mid-crown branches were collected from balsam fir or white spruce trees hours after spray application. From each branch 5 new-growth shoots were collected for analysis using Agdia’s Btk Pathoscreen.
2.3. Foliage Sampling
The main objective of sampling was to determine the relationship between population density and (1) survival between the early larval stages (L4) and the adult stage, and (2) reproduction, or recruitment from the adult to the egg stage. To achieve this, 30–100 mid-crown branch tips (45–60 cm) were taken in each site at the peak of the 4th instar, at the end of the pupal stage (around 50% moth emergence), and at the end of egg hatch, from dominant and co-dominant balsam fir and white spruce trees. To provide information on the natural enemies (parasitoids and pathogens) in late larval stage, an additional sample was taken at the 6th instar. Sample sizes were varied to reduce sampling error as much as possible given the resources available, using well-established mean-variance relationships [18]. All live spruce budworms found on the branches, and all current year shoots were counted. Density was expressed as spruce budworm per current shoot. The density of emerged adults was estimated from the number of pupal exuviae found on foliage in the pupal stage sample, plus live larvae and pupae in these samples that subsequently survived in rearing to emerge as adults (see Section 2.4). The sex ratio of emerged adults was very near 1:1 overall and is not presented here.
Eggs in each mass collected from the egg sample were counted. In 2014, pupal exuviae found on the foliage of the egg sample (taken several weeks after the end of adult emergence) were counted in all plots. This was done to test the hypothesis that both adults and eggs could be counted from the same sample to calculate egg recruitment (under the assumption that pupal cases remain on the foliage for at least that long). Based on the results, we used a single sample, taken after egg hatch, to estimate egg recruitment in 2015. In all years, defoliation was measured using the Fettes method [19] from branches in the egg-mass (end-of-season) branch samples in all plots (except in the SOPFIM plots of 2014, where defoliation was estimated from the L6 sample, too early for use here).
2.4. Survival in Rearing
Random subsamples of up to 100 live budworm larvae and pupae recovered from the foliage of each plot in the L4, L6, and pupal samples were placed individually in rearing on artificial diet to monitor survival to the adult stage and identify the natural enemies causing mortality (parasitoids and pathogens). In 2012, all larvae from individual branches were placed in rearing until the maximum of 100 was reached. In all other years, the subsamples were selected at random from all individuals recovered from each plot. Very few pathogens caused mortality in rearing, and those are not presented. Parasitoids were identified to species as much as possible or to family by staff of the Ministère de la Faune, des Forêts et des Parcs du Québec. Parasitoids of these low-density SBW populations are very diverse, and sample sizes are too small to allow an analysis species by species, except for the most abundant. We do not attempt analysis by species here.
2.5. Data Analysis
Population growth rates are the combined result of survival and reproduction. We are interested in determining the pattern of density dependence of both, as well as the relationship that exists between survival and the frequency of parasitoids in larval and pupal samples. We also examine the relationship between population density (at the early larval stage) and the resulting defoliation. Throughout, log() is base 10 logarithm while ln() is natural logarithm.
2.5.1. Field Survival
The density of emerged pupae (exuviae) recovered from the egg samples in 2014 was compared by regression analysis to the density of adults estimated from the pupal sample, to verify they were equal. Their equality is important to confirm the validity of the emerging adult density estimate obtained from the egg sample in 2015.
Survival from early larvae to emerged adults was calculated as the ratio S = A/N, where A is the density of emerging adults estimated from the pupal sample and N is the density of early-instar larvae estimated from the L4 sample. We used a non-linear regression model based on the Weibull function to relate S to N:
where p0 is maximum adult density (equivalent to a “carrying capacity”), and p0,S represents a distinct value of this maximum for the SOPFIM (2014) dataset, where adult densities seemed considerably higher than in other datasets; p1 is a common slope parameter for untreated populations that applies to all datasets (2012, 2013, 2014 and SOPFIM), and each additional subscripted p1 parameter tests for differences in slope between datasets, with p1|S applying specifically to the SOPFIM data of 2014; p2 parameters test for the effect of insecticides in each dataset (there was no insecticide treatment in the SOPFIM dataset); p3 is a common shape parameter. For illustration and further computations, this model was then reduced by removing the least significant terms one at a time until all remaining parameters were significant at α = 0.05. Multiplying Equation (1) by the density of larvae N, we obtain a sigmoid relationship between adult and larval density.
2.5.2. Defoliation
We tested the effects of larval population density and insecticide applications on defoliation using a General Linear Model with a logit transformation of defoliation:
where D is defoliation (%) and N is L4 density (larvae per shoot). Parameters a and e are common intercept and slope, while by, cT, dyT, fy, gT and hyT apply to specific years (index y), insecticide treatments (index T) and interactions (index yT). This model was reduced by removing least-significant terms one at a time until all remaining terms were significant at α = 0.05.
We also examined the relationship between defoliation and adult density (A) to illustrate the probable role of competition for food in the determination of maximum adult density (parameter p0 in Equation (1)).
2.5.3. Survival in Rearing
A detailed analysis of the contributions of the various parasitoid species to mortality in rearing is beyond the scope of this paper and will be reported separately. For the purposes of the present analysis, we limit ourselves to relating field survival and survival in rearing. Because survival in successive samples is affected by very different, successive natural enemies that change from stage to stage, their combined effect must be calculated. Survival estimates from insects reared from the L4 (S4), L6 (S6) and pupal samples (SP) were combined (multiplied) to provide an estimate of overall rearing survival. Because emerged pupae in the pupal sample represent survivors, rearing survival at the pupal stage was corrected for adult emergence with S’p = PE + SP × (1−PE) where PE is the proportion of emerged pupae in the sample:
Field survival from L4 to adult (S) was then related to rearing survival SR, year y and insecticide treatment T (0 or 1) by a general linear model:
where parameters ay, bT, cy and dT are year- and treatment-specific intercepts and slopes. This model was reduced by removing the least significant terms one at a time until all remaining terms were significant at α = 0.05.
2.5.4. Recruitment to the Egg Stage
A theoretical framework for the analysis and interpretation of egg recruitment in spruce budworm population dynamics was recently developed [20]. The analysis of egg recruitment is done in accordance to that work. We use the following equation to relate egg density E to the density of surviving adults A by non-linear regression using:
where IY represents the dataset-specific immigration rate (eggs/shoot), FY is the realized fecundity of local moths prior to emigration (eggs/adult) and index Y distinguishes datasets (year: 2012, 2013, 2014, 2015 or SOPFIM in 2014). From these regressions the apparent fecundity can be calculated as:
We noted an inverse relationship between apparent fecundity and defoliation D (in % of current-year foliage), which was analyzed with a general linear model:
where p0,Y and p1,Y represent the year (dataset) effects on the intercept and slope. We also tested the hypothesis that egg mass size, an indication of the reproductive status of females (the reproductively older, the smaller the egg mass; see [21]), with the model:
where p0,Y represents year effects on the intercept, and p1 is a common slope. For this analysis, one sample (3 egg masses) from LSL site 10 in 2012 was excluded as an outlier (average 34 eggs/mass).
2.5.5. Annual Population Growth Rate
Annual population growth rates were calculated from L4 densities in successive years (Nt and Nt+1) as Rt = Nt+1/Nt in each site and year where data were available. Estimates of N were available for all sites in 2012–2014. No L4 samples were taken in 2015. However, estimates of 2015 L4 density were obtained from 2014 egg density, using a regression equation developed from egg and L4 data collected in 2012–2014 (pooling years). This regression was:
Observations from the three years were compared with expected annual growth rates, calculated as the product of Equations (1) and (6).
3. Results
3.1. Population Density and Survival
Several population density expressions have been used: Per branch, per m2, per 10 ft2 or 10 m2 or per kg of foliage are common in the literature. Insects per kg of branch reduces branch to branch variance, is easy to measure, and eliminates differences in SBW density between balsam fir, white spruce and black spruce [18]. While counting growing shoots is more tedious, we have found it has the same virtues of variance reduction and homogenization between host plants. We believe that, because the number of shoots per unit foliage weight can vary in response to defoliation, and because it is shoots that are the main budworm food resource, whenever possible this is the ideal unit to use as denominator in density calculations. On balsam fir, the transformations between density expressions can be done with the following factors: 1052 shoots/m2 and 722 shoots/kg, and 0.686 m2/kg.
There was no significant difference in adult density estimated from the pupal samples or from pupal exuviae recovered in the eggs samples in 2014 (intercept −0.001 ± 0.003, not significantly different from 0: t = −0.46, p = 0.65; slope 1.065 ± 0.083, not significantly different from 1: t = 0.78, p = 0.45). Thus, estimating adult density using the exuviae recovered from the egg sample is an adequate cost-cutting strategy, provided that the egg sample is not delayed any longer than necessary once egg hatch is complete.
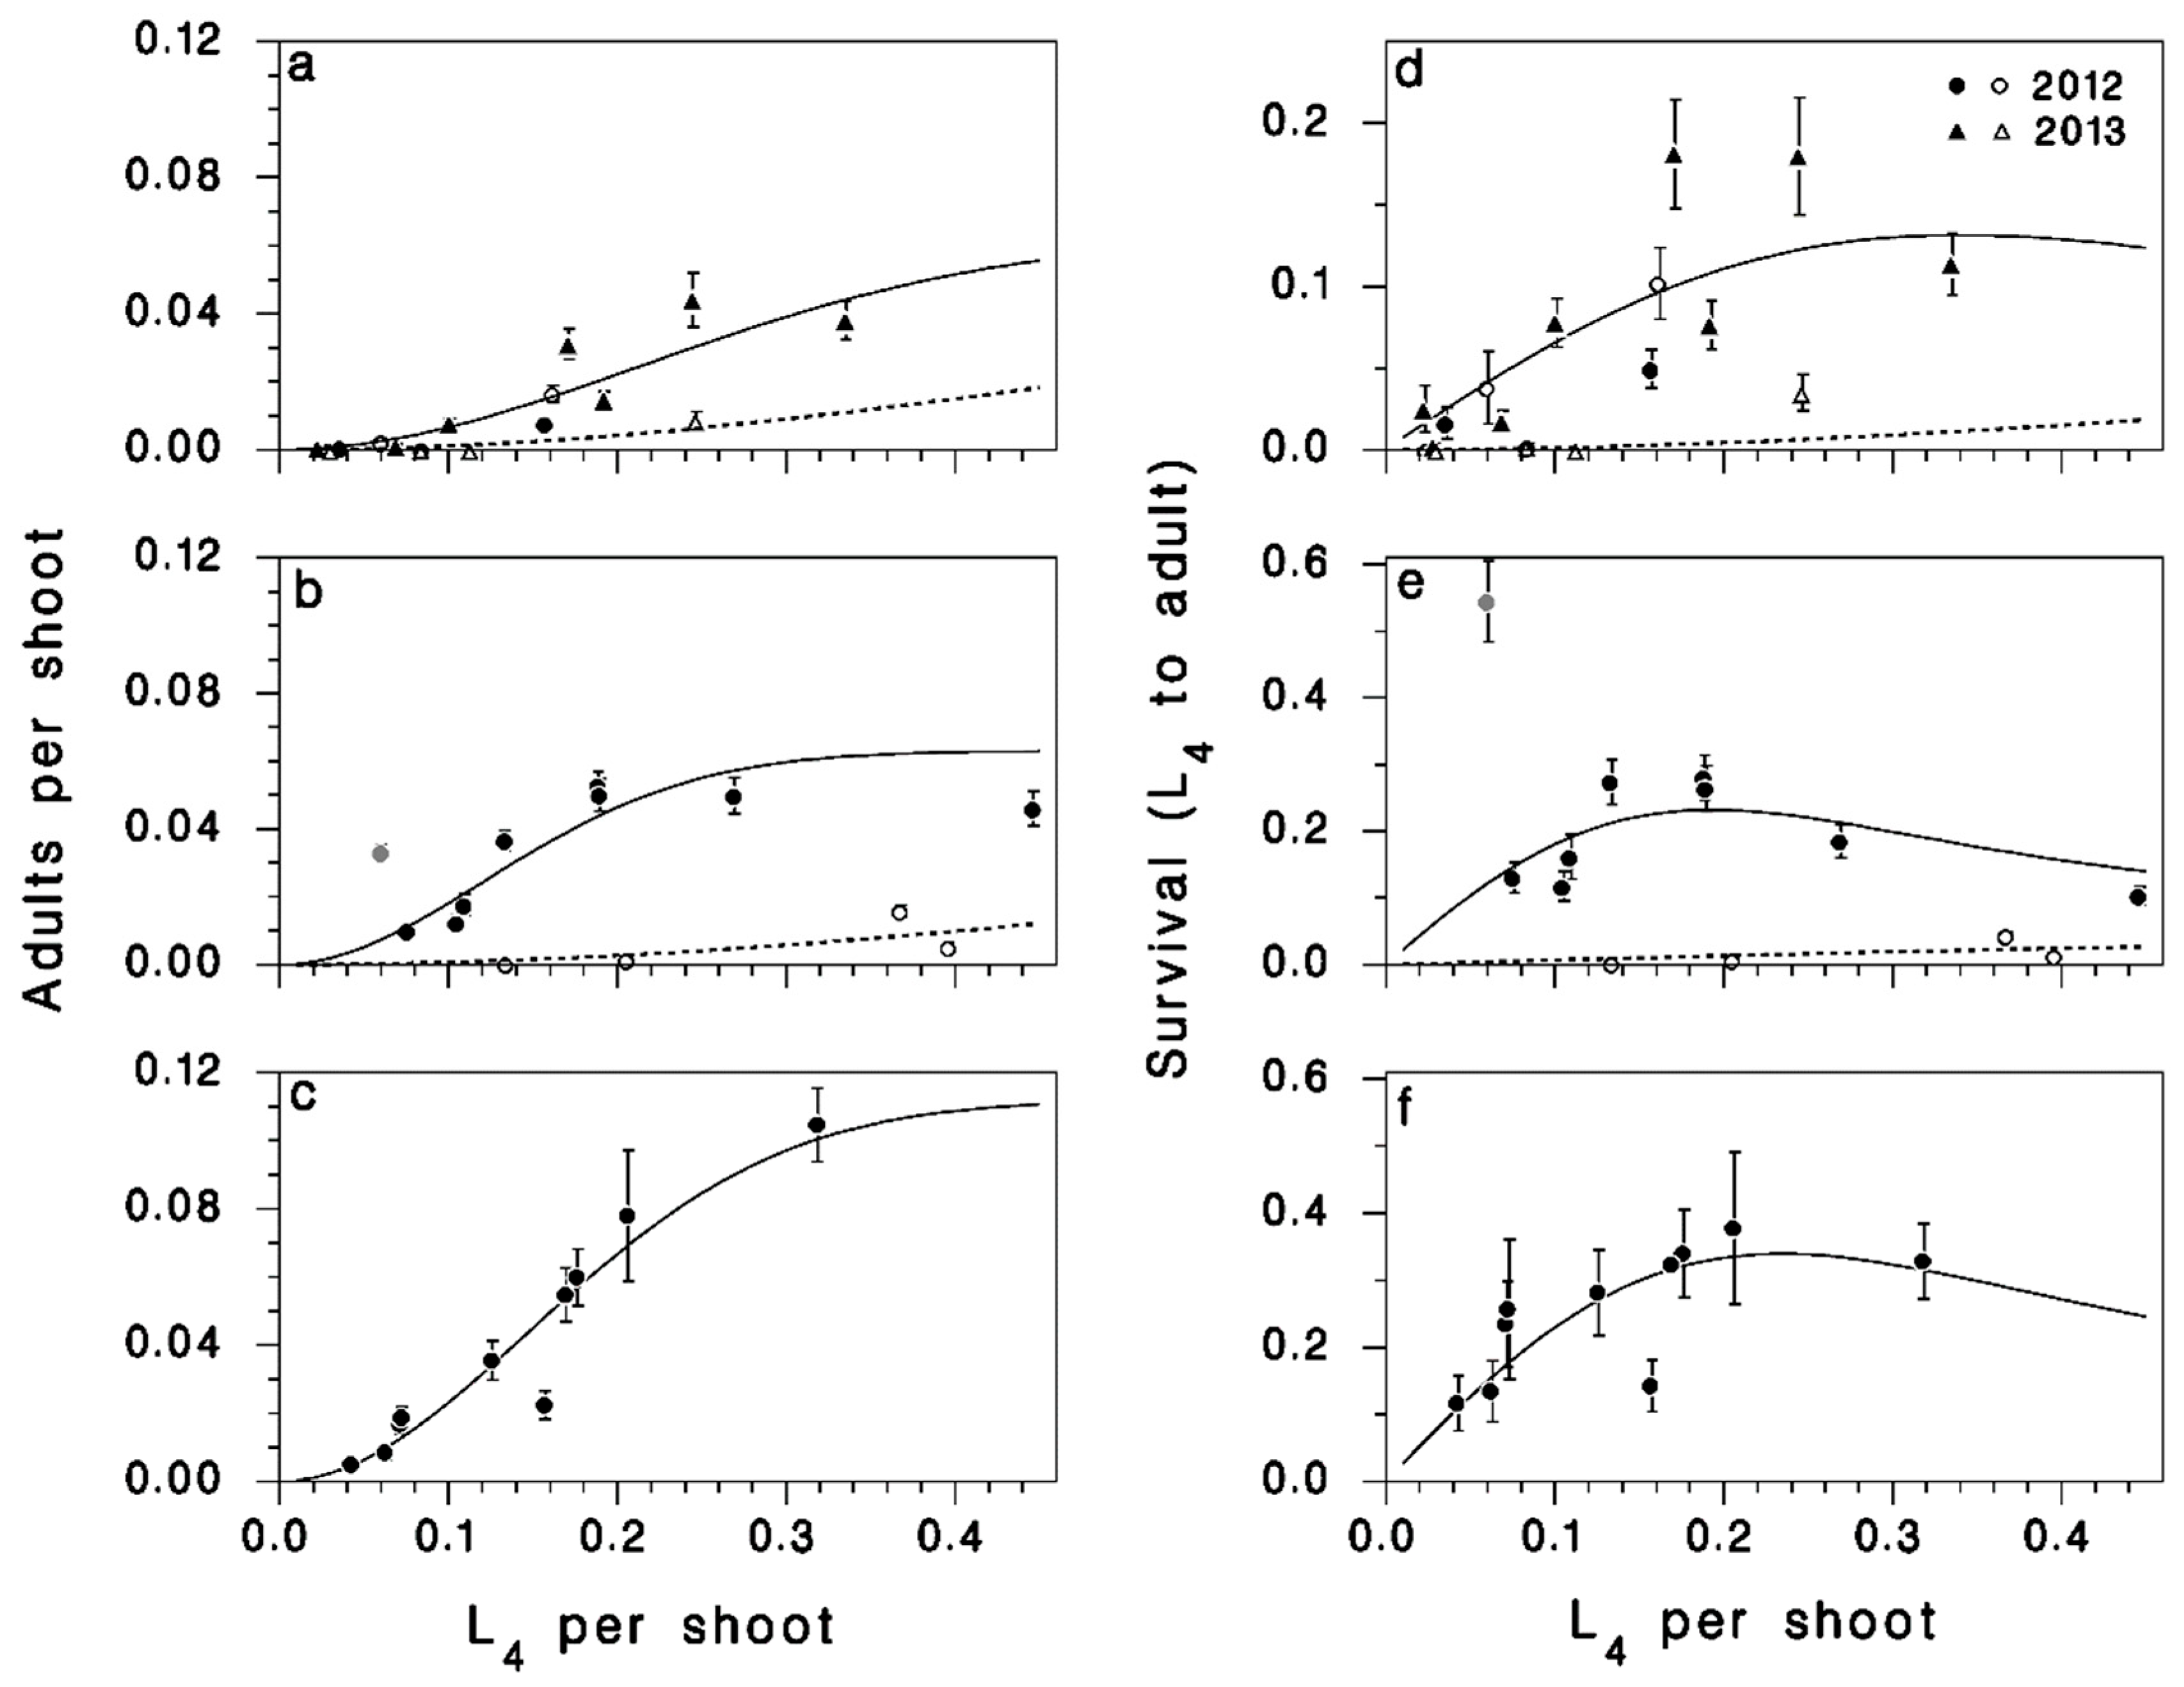
The most important result of this study is the density-dependent shape of the relationship between survival from early feeding larvae to adults S, and larval density N, well described with Equation (1) (R2 = 0.71; Table 1; Figure 3), excluding the observation from plot LSL-24, an outlier where an unexpectedly high survival to adults was observed (see Figure 3e). Two terms of this model were not significant (after stepwise reduction). In particular, there was no significant difference in survival between untreated populations in 2012 and 2013 (parameter p1|2013 not significantly different from 0, Table 1). Survival in the LSL as well as the SOPFIM untreated plots was significantly higher in 2014 than in 2012 (parameters p1|2014 and p1|SOPFIM both significantly higher than 0, Table 1).
The relationship between larval and adult density (given by the product A = N × S with S predicted by Equation (1)) is sigmoidal, with a rapidly increasing slope as larval density increases, and levelling off near 0.05 adults per shoot at larval densities exceeding 0.25–0.3 L4/shoot, suggesting increased competition for food (Figure 3a–c). Survival S followed a non-monotonic pattern of rise and decline in each dataset (compare to Figure 1, Theory 1 curve): Low survival at low density, high survival at medium density, and decreasing survival at still higher density (Figure 3d–f).
These data confirm that even in rising outbreaks, low-density incipient populations face heavy mortality. Rising spruce budworm populations that are high compared to endemic populations, but still low compared to full outbreak are still facing growth challenges due to density-dependent mortality, consistent with double-equilibrium theory (Figure 1, Theory 1) but not with oscillatory theory (Figure 1, Theory 2).
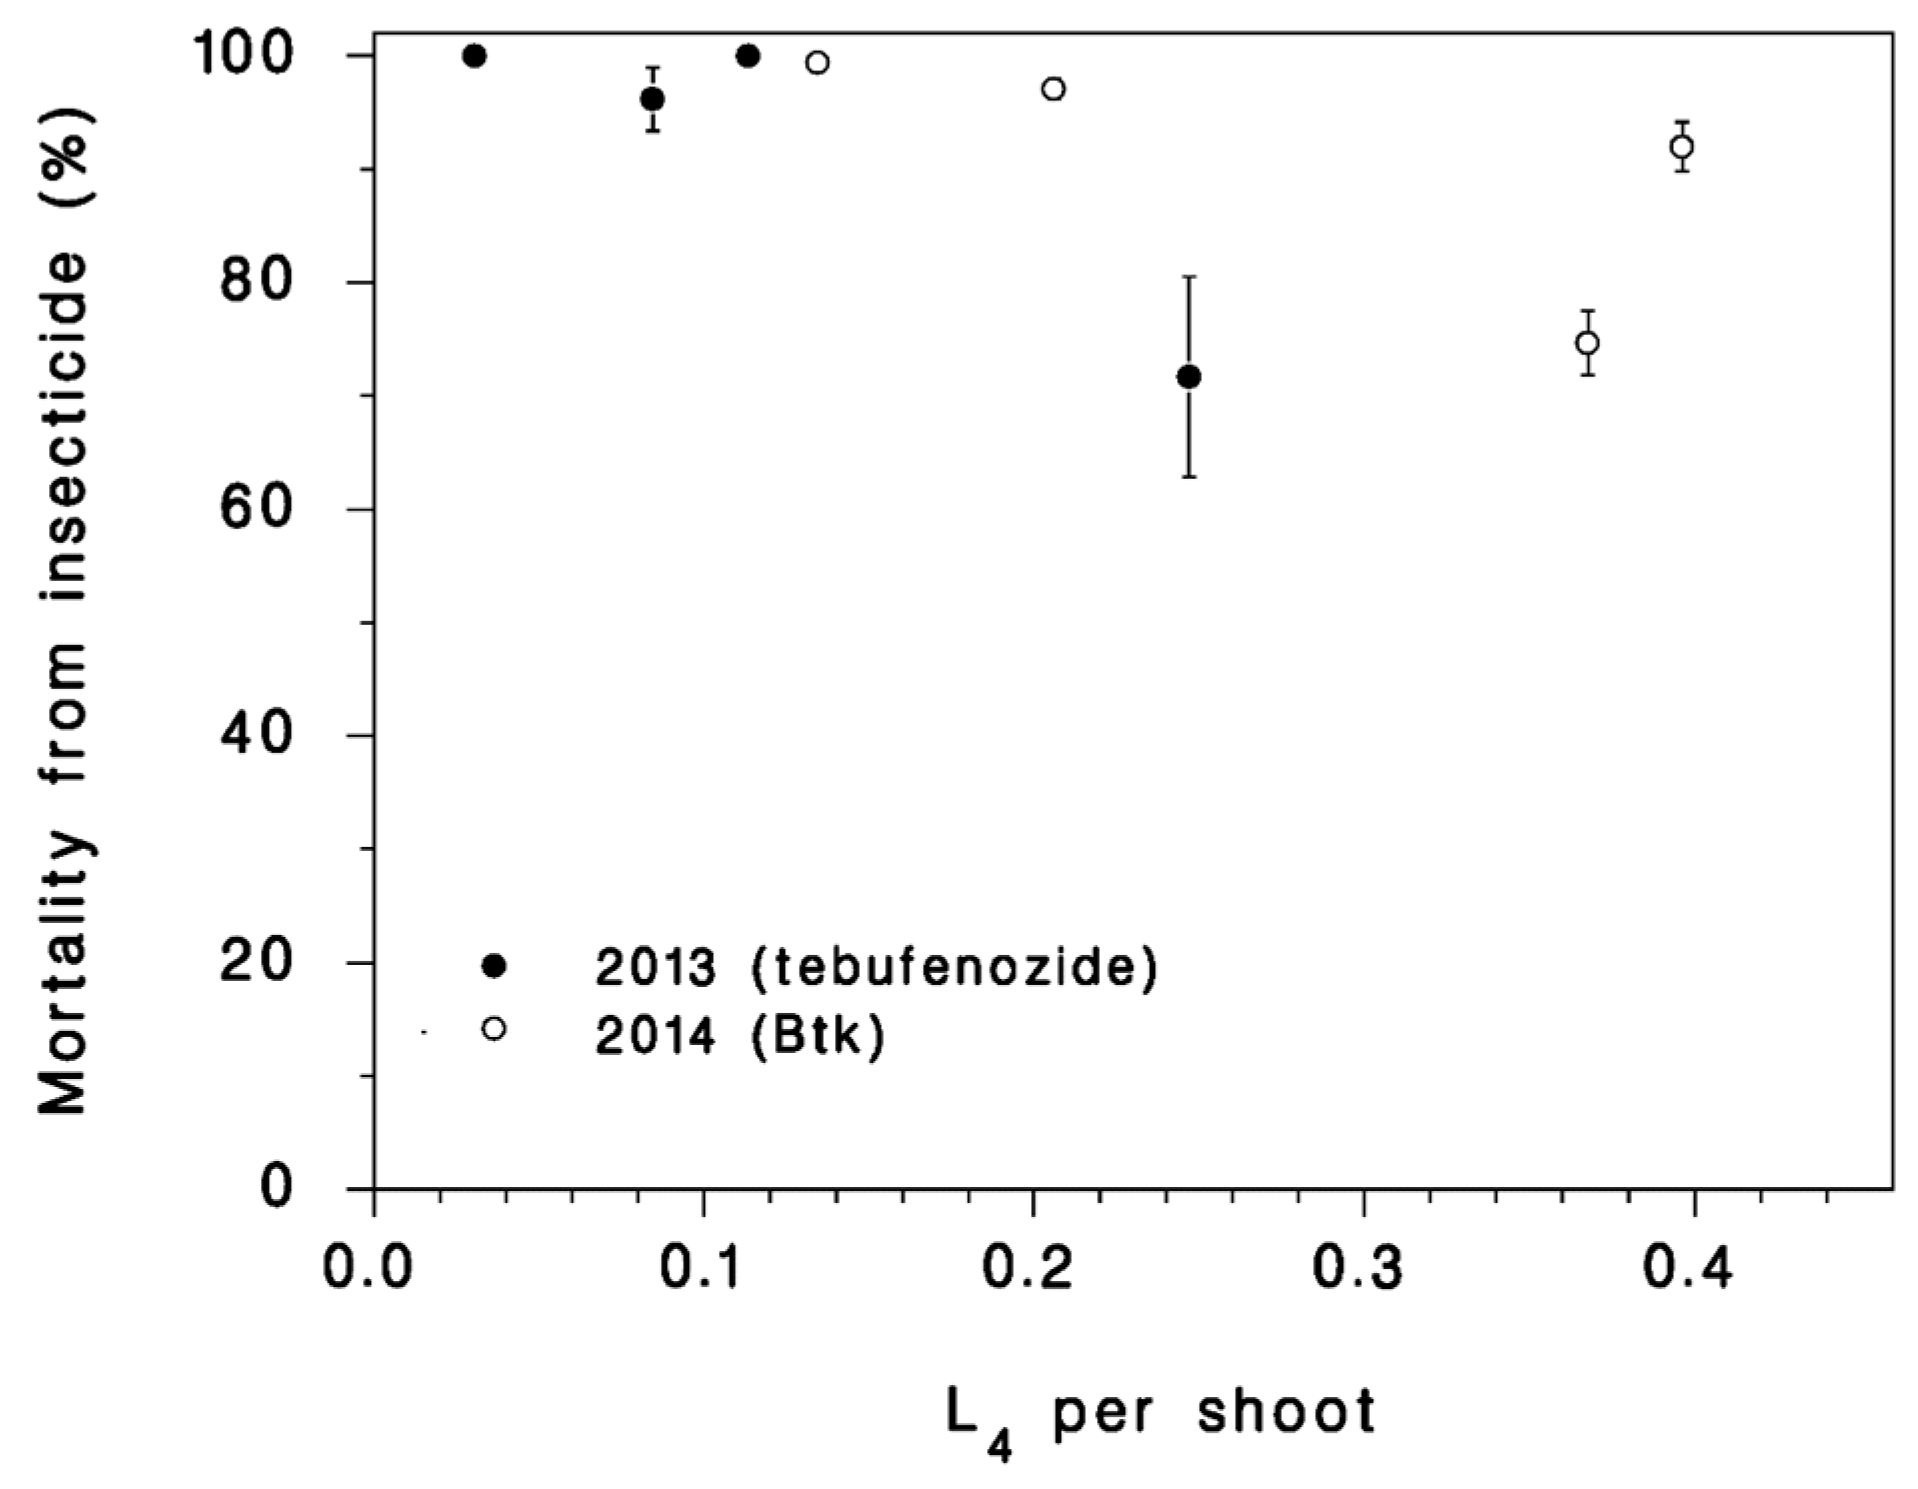
The treatment parameter p2|2012 for the effect of Btk in 2012 was not significantly different from zero (Table 1), and there was no detectable mortality attributable to Btk in 2012 (Figure 3a,d). Because deposit was not measured in 2012, there are no data to support the hypothesis that poor deposit was the cause for this poor product performance. Yet, because the application was done with a small Cessna aircraft with weak wake, it is possible that little product ended up on the target foliage. The tebufenozide applications in 2013 and the Btk applications in 2014 both generated very high mortality rates (parameters p2|3013 and p2|2014 both significantly lower than zero, Table 1; Figure 4). We estimated the mortality inflicted by the insecticide treatments π from the observed survival in treated plots S and the survival expected to occur in untreated populations at the same larval population density calculated with Equation (1), S(N):
The resulting estimates range from 70% to 100% mortality from insecticides (Figure 4). It is interesting that mortality attributable to insecticides was higher in lower density populations both in 2013 and in 2014, despite the fact that two products with very different modes of action were used. This could very well be an indication of compensation (see [5]): Some of the mortality due to competition was relaxed by the insecticide applications.
3.2. Defoliation
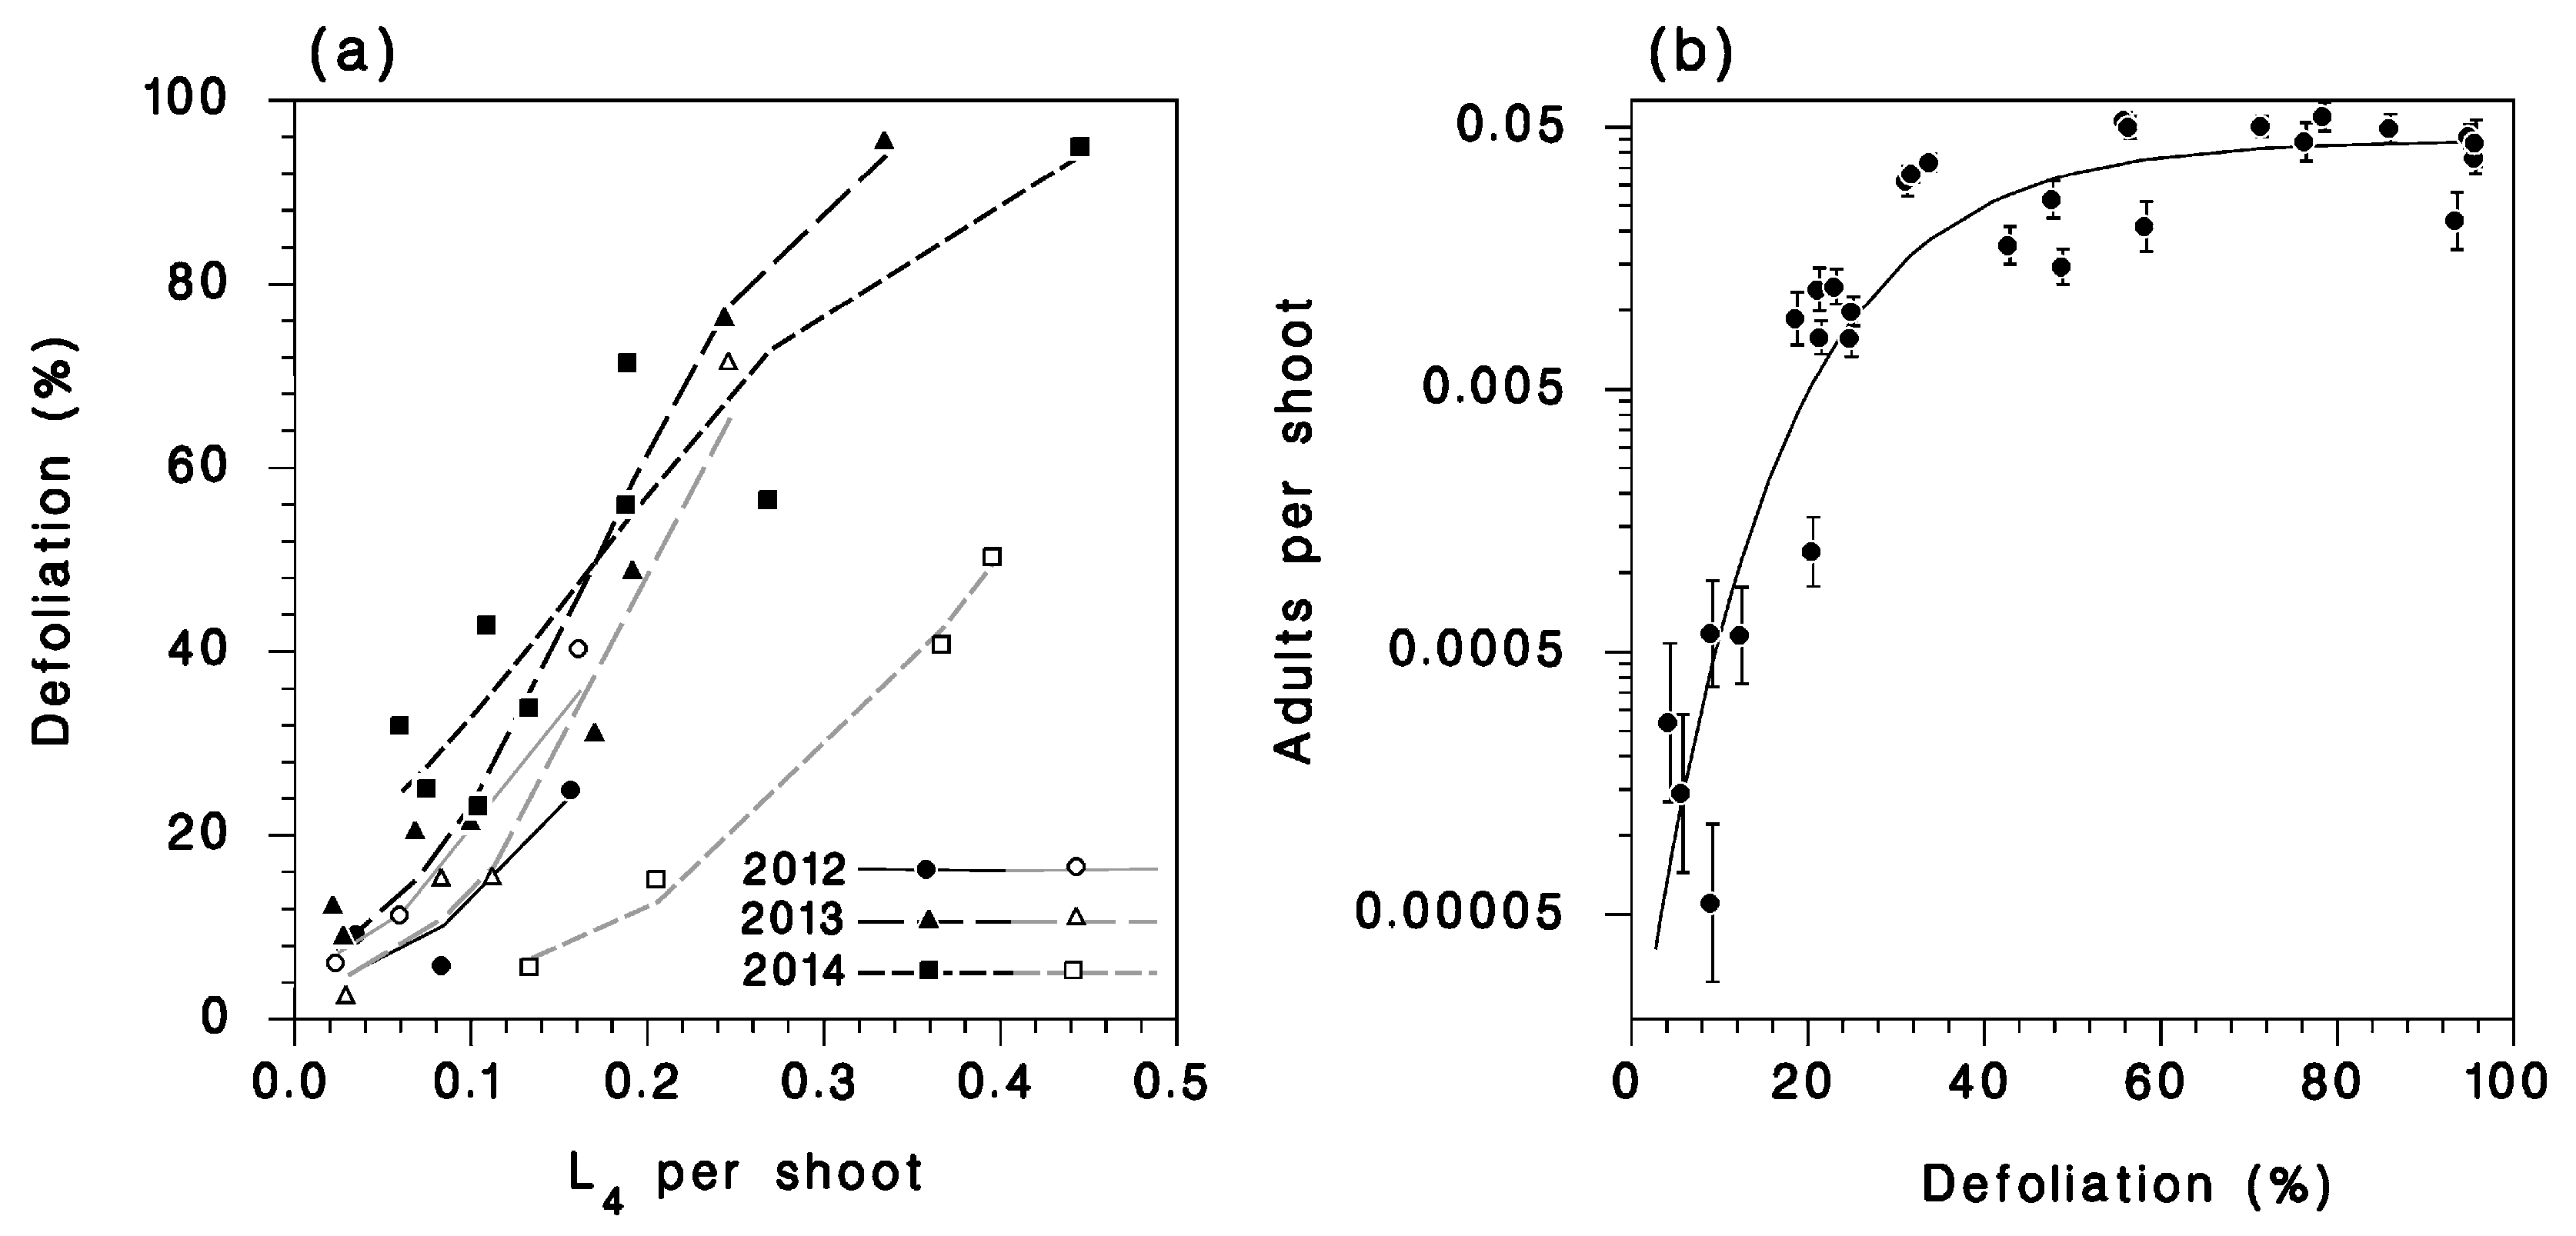
The relationship between defoliation and larval population density (at the L4) varied by year and insecticide treatment (Table 2; Figure 5). From other sources, one would expect a saturating shape with a monotonically-declining slope [22]. High natural mortality rates in lower density rising populations are probably responsible for the sigmoid shape of this relationship, depressing defoliation at lower densities. Among untreated populations, defoliation increased significantly from year to year at lower population densities, reflecting the increasing survival trend noted in the previous section. The Btk applications of 2012 had no effect on defoliation. The tebufenozide treatment in 2013 produced a significant but modest reduction in defoliation (dotted line in Figure 5a). In 2014, the Btk applications had a very pronounced effect on defoliation (bold dotted line in Figure 5a). We suspect that the limited impact of tebufenozide on defoliation in 2013 was caused by the late application (5th instar) compared to the 4th instar application of Btk in 2014.
There was a strong relationship between emerging adult density at the end of the season and the defoliation inflicted by the larval populations in untreated plots (Figure 5b). This relationship suggests that adult density is limited by competition for food, and that this competition reduces survival once defoliation exceeds 40%, corresponding to larval populations of 0.2 L4 per shoot.
3.3. Survival in Rearing
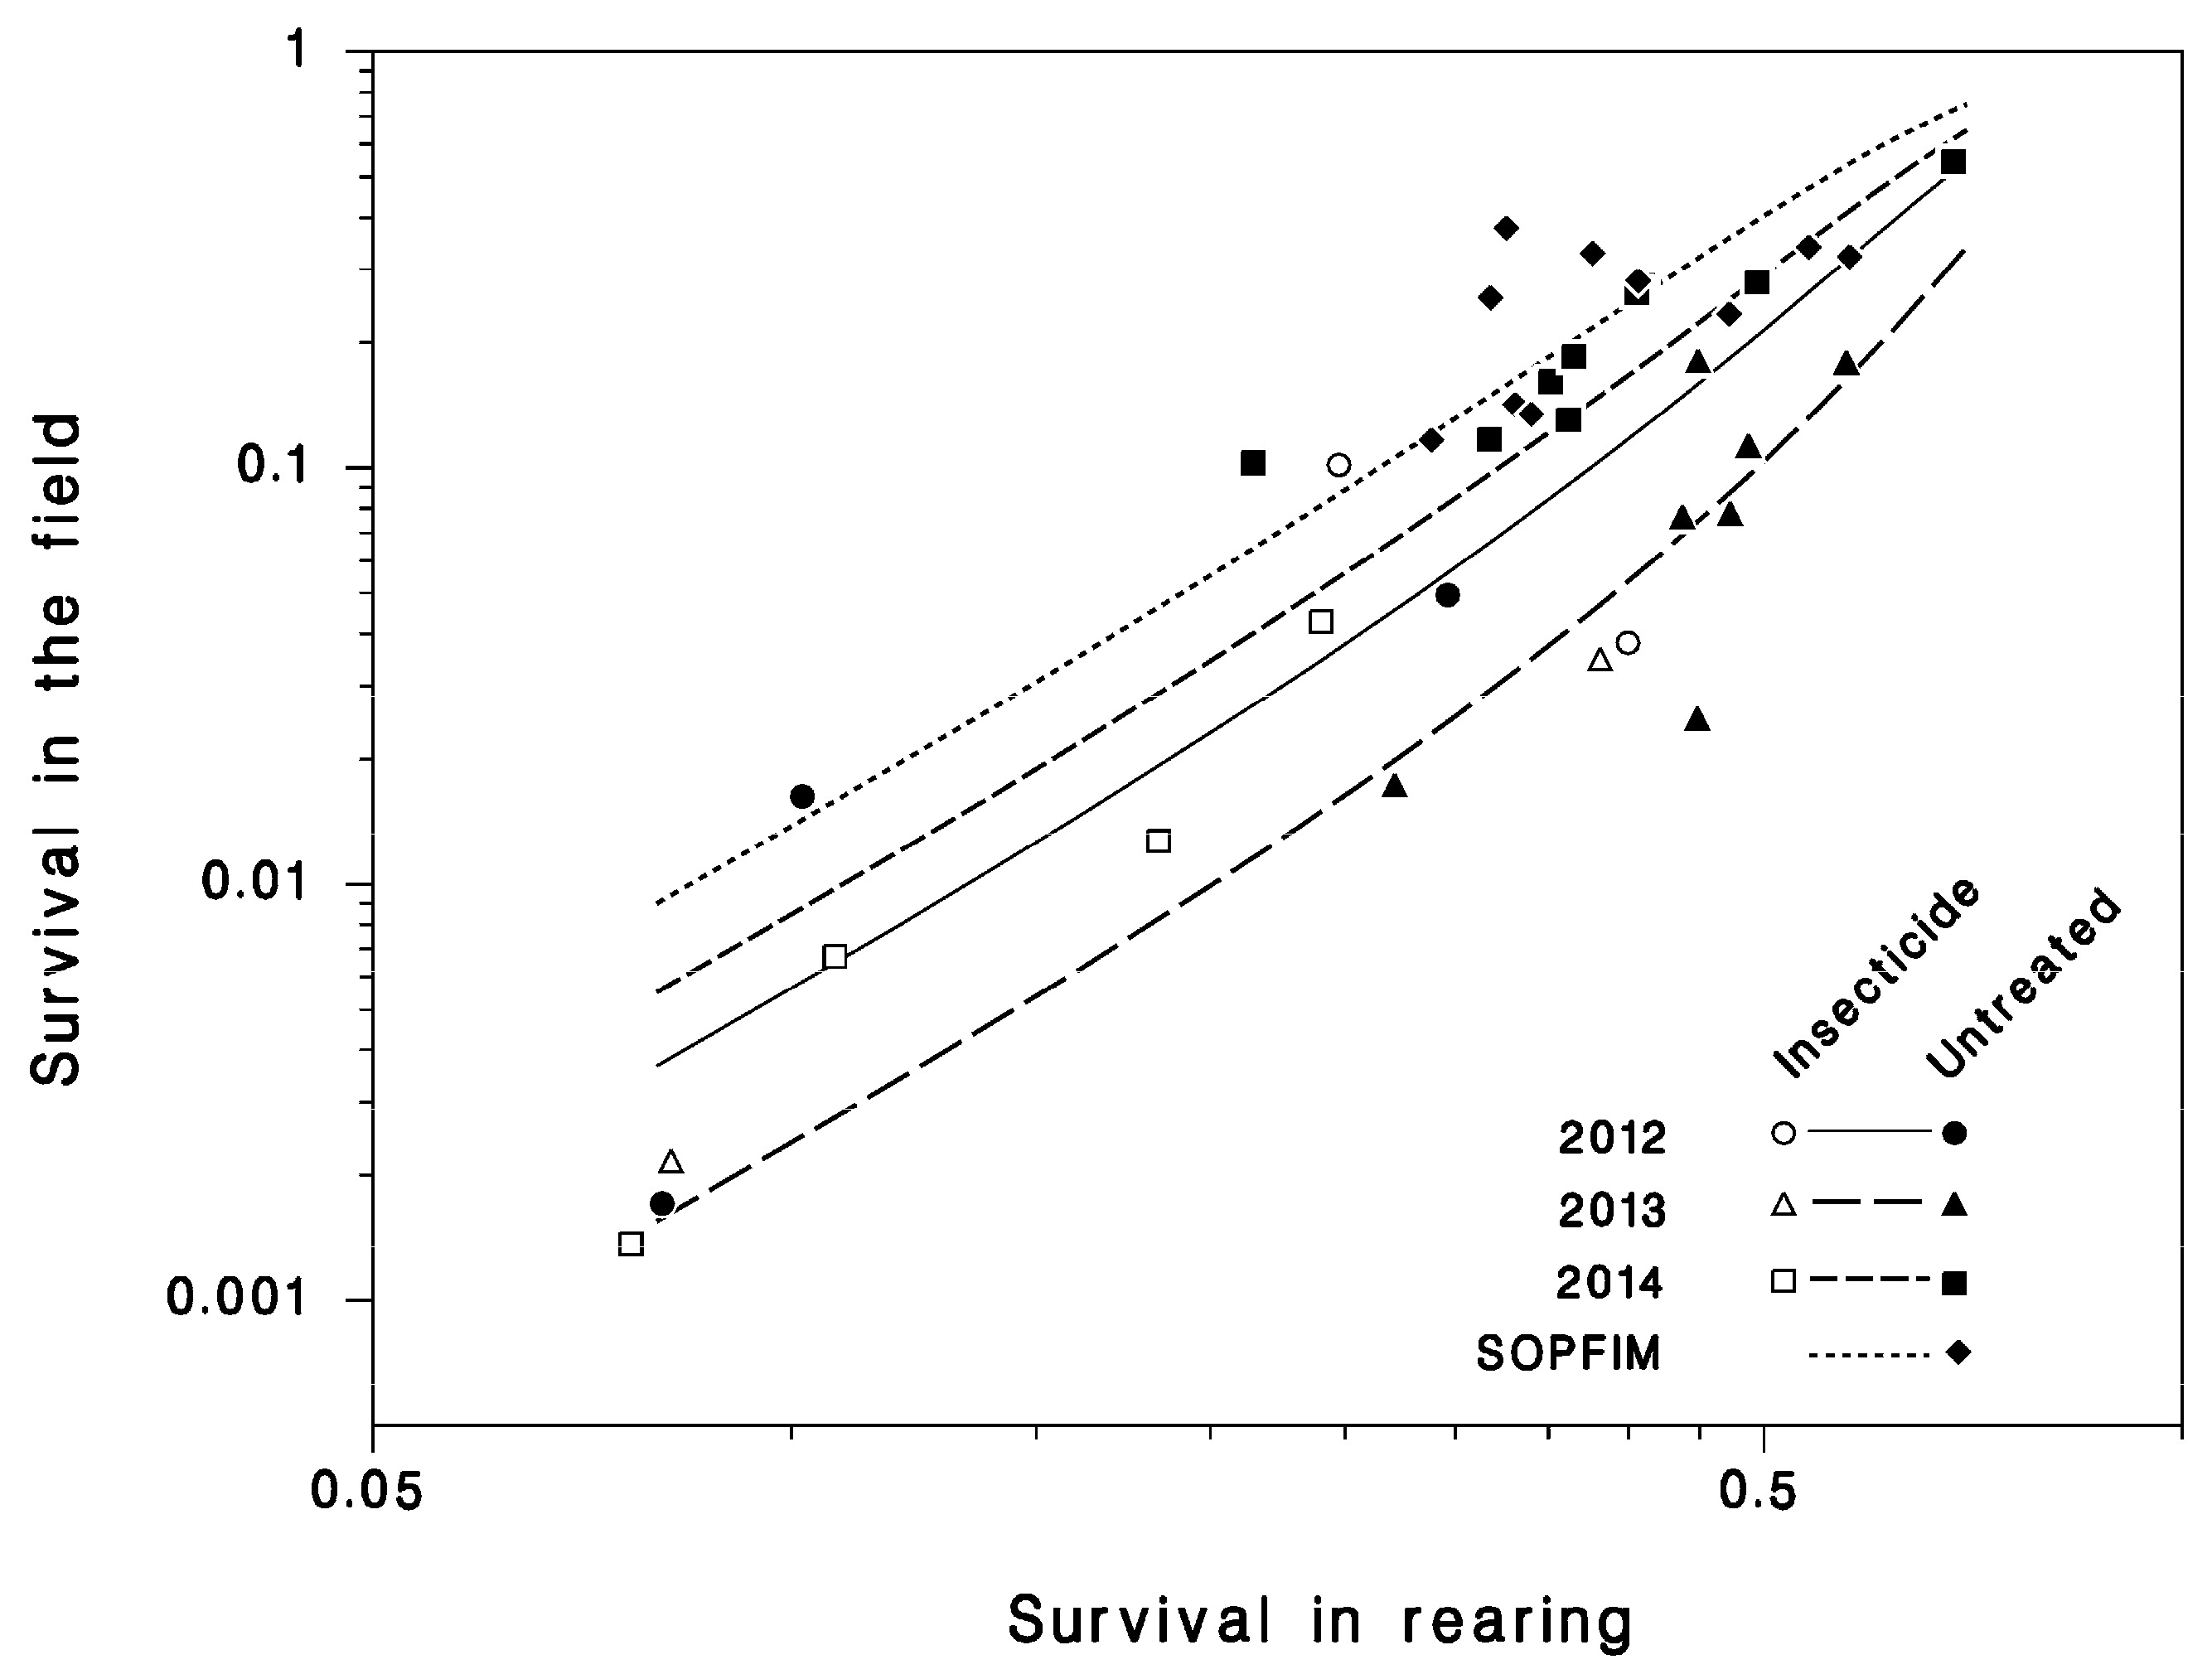
There was strong and significant relationship between survival in rearing SR (defined by Equation (3)) and field survival S from L4 to adult, well described by Equation (4) (R2 = 0.83; Table 3; Figure 6). This relationship varied slightly from year to year but was unaffected by insecticide applications. Thus, rearing survival reflects field survival, although field survival varied over a much wider range than did rearing survival. The analysis of the contributions of various parasitoid species to mortality in rearing is beyond the scope of this paper, and will be addressed in a subsequent contribution.
3.4. Recruitment to the Egg Stage
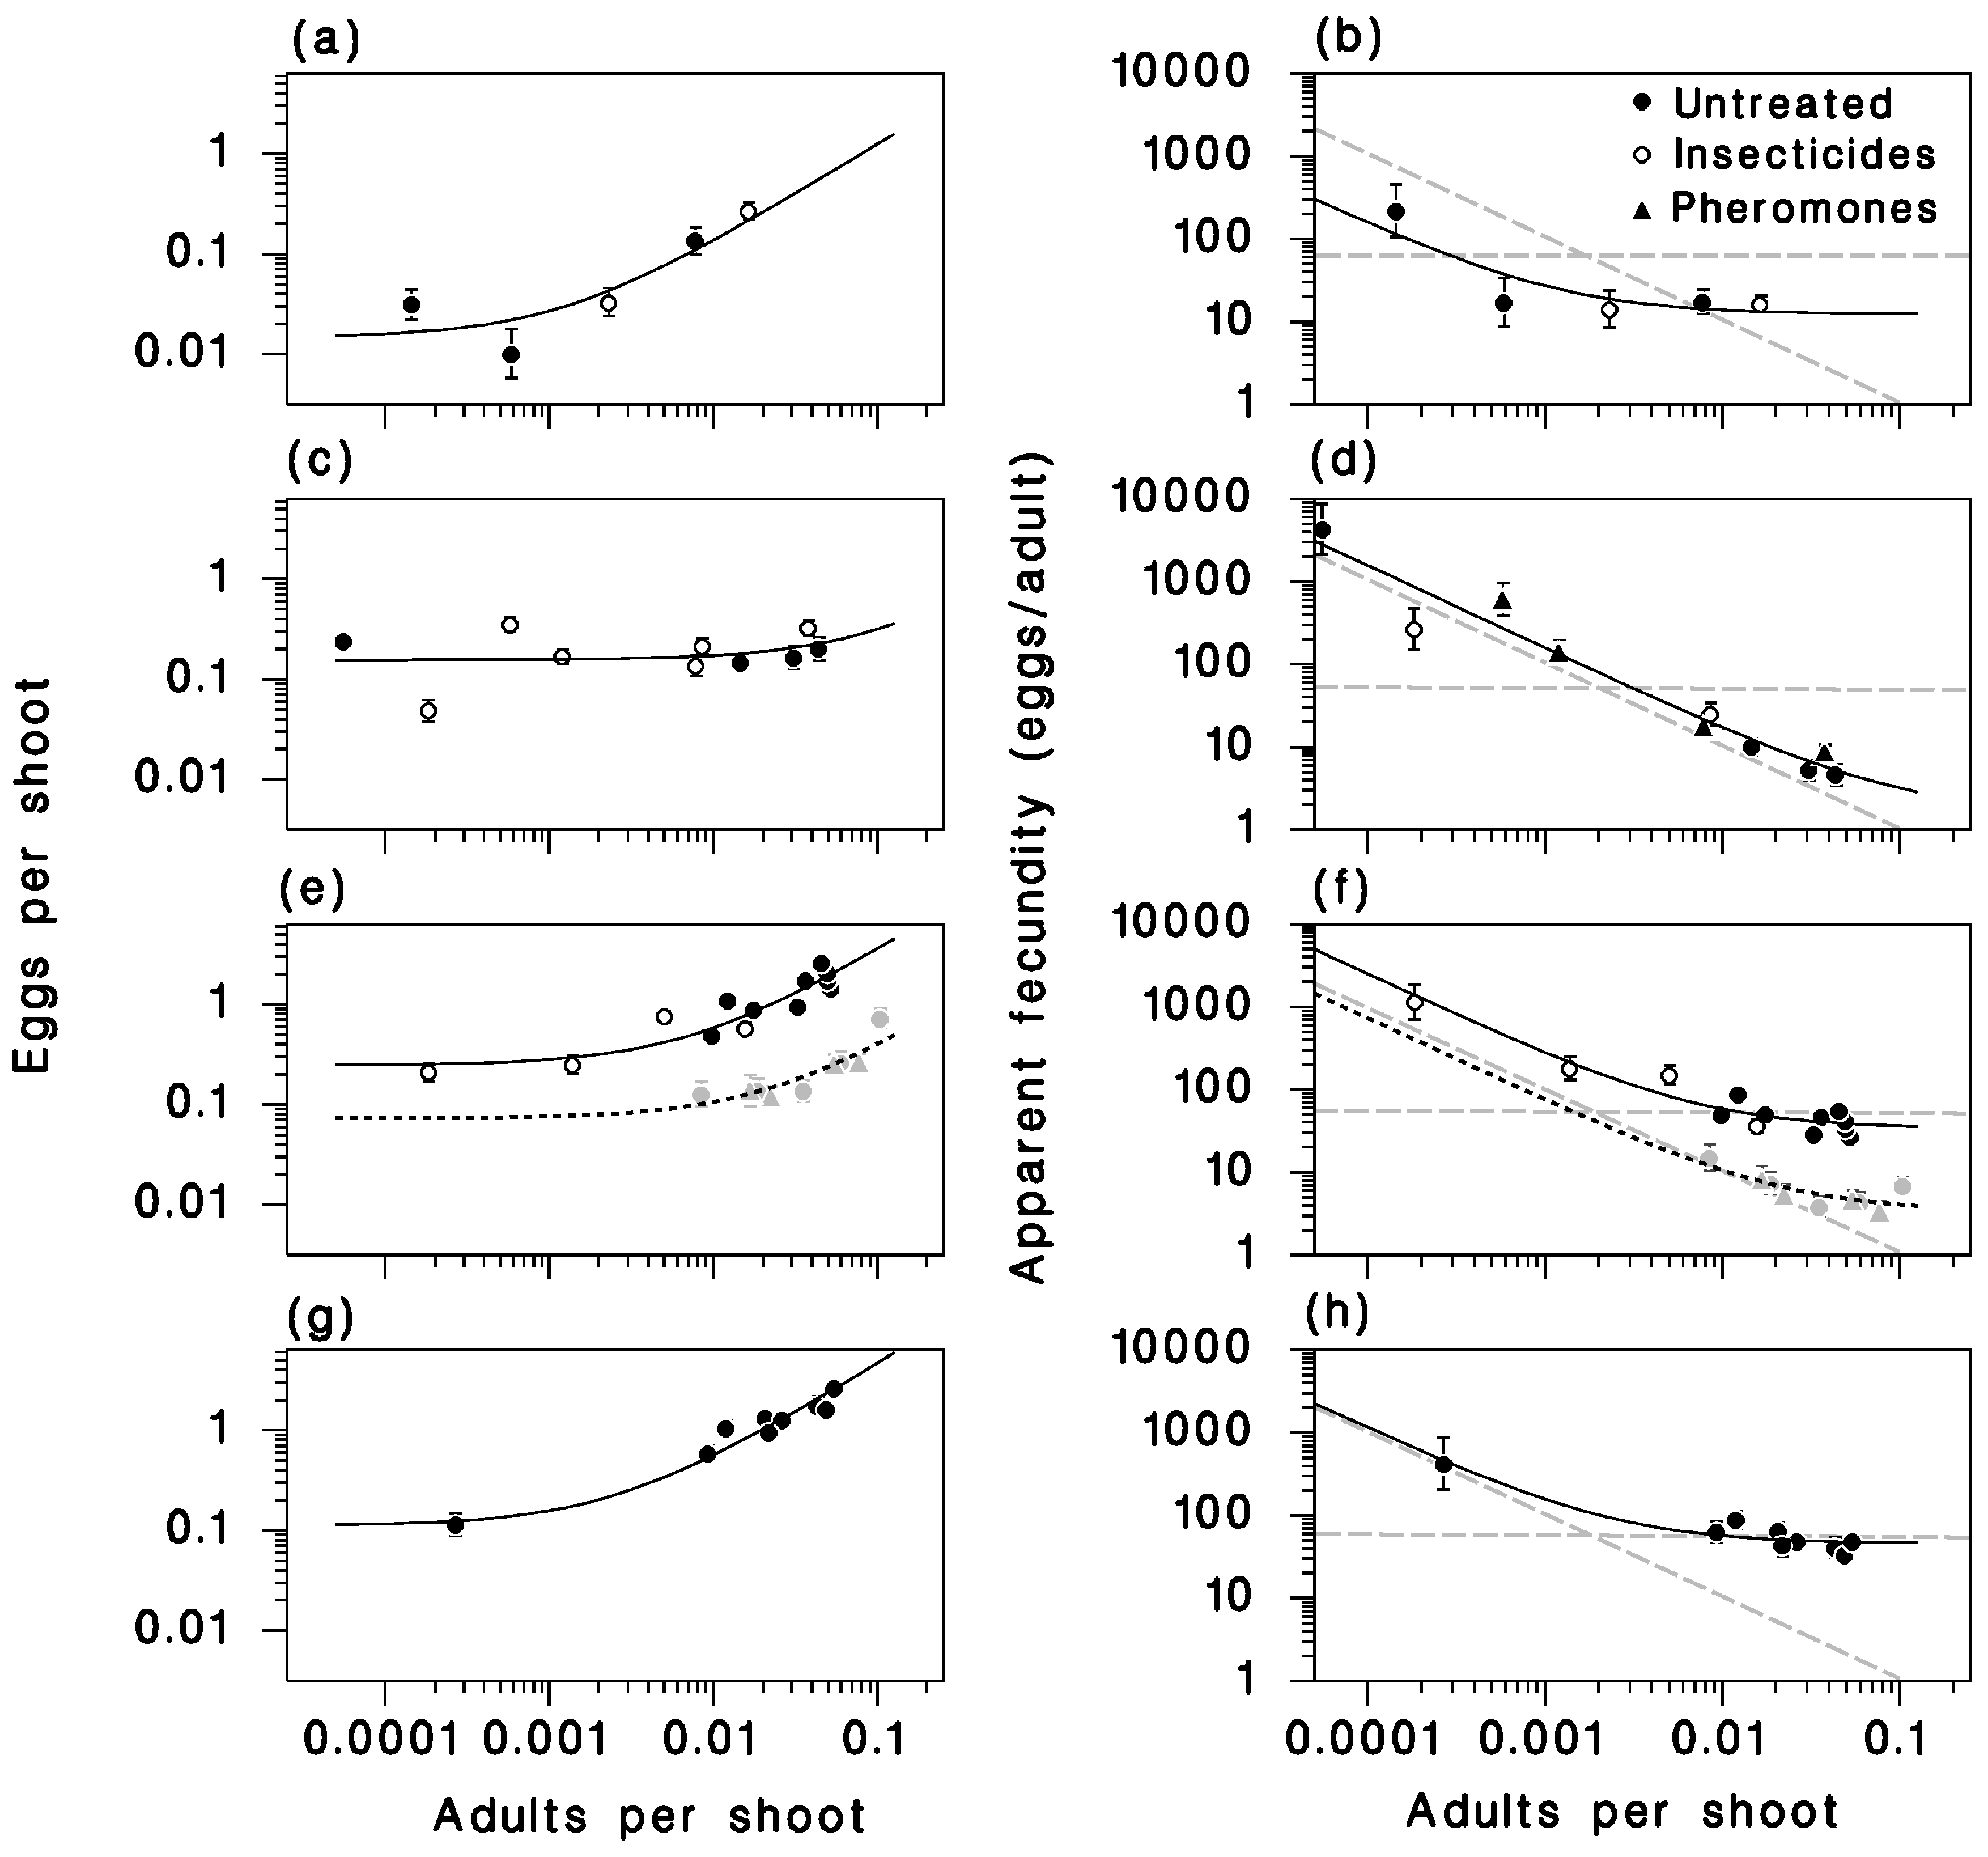
There was a clear relationship between egg and surviving adult density in each year (or dataset) except 2013. This relationship was very well described by Equation (5), fitted by non-linear regression (R2 = 0.92) (Table 4; Figure 7). The intercept parameter I, representing the immigration rate (eggs/shoot), varied between 0.015 ± 0.006 in 2012 to 0.248 ± 0.072 eggs per shoot in 2014, and was always significantly different from zero implying that there was always detectable immigration in those sites. The realized fecundity parameter F ranged from 1.61 ± 1.61 in 2013 (not significantly different from 0), and 45.7 ± 7.7 in 2015, a level of variation that indicates a wide range of emigration rates from year to year.
In 2012, when the developing outbreak in the LSL was just beginning and populations were generally low in the region, the immigration rate and the realized fecundity of resident moths (parameters I and F of Equation (5)) were low (Figure 7a). As a result, the relationship between apparent fecundity and resident adult density had a slope near 0, an indication of limited migration activity (Figure 7b) (see [20] for a thorough discussion of this topic). The same was true in 2014 among SOPFIM sites (Figure 7e,f). Although we suspect the resident adult density in the SOPFIM sites was overestimated in 2014 due to an early pupal sample (as evidenced by the high upper asymptote of adult density in Figure 3c), these parameter values suggest net emigration of gravid females with little immigration, but may also have been the result of low mating success [15]. The exact contribution of those factors to the low reproduction in 2012 and again in 2014 among SOPFIM sites is not clear, but we speculate that intensive emigration with little immigration is the most likely explanation. Those populations were located at the edge of the developing outbreak in the corresponding years. In both situations, spruce budworm populations were sparse in the study area and sources of regional immigrants would have been few or distant.
This is in sharp contrast with 2013, when there was no significant relationship between egg and resident adult density (Figure 7c). In that year, the realized fecundity of moths (F2013) was so low that it was not significantly different from zero, which suggests that many moths emigrated before laying eggs. While this is biologically unlikely, it does indicate that 2013 was a particularly intensive migration year (high immigration, low realized fecundity of resident moths). As a result, the slope of the relationship between apparent fecundity and resident moth density in 2013 was very near the extreme of −1 (Figure 7d), which is a telltale sign of regionally random redistribution of eggs through extensive migration of ovipositing female moths (defined as panmixis and explained in detail in [20]). In 2014, the immigration rate was highest among the LSL sites (I2013 = 0.25 ± 0.07 eggs per shoot), and realized fecundity was high (F2013 = 33.8 ± 9.4 eggs per moth) (Figure 7e). In 2015, realized fecundity of resident moths was high (F2015 = 45.7 ± 7.7 eggs per moth), and immigration rate was near average (I2015 = 0.112 ± 0.05 eggs per shoot), suggesting a year with low migration activity (Figure 7g). Because of the relatively high adult populations in the LSL in both 2014 and 2015, the slopes of the apparent fecundity relationships with resident adult density was closer to 0 than in 2013, which indicates that those were not years of extensive moth migration (Figure 7f,h).
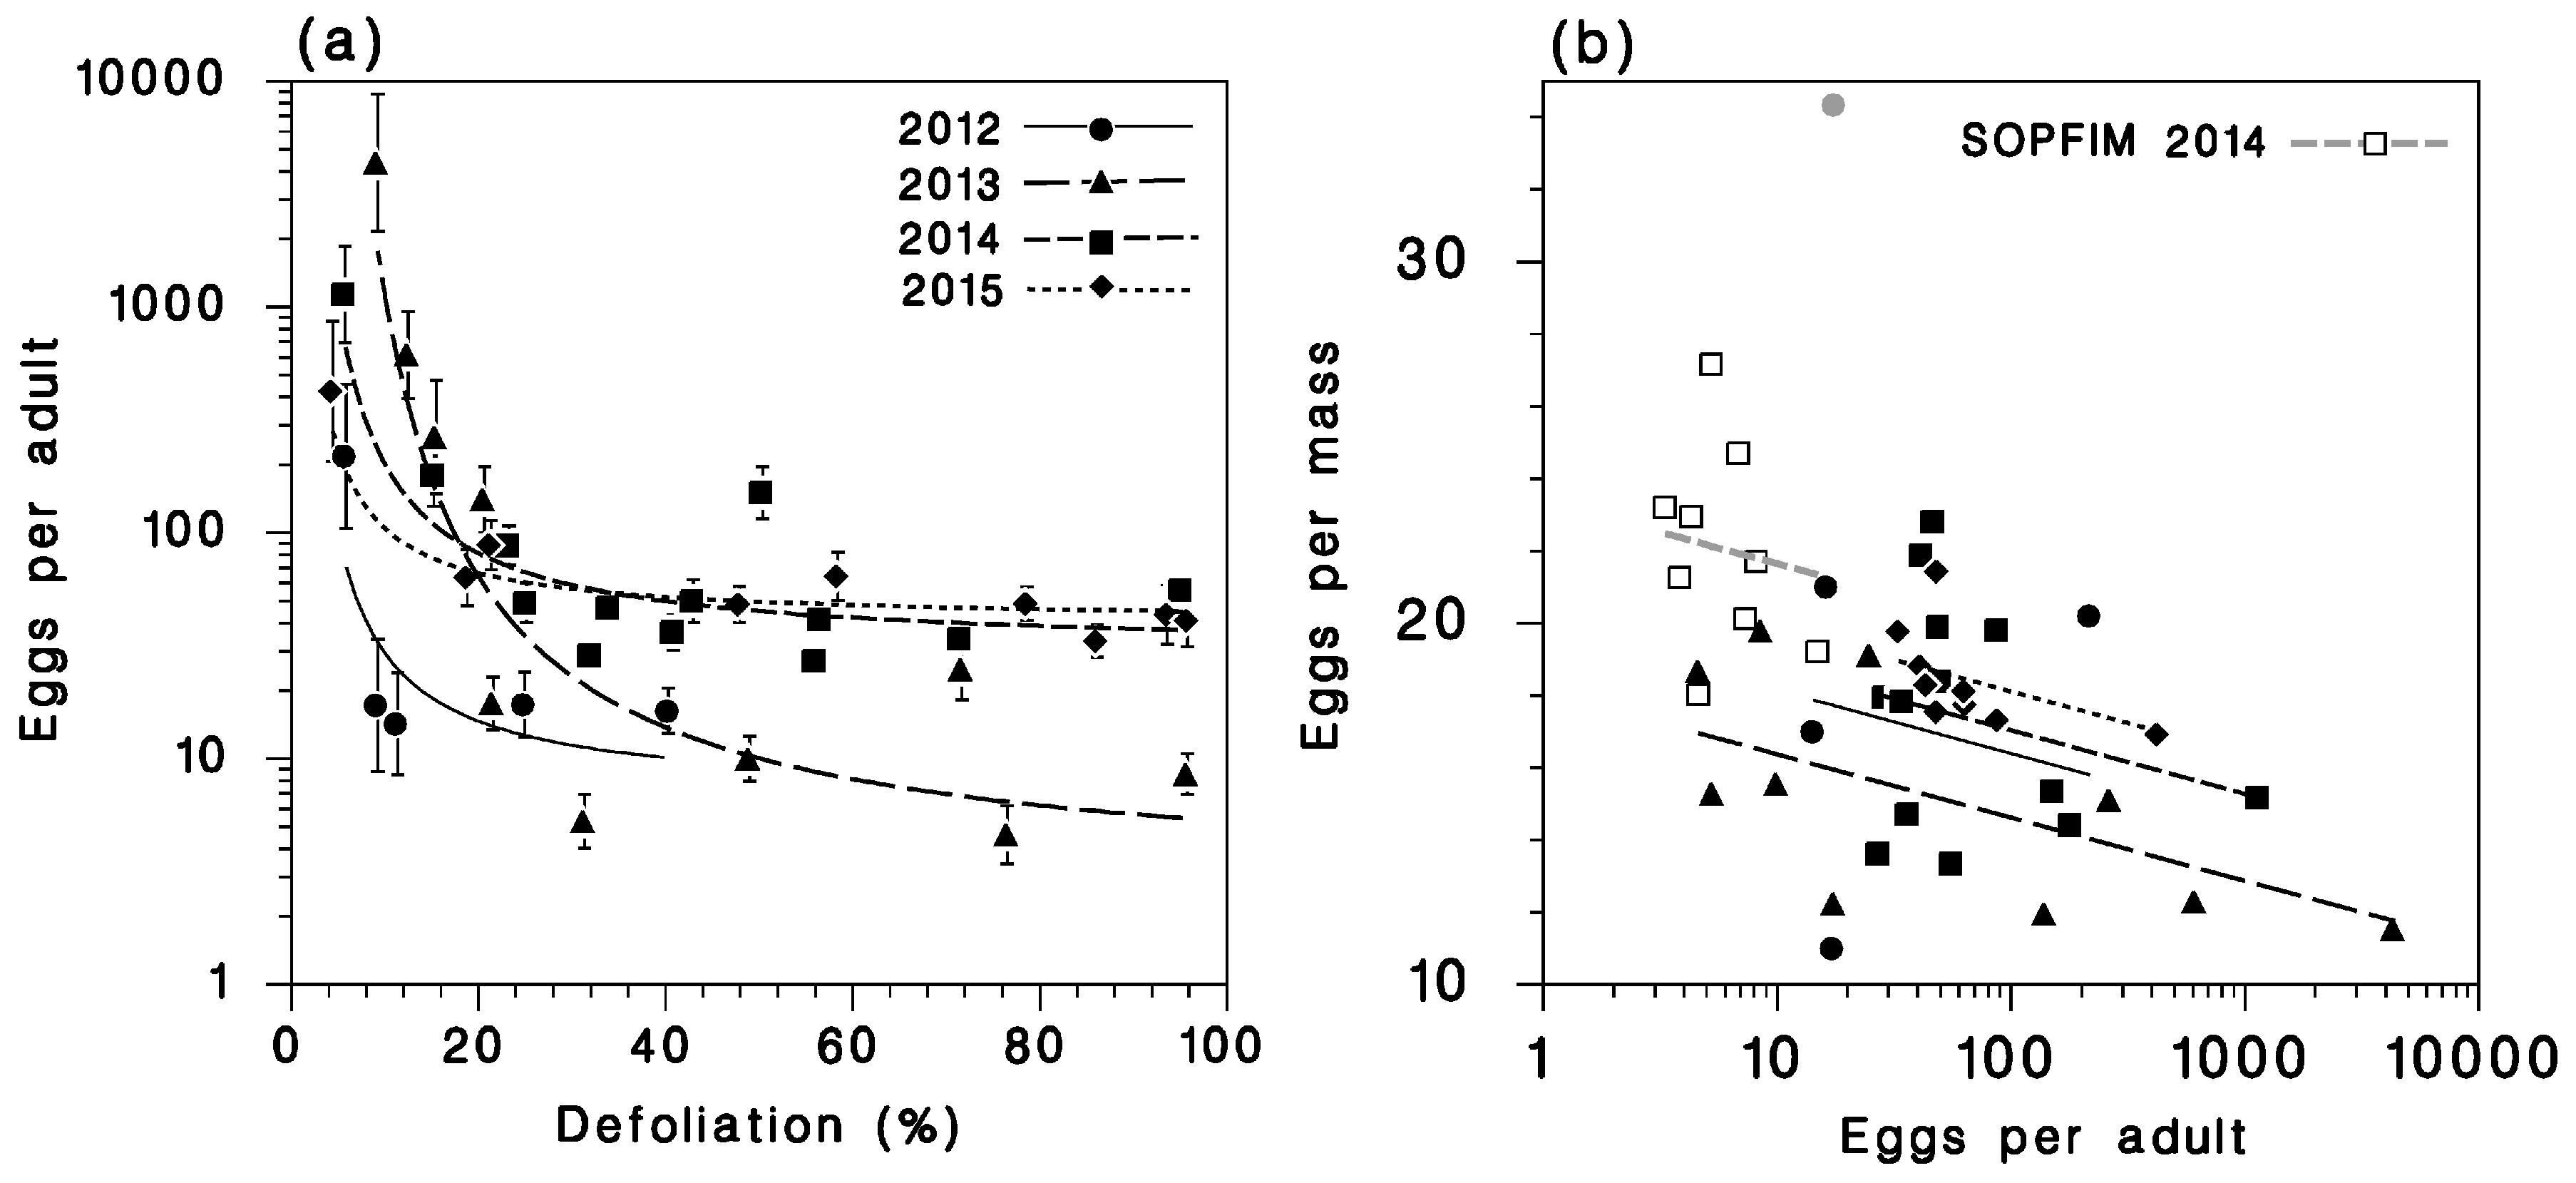
The relationship between apparent fecundity and current-year defoliation was highly significant (Table 5) and was well described by Equation (7) (Figure 8a). Its slope and intercept varied between years (datasets), but generally apparent fecundity dropped to its minimum at defoliation in the range of 20%–30%. This pattern supports the hypothesis that spruce budworm females tend to emigrate from defoliated stands, and that they can sense a fairly low amount of defoliation.
Additional support for this hypothesis comes from the significant reduction of egg mass size in populations with clear net immigration, as represented by Equation (8) (Table 6, Figure 8b). While egg mass size variability was very high (due in large part to small sample sizes), the relationship explained 47% of this variation. The mechanism for this relationship seems simple: Immigrant moths are often mostly “spent” (have few eggs left in their oviducts), and there is a strong correlation between egg mass size and remaining fecundity in spruce budworm [21]. Thus, small egg masses indicate oviposition by immigrants, while large egg masses indicate oviposition by residents.
3.5. Annual Population Growth Rate
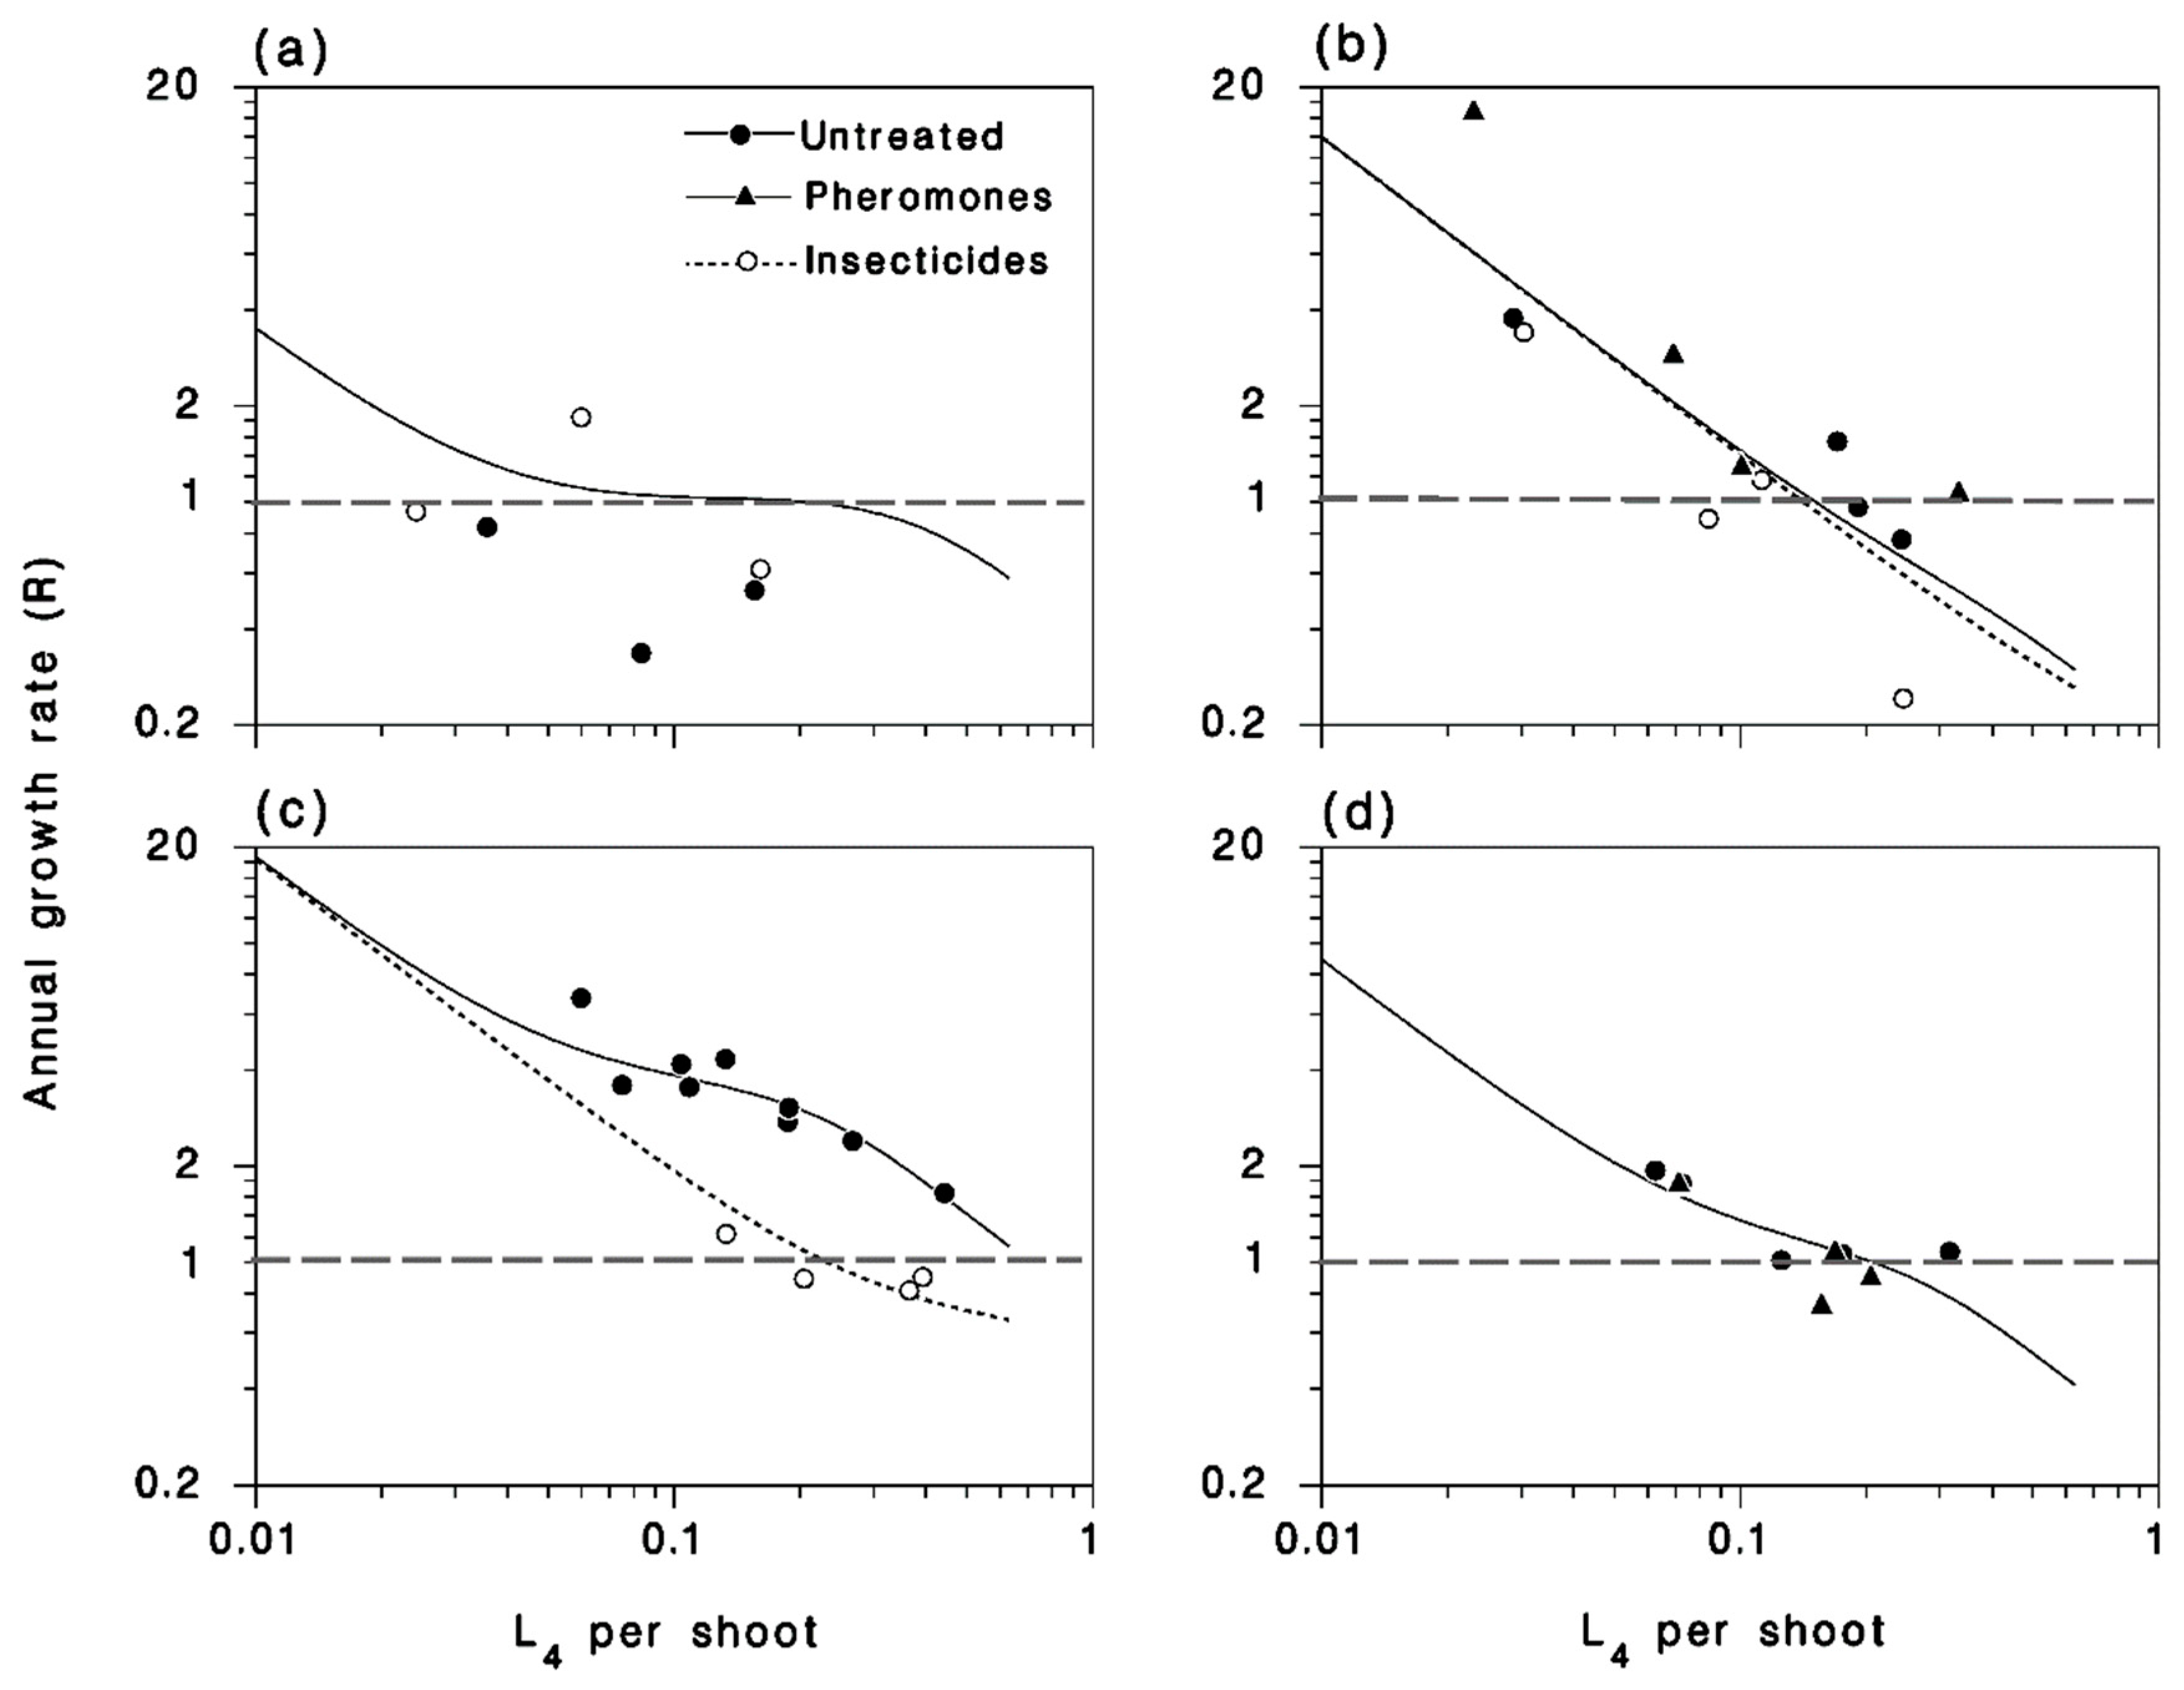
Population growth rates in 2012 were near the replacement line (R = 1), and were not clearly affected by applications of Btk (Figure 9a). In 2013, population growth rates were very high in low density populations, and well below replacement in higher density sites. Although the tebufenozide applications of 2013 were highly efficacious, they did not result in a clear reduction of population growth rates (Figure 9b). Moth migration activity was extremely pronounced in 2013, blending populations over the entire study area. In 2014, among the 13 LSL sites, annual growth rates were very high in untreated populations, and at or below replacement in sites treated with Btk (Figure 9c). Among the 10 SOPFIM sites in 2014, located at the western periphery of the expanding outbreak of the LSL, growth rates were close to replacement, and had a very similar density dependence to that observed in 2012 in the LSL (Figure 9d). Clearly, insecticide applications can have a strong impact on population growth rates, but not in years when extensive moth dispersal occurs, such as in 2013 in the LSL region.
4. Discussion
The non-monotonic density-dependent pattern of survival during the feeding larval and pupal stages of spruce budworm observed in this study (Figure 3) indicates that early outbreak populations are subject to a demographic Allee threshold (Figure 1, Theory 1), and are not increasing from endemic density because of high survival rates, as the oscillatory theory would predict (Figure 1, Theory 2). This suggests either a multiple equilibrium system (with an unobserved endemic equilibrium and a crowding-related upper equilibrium), or a system with a single outbreak equilibrium and an Allee threshold, where low-density populations actually go locally extinct unless supplemented by immigration, a possibility that was discussed by other workers [23]. In the short three-years of this study, we noted a general increase in survival in the third year (2014). We cannot determine whether this was part of a trend, or if it was simple annual variation in the impact of various mortality factors. However, this increase was not accompanied by lower mortality in rearing (Figure 6) and so was probably not linked to a change in the impact of parasitoids. However, other natural enemies such as predators, could have been involved.
It therefore appears that endemic spruce budworm populations are kept in check by generalist parasitoids. Contrary to Theory 2 (Figure 1), our observations do not support the idea of a gradual relaxation of their impact over time, and thus populations do not rise after a gradual drop of mortality from natural enemies (JR, unpublished data; this study; [24]). But if budworm outbreaks do not occur as a result of a cyclical (regular) change in the impact of natural enemies, but rather in response to a sudden change in survival or apparent fecundity that shifts populations beyond the Allee threshold, how can a more-or-less regular outbreak cycle materialize? We do not have an answer to this question. Fluctuations in the impact of natural enemies may be involved under some circumstances, but not generally [24]. It is possible that the likelihood of such a sudden shift in survival increases over time as forest stands recovering from a previous outbreak age and host-tree masting becomes more prevalent over a landscape [25]; masting events occur synchronously over rather large areas. Survival of spruce budworm larvae is known to be favored when balsam fir produces large cone crops [26,27]. This bottom-up effect may be sufficient to generate initial epicenters on its own. It is also possible that improved survival over large areas also increases the density of migrating moths being concentrated by convergent airflow, and landing in sufficiently large numbers in particular areas of the landscape such as deep valleys [28]. This would lead to highly patterned spatial distributions of epicenters [4]. Once these initial outbreak epicenters appear in the landscape, they can become emitters of migrating moths that spread the outbreak by increasing the apparent fecundity of the surrounding low-density populations [20].
We observed, in each year of this study, but most strikingly in 2013, net immigration into lower-density populations, and net emigration away from higher-density populations (Figure 7). This pattern of inverse density-dependence of apparent fecundity is ubiquitous in spruce budworms [20], and its regional average and slope vary from year to year in response to factors that affect the migratory behavior of moths as well as to the variability of population density in the source region. We noted that apparent fecundity dropped sharply in populations where defoliation exceeds 20% (Figure 8a), a level at which the density of emerging adults starts to level off (Figure 5b), an indication of intraspecific competition for food. This evidence suggests a mechanism through which crowding triggers increased emigration of moths. It was recently discovered that moth emigration is density dependent in the closely-related western spruce budworm [20].
These results suggest that there is a threshold density below which spruce budworm populations are readily kept in check by natural mortality, especially parasitoids. To calculate an approximate value for such a threshold, we multiplied the survival rates provided by Equation (1) by the geometric mean of apparent fecundity among LSL budworm populations in 2012 and 2013 (27.3 and 49.6 eggs per adult, respectively). We did not use the 2014 survival because at that time the regional outbreak in our study area had become generalized. The resulting annual growth rates (Figure 10) show a range of densities between 2.3 and 4.3 L4 per branch tip (assuming 80 shoots per branch) as threshold between decreasing and increasing populations. Of course, there is additional mortality from egg to L4 that is not taken into account in this calculation. Therefore, these are conservative estimates, and actual thresholds are probably somewhat higher.
5. Conclusions
All of this evidence lends support to the conclusion that, for a budworm population to increase to outbreak density, it must be “propped-up” somehow above a certain threshold density (the Allee threshold). While other triggers or mechanisms may be involved at times, immigration from a nearby outbreak population seems to be the main way this can happen. Once a population has increased beyond the Allee threshold, it can continue growing and then become a hot spot itself, the source of further spread by moth migration.
We also demonstrated the high efficacy of Btk and tebufenozide as management tactics applicable to incipient populations of spruce budworm, while mating disruption with pheromones has been shown to be ineffective [16]. Taken together, these results indicate that insecticide applications, when efficacious, can reduce populations that happen to increase above the unstable eruption threshold. This is the essence of what is termed an “early intervention” strategy, where treatment in one year may have benefits lasting well beyond the treatment year [5].
These findings have significance with respect to the development of an early intervention strategy. First, they imply that populations can be brought down to a density where mortality from natural enemies and mating failure can keep the reduced population under check, barring massive immigration. This dependence on immigration implies that if all potential sources of significant numbers of moths are reduced on a regional scale, an outbreak can be stopped (prevented) by drying-up the supply of migrating moths. It also implies that moth migration poses a threat to an early intervention strategy. In years of extensive migration activity, the area being managed may be overwhelmed by immigrant, egg-laying moths, and the area to be treated may become prohibitively large. An attempt at implementing such a management strategy has been undertaken in New Brunswick, Canada, since 2015, and shows promising results [29].
Author Contributions
Conceptualization, J.R.; methodology, J.R., A.B., A.D.; formal analysis, J.R.; investigation, A.B., A.D., J.R.; resources, J.R., A.D.; data curation, A.B.; writing—original draft preparation, J.R., B.J.C.; writing—review & editing, B.J.C., A.B., A.D. and P.T.; project administration, A.B., A.D., P.T.; funding acquisition, J.R., A.D., P.T.
Funding
This research was funded by the natural resources and forest departments of Newfoundland, Nova Scotia, New Brunswick, Quebec, Ontario, Manitoba, Saskatchewan, Alberta and British Columbia, as well as the U.S.D.A. Forest Service through SERG-International. Considerable funds and in-kind contributions were also provided by the Atlantic Canada Opportunities Agency, Forest Protection Limited, and the Société de Protection des Forêts contre les Insectes et Maladies du Québec (SOPFIM).
Acknowledgments
Thanks to the Ministère des Forêts, de la Faune et des Parcs du Québec whose personnel contributed by rearing and diagnostic of mortality in rearing. Special thanks to the owners of the 13 woodlots in which much of this work was carried out. Thanks also to Kees van Frankenhuyzen, Rob Johns, Deepa Pureswaran, Véronique Martel and Michel Cusson for their help with early planning and fieldwork.
Conflicts of Interest
The authors declare no conflict of interest.
References
- MacLean, D.A. Vulnerability of fir spruce stands during uncontrolled spruce budworm outbreaks: A review and discussion. For. Chron. 1980, 56, 213–221. [Google Scholar] [CrossRef]
- Armstrong, J.A.; Cook, C.A. Aerial Spray Applications on Canadian Forests: 1945 to 1990; Forestry Canada: Ottawa, ON, Canada, 1993. [Google Scholar]
- Chang, W.Y.; Lantz, V.A.; Hennigar, C.R.; MacLean, D.A. Economic impacts of spruce budworm (Choristoneura fumiferana Clem.) outbreaks and control in New Brunswick, Canada. Can. J. For. Res. 2012, 42, 490–505. [Google Scholar] [CrossRef]
- Bouchard, M.; Auger, I. Influence of environmental factors and spatio-temporal covariates during the initial development of a spruce budworm outbreak. Lands. Ecol. 2014, 29, 111–126. [Google Scholar] [CrossRef]
- Johns, R.; Bowden, J.; Carleton, R.D.; Cooke, B.J.; Edwards, S.; Emilson, E.; James, P.M.A.; Kneeshaw, D.; MacLean, D.A.; Martel, V.; et al. A conceptual framework for the spruce budworm early intervention strategy: Can outbreaks be stopped? Forests 2019. in review. [Google Scholar]
- Ludwig, D.; Jones, D.D.; Holling, C.S. Qualitative analysis of insect outbreak systems: The spruce budworm and forest. J. Anim. Ecol. 1978, 47, 315–332. [Google Scholar] [CrossRef]
- Morris, R.F. The dynamics of epidemic spruce budworm population. Mem. Entomol. Soc. Can. 1963, 31, 30–32. [Google Scholar] [CrossRef]
- Royama, T. Population dynamics of the spruce budworm Choristoneura Fumiferana. Ecol. Monogr. 1984, 54, 429–462. [Google Scholar] [CrossRef]
- Berryman, A.A. The theory and classification of outbreaks. In Insect Outbreaks; Barbosa, P., Schultz, J.C., Eds.; Academic Press: New York, NY, USA, 1987; pp. 3–30. ISBN 13: 9780120781485. [Google Scholar]
- Régnière, J.; Delisle, J.; Bauce, E.; Therrien, P.; Kettela, E.; Cadogan, L.; Retnakaran, A.; van Frankenhuyzen, K. Understanding of spruce budworm population dynamics: Development of early intervention strategies. In Boreal Odyssey, Proceedings to the North American Forest Insect Work Conference, Edmonton, AB, Canada, 14–18 May 2001; Volney, W.J.A., Spence, J.R., Lefebvre, E.M., Eds.; Canadian Forest Service: Victoria, BC, Canada, 2001; pp. 57–68. [Google Scholar]
- Clark, W.C.; Jones, D.D.; Holling, C.S. Lessons for ecological policy design: A case study of ecosystem management. Ecol. Model. 1979, 7, 1–53. [Google Scholar] [CrossRef] [Green Version]
- Régnière, J.; Nealis, V. Ecological mechanisms of population change during outbreaks of the spruce budworm. Ecol. Entomol. 2007, 32, 461–477. [Google Scholar] [CrossRef]
- Allee, W.C.; Bowen, E. Studies in animal aggregations: Mass protection against colloidal silver among goldfishes. J. Exp. Zool. 1932, 61, 185–207. [Google Scholar] [CrossRef]
- Stephens, P.A.; Sutherland, W.J.; Freckleton, R.P. What is the Allee effect? Oikos 1999, 87, 185–190. [Google Scholar] [CrossRef]
- Régnière, J.; Delisle, J.; Pureswaran, D.; Trudel, R. Mate-finding Allee effect in spruce budworm population dynamics. Entomol. Exp. Appl. 2012, 146, 112–122. [Google Scholar] [CrossRef]
- Régnière, J.; Delisle, J.; Dupont, A.; Trudel, R. Results of three mating disruption trials for population management of the spruce budworm (Lepidoptera: Tortricidae). Forest 2019. in review. [Google Scholar]
- Van Frankenhuyzen, K.; Régnière, J. Multiple effect of tebufenozide on the survival and performance of the spruce budworm (Lepidoptera: Tortricidae). Can. Entomol. 2016, 149, 227–240. [Google Scholar] [CrossRef]
- Régnière, J.; Sanders, C.J. Optimal sample size for the estimation of spruce budworm (Lepidoptera: Tortricidae) populations on balsam fir and white spruce. Can. Entomol. 1983, 115, 1621–1626. [Google Scholar] [CrossRef]
- Sanders, C.J. A Summary of Current Techniques Used for Sampling Spruce Budworm Populations and Estimating Defoliation in Eastern Canada; Canadian Forest Service: Victoria, BC, Canada, 1980.
- Régnière, J.; Nealis, V.G. Moth dispersal, egg recruitment and spruce budworms: Measurement and interpretation. Forests 2019, 10, 706. [Google Scholar] [CrossRef]
- Régnière, J. An oviposition model for the spruce budworm, Choristoneura fumiferana (Lepidoptera: Tortricidae). Can. Entomol. 1983, 115, 1371–1382. [Google Scholar] [CrossRef]
- Régnière, J.; You, M. A simulation model of spruce budworm (Lepidoptera: Tortricidae) feeding on balsam fir and white spruce. Ecol. Model. 1991, 54, 277–297. [Google Scholar] [CrossRef]
- Stedinger, J.R. A spruce budworm-forest model and its implications for suppression programs. For. Sci. 1984, 30, 597–615. [Google Scholar] [CrossRef]
- Bouchard, M.; Martel, V.; Régnière, J.; Therrien, P.; Correia, D.L.P. Do natural enemies explain fluctuations in low-density spruce budworm populations? Ecology 2018, 99, 2047–2057. [Google Scholar] [CrossRef]
- Bouchard, M.; Régnière, J.; Therrien, P. Bottom-up factors contribute to large-scale synchrony in spruce budworm populations. Can. J. For. Res. 2017, 48, 277–284. [Google Scholar] [CrossRef]
- Blais, J.R. The relationship of the spruce budworm (Choristoneura fumiferana Clem.) to the flowering condition of balsam fir (Abies balsamea (L.) Mill.). Can. J. Zool. 1952, 30, 1–19. [Google Scholar] [CrossRef]
- Bauce, E.; Carisey, N. Larval feeding behaviour affects the impact of staminate flower production on the suitability of balsam fir trees for spruce budworm. Oecologia 1996, 105, 126–131. [Google Scholar] [CrossRef] [PubMed]
- Alerstam, T.; Chapman, J.W.; Bäckman, J.; Smith, A.D.; Karlsson, H.; Nilsson, C.; Reynolds, D.R.; Klaassen, H.G.; Hill, J.K. Convergent patterns of long-distance nocturnal migration in noctuid moths and passerine birds. Proc. R. Soc. B Biol. Sci. 2011, 278, 3074–3080. [Google Scholar] [CrossRef] [PubMed]
- MacLean, D.; Amirault, P.; Amos-Binks, L.; Cerleton, D.; Hennigar, C.; Johns, R.; Régnière, J. Positive results of an early intervention strategy to suppress a spruce budworm outbreak after five years of trials. Forests 2019, 10, 448. [Google Scholar] [CrossRef]
Figure 1.
Population growth patterns hypothesized for managed and unmanaged incipient populations of spruce budworm, according to two contrasting theories of cycle initiation. Under Theory 1, management aims at maintaining populations below the threshold density (open circle) below which growth rates are <1 and populations are kept in check by natural factors.

Figure 2.
Map of the Lower St-Lawrence region of Quebec, with location of all plots in this study.

Figure 3.
Left column: Relationship between larval and adult density in (a) 2012 (untreated and Bt-treated populations included) and 2013; (b) 2014; (c) 2014 among the SOPFIM plots (no insecticide treatments). Lines: Equation (1) (reduced, × N). Right column: Relationship between larval density and survival to the adult stage (d) in 2012 and among 2013; (e) 2014; (f) SOPFIM plots in 2014. Lines: Equation (1) (reduced; solid: Untreated; dotted: Insecticide). Vertical bars: SEM. Open symbol in (b,e): Outlier from plot LSL-24 in 2014 not used in model fitting.

Figure 4.
Mortality directly attributable to insecticides, as calculated with Equation (10). Vertical bars: SEM.
Figure 4.
Mortality directly attributable to insecticides, as calculated with Equation (10). Vertical bars: SEM.

Figure 5.
(a) Relationship between defoliation of current-year shoots and larval density at the L4 (lines: Equation (2)), reduced (black lines and closed symbols: Untreated; grey lines and open symbols: Treated with insecticides). (b) Relationship between adult density and defoliation. Vertical bars: SEM.

Figure 6.
Relationship between field survival from L4 to adult S and combined survival in rearing SR (lines: Equation (4)), reduced.
Figure 6.
Relationship between field survival from L4 to adult S and combined survival in rearing SR (lines: Equation (4)), reduced.

Figure 7.
Relationship between resident adult density, egg density field (left column) and apparent fecundity (right column. Lines: Equations (5) (left column) or (6) (right column). (a,b): 2012. (c,d): 2013. (e,f): 2014, dotted lines and grey symbols: SOPFIM sites). (g,h) 2015. Grey dashed lines in the right panels represent the extremes of no migration (slope 0) and random distribution of eggs (slope −1).

Figure 8.
Relationships between (a) apparent fecundity and defoliation (Equation (7)) and (b) egg mass size and apparent fecundity (Equation (8)). Greyed symbol in (b): Outlier omitted from analysis.
Figure 8.
Relationships between (a) apparent fecundity and defoliation (Equation (7)) and (b) egg mass size and apparent fecundity (Equation (8)). Greyed symbol in (b): Outlier omitted from analysis.

Figure 9.
Relationships between larval population density (at the L4) and annual population growth rate (a) 2012–2013; (b) 2013–2014; (c) 2014–2015 in the Lower St-Lawrence; (d) 2014–2015 in SOPFIM sites. Symbols: Observed. Lines: Expected from Equations (1) and (5). Horizontal dashed lines: Replacement level where R = 1.

Figure 10.
Relationship between expected population growth rate and density of feeding larvae (L4) early in the development of a new spruce budworm outbreak (solid line: 2012, dashed line: 2013). Grey dotted line represents growth rate of populations treated with an insecticide (here, Btk in 2013). Grey downward arrows point to threshold densities for population increase, where R = 1 (4.3 and 2.3 L4 larvae per branch tip in 2012 and 2013, respectively).


Table 1.
Parameter estimates of Equation (1) relating survival from L4 to adult. Full model. R2 = 0.87.
Table 1.
Parameter estimates of Equation (1) relating survival from L4 to adult. Full model. R2 = 0.87.
| Parameter | Estimate | SE | t | p |
|---|---|---|---|---|
| p0 | 0.06206 | 0.01378 | 4.50269 | 0.000028 |
| p0,S | 0.05220 | 0.03037 | 1.71885 | 0.046687 |
| p1 | 1.98880 | 1.18228 | 1.68218 | 0.050163 |
| p1|2013 | 1.63544 | 1.22133 | 1.33907 | 0.094054 |
| p1|2014 | 3.81979 | 1.36986 | 2.78846 | 0.004034 |
| p1|S | 2.66913 | 1.38153 | 1.93201 | 0.030232 |
| p2|2012 | 1.26555 | 1.39848 | 0.90495 | 0.185456 |
| p2|2013 | −2.35263 | 1.24347 | 1.89198 | 0.032874 |
| p2|2014 | −4.79843 | 1.20321 | 3.98801 | 0.000138 |
| p3 | 1.94932 | 0.20292 | 9.60643 | 0.000000 |
Table 2.
Analysis of Variance table for defoliation against L4 larval density (N), year, and insecticide treatment (Equation (2)).
Table 2.
Analysis of Variance table for defoliation against L4 larval density (N), year, and insecticide treatment (Equation (2)).
| Source | DF | Adj SS | Adj MS | F-Value | p-Value |
|---|---|---|---|---|---|
| N | 1 | 22.27 | 22.277 | 104.57 | 0.000 |
| Year | 2 | 0.228 | 0.114 | 0.53 | 0.595 |
| Insecticide | 1 | 2.061 | 2.061 | 9.68 | 0.006 |
| Year × Insecticide | 2 | 1.092 | 0.546 | 2.56 | 0.103 |
| N × Year | 2 | 2.997 | 1.499 | 7.04 | 0.005 |
| N × Insecticide | 1 | 0.325 | 0.325 | 1.52 | 0.232 |
| N × Year × Insecticide | 2 | 0.256 | 0.128 | 0.60 | 0.559 |
| Error | 19 | 4.047 | 0.213 | ||
| Total | 30 | 73.30 |
Table 3.
Analysis of Variance table for log odds of survival in the field against log odds of combined survival in rearing, year, and insecticide treatment (Equation (4)).
Table 3.
Analysis of Variance table for log odds of survival in the field against log odds of combined survival in rearing, year, and insecticide treatment (Equation (4)).
| Source | DF | Adj SS | Adj MS | F-Value | p-Value |
|---|---|---|---|---|---|
| Year | 3 | 1.6136 | 0.53787 | 6.70 | 0.002 |
| Insecticide | 1 | 0.0201 | 0.02006 | 0.25 | 0.621 |
| Logit(SR) | 1 | 3.8566 | 3.85659 | 48.06 | 0.000 |
| Logit(SR) × Year | 3 | 0.3090 | 0.10301 | 1.28 | 0.300 |
| Logit(SR) × Insecticide | 1 | 0.0114 | 0.01138 | 0.14 | 0.709 |
| Error | 27 | 2.1665 | 0.08024 | ||
| Total | 36 | 19.2402 |
Table 4.
Parameter estimates of Equation (5) describing the relationship between egg and surviving adult density in the 5 datasets available in this study. R2 = 0.92. The t statistics tests the hypothesis that the term is zero.
Table 4.
Parameter estimates of Equation (5) describing the relationship between egg and surviving adult density in the 5 datasets available in this study. R2 = 0.92. The t statistics tests the hypothesis that the term is zero.
| Parameter | Estimate | SE | t | p |
|---|---|---|---|---|
| I2012 | 0.015 | 0.006 | 2.621 | 0.006 |
| I2013 | 0.157 | 0.028 | 5.507 | 0.000 |
| I2014 | 0.248 | 0.072 | 3.450 | 0.001 |
| I2015 | 0.112 | 0.050 | 2.221 | 0.016 |
| IS | 0.073 | 0.035 | 2.072 | 0.023 |
| F2012 | 12.356 | 3.759 | 3.287 | 0.001 |
| F2013 | 1.617 | 1.608 | 1.006 | 0.161 |
| F2014 | 33.777 | 6.362 | 5.309 | 0.000 |
| F2015 | 45.713 | 7.7495 | 5.899 | 0.000 |
| FS | 3.321 | 1.147 | 2.897 | 0.003 |
Table 5.
Analysis of Variance table for log odds of survival in the field against log odds of combined survival in rearing, year, and insecticide treatment (Equation (7)). R2 = 0.85.
Table 5.
Analysis of Variance table for log odds of survival in the field against log odds of combined survival in rearing, year, and insecticide treatment (Equation (7)). R2 = 0.85.
| Source | DF | Adj SS | Adj MS | F-Value | p-Value |
|---|---|---|---|---|---|
| Year | 3 | 3.531 | 1.177 | 16.08 | 0.000 |
| 1/D | 1 | 0.656 | 0.656 | 8.96 | 0.006 |
| Year × 1/D | 3 | 4.562 | 1.521 | 20.77 | 0.000 |
| Error | 29 | 2.123 | 0.073 | ||
| Total | 36 | 14.005 |
Table 6.
Analysis of Variance table for log odds of survival in the field against log odds of combined survival in rearing, year, and insecticide treatment (Equation (8)). R2 = 0.47.
Table 6.
Analysis of Variance table for log odds of survival in the field against log odds of combined survival in rearing, year, and insecticide treatment (Equation (8)). R2 = 0.47.
| Source | DF | Adj SS | Adj MS | F-Value | p-Value |
|---|---|---|---|---|---|
| Year | 4 | 121.24 | 30.310 | 3.83 | 0.010 |
| LogEM | 1 | 41.80 | 41.804 | 5.29 | 0.027 |
| Error | 39 | 308.41 | 7.908 | ||
| Total | 44 | 587.99 |
© 2019 by the authors. Licensee MDPI, Basel, Switzerland. This article is an open access article distributed under the terms and conditions of the Creative Commons Attribution (CC BY) license (http://creativecommons.org/licenses/by/4.0/).
Share and Cite
MDPI and ACS Style
Régnière, J.; Cooke, B.J.; Béchard, A.; Dupont, A.; Therrien, P. Dynamics and Management of Rising Outbreak Spruce Budworm Populations. Forests 2019, 10, 748. https://0-doi-org.brum.beds.ac.uk/10.3390/f10090748
AMA Style
Régnière J, Cooke BJ, Béchard A, Dupont A, Therrien P. Dynamics and Management of Rising Outbreak Spruce Budworm Populations. Forests. 2019; 10(9):748. https://0-doi-org.brum.beds.ac.uk/10.3390/f10090748
Chicago/Turabian StyleRégnière, Jacques, Barry J. Cooke, Ariane Béchard, Alain Dupont, and Pierre Therrien. 2019. "Dynamics and Management of Rising Outbreak Spruce Budworm Populations" Forests 10, no. 9: 748. https://0-doi-org.brum.beds.ac.uk/10.3390/f10090748
Note that from the first issue of 2016, this journal uses article numbers instead of page numbers. See further details here.