Article

The Influences of Disturbance Histories and Soil Properties on Aboveground Biomass through Plant Functional Traits in a Tropical Rainforest

1
Key Laboratory of State Forestry Administration on Forest Ecosystem Protection and Restoration of Poyang Lake Watershed, Jiulianshan National Observation and Research Station of Chinese Forest Ecosystem, College of Forestry, Jiangxi Agricultural University, Nanchang 330045, China
2
Key Laboratory of Forest Ecology and Environment of State Forestry Administration, Institute of Forest Ecology, Environment and Protection, Chinese Academy of Forestry, Beijing 100091, China
3
Co-Innovation Center for Sustainable Forestry in Southern China, Nanjing Forestry University, Nanjing 210000, China
4
Research Institute of Tropical Forestry, Chinese Academy of Forestry, Guangzhou 510520, China
5
Key Laboratory of Ecosystem Network Observation and Modeling, Institute of Geographic Sciences and Natural Resources Research, Chinese Academy of Sciences, Beijing 100091, China
*
Author to whom correspondence should be addressed.
Submission received: 8 August 2019 / Revised: 31 August 2019 / Accepted: 4 September 2019 / Published: 6 September 2019
(This article belongs to the Special Issue Forest Stand Management and Biomass Growth)

Abstract

:
Research Highlights: We try to evaluate the relative contribution of environmental factors and functional traits on aboveground biomass in a species rich tropical forest ecosystem after a 40-years natural recovery. Background and Objectives: Functional traits have a potential to incorporate community dynamics into the impacts of disturbance histories or environmental conditions on ecosystem functioning, but few studies have been conducted to understand these processes. Materials and Methods: We measured plant functional traits and soil properties in the tropical montane rainforests on Hainan Island, China, which had experienced different disturbance histories (clear cutting, selective logging, and old-growth) 40 years ago. A structural equation model was used to elucidate how disturbance histories and soil factors influence aboveground biomass (AGB) across different size classes (saplings, treelets, and adult trees) through plant functional traits. Results: The results demonstrated logging stimulated seedling establishment but decreased AGB of adult trees and wood density at community-level (CWM_WD) of sapling and adult tree. Generally, CWM_WD of sapling, treelet, and adult tree decreased linearly with the increasing of specific leaf area at community-level (CWM_SLA) in old-growth forest and these two disturbed forests. Moreover, CWM_SLA explained more variation of CWM_WD with increasing intensity of logging within sapling, treelet, and adult tree. CWM_SLA and CWM_WD not only responded to environmental conditions and disturbance intensity but also affected AGB in all size classes; meanwhile, CWM_SLA was a major driver of AGB. CWM_SLA had a stronger effect on AGB in sapling and treelet classes than on the adult tree class. Conclusions: Our results suggested that disturbance history and environmental factors could directly or indirectly affect ecosystem functioning through plant functional traits. Functional traits always had a stronger effect on AGB than environmental conditions. Moreover, CWM_SLA is a key trait that can be used to link the relationship between environmental conditions and AGB.

1. Introduction

The world and its ecosystems are undergoing rapid change [1]. Human domination of ecosystems has changed the overall availability and stoichiometry of ecosystem elements, the size and connectivity of habitats, the atmospheric CO2 concentration, and the mean and variability of temperature and precipitation. A variety of global changes are driving an increase in rates of species extinctions. Biodiversity loss in the 21st century could be a major driver of ecosystem change [2]. Hundreds of experiments, primarily conducted in grasslands, have been designed to examine how different components of biodiversity affect ecosystem functions (BEF) that sustain the provisioning of goods and services needed by human society. Syntheses of these experiments have proved that a loss of plant biodiversity will reduce plant production and alter decomposition [3]. However, an empirically unresolved central question is how the sizes of these effects compare with the direct effects of environmental change, such as changing atmospheric composition, climate warming, and nutrient pollution that also threaten ecosystem functioning [4].
Although evidence is mounting that extinctions are altering key processes of the formation of productivity and sustainability of earth’s ecosystems, species diversity based only on taxonomic identity may provide an incomplete view of biodiversity, because it does not take into account the biological identity, and differences among species [5]. A recent consensus points out the importance of particular taxa rather than species richness per se in explaining changes to ecosystem processes [6]. The next step in biodiversity assessment needs to consider the role of each species in ecosystems as well as species responses to environmental conditions, which is actually what the functional view of biotic communities aims to quantify [7]. Functional ecology is based on the use of functional traits, which are defined as morpho-physio-phenological traits that impact the fitness of individual species indirectly via their effects on growth, reproduction, and survival, the three components of individual performance [8]. Also, functional traits can indicate how a species responds to its environment, which offers a powerful approach to addressing ecological questions [7]. Thus, we attempt to use functional traits of individual species to explore the effects of biodiversity on ecosystem functioning. This is especially important for highly diverse systems where using individual species as the working unit often becomes overwhelming, such as tropical forests. Studies of functional traits can more efficiently provide informative insights into community composition and ecosystem function [9].
Environmental factors can be considered as filters determining which individuals with specific attributes (or response traits) are able to survive and persist in a community [10]. Different sets of response traits to environmental factors such as resources and disturbances have been recognized in plant communities [11,12]. A trait-based response-effect framework that differentiates the community response to environmental change (predicted by response traits) and the effect of that change on ecosystem processes (predicted by effect traits) was proposed for predicting how changing environmental conditions influence ecosystem functioning [13].
Since functional traits can link to environmental conditions and ecosystem functioning, these interactions are well suited to analysis by structural equation models (SEM). SEM analyses are a more generalized form of several types of statistical analyses, including regression and path analysis. In contrast to other statistical methods, SEM can test for the significance of the overall model structure, i.e., the relationships between the components of an ecosystem, as well as the specific parameters of the model, e.g., the strength or direction of the interactions between the components [14]. This unique statistical method enables scientists to use field data to test hypotheses about causal pathways of ecosystem functioning [15]. De Bello et al. believe it is necessary to identify key mechanisms by which organisms affect ecosystem properties to successfully promote the sustainability of ecosystems [16]. In this paper, we measured plant functional traits and soil properties in the tropical montane rainforests on Hainan Island, China, which were subjected to different disturbance histories 40-years ago (clear cutting, selective logging, and old-growth). The structural equation model was used to elucidate how disturbance histories and soil factors influence the aboveground biomass across different size classes (saplings, treelets and adult trees) through plant functional traits. We address the following questions: (1) How do disturbance histories affects community structure in different tree size classes? (2) How do disturbance histories affect functional traits and ecosystem functioning in different tree size classes? (3) How do functional traits respond to environmental conditions and affect ecosystem functioning in different tree size classes? (4) Is there a key trait that can be used to determine the relationship between environmental conditions and ecosystem functioning?

2. Materials and Methods
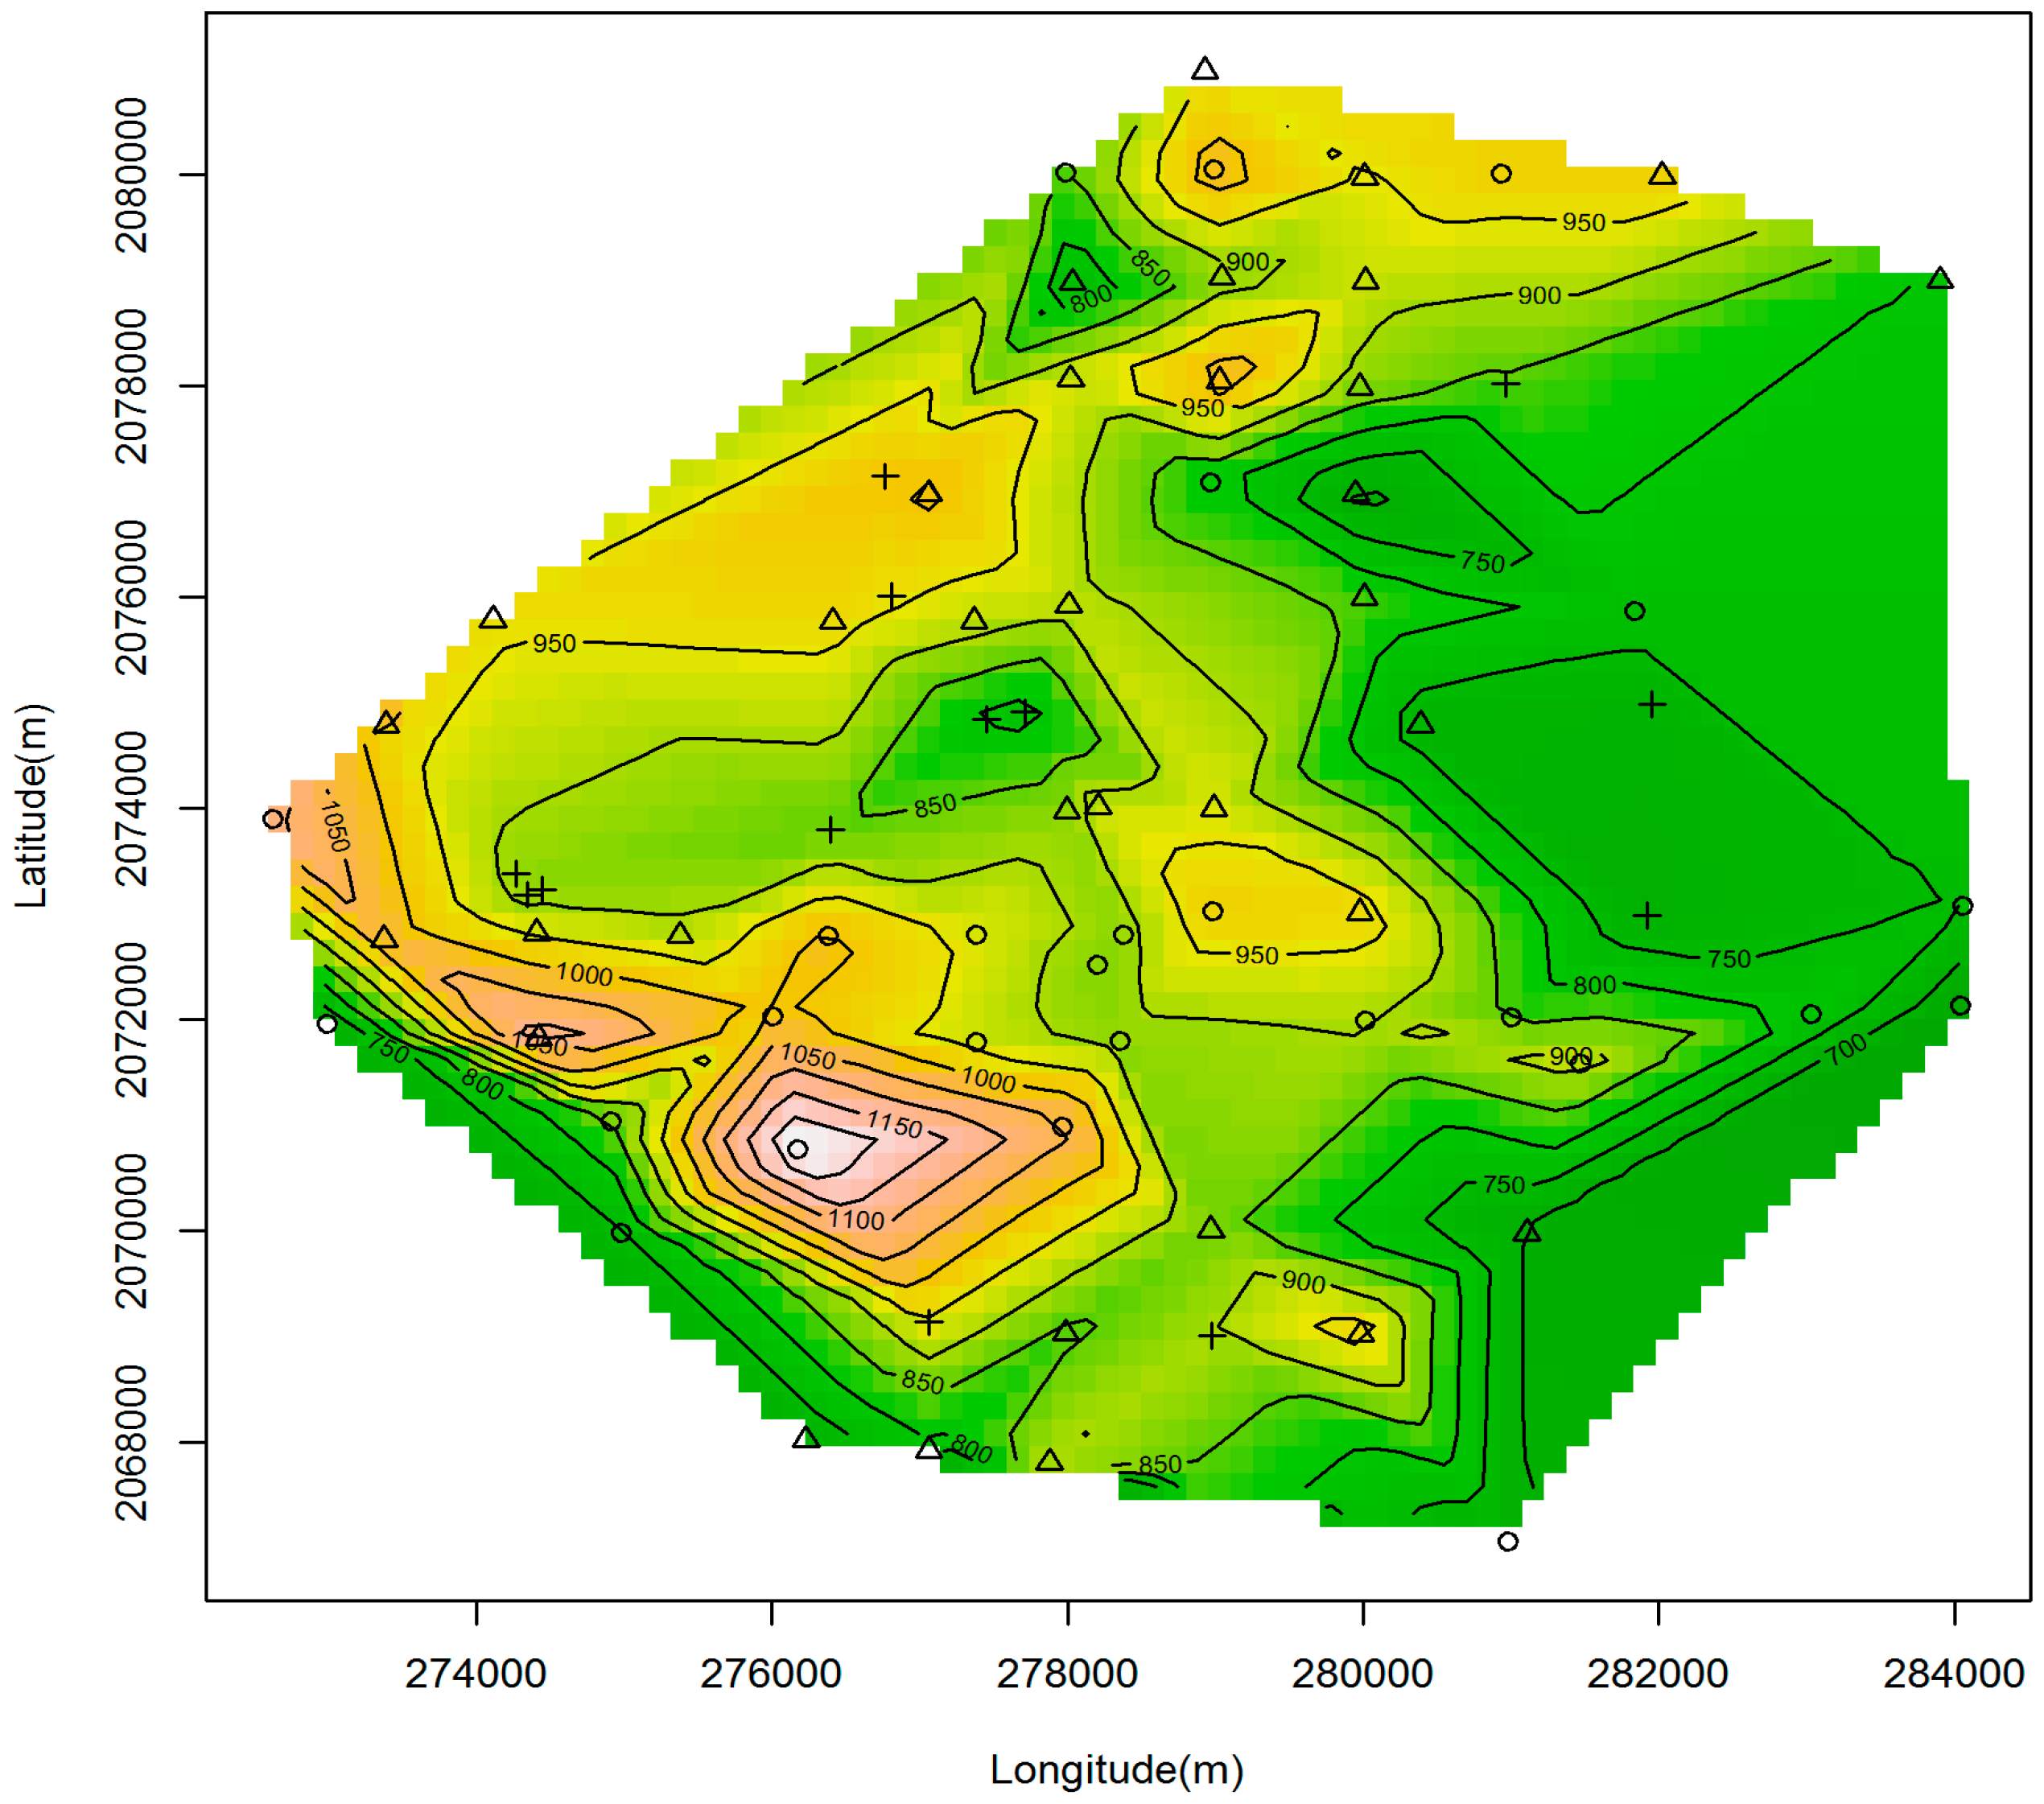
2.1. Study Sites

This study was conducted in the Jianfengling Forest Reserve (18°23′–18°50′ N, 108°36′–109°05′ E) on Hainan Island in southern China. The Reserve lies at the northern edge of the Asian tropical forest [17]. The Jianfengling Forest Reserve covers ca 640 km2, with an elevation range of ca 0–1412 m a.s.l. This study was located in tropical montane rainforest. The mean annual temperature is 19.7 °C and annual precipitation is 2651 mm, with a distinct wet season from May to October and a dry season from November to April of the following year [18].
Prior to 1994, the tropical forests on Hainan Island experienced extensive deforestation by logging. The deforestation rate in this area is higher than the average deforestation rate of the world, because of the shortage of timber [19]. Most of the primary tropical montane rainforests have been subjected to selective logging or clear cutting in Hainan Island. Consequently, secondary forests with different disturbance histories can be found in montane rainforest.
A total of 73 plots, 25 m × 25 m, were established on random locations and studied from June–October 2008. Field investigations were conducted on old-growth forest (26 plots) and secondary forest which had been natural recovered by 40 years after clear cutting (13 plots) or selective logging (34 plots) (see Figure 1). For clear cutting forest, over 90% percentage of basal area was removed and only some small trees were retained. For selective logging forest, 35%–47% of basal area was removed by harvesting the stems with DBH ≥ 40cm. For old-growth forest, no management was taken. All the three types of forests may subject to natural disturbance (e.g., windthrow due to typhoon Invasion) in the past 40 years. Therefore, these different disturbance histories stand for different disturbance intensities (clear cutting > selective logging > old-growth forest), and they are consequently defined as categorical variables (3, 2, 1 successively). Information on the history of land use of the plots was obtained from management records of Jianfengling Bureau of Forestry of Hainan, China. Longitude, latitude, elevation of each plot were measured by a global positioning system receiver (GPS 500E, Magellan, CA, USA) and a map of the distribution of plots across the study area was showed in Figure 1 and basic description of these plots was presented in Table S1. The following data were recorded for each plot for each free-standing stem with DBH ≥ 1cm: species name, DBH, and height. Species nomenclature followed the Flora Republicae Popularis Sinicae [20]. DBH is the diameter at breast height (1.30 m) and tree height was measured by Haglöf Vertex IV-60 Hypsometer (Haglöf Sweden AB, Haglöf Produktion, Sweden).

2.2. Soil Data

Five 4 cm diameter, 20 cm deep soil cores, and five cutting rings distributed evenly in each plot were collected in December 2008. Soil physical properties including bulk density (BD, g cm−3), soil water content (SWC), maximum water holding capacity (MWC, mm) and capillary water holding capacity (CWC, mm) were measured by the cutting ring method during the dry season. For soil chemistry, soil samples were air-dried and then were ground to a fine powder with a mill. Soil organic carbon content (SOC, g kg−1) was measured by the potassium dichromate titration method and total nitrogen content (SN, g kg−1) was determined by semimicro-Kjeldahl method. Soil C:N ratio (SCN) was the ratio of soil organic carbon content to total nitrogen content. All the determinations of soil data were according to Forest Soil Analysis Methods [21].

2.3. Species and Traits

A total of 373 trees and shrubs species was found across the 73 plots. These traits were measured for all plant species in at least ten well-developed individuals per species (4203 individuals in total) and wood density was measured for at least five individuals per species (2015 individuals in total) from July to October in 2011, using standardized protocols for plant functional trait measurements [22]. For each individual, two to five recently-expanded leaves, including petioles and rachises of compound leaves, were collected. Leaf surface area was measured with a leaf area meter (LI-COR 3100C Area Meter, LI-COR, Lincoln, NE, USA). Leaf thickness (LT, mm) was measured for each lamina as the mean of three measurements using a Mitutoyo digital micrometer (Mitutoyo Instruments, Singapore). Leaf total chlorophyll content (CC) was estimated using three values per lamina from a SPAD 502Plus meter (Konica Minolta, Osaka, Japan). Laminar dry mass was measured by drying the specimen to a constant mass at 60 °C (around 72 h) and specific leaf area (SLA, cm2 g−1) was calculated for each lamina as the ratio of leaf surface area to leaf mass. Leaf dry matter content (LDMC, g g−1) was the oven-dry mass divided by its fresh mass. Wood density was determined from increment cores and trunks. The cores were taken from bark to pith of trees (DBH ≥ 5 cm) with an increment borer. Core lengths were then measured with a Mitutoyo digital micrometer and core volumes computed for cylinders of the measured length and inner diameter of the borer. For some shrub species, we had to sample trunk for individuals (DBH ≤ 5 cm) and removed the phloem and bark, measured fresh volume by water displacement. Each sample was quickly wrapped in a sealed plastic bag after sampling. These samples were drying in an oven at 103 °C for over 72 h until they became constant weight. Wood density was computed as oven dry mass/fresh volume and averaged for each species [22].
We partitioned individuals in each plot into three size classes: saplings (DBH ≤ 5 cm), treelets (5 cm < DBH < 15 cm) and adult trees (DBH ≥ 15 cm) and measured the abundance weighted community mean trait (CWM) for every functional trait in each size class (e.g., CWM_SLA5 for saplings, CWM_SLA10 for treelets, CWM_SLA15 for adult trees). CWM trait values were calculated as the sum of trait mean value of a species weighted by the species relative abundance using the FD package in R 2.14 [23] with the function dbFD [24].

2.4. Ecosystem Function

We calculated aboveground biomass (AGB) of the corresponding size classes (AGB5 for saplings, AGB10 for treelets, AGB15 for adult trees) using the following allometric regression [25]: AGB = 0.0559 ρ(DBH)2H, where ρ is the wood density for each species (g cm−3), DBH is the diameter at breast height (1.30 m in cm) and H is tree height (m). We focused on aboveground biomass because it influences carbon storage, ecosystem services and illustrate the breadth of sensitivity of ecosystem processes to species richness changes [3].

2.5. Statistical Analysis

2.5.1. Variations in Community Structure among Forests with Different Disturbance Intensities

Variations of community structure in different size classes among forests with different disturbance intensities were assessed separately by comparing species richness, stem density, basal area, aboveground biomass, CWM_SLA and CWM_WD with one-way ANOVAs followed by multiple comparison tests (Tukey–Kramer HSD test).

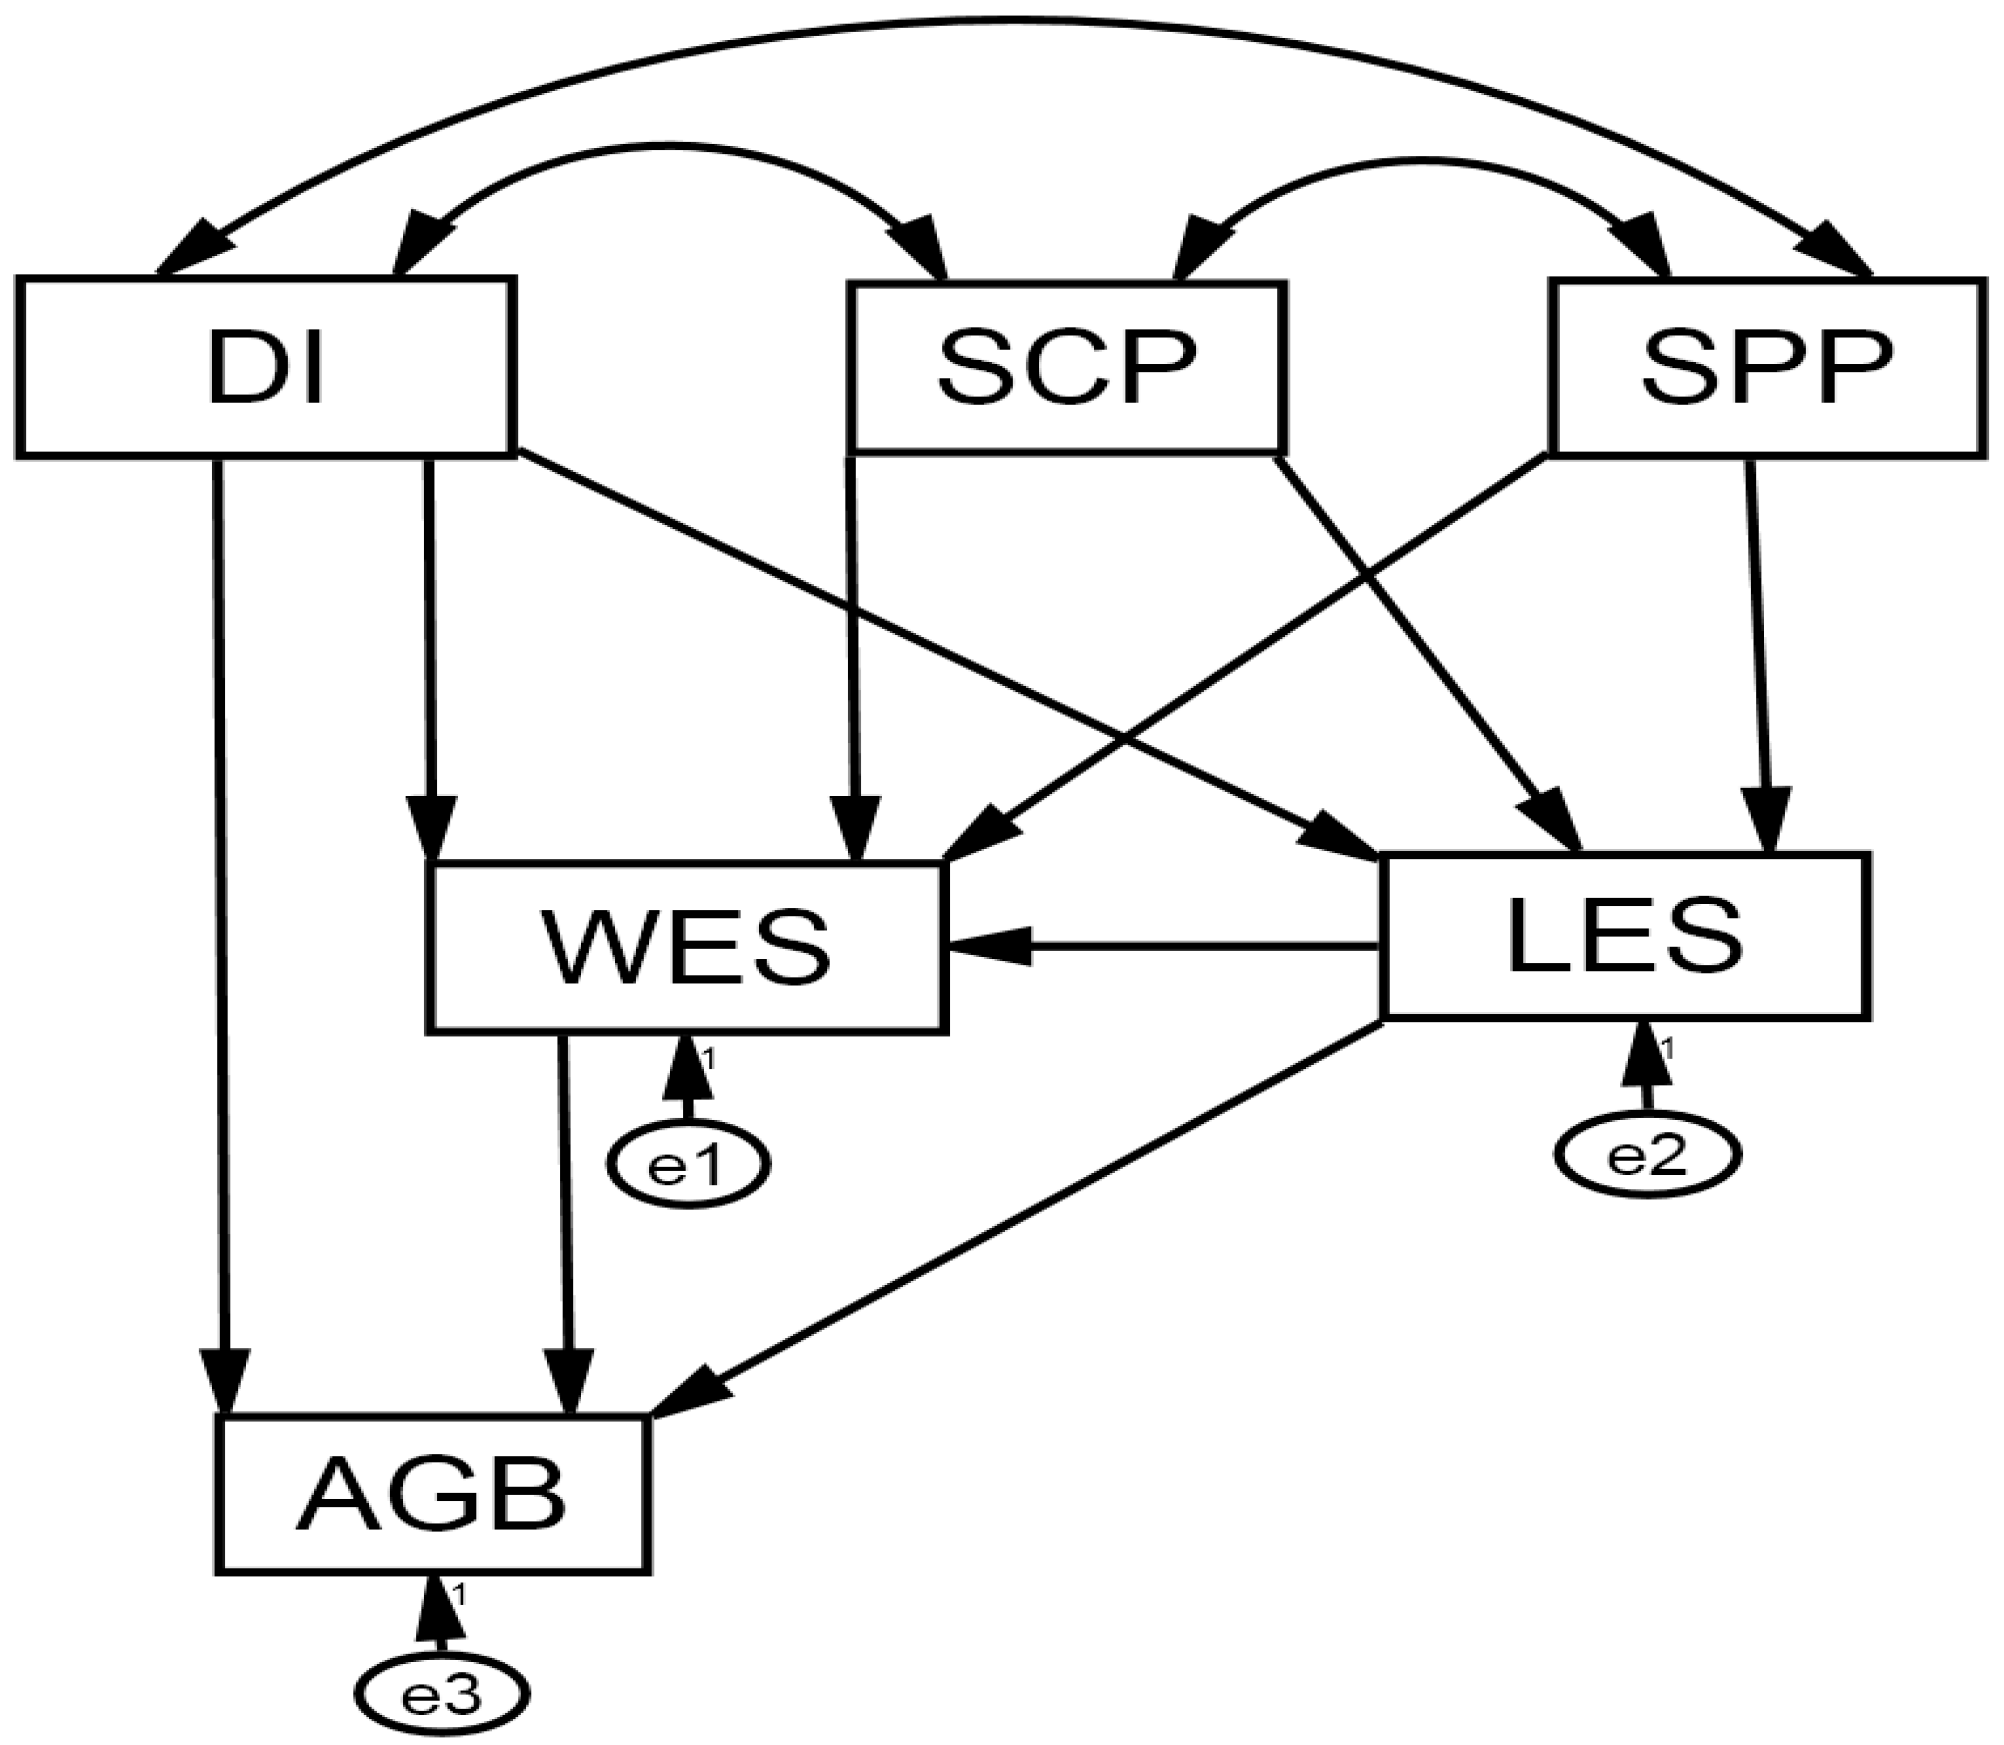
2.5.2. Linkage between Environmental Conditions and Aboveground Biomass through Functional Traits

For plant function, at least two dimensions exist, although it could be extended to include more dimensions [26]. These two dimensions relate to a leaf economics spectrum (LES) and a wood economics spectrum (WES). LES and WES are most commonly represented by specific leaf area [27] and wood density, respectively [28]. These economics spectra can respond to environmental conditions, e.g., leaf traits is influenced by soil resource availability in a global quantification [29] and disturbance [30], while wood density is affected by soil fertility [31] and disturbance such as logging or fire [32]. Furthermore, these economics spectra can affect ecosystem functions, e.g., leaf economics spectrum is related to biogeochemistry [33] and above-ground net primary productivity [34] while wood density is correlated with stem growth rate and carbon stock [35]. Despite this, some environmental changes can directly affect ecosystem processes such as logging and fire [36]. Based on the response-and-effect framework (see Figure 1a in [13]) and using prior knowledge above, a hypothesized structural equation model was built (Figure 2) to determine: (1) how community weighted mean trait, including leaf economics spectrum and wood economics spectrum, responds to environmental conditions, including soil physical properties (SPP), soil chemical properties (SCP) and disturbance intensity (DI); (2) how community weighted mean traits affect AGB; and (3) the direct effect of disturbance intensity on community weighted mean trait and AGB.
Structural equation modeling (SEM) would provide a multivariate perspective about how soil and plant community factors interact to influence AGB. We used a maximum likelihood estimator that is robust to non-normality and the Satorra–Bentler scaled chi-square to evaluate model adequacy. Model fit statistics evaluate the discrepancy between the covariance structure of the observed data and the covariance structure implied by the model. Therefore, good-fitting models yield small chi-square values and large p-values (p > 0.05), indicating no significant difference between the model and the data. Other tests of the goodness-of-fit of SEM are available, with three of these also being reported in this study [chi-square/degrees of freedom (CMIN/df), comparative fit index (CFI) and the root mean square error of approximation (RMSEA)]. Models supporting the data structure have a CMIN/df < 2, CFI > 0.9 and RMSEA < 0.05 [37]. SEMs were implemented using Amos 18.0.1 software (Amos Development Corp., Spring House, PA, USA). To reduce the complexity of the eventual SEM, a Pearson correlation analysis was carried out among the parameters within each soil physical properties, soil chemical properties, and plant functional traits to remove any variables highly correlated with others and reduce redundancy within these explanatory variables (see Tables S2–S6). After this procedure, the parameters retained for environmental variables were soil organic carbon content, soil water content and disturbance intensity. The parameters retained for plant functional traits were CWM_SLA and CWM_WD, which were representative of the LES and WES axes, respectively. Environmental parameters were considered as exogenous variables, while the trait and ecosystem functioning parameters were considered as endogenous variables. Each of the endogenous variables in an SEM model has an error term representing the uncertainty or inaccuracy of the measurement, while correlations are included with the exogenous variables. The satisfactory fit of such a model would indicate that direct effects exist from environmental parameters to traits that in turn produce effects on ecosystem functioning.

3. Results

3.1. Variations in Community Structure among Forests with Different Disturbance Intensities

For species richness, disturbed forest in all size classes was similar to old-growth forest over 40 years after logging (Figure 3). Stem density of saplings increased gradually with increasing intensity of logging. Stem density of treelets in disturbed forest was always higher than that in old-growth forest while stem density of adult trees in disturbed forest was similar to that in old-growth forest. Basal areas of saplings and treelets in disturbed forest were significantly higher than those in old-growth forest. However, basal area of adult trees decreased gradually with increasing intensity of logging. Since adult trees accounted for the most of the basal area (66%–81%), the total basal area also decreased gradually with increasing intensity of logging. The pattern of AGB is similar to the basal area, though the total AGB in old-growth forest was significant higher than that in disturbed forest. CWM_SLA of adult tree increased with the increasing intensity of logging. CWM_WD of sapling, adult tree and total trees decreased with the increasing intensity of logging.

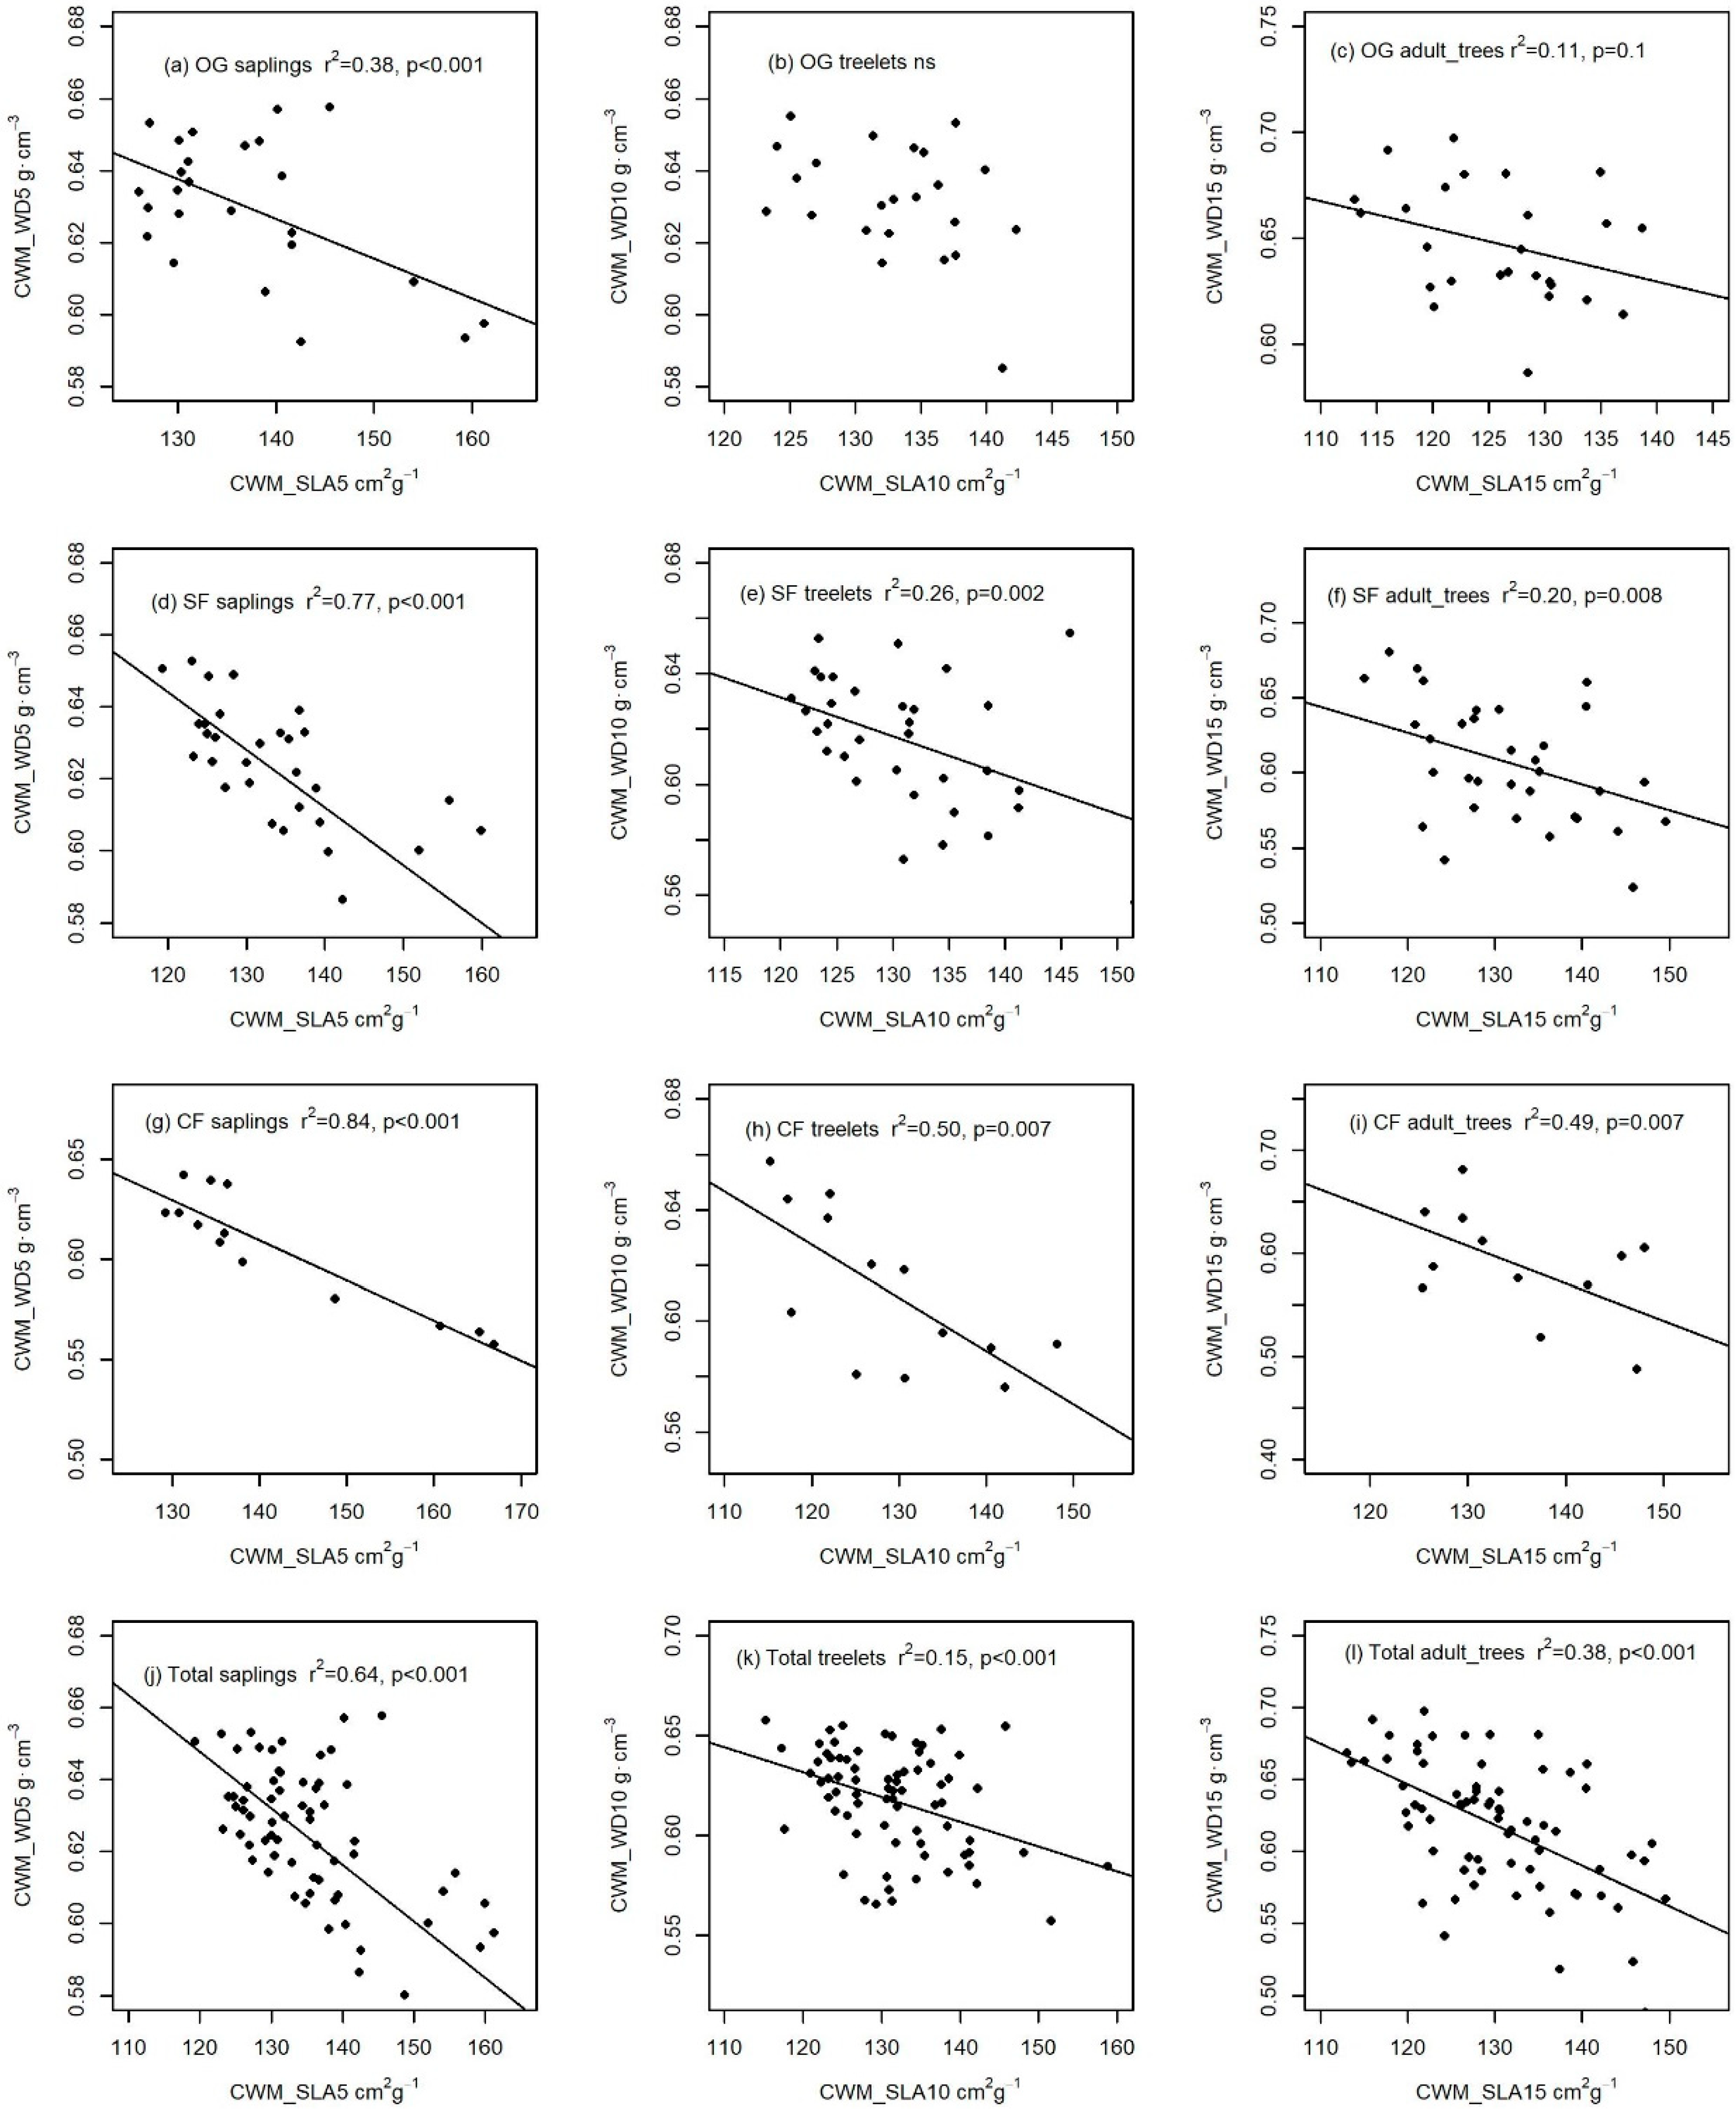
3.2. The Relationships between Community Mean Traits among Forests with Different Disturbance Intensities

Except for treelets in old-growth forest, the value of CWM_WD of saplings, treelets, and adult trees decreased linearly with the increasing of CWM_SLA in old-growth forest and the two disturbed forest (Figure 4). Moreover, CWM_SLA explained more variation of CWM_WD with increasing intensity of logging within saplings, treelets, and adult trees. In total trees, CWM_SLA in sapling explained more variation of CWM_WD than that in treelets and adult trees, meanwhile CWM_SLA in adult trees explained more variation of CWM_WD than that in treelets.

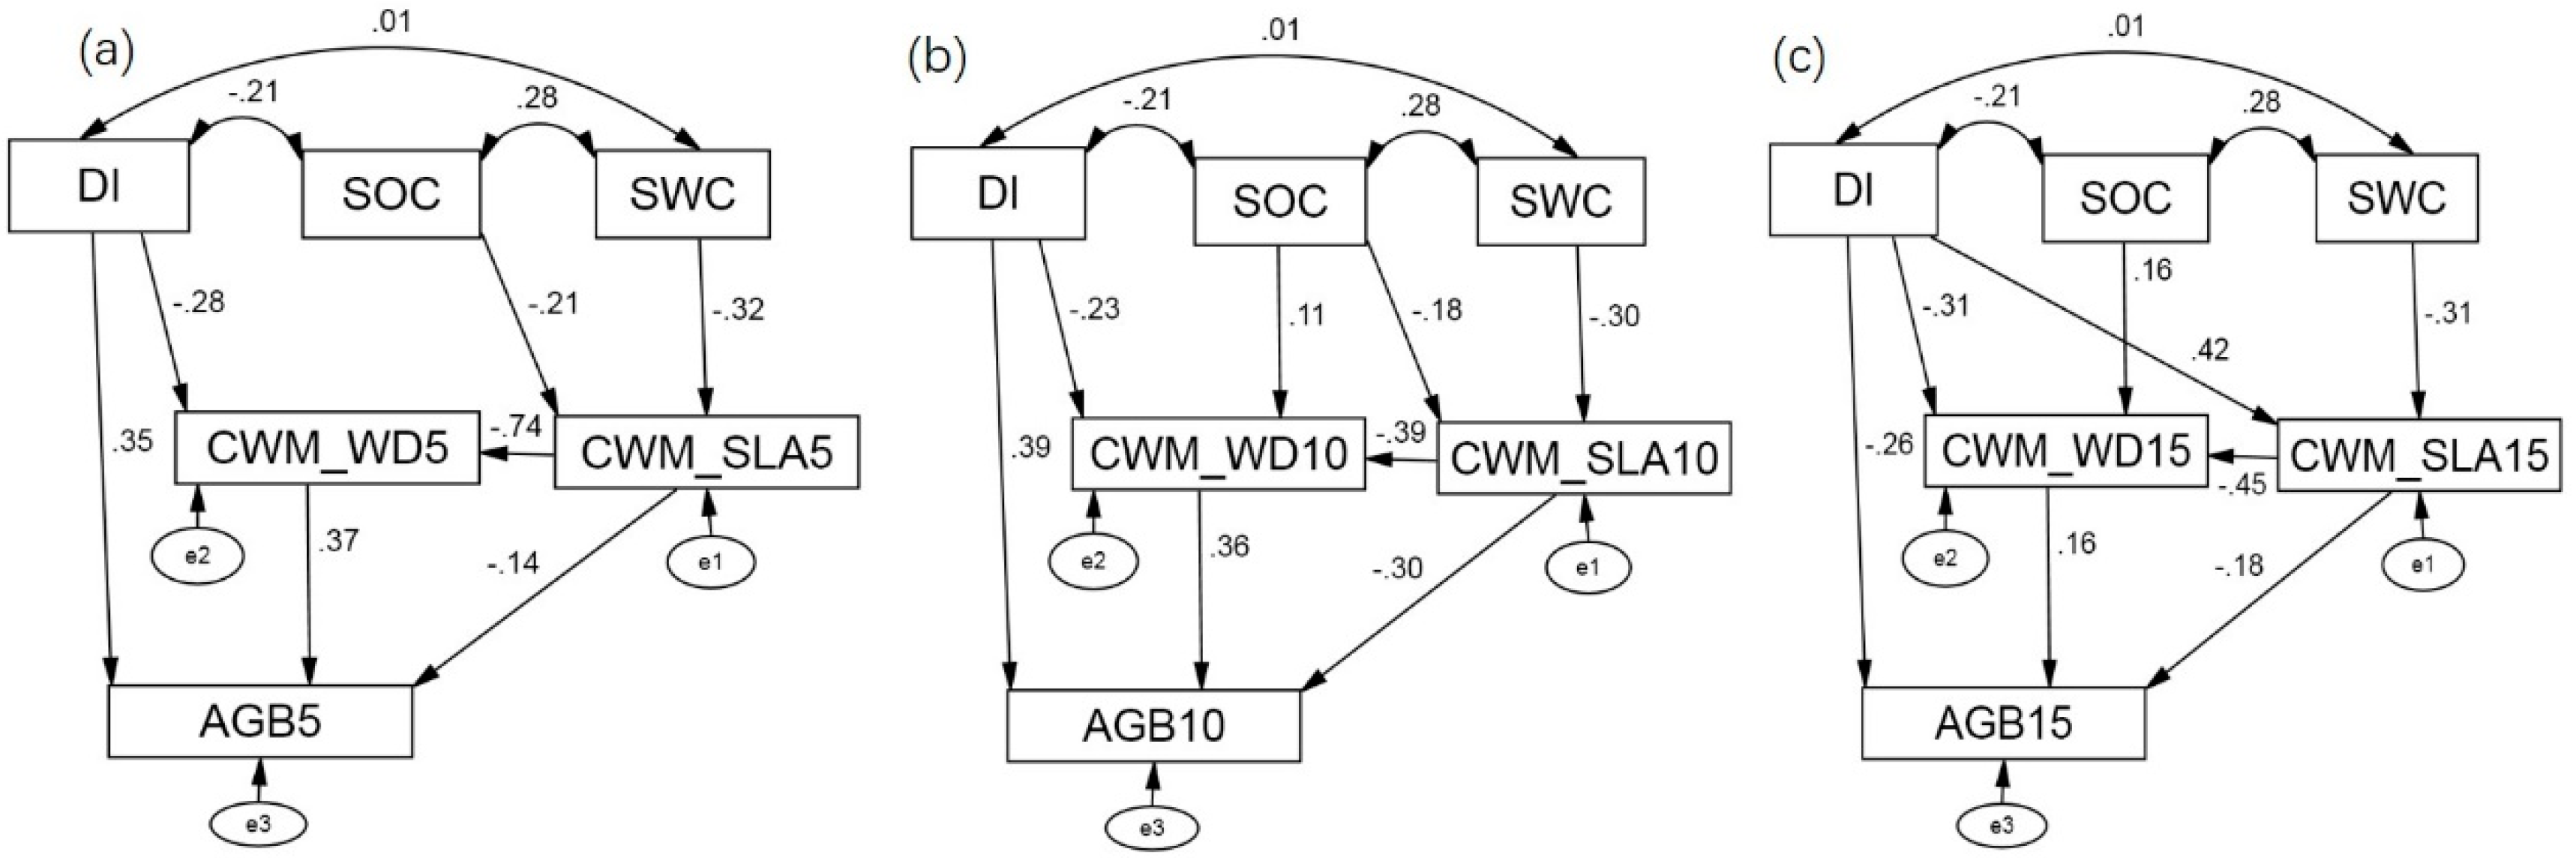
3.3. Linkage between Environmental Conditions and Aboveground Biomass through Functional Traits

3.3.1. Fitness of Model

The field data supported the final model for saplings (χ2 = 7.907, df = 5, p = 0.161, CMIN/df = 1.581, CFI = 0.975, RMSEA = 0.090). During comparison to the hypothesized model, three non-significant pathways (DI→CWM_SLA, SOC→CWM_WD, SWC→CWM_WD) were removed. The field data also supported the final treelets model (χ2 = 5.647, df = 4, p = 0.227, CMIN/df = 1.412, CFI = 0.976, RMSEA = 0.076). During comparison with the final saplings model, the pathway from soil organic carbon content to CWM_WD was added to the model. The final adult trees model also showed good consistency with the field data (χ2 = 3.632, df = 4, P = 0.458, CMIN/df = 0.908, CFI = 1.000, RMSEA = 0.000). During comparison with the final treelets model, the pathway from disturbance intensities to CWM_SLA was added to the model, while the pathway from soil organic carbon content to CWM_SLA was removed. These final models explained 28%, 38%, and 25% variation in AGB for the saplings, treelets, and adult trees models, respectively. The SEM revealed both direct and indirect effects between environmental conditions, functional traits and AGB. Direct effects can be visualized in Figure 5; indirect effects occur if two variables are connected through paths to and from a third variable. Total effects are calculated from the combined direct and indirect effects (Table 1).

3.3.2. Direct Effects

AGB of saplings and treelets were positively related to disturbance intensity (0.35 for saplings in Figure 5a and 0.39 for treelets in Figure 5b), whereas AGB of adult trees was negatively related to disturbance intensity (−0.26 in Figure 5c). Disturbance intensity always had a negative effect on CWM_WD. Disturbance intensity had a positive effect on CWM_SLA in the adult trees model but it did not have any significant effect on CWM_SLA in the saplings and treelets models. Soil organic carbon content had a weak positive relationship to CWM_WD in the treelets and adult trees models, while no significant relationship was found in the saplings model. Soil organic carbon content had a negative effect on CWM_SLA in the saplings and treelets models, while no significant effects were found in the adult trees model. Soil water content consistently had a negative effect on CWM_SLA in all size classes. CWM_SLA always had a strong negative relationship to CWM_WD. CWM_WD always positively affected AGB, in contrast to CWM_SLA.

3.3.3. Indirect and Total Effects

Several direct paths of the initial model proved a non-significant relation, such as SOC→CWM_WD5 and SWC→CWM_WD in all size classes (Table 1). However, most of them showed significant total effects. Soil organic carbon content had a weak effect on CWM_WD through its effect on CWM_SLA in the saplings model and soil water content also had a weak effect on CWM_WD through their effect on CWM_SLA in all size classes. Through their effects on functional traits (CWM_SLA and CWM_WD), soil organic carbon content and soil water content had a positive but weak effect on AGB. For total effects, CWM_SLA was mainly affected by soil water content in the saplings and treelets models while CWM_SLA was mainly affected by disturbance intensity in the adult trees model. CWM_WD was mostly influenced by CWM_SLA in the saplings and treelets models while it was mostly influenced by CWM_SLA and disturbance intensity in the adult trees model. AGB was mainly constrained by CWM_SLA (−0.417 for saplings and −0.444 for treelets) and CWM_WD (0.368 for saplings and 0.361 for treelets) in the saplings and treelets models whereas it was mainly constrained by disturbance intensity (−0.417) and CWM_SLA (−0.255) in the adult trees model. Though direct effect of disturbance intensity on AGB in the adult trees model was less than that in saplings and treelets models, the total effect of disturbance intensity on AGB was larger than that in the saplings and treelets models.
Overall, disturbance intensity had a positive effect on AGB in saplings and treelets, contrary to a negative effect in adult trees, but it had the strongest total effect on AGB in adult trees. Disturbance intensity always had a negative effect on CWM_WD but it had a positive effect on CWM_SLA in adult trees. CWM_SLA and CWM_WD not only responded to environmental conditions (soil organic carbon content, soil water content and disturbance intensity) but also affected ecosystem functioning (AGB) in all size classes. CWM_SLA was a major driver of AGB by its direct effect and indirect effects through CWM_WD in all size classes. CWM_SLA had a stronger effect on AGB in saplings and treelets than that in adult trees. Therefore, our results indicate that CWM_SLA is a key trait that can be used to link the relationship between environmental conditions and AGB.

4. Discussion

4.1. Variations in Community Structure among Forests with Different Disturbance Intensities

The past history and legacy of land use can influence many aspects of vegetation recovery, and the most important consequence is often a change in species composition [38]. In this study, we did not find significant differences in species richness between forests with different disturbance intensities after 40 years of recovery. Species richness can recover if enough time passes after logging [39]. Stem densities of saplings and treelets gradually increased with increasing intensity of logging. Increasing light intensities after logging provided new micro-sites for trees to successfully grow and become established [40]. The high basal area of saplings and treelets in disturbed forest also suggests logging stimulates seedling establishment and some cut stumps to resprout. The reduced basal area with increasing intensity of logging indicates logging effects on basal area still exist, although these forests have recovered 40 years [41]. A study of the effects of logging on basal area showed the intensity of logging had an impact on the rate of forest recovery [42]. The positive effect of disturbance intensity on AGB of saplings and treelets but the negative effect of disturbance intensity on AGB of adult trees also suggests logging promoted forest regeneration but decreased AGB of adult trees. The positive effect of disturbance intensity on CWM_SLA in adult trees in combination with the non-significant effect of disturbance intensity on other size classes suggests disturbance generally provides essential regeneration niches for pioneer species [43]. These pioneer species had grown into adult trees, meanwhile some shade-tolerant species had been gradually been recruited to the community and grown into saplings and treelets over 40 years. The negative effect of disturbance intensity on CWM_WD may have been caused by two reasons. Firstly, individuals of species with high wood density were regularly harvested by logging. Secondly, species with high wood density occur almost exclusively in old-growth forests because low wood density species generally have higher mortality rates [32].

4.2. The Relationships between Community Mean Traits among Forests with Different Disturbance Intensities

The negative effect of CWM_SLA on CWM_WD may be part of a whole-plant strategy since species with larger specific leaf area have faster volumetric growth and lower wood density [44]. Leaf properties associated with wood density included stomatal conductance, specific leaf area, and osmotic potential at the turgor loss point, which decreased linearly with increasing wood density [45]. Species and individuals with thicker leaves (lower specific leaf area) lost turgor at more negative values of leaf water potential than species and individuals with thinner leaves. Therefore, species and individuals with denser wood tended to have leaves with lower turgor loss points and specific leaf area. The larger correlation coefficient between CWM_SLA and CWM_WD with increasing intensity of logging may be due to the higher proportion of pioneer species (high specific leaf area and low wood density) with increasing intensity of logging. We also found that the more variation of CWM_WD in sapling was explained by CWM_SLA. SLA may be more important for light interception of saplings, for which it determines the total leaf area and leaf area ratio to a large extent, but SLA may be less important for large trees, for which leaf area and light interception are largely determined by branching patterns, the number of meristems, and tree architecture [46].

4.3. Linkage between Environmental Conditions and Aboveground Biomass through Functional Traits

Consistent with our hypothesis, functional traits at community level successfully respond to soil properties and disturbance histories. Functional traits are defined as morphological or physiological characteristics which influence species’ responses to different environmental conditions [8]. The significant effect of soil water content on CWM_SLA in tropical montane rainforest demonstrated leaf functional traits at the community level are affected by soil moisture, e.g., specific leaf area decreases in forest succession that become drier over time (initially very wet), while it increases in forest succession that become wetter over time (initially very dry) [47]. A weak negative effect of soil organic carbon content on CWM_SLA was found in saplings and treelets. The quality of soil organic carbon content affected leaf traits, because it determines energy and nutrient sources for soil biota [48]. The weak and positive effect of soil organic carbon content on CWM_WD in tropical montane rainforest indicates CWM_WD may increase with increased soil nutrient availability. Douma et al. also found wood density increased from poor to rich soil nutrients during succession across a wide range of NW European ecosystems [47]. This positive effect of soil organic carbon content on CWM_WD suggests communities transform to a conservative strategy in old-growth forest. Though soil water content did not have any direct effect on CWM_WD, it had an indirect effect on CWM_WD through its effect on CWM_SLA.
Furthermore, functional traits in community level also successfully affect ecosystem functioning. Leaf economics spectrum is structured by traits associated with metabolic rates, carbon and nutrient turnover rates [49]. Although SLA is positively related to photosynthetic capacity [27] and leaf photosynthetic product transports to stems, CWM_SLA still negatively affected AGB in the tropical montane rainforest. This negative effect suggested that carbon pools increased with the shift to more conservative strategies [50]. For total effects, CWM_SLA always had the strongest effect on AGB in all size classes, expect for disturbance intensity in the adult trees model since it had a strong indirect effect through its effect on CWM_WD. The higher total effect of CWM_SLA on AGB in saplings and treelets when compared with that in adult trees indicates that SLA may be important for the performance of small size plants. Leaf has a large impact on the survival of small size plants [51], but is less important for the performance of large trees that have substantial reserves to the photosynthetic biomass [52]. Overall, CWM_SLA not only responded to environmental conditions but also had a strongest effect on AGB in all size classes aside from the effect of anthropogenic disturbance. The major diver of AGB from SLA suggest SLA was a keystone of determining the relationship between environmental conditions and biomass [53]. Because wood density describes the carbon investment or carbon storage per unit volume of stem, the positive effect of CWM_WD on AGB suggests species with high lignin content tend to have higher carbon content [54]. Several studies showed CWM_WD played an important role in determining the regional variation of AGB [28,55]. The significant effect of community weighted mean traits on AGB is supported by the ‘mass ratio hypothesis’ [56], which postulates that trait values of the dominant species have proportionally more influence on ecosystem processes [57]. Some studies proved functional traits of the dominant species had the largest impact on ecosystem processes [34,58]. This significant effect of community weighted mean traits even partly confirms the effects of biodiversity on ecosystem functioning [5], since community weighted mean traits are related to species identity and their abundances. Leaf traits and stem traits at the community level can respond to environmental conditions and affect ecosystem functioning, which indicates that trait trade-offs across forest succession or other management gradients should result in feedbacks to ecosystem functioning through plant-soil interactions [50].
Three groups of explanatory factors (climate, soil, and community structure) have been proposed to explain regional spatial variation of AGB in tropical forests [59]. Climate factors were excluded in this study because of its small scale and uniform forest type. We found soil organic carbon content and soil water content were weakly but positively related to AGB in a tropical rainforest through their effects on CWM_SLA (Table 1). The positive effect of soil organic carbon content on AGB (Table 1) suggests AGB may be limited by soil nutrient availability [60]. Likewise, AGB increased with soil moisture [61]. A positive interaction between soil water content and nutrient supply could also be driving the biomass accumulation process in high elevation forest sites, since local topography may be an important factor controlling nutrient distribution and soil drainage [62].

5. Conclusions

The relative sizes of indirect (via functional traits) vs. direct (via abiotic constraints) effects on ecosystem functioning in a rapidly changing world still needs to be evaluated. By comparing the effects with indirect effects in these SEM, we found functional traits always had a stronger effect on AGB than environmental constraints. This result suggests functional traits at the community level are a major driver of ecosystem functioning, meanwhile CWM_SLA is a key trait that can be used to link the relationship between environmental conditions and ecosystem functioning. Therefore, linkage between environmental conditions and aboveground biomass through functional traits may provide a new insight into understanding the impact of environmental conditions on aboveground biomass. This type of information is essential to provide ecologists with the tool to transfer BEF knowledge to conservation and ecosystem management.

Supplementary Materials

The following are available online at https://0-www-mdpi-com.brum.beds.ac.uk/1999-4907/10/9/774/s1, Table S1: Basic messages of forests with different disturbance intensities, Table S2: Correlations among soil physical properties parameters. All below tables presents correlation coefficients associated with a Pearson’s correlation test for the 73 plots. *** indicates p < 0.001, ** indicates 0.001 < p < 0.01, * indicates 0.01 < p < 0.05, ns indicates p > 0.05, Table S3: Correlations among soil chemical properties parameters, Table S4: Correlations among community functional trait parameters for saplings, Table S5: Correlations among community functional trait parameters for treelets, Table S6: Correlations among community functional trait parameters for adult trees.

Author Contributions

Conceptualization, R.Z. and H.X.; methodology and formal analysis, W.B., C.Z., J.H. and J.W.; investigation, H.X. and M.L.; data curation, W.B. and Y.D.; writing, W.B. and C.Z.

Funding

This research was funded by the National Natural Science Foundation of China (31760134), the Fundamental Research Funds for the Central Non-profit Research Institution of CAF (CAFBB2017ZB004) and Natural Science Foundation of Jiangxi (20171BAB214032).

Acknowledgments

We thank Ruming Peng, Jiansheng Zhou and Wensheng Liang from Jianfengling Natural Reserve for their help in conducting field work.

Conflicts of Interest

The authors declare no conflict of interest.

References

  1. Millennium Ecosystem Assessment. Ecosystems and Human Well-Being; Island Press: Washington, DC, USA, 2005. [Google Scholar]
  2. Hooper, D.U.; Adair, E.C.; Cardinale, B.J.; Byrnes, J.E.K.; Hungate, B.A.; Matulich, K.L.; Gonzalez, A.; Duffy, J.E.; Gamfeldt, L.; O’Connor, M.I. A global synthesis reveals biodiversity loss as a major driver of ecosystem change. Nature 2012, 486, 105–108. [Google Scholar] [CrossRef] [PubMed]
  3. Cardinale, B.J.; Matulich, K.L.; Hooper, D.U.; Byrnes, J.E.; Duffy, E.; Gamfeldt, L.; Balvanera, P.; O’Connor, M.I.; Gonzalez, A.; O’Connor, M.I. The functional role of producer diversity in ecosystems. Am. J. Bot. 2011, 98, 572–592. [Google Scholar] [CrossRef] [PubMed] [Green Version]
  4. Paquette, A.; Messier, C. The effect of biodiversity on tree productivity: From temperate to boreal forests. Glob. Ecol. Biogeogr. 2011, 20, 170–180. [Google Scholar] [CrossRef]
  5. Cardinale, B. Impacts of Biodiversity Loss. Science 2012, 336, 552–553. [Google Scholar] [CrossRef] [PubMed]
  6. Petchey, O.L. On the statistical significance of functional diversity effects. Funct. Ecol. 2004, 18, 297–303. [Google Scholar] [CrossRef]
  7. McGill, B.; Enquist, B.; Weiher, E.; Westoby, M. Rebuilding community ecology from functional traits. Trends Ecol. Evol. 2006, 21, 178–185. [Google Scholar] [CrossRef] [PubMed]
  8. Violle, C.; Navas, M.-L.; Vile, D.; Kazakou, E.; Fortunel, C.; Hummel, I.; Garnier, E. Let the concept of trait be functional! Oikos 2007, 116, 882–892. [Google Scholar] [CrossRef]
  9. Messier, J.; McGill, B.J.; Lechowicz, M.J. How do traits vary across ecological scales? A case for trait-based ecology. Ecol. Lett. 2010, 13, 838–848. [Google Scholar] [CrossRef]
  10. Keddy, P.A. Assembly and response rules: Two goals for predictive community ecology. J. Veg. Sci. 1992, 3, 157–164. [Google Scholar] [CrossRef]
  11. Ackerly, D. Functional strategies of chaparral shrubs in relation to seasonal water deficit and disturbance. Ecol. Monogr. 2004, 74, 25–44. [Google Scholar] [CrossRef]
  12. Katabuchi, M.; Kurokawa, H.; Davies, S.J.; Tan, S.; Nakashizuka, T. Soil resource availability shapes community trait structure in a species-rich dipterocarp forest. J. Ecol. 2011, 100, 643–651. [Google Scholar] [CrossRef]
  13. Suding, K.N.; Lavorel, S.; Chapin, F.S.; Cornelissen, J.H.C.; Díaz, S.; Garnier, E.; Goldberg, D.; Hooper, D.U.; Jackson, S.T.; Navas, M.-L. Scaling environmental change through the community-level: A trait-based response-and-effect framework for plants. Glob. Change Boil. 2008, 14, 1125–1140. [Google Scholar] [CrossRef]
  14. Grace, J.B. Structural Equation Modeling and Natural Systems; Cambridge University Press: London, UK, 2006. [Google Scholar]
  15. Shipley, B. Cause and Correlation in Biology: A User’s Guide to Path Analysis, Structural Equations and Causal Inference; Cambridge University Press: London, UK, 2002. [Google Scholar]
  16. De Bello, F.; Lavorel, S.; Díaz, S.; Harrington, R.; Cornelissen, J.H.C.; Bardgett, R.D.; Berg, M.P.; Cipriotti, P.; Feld, C.K.; Hering, D.; et al. Towards an assessment of multiple ecosystem processes and services via functional traits. Biodivers. Conserv. 2010, 19, 2873–2893. [Google Scholar] [CrossRef]
  17. Ding, Y.; Zang, R.; Liu, S.; He, F.; Letcher, S.G. Recovery of woody plant diversity in tropical rain forests in southern China after logging and shifting cultivation. Boil. Conserv. 2012, 145, 225–233. [Google Scholar] [CrossRef]
  18. Jiang, Y.X.; Wang, B.S.; Zang, R.G.; Jin, J.H.; Liao, W.B. Tropical Forest Biodiversity and Its Forming Mechanism in Hainan Island; Science Press: Beijing, China, 2002. [Google Scholar]
  19. Zang, R.G.; An, S.Q.; Tao, J.Q. Mechanism of Biodiversity Maintenance of Tropical Forests in Hainan ISLAND; Science Press: Beijing, China, 2004. [Google Scholar]
  20. Editorial Committee of Flora of China. Flora Reipublicae Popularis Sinicae; Chinese Edition of Flora of China; Science Press: Beijing, China, 2004. [Google Scholar]
  21. Zhang, W.R.; Yang, G.C.; Tu, X.N. The Forestry Industry Standard of the People’s Republic of China-Determination of Forest Soil; China Standard Press: Beijing, China, 1999. [Google Scholar]
  22. Cornelissen, J.H.C.; Lavorel, S.; Garnier, E.; Díaz, S.; Buchmann, N.; Gurvich, D.E.; Reich, P.B.; Ter Steege, H.; Morgan, H.D.; Van Der Heijden, M.G.A.; et al. A handbook of protocols for standardised and easy measurement of plant functional traits worldwide. Aust. J. Bot. 2003, 51, 335–380. [Google Scholar] [CrossRef] [Green Version]
  23. R Core Team. R: A Language and Environment for Statistical Computing. Available online: https://www.R-project.org/ (accessed on 30 July 2014).
  24. Villéger, S.; Mason, N.W.H.; Mouillot, D. New multidimensional functional diversity indices for a multifaceted framework in functional ecology. Ecology 2008, 89, 2290–2301. [Google Scholar] [CrossRef]
  25. Chave, J.; Réjou-Méchain, M.; Búrquez, A.; Chidumayo, E.; Colgan, M.S.; Delitti, W.B.; Duque, A.; Eid, T.; Fearnside, P.M.; Goodman, R.C.; et al. Improved allometric models to estimate the aboveground biomass of tropical trees. Glob. Change Boil. 2014, 20, 3177–3190. [Google Scholar] [CrossRef]
  26. Moles, A.T.; Westoby, M.; Falster, D.S.; Vesk, P.A.; Wright, I.J. Plant ecological strategies: Some leading dimensions of variation between species. Annu. Rev. Ecol. Syst. 2002, 33, 125–159. [Google Scholar]
  27. Wright, I.J.; Reich, P.B.; Westoby, M.; Ackerly, D.D.; Baruch, Z.; Bongers, F.; Cavender-Bares, J.; Chapin, T.; Cornelissen, J.H.C.; Diemer, M.; et al. The worldwide leaf economics spectrum. Nature 2004, 428, 821–827. [Google Scholar] [CrossRef]
  28. Chave, J.; Coomes, D.; Jansen, S.; Lewis, S.L.; Swenson, N.G.; Zanne, A.E. Towards a worldwide wood economics spectrum. Ecol. Lett. 2009, 12, 351–366. [Google Scholar] [CrossRef]
  29. Ordoñez, J.C.; Van Bodegom, P.M.; Witte, J.-P.M.; Wright, I.J.; Reich, P.B.; Aerts, R. A global study of relationships between leaf traits, climate and soil measures of nutrient fertility. Glob. Ecol. Biogeogr. 2009, 18, 137–149. [Google Scholar] [CrossRef]
  30. Pidgen, K.; Mallik, A.U. Ecology of Compounding Disturbances: The Effects of Prescribed Burning After Clearcutting. Ecosystems 2012, 16, 170–181. [Google Scholar] [CrossRef]
  31. Nishimura, T.B.; Suzuki, E.; Kohyama, T.; Tsuyuzaki, S. Mortality and growth of trees in peat-swamp and heath forests in Central Kalimantan after severe drought. Plant Ecol. 2007, 193, 165–177. [Google Scholar] [CrossRef]
  32. Slik, J.W.F.; Bernard, C.S.; Breman, F.C.; Van Beek, M.; Salim, A.; Sheil, D. Wood Density as a Conservation Tool: Quantification of Disturbance and Identification of Conservation-Priority Areas in Tropical Forests. Conserv. Boil. 2008, 22, 1299–1308. [Google Scholar] [CrossRef] [PubMed]
  33. Cornelissen, J.H.C.; Van Logtestijn, R.S.P.; Freschet, G.T.; Aerts, R. Substantial nutrient resorption from leaves, stems and roots in a subarctic flora: What is the link with other resource economics traits? New Phytol. 2010, 186, 879–889. [Google Scholar]
  34. Mokany, K.; Ash, J.; Roxburgh, S. Functional identity is more important than diversity in influencing ecosystem processes in a temperate native grassland. J. Ecol. 2008, 96, 884–893. [Google Scholar] [CrossRef]
  35. Chao, K.-J.; Phillips, O.L.; Gloor, E.; Monteagudo, A.; Martinez, R.V.; Torres-Lezama, A.; Torres-Lezama, A. Growth and wood density predict tree mortality in Amazon forests. J. Ecol. 2008, 96, 281–292. [Google Scholar] [CrossRef]
  36. Meigs, G.W.; Donato, D.C.; Campbell, J.L.; Martin, J.G.; Law, B.E. Forest Fire Impacts on Carbon Uptake, Storage, and Emission: The Role of Burn Severity in the Eastern Cascades, Oregon. Ecosystems 2009, 12, 1246–1267. [Google Scholar] [CrossRef]
  37. Byrne, B. Structural Equation Modeling with AMOS: Basic Concepts, Applications, and Programming; Lawrence Erlbaum Associates: Copenhagen, Denmark, 2001. [Google Scholar]
  38. Chazdon, R.L. Tropical forest recovery: Legacies of human impact and natural disturbances. Perspect. Plant Ecol. Evol. Syst. 2003, 6, 51–71. [Google Scholar] [CrossRef]
  39. Letcher, S.G.; Chazdon, R.L. Rapid Recovery of Biomass, Species Richness, and Species Composition in a Forest Chronosequence in Northeastern Costa Rica. Biotropica 2009, 41, 608–617. [Google Scholar] [CrossRef] [Green Version]
  40. Cannon, C.H.; Peart, D.R.; Leighton, M. Tree Species Diversity in Commercially Logged Bornean Rainforest. Science 1998, 281, 1366–1368. [Google Scholar] [CrossRef] [PubMed] [Green Version]
  41. Fredeen, A.L.; Bois, C.H.; Janzen, D.T.; Sanborn, P.T. Comparison of coniferous forest carbon stocks between old-growth and young second-growth forests on two soil types in central British Columbia, Canada. Can. J. For. Res. 2005, 35, 1411–1421. [Google Scholar] [CrossRef]
  42. Bonnell, T.R.; Reyna-Hurtado, R.; Chapman, C.A. Post-logging recovery time is longer than expected in an East African tropical forest. For. Ecol. Manag. 2011, 261, 855–864. [Google Scholar] [CrossRef]
  43. Chazdon, R.L. Chance and Determinism in Tropical Forest Succession; Wiley-Blackwell Publishing: Boston, MA, USA, 2008. [Google Scholar]
  44. Wright, I.J.; Ackerly, D.D.; Bongers, F.; Harms, K.E.; Ibarra-Manriquez, G.; Martinez-Ramos, M.; Mazer, S.J.; Muller-Landau, H.C.; Paz, H.; Pitman, N.C.; et al. Relationships among ecologically important dimensions of plant trait variation in seven neotropical forests. Ann. Bot.-Lond. 2007, 99, 1003–1015. [Google Scholar] [CrossRef] [PubMed]
  45. Bucci, S.J.; Scholz, F.G.; Franco, A.C.; Bustamante, M.; Goldstein, G.; Meinzer, F. Functional convergence in hydraulic architecture and water relations of tropical savanna trees: From leaf to whole plant. Tree Physiol. 2004, 24, 891–899. [Google Scholar] [CrossRef] [PubMed]
  46. Sterck, F.J.; Bongers, F. Crown development in tropical rain forest trees: Patterns with tree height and light availability. J. Ecol. 2001, 89, 1–13. [Google Scholar] [CrossRef]
  47. Douma, J.C.; De Haan, M.W.A.; Aerts, R.; Witte, J.-P.M.; Van Bodegom, P.M. Succession-induced trait shifts across a wide range of NW European ecosystems are driven by light and modulated by initial abiotic conditions. J. Ecol. 2011, 100, 366–380. [Google Scholar] [CrossRef]
  48. Wardle, D.A.; Bardgett, R.D.; Klironomos, J.N.; Setälä, H.; Van Der Putten, W.H.; Wall, D.H. Ecological Linkages between Aboveground and Belowground Biota. Science 2004, 304, 1629–1633. [Google Scholar] [CrossRef]
  49. Reich, P.B.; Walters, M.B.; Ellsworth, D.S. From tropics to tundra: Global convergence in plant functioning. Proc. Natl. Acad. Sci. USA 1997, 94, 13730–13734. [Google Scholar] [CrossRef] [Green Version]
  50. De Deyn, G.B.; Cornelissen, J.H.C.; Bardgett, R.D. Plant functional traits and soil carbon sequestration in contrasting biomes. Ecol. Lett. 2008, 11, 516–531. [Google Scholar] [CrossRef]
  51. Pearson, T.R.H.; Burslem, D.F.R.P.; Goeriz, R.E.; Dalling, J.W. Interactions of gap size and herbivory on establishment, growth and survival of three species of neotropical pioneer trees. J. Ecol. 2003, 91, 785–796. [Google Scholar] [CrossRef]
  52. Würth, M.K.; Pelaez-Riedl, S.; Wright, S.J.; Körner, C. Non-structural carbohydrate pools in a tropical forest. Oecologia 2005, 143, 11–24. [Google Scholar] [CrossRef] [PubMed]
  53. Minden, V.; Kleyer, M. Testing the effect-response framework: Key response and effect traits determining above-ground biomass of salt marshes. J. Veg. Sci. 2011, 22, 387–401. [Google Scholar] [CrossRef]
  54. Thomas, S.; Malczewski, G. Wood carbon content of tree species in Eastern China: Interspecific variability and the importance of the volatile fraction. J. Environ. Manag. 2007, 85, 659–662. [Google Scholar] [CrossRef] [PubMed]
  55. Almeida, S.; Arroyo, L.; Erwin, T.; Killeen, T.J.; Laurance, S.G.; Laurance, W.F.; Lewis, S.L.; Lloyd, J.; Monteagudo, A.; Neill, D.A.; et al. Variation in wood density determines spatial patterns in Amazonian forest biomass. Glob. Change Boil. 2004, 10, 545–562. [Google Scholar]
  56. Grime, J.P. Benefits of plant diversity to ecosystems: Immediate, filter and founder effects. J. Ecol. 1998, 86, 902–910. [Google Scholar] [CrossRef]
  57. Laughlin, D.C. Nitrification is linked to dominant leaf traits rather than functional diversity. J. Ecol. 2011, 99, 1091–1099. [Google Scholar] [CrossRef]
  58. Thompson, K.; Askew, A.P.; Grime, J.P.; Dunnett, N.P.; Willis, A.J. Biodiversity, ecosystem function and plant traits in mature and immature plant communities. Funct. Ecol. 2005, 19, 355–358. [Google Scholar] [CrossRef]
  59. Baraloto, C.; Rabaud, S.; Molto, Q.; Blanc, L.; Fortunel, C.; Hérault, B.; Dávila, N.; Mesones, I.; Ríos, M.; Valderrama, E.; et al. Disentangling stand and environmental correlates of aboveground biomass in Amazonian forests. Glob. Change Boil. 2011, 17, 2677–2688. [Google Scholar] [CrossRef]
  60. Paoli, G.D.; Curran, L.M.; Slik, J.W.F. Soil nutrients affect spatial patterns of aboveground biomass and emergent tree density in southwestern Borneo. Oecologia 2008, 155, 287–299. [Google Scholar] [CrossRef]
  61. Comeau, P.G.; Kimmins, J.P. Above- and below-ground biomass and production of lodgepole pine on sites with differing soil moisture regimes. Can. J. For. Res. 1989, 19, 447–454. [Google Scholar] [CrossRef]
  62. De Castilho, C.V.; Magnusson, W.E.; De Araújo, R.N.O.; Luizão, R.C.; Luizão, F.J.; Lima, A.P.; Higuchi, N. Variation in aboveground tree live biomass in a central Amazonian Forest: Effects of soil and topography. For. Ecol. Manag. 2006, 234, 85–96. [Google Scholar] [CrossRef]
Figure 1. A map of the distribution of plots based on Xi’an 1980 geodetic coordinate system. Value in map is elevation. Circle indicates plot of old-growth forest, triangle indicates selective logging forest, plus indicates clear cutting forest.
Forests 10 00774 g001
Figure 2. The hypothesized structural equation model. DI indicates disturbance intensity. SPP and SCP indicate soil physical property and soil chemical property, respectively. LES and WES indicate leaf economics spectrum and wood economics spectrum at community level. AGB indicates aboveground biomass. One-headed arrows represent causal relationships, and double-headed arrows represent free correlations. Residual error variables (ei) represent effects of unexplained causes.
Forests 10 00774 g002
Figure 3. Comparisons of community composition and functional traits of different size classes among stands with different disturbance types (Mean ± SD). OG indicates old-growth stands, SF indicates secondary stands recovered from selective logging, and CF indicates secondary stands recovered from clear-cutting. Different letters differ significantly at p < 0.05.
Forests 10 00774 g003
Figure 4. Relationships between community mean wood density and specific leaf area of different size classes (CWM_SLA5 and CWM_WD5 for sapling, CWM_SLA10 and CWM_WD10 for treelet, CWM_SLA15 and CWM_WD15 for adult tree) among stands with different disturbance types.
Forests 10 00774 g004
Figure 5. The final structural equation models for aboveground biomass of saplings (a, DBH (diameter at breast height) ≤ 5 cm), treelets (b, 5 cm < DBH < 15 cm) and adult trees (c, DBH ≥ 15 cm). The model links successively the environmental parameter level (exogenous variables) to community-weighted mean traits and to ecosystem properties (endogenous variables). SWC and SOC indicate water content and organic carbon of soil. CWM_SLA and CWM_WD indicate specific leaf area and wood density at community level. Only significant regression weights between variables are shown (p < 0.05) and the value nearby arrows represents the standardized regression path coefficient.
Forests 10 00774 g005
Table 1. Standardized total (Tot.), direct (Dir.) and indirect effects (Ind.) of factors that influence functional traits and aboveground biomass (AGB). Path coefficients between variables are standardized partial regression coefficients. Total effects were calculated by adding direct and indirect effects. All effects were significant at p < 0.05.
DISOCSWCCWM_SLACWM_WD
Tot.Dir.Ind.Tot.Dir.Ind.Tot.Dir.Ind.Tot.Dir.Ind.Tot.Dir.Ind.
SaplingsCWM_SLA5 −0.212−0.212 −0.322−0.322
CWM_WD5−0.283−0.283 0.157 0.1570.239 0.239−0.742−0.742
AGB50.2490.354−0.1040.088 0.0880.134 0.134−0.417−0.144−0.2730.3680.368
TreeletsCWM_SLA10 −0.176−0.176 −0.296−0.296
CWM_WD10−0.232−0.232 0.1760.1080.0680.115 0.115−0.389−0.389
AGB100.3060.39−0.0840.117 0.1170.132 0.132−0.444−0.304−0.1410.3610.361
Adult treesCWM_SLA150.4220.422 −0.31−0.31
CWM_WD15−0.5−0.309−0.1910.1630.163 0.14 0.14−0.452−0.452
AGB15−0.417−0.259−0.1580.026 0.0260.079 0.079−0.255−0.182−0.0730.1620.162
Note: DI indicates disturbance intensity; SOC and SWC indicate soil organic carbon content and soil water content; CWM_SLA and CWM_WD represent for community mean wood density and specific leaf area.

