The Role of Climate Niche, Geofloristic History, Habitat Preference, and Allometry on Wood Density within a California Plant Community

Abstract
:1. Introduction
2. Materials and Methods
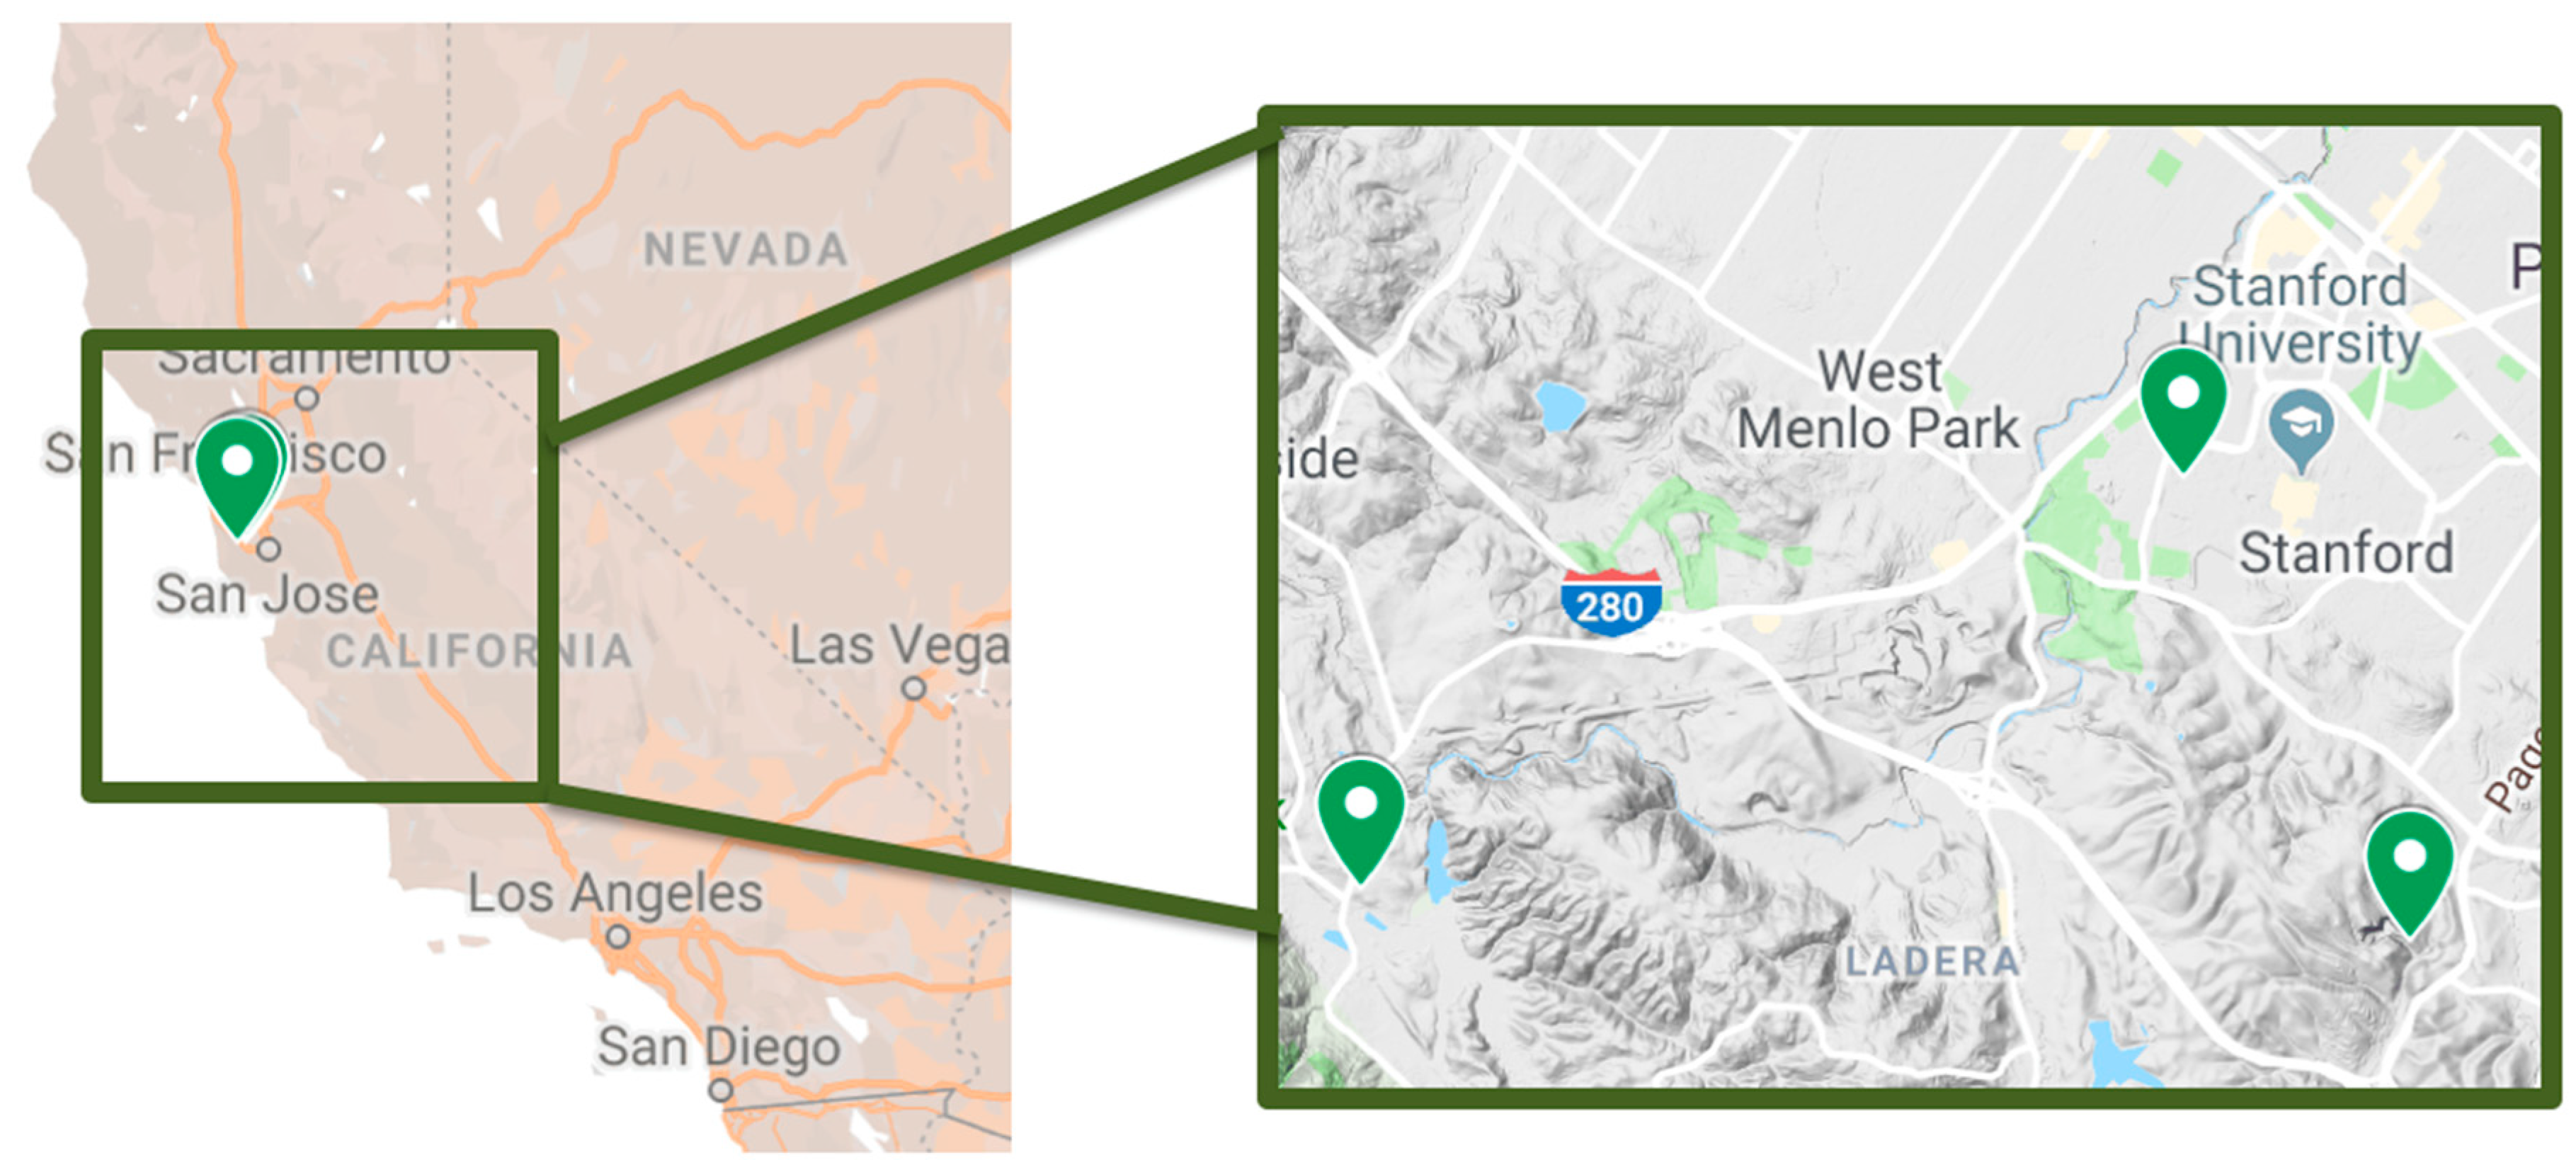
2.1. Study Site
2.2. Species Selection
2.3. Trait Measurement
2.4. Habitat Preferences
2.5. Paleohistory
2.6. Climate Data
2.7. Data Analysis
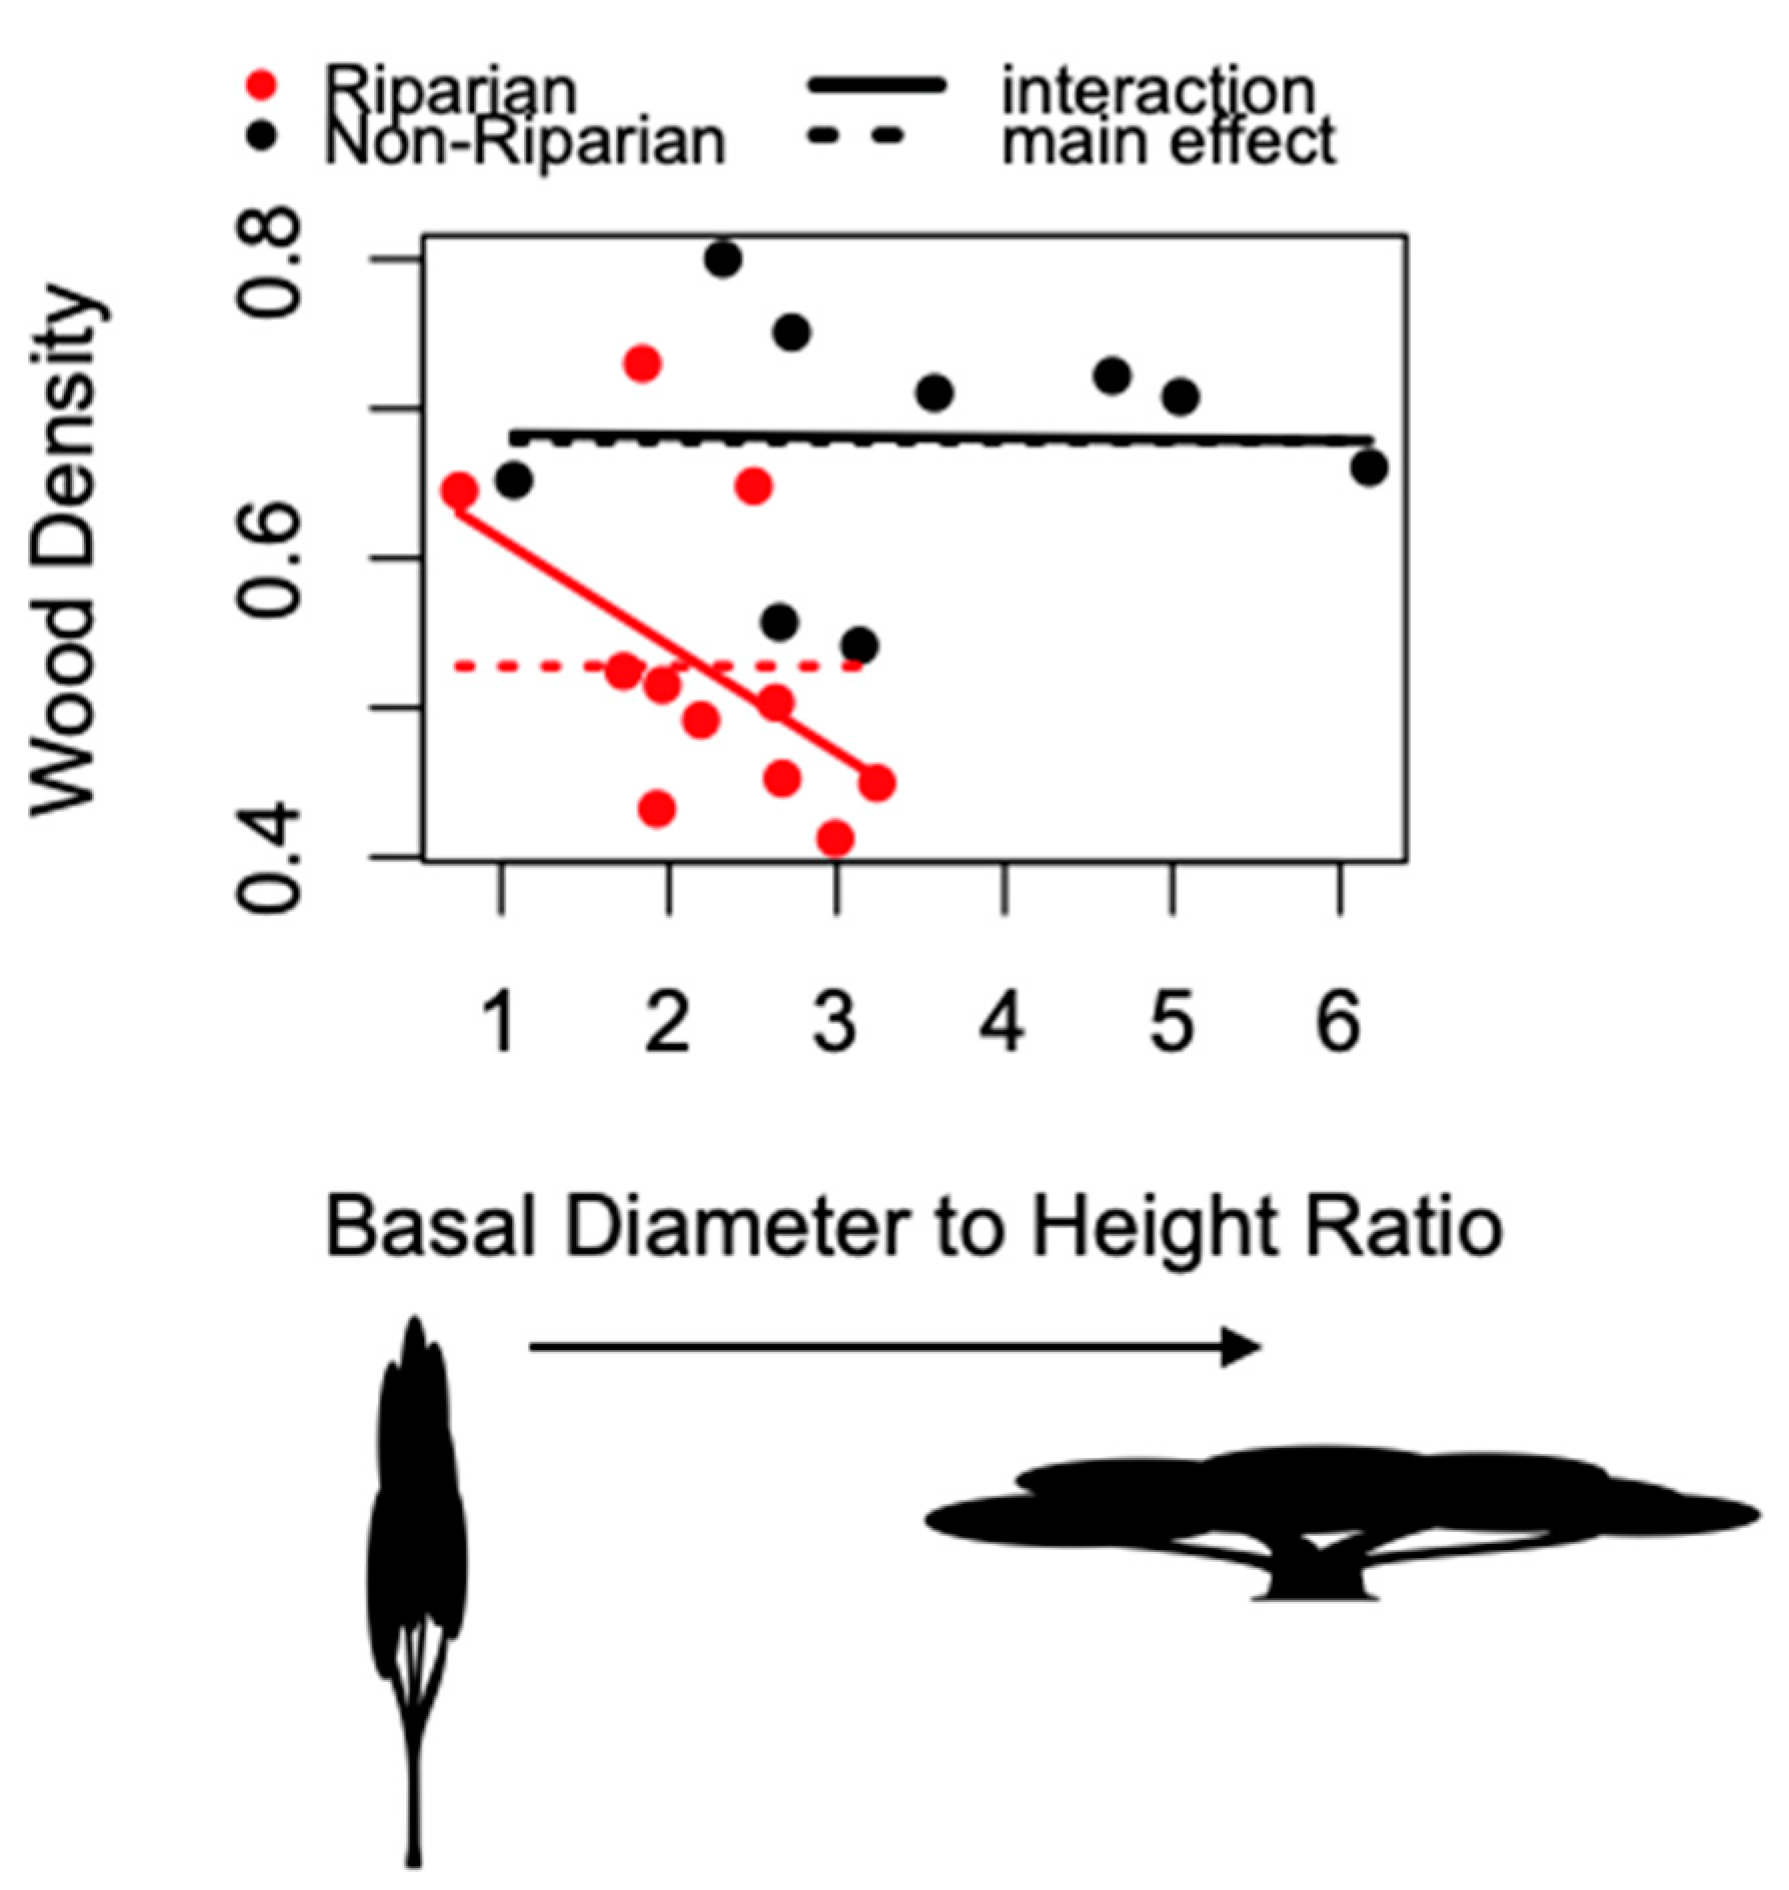
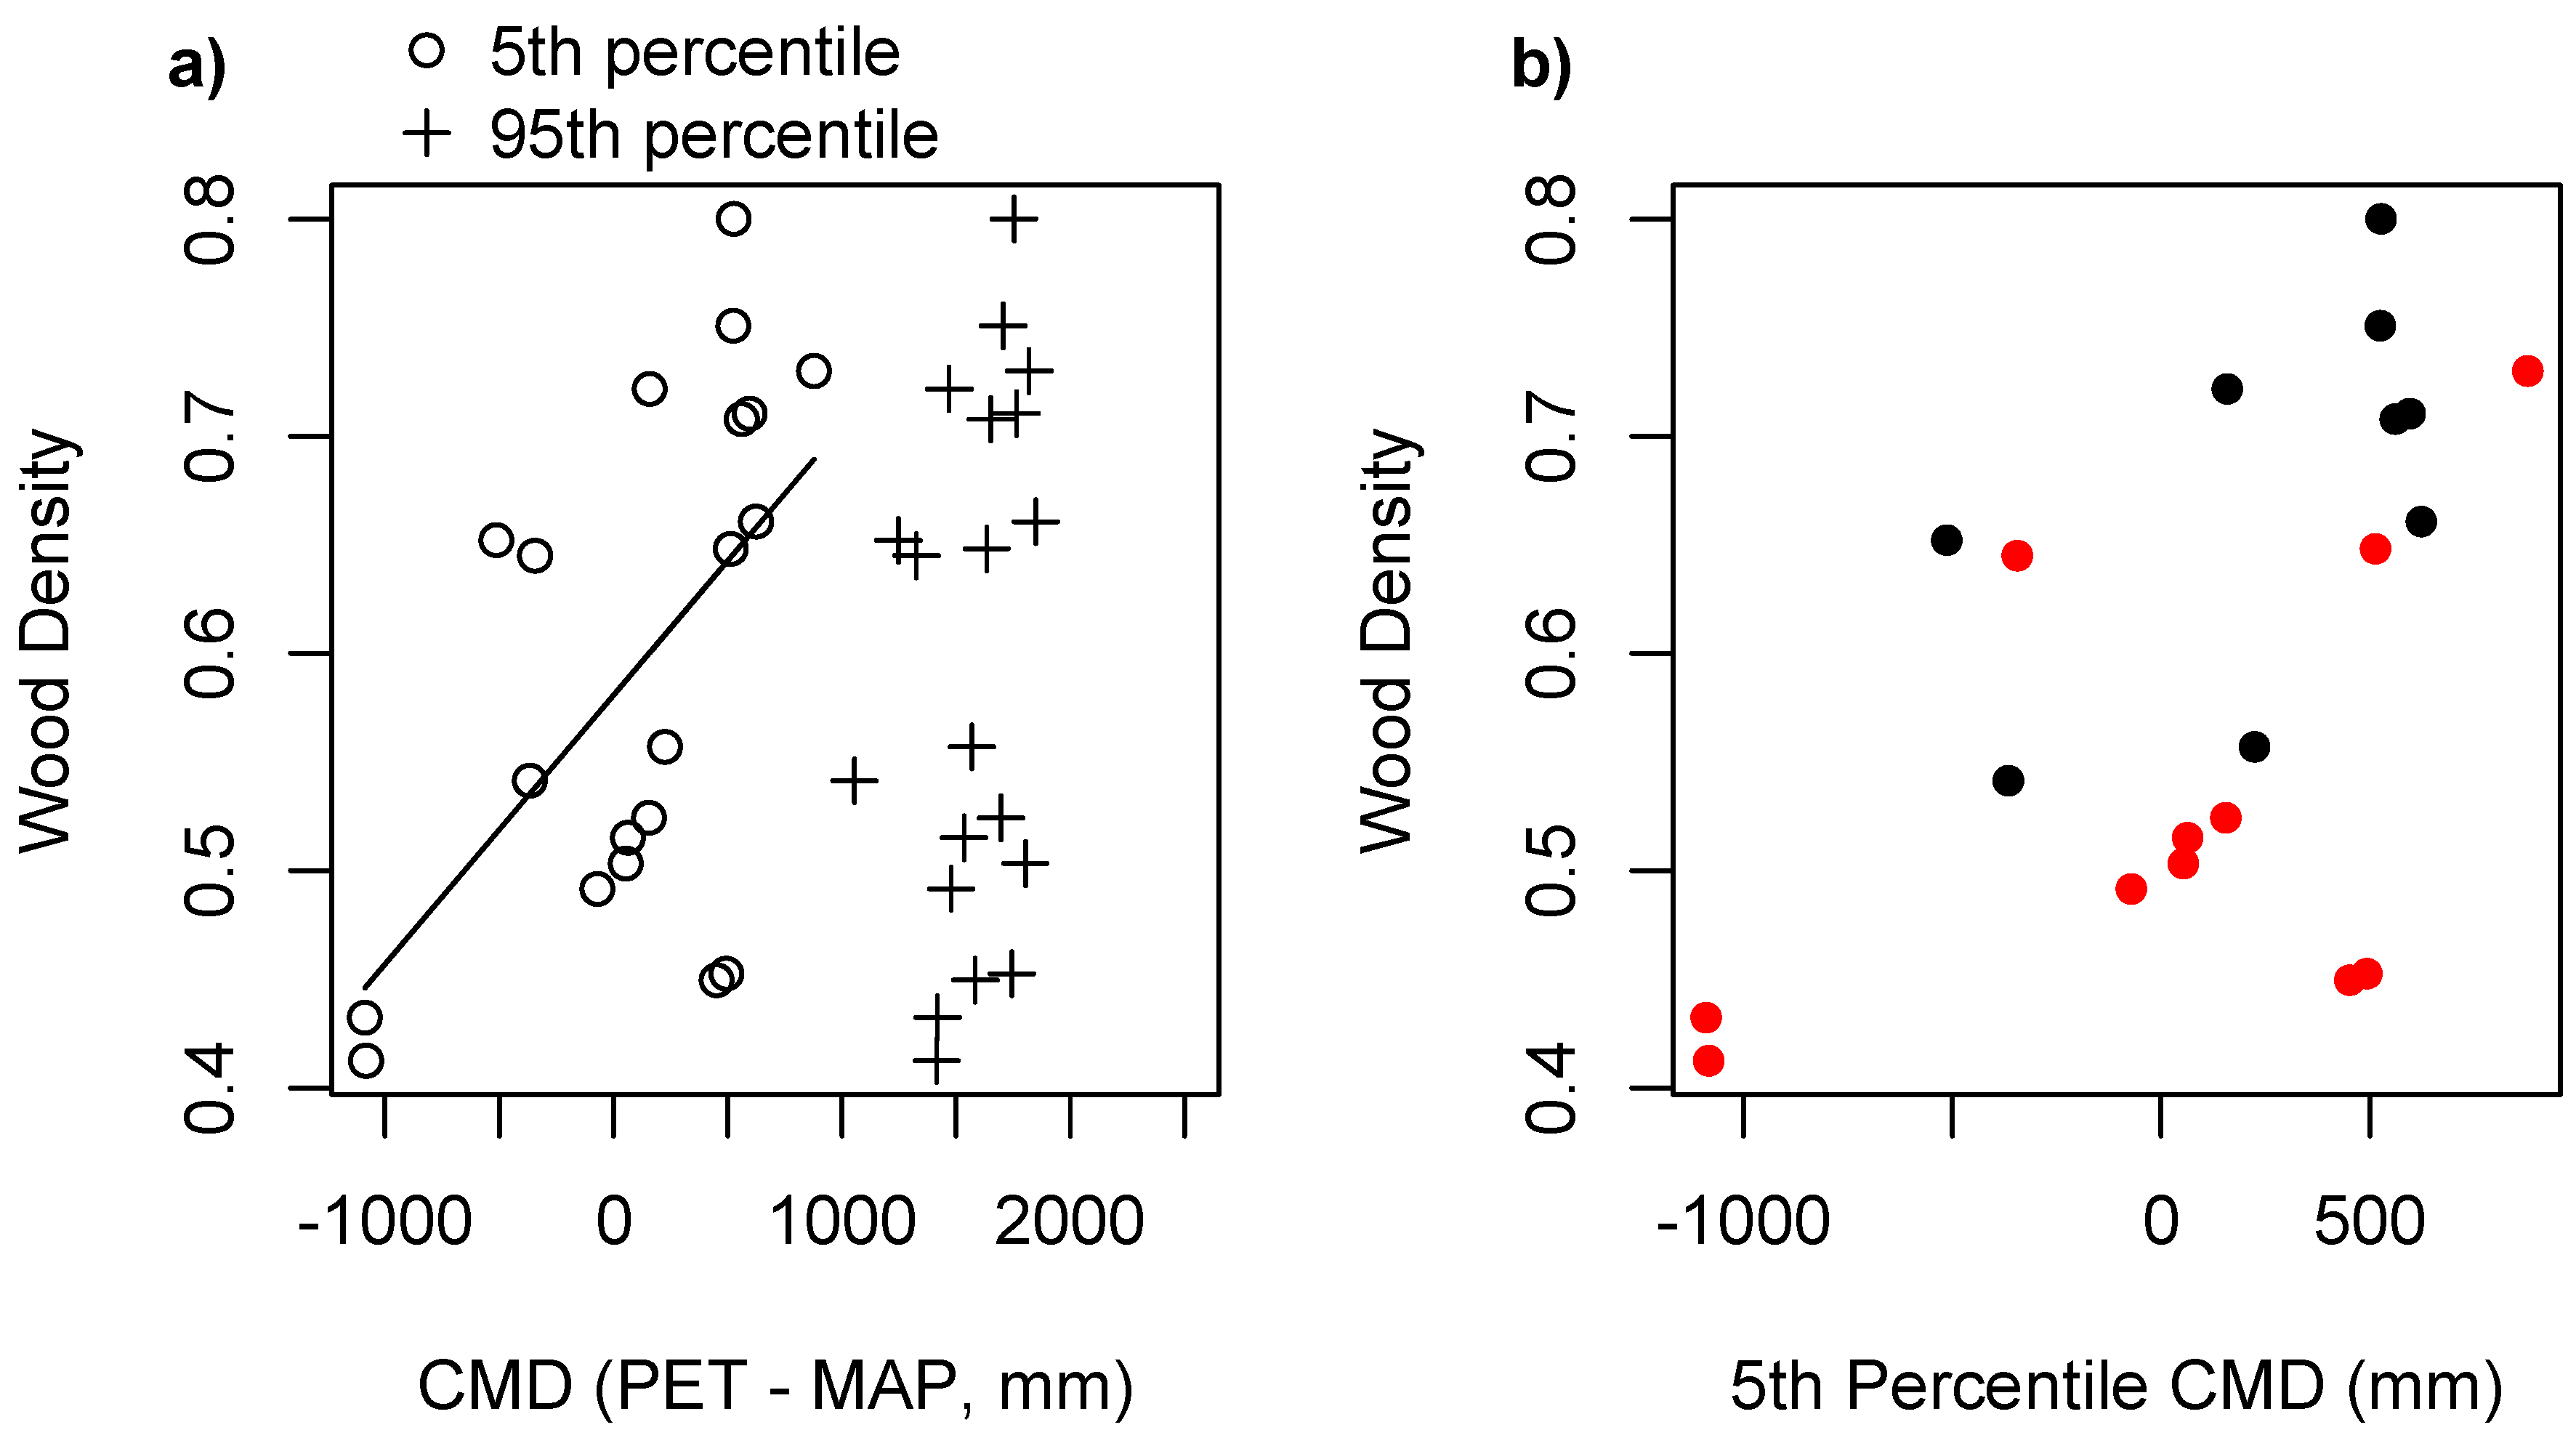
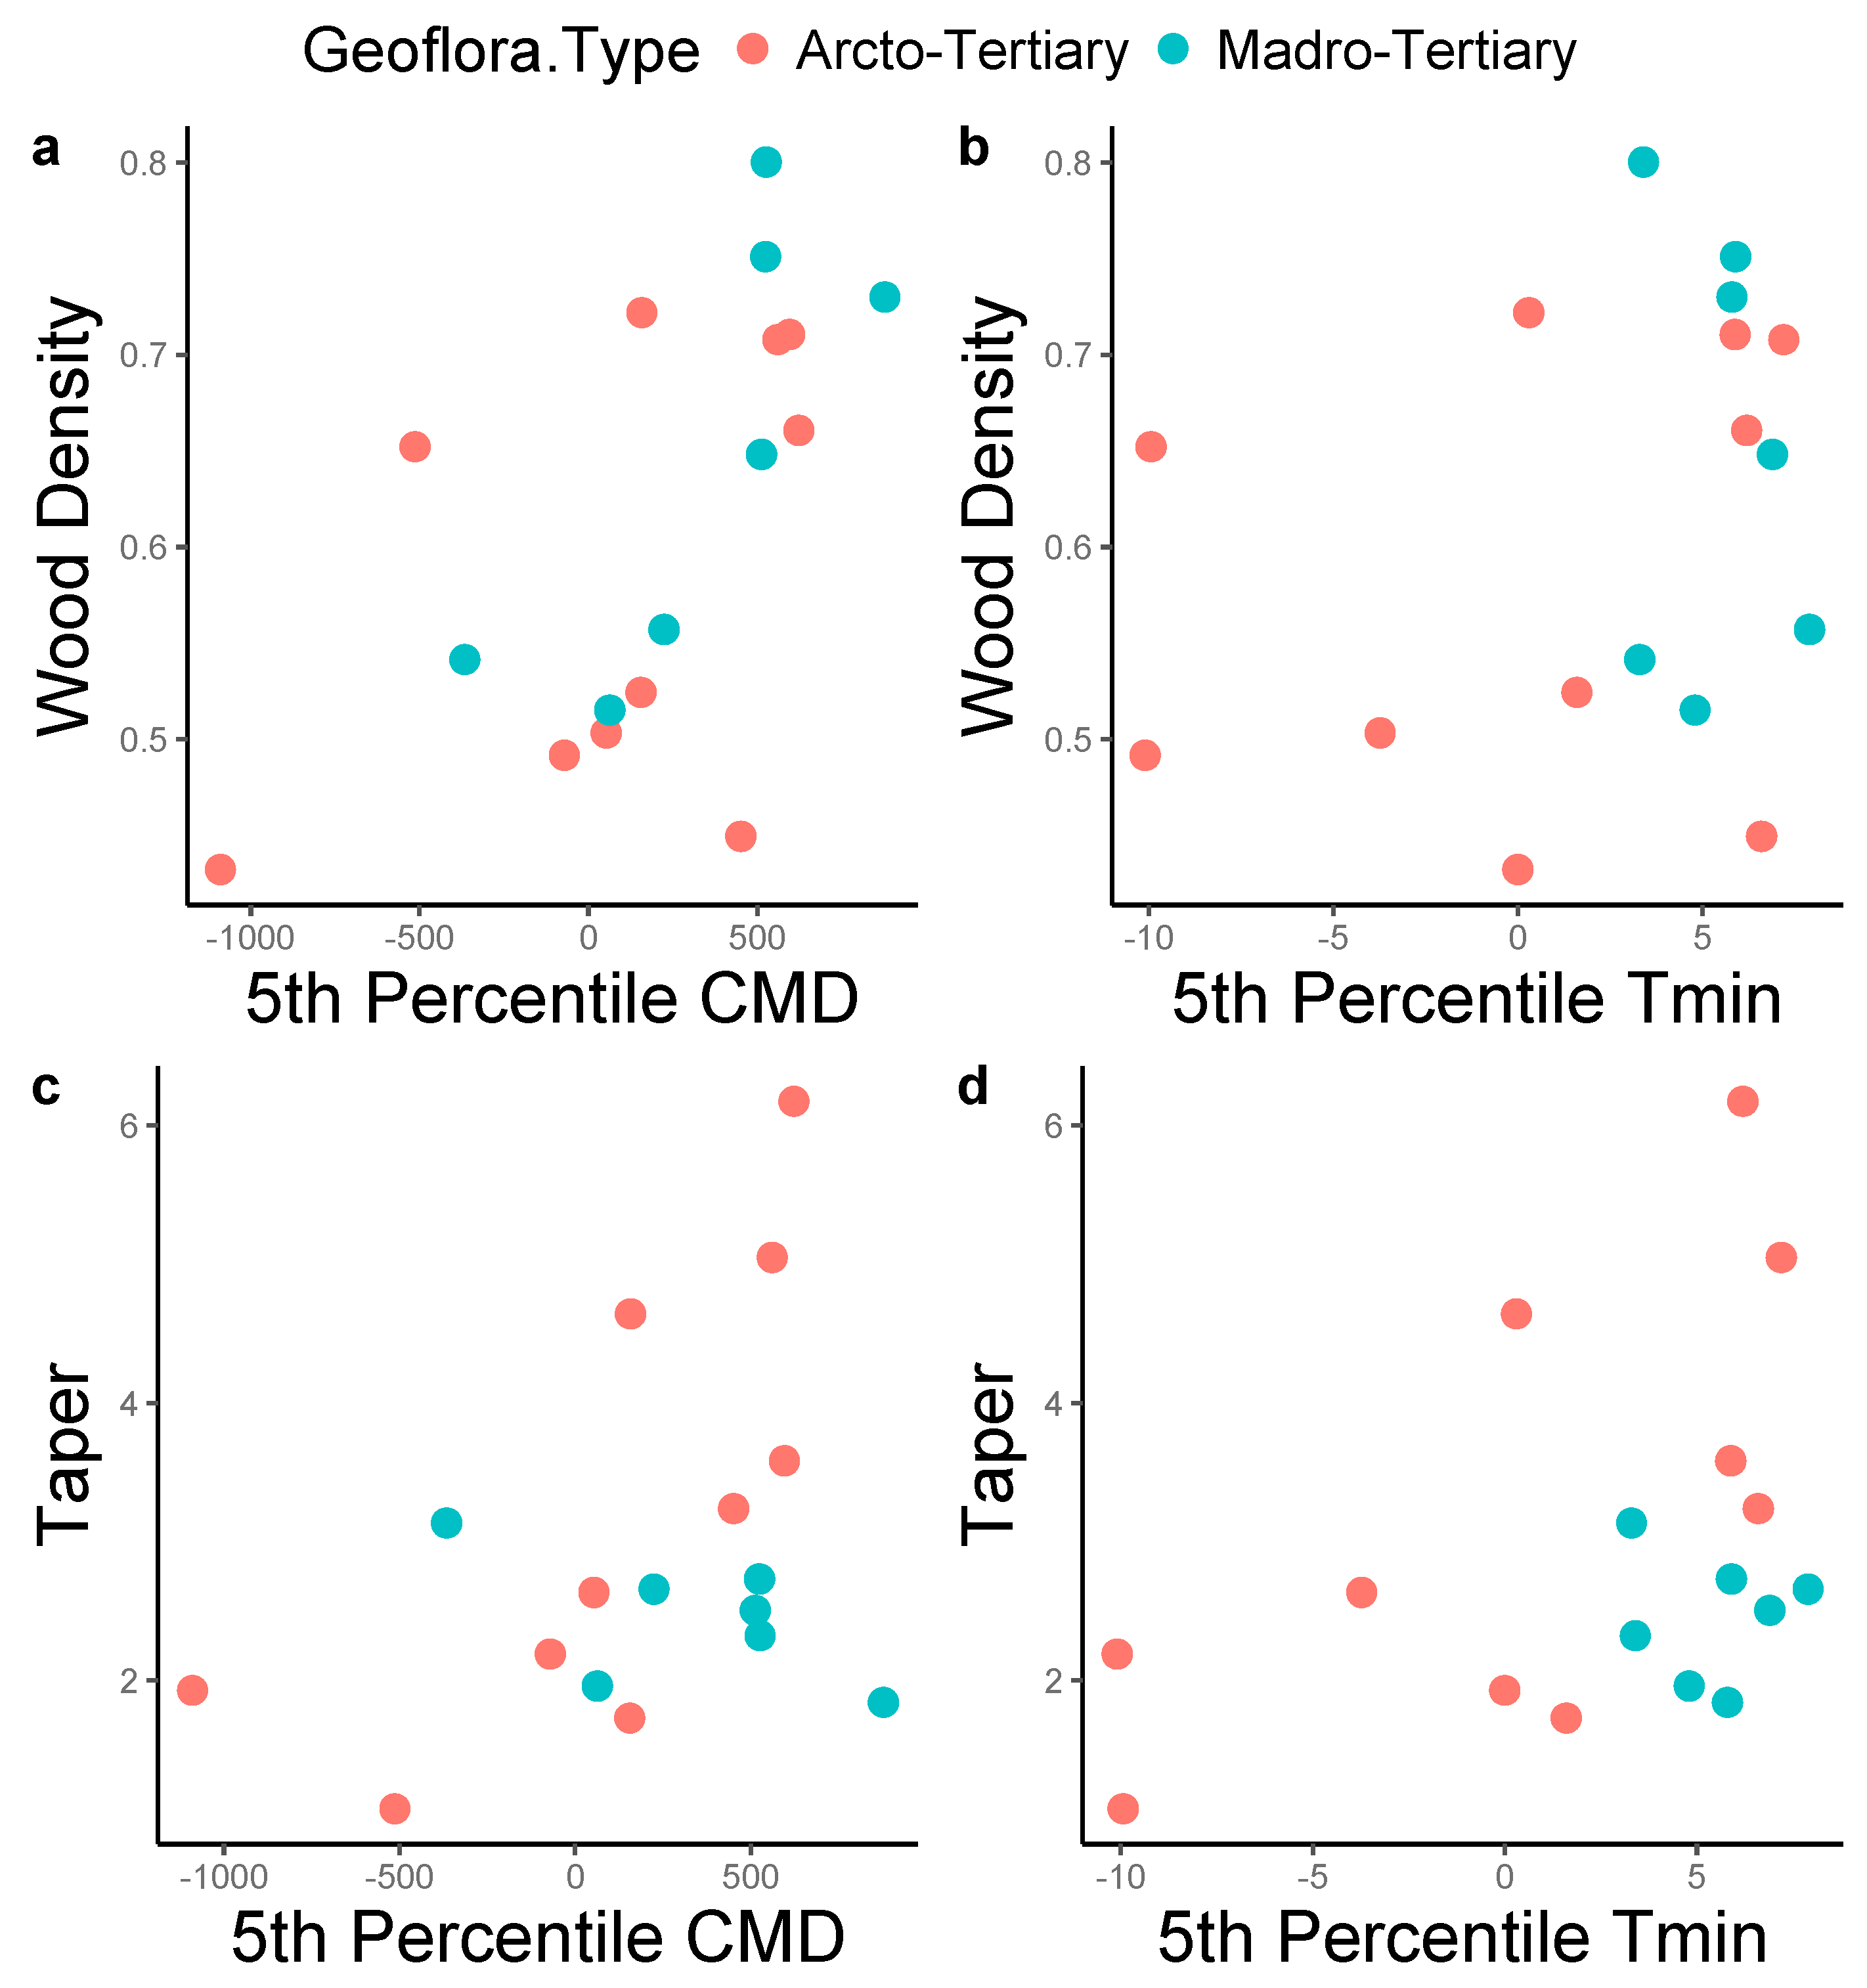
3. Results
4. Discussion
5. Conclusions
Supplementary Materials
Author Contributions
Funding
Acknowledgments
Conflicts of Interest
References
- Chave, J.; Coomes, D.; Jansen, S.; Lewis, S.L.; Swenson, N.G.; Zanne, A.E. Towards a worldwide wood economics spectrum. Ecol. Lett. 2009, 12, 351–366. [Google Scholar] [CrossRef]
- Ogle, K.; Pathikonda, S.; Sartor, K.; Lichstein, J.W.; Osnas, J.L.D.; Pacala, S.W. A model-based meta-analysis for estimating species-specific wood density and identifying potential sources of variation. J. Ecol. 2014, 102, 194–208. [Google Scholar] [CrossRef] [Green Version]
- Steffenrem, A.; Solheim, H.; Skrøppa, T. Genetic parameters for wood quality traits and resistance to the pathogens Heterobasidion parviporum and Endoconidiophora polonica in a Norway spruce breeding population. Eur. J. For. Res. 2016, 135, 815–825. [Google Scholar] [CrossRef] [Green Version]
- Baker, T.R.; Phillips, O.L.; Malhi, Y.; Almeida, S.; Arroyo, L.; Di Fiore, A.; Erwin, T.; Killeen, T.J.; Laurance, S.G.; Laurance, W.F.; et al. Variation in wood density determines spatial patterns in Amazonian forest biomass. Glob. Chang. Biol. 2004, 10, 545–562. [Google Scholar] [CrossRef]
- Wright, S.J.; Kitajima, K.; Kraft, N.J.B.; Reich, P.B.; Wright, I.J.; Bunker, D.E.; Condit, R.; Dalling, J.W.; Davies, S.J.; Díaz, S.; et al. Functional traits and the growth–mortality trade-off in tropical trees. Ecology 2010, 91, 3664–3674. [Google Scholar] [CrossRef]
- Camarero, J.J. Linking functional traits and climate-growth relationships in Mediterranean species through wood density. IAWA J. 2019, 40, 215–240. [Google Scholar] [CrossRef] [Green Version]
- Sarmiento, C.; Patiño, S.; Timothy Paine, C.E.; Beauchêne, J.; Thibaut, A.; Baraloto, C. Within-individual variation of trunk and branch xylem density in tropical trees. Am. J. Bot. 2011, 98, 140–149. [Google Scholar] [CrossRef]
- Fayolle, A.; Doucet, J.L.; Gillet, J.F.; Bourland, N.; Lejeune, P. Tree allometry in Central Africa: Testing the validity of pantropical multi-species allometric equations for estimating biomass and carbon stocks. For. Ecol. Manag. 2013, 305, 29–37. [Google Scholar] [CrossRef]
- Pratt, R.B.; Jacobsen, A.L.; Ewers, F.W.; Davis, S.D. Relationships among xylem transport, biomechanics and storage in stems and roots of nine Rhamnaceae species of the California chaparral. New Phytol. 2007, 174, 787–798. [Google Scholar] [CrossRef]
- Jacobsen, A.L.; Agenbag, L.; Esler, K.J.; Pratt, R.B.; Ewers, F.W.; Davis, S.D. Xylem density, biomechanics and anatomical traits correlate with water stress in 17 evergreen shrub species of the Mediterranean-type climate region of South Africa. J. Ecol. 2007, 95, 171–183. [Google Scholar] [CrossRef]
- Zhang, S.B.; Slik, J.W.F.; Zhang, J.L.; Cao, K.F. Spatial patterns of wood traits in China are controlled by phylogeny and the environment. Glob. Ecol. Biogeogr. 2011, 20, 241–250. [Google Scholar] [CrossRef]
- Poorter, L.; Lianes, E.; Moreno-de las Heras, M.; Zavala, M.A. Architecture of Iberian canopy tree species in relation to wood density, shade tolerance and climate. Plant Ecol. 2012, 213, 707–722. [Google Scholar] [CrossRef] [Green Version]
- Chave, J.; Andalo, C.; Brown, S.; Cairns, M.A.; Chambers, J.Q.; Eamus, D.; Fölster, H.; Fromard, F.; Higuchi, N.; Kira, T.; et al. Tree allometry and improved estimation of carbon stocks and balance in tropical forests. Oecologia 2005, 145, 87–99. [Google Scholar] [CrossRef]
- King, D.A.; Davies, S.J.; Tan, S.; Noor, N.S.M. The role of wood density and stem support costs in the growth and mortality of tropical trees. J. Ecol. 2006, 94, 670–680. [Google Scholar] [CrossRef]
- Aiba, M.; Nakashizuka, T. Architectural differences associated with adult stature and wood density in 30 temperate tree species. Funct. Ecol. 2009, 23, 265–273. [Google Scholar] [CrossRef]
- Iida, Y.; Poorter, L.; Sterck, F.J.; Kassim, A.R.; Kubo, T.; Potts, M.D.; Kohyama, T.S. Wood density explains architectural differentiation across 145 co-occurring tropical tree species. Funct. Ecol. 2012, 26, 274–282. [Google Scholar] [CrossRef]
- Read, J.; Evans, R.; Sanson, G.D.; Kerr, S.; Jaffré, T. Wood properties and trunk allometry of co-occurring rainforest canopy trees in a cyclone-prone environment. Am. J. Bot. 2011, 98, 1762–1772. [Google Scholar] [CrossRef]
- Preston, K.A.; Cornwell, W.K.; DeNoyer, J.L. Wood density and vessel traits as distinct correlates of ecological strategy in 51 California coast range angiosperms. New Phytol. 2006, 170, 807–818. [Google Scholar] [CrossRef]
- Cornwell, W.K.; Ackerly, D.D. Community assembly and shifts in plant trait distributions across an environmental gradient in coastal California. Ecol. Monogr. 2009, 79, 109–126. [Google Scholar] [CrossRef] [Green Version]
- Swenson, N.G.; Enquist, B.J. Ecological and evolutionary determinants of a key plant functional trait: Wood density and its community-wide variation across latitude and elevation. Am. J. Bot. 2007, 94, 451–459. [Google Scholar] [CrossRef]
- Martínez-Cabrera, H.I.; Jones, C.S.; Espino, S.; Jochen Schenk, H. Wood anatomy and wood density in shrubs: Responses to varying aridity along transcontinental transects. Am. J. Bot. 2009, 96, 1388–1398. [Google Scholar] [CrossRef] [PubMed]
- Ibanez, T.; Chave, J.; Barrabé, L.; Elodie, B.; Boutreux, T.; Trueba, S.; Vandrot, H.; Birnbaum, P. Community variation in wood density along a bioclimatic gradient on a hyper-diverse tropical island. J. Veg. Sci. 2017, 28, 19–33. [Google Scholar] [CrossRef]
- Nabais, C.; Hansen, J.K.; David-Schwartz, R.; Klisz, M.; López, R.; Rozenberg, P. The effect of climate on wood density: What provenance trials tell us? For. Ecol. Manag. 2018, 408, 148–156. [Google Scholar] [CrossRef]
- Hulshof, C.M.; Swenson, N.G.; Weiser, M.D. Tree height-diameter allometry across the United States. Ecol. Evol. 2015, 5, 1193–1204. [Google Scholar] [CrossRef] [PubMed]
- Onoda, Y.; Richards, A.E.; Westoby, M. The relationship between stem biomechanics and wood density is modified by rainfall in 32 Australian woody plant species. New Phytol. 2010, 185, 493–501. [Google Scholar] [CrossRef]
- Greenwood, S.; Ruiz-Benito, P.; Martínez-Vilalta, J.; Lloret, F.; Kitzberger, T.; Allen, C.D.; Fensham, R.; Laughlin, D.C.; Kattge, J.; Bönisch, G.; et al. Tree mortality across biomes is promoted by drought intensity, lower wood density and higher specific leaf area. Ecol. Lett. 2017, 20, 539–553. [Google Scholar] [CrossRef]
- Chave, J.; Muller-Landau, H.C.; Baker, T.R.; Easdale, T.A.; Hans Steege, T.E.R.; Webb, C.O. Regional and phylogenetic variation of wood density across 2456 neotropical tree species. Ecol. Appl. 2006, 16, 2356–2367. [Google Scholar] [CrossRef] [Green Version]
- Ackerly, D.D. Adaptation, niche conservatism, and convergence: Comparative studies of leaf evolution in the California chaparral. Am. Nat. 2004, 163, 654–671. [Google Scholar] [CrossRef]
- Axelrod, D.I. Evolution of the madro-tertiary geoflora. Bot. Rev. 1958, 24, 433–509. [Google Scholar] [CrossRef]
- Axelrod, D.I. Axelrod. Bull. Geol. Soc. Am. 1957, 68, 19–46. [Google Scholar] [CrossRef]
- Soil Survey Staff, Natural Resources Conservation Service, United States Department of Agriculture. Web Soil Survey. Available online: https://websoilsurvey.sc.egov.usda.gov/ (accessed on 16 December 2019).
- Kershner, B.; Tufts, C.; Nelson, G. National Wildlife Federation Field Guide to Trees of North America; Sterling Publishing Company: New York, NY, USA, 2008. [Google Scholar]
- Little, E. The Audubon Society Field Guide to North American Trees: Western Region; Knopf: New York, NY, USA, 1988. [Google Scholar]
- Calscape. Available online: https://calscape.org/ (accessed on 21 December 2019).
- GBIF Home Page. Available online: GBIF.org.
- Hijmans, R.J.; Cameron, S.E.; Parra, J.L.; Jones, P.G.; Jarvis, A. Very high resolution interpolated climate surfaces for global land areas. Int. J. Climatol. 2005, 25, 1965–1978. [Google Scholar] [CrossRef]
- Zomer, R.J.; Trabucco, A.; Bossio, D.A.; Verchot, L.V. Climate change mitigation: A spatial analysis of global land suitability for clean development mechanism afforestation and reforestation. Agric. Ecosyst. Environ. 2008, 126, 67–80. [Google Scholar] [CrossRef]
- Barton, K. Package “MuMIn”. R Package Version 2015, 1, 18. [Google Scholar]
- Smith, S.A.; Brown, J.W. Constructing a broadly inclusive seed plant phylogeny. Am. J. Bot. 2018, 105, 302–314. [Google Scholar] [CrossRef] [PubMed] [Green Version]
- Slater, G.J.; Harmon, L.J.; Wegmann, D.; Joyce, P.; Revell, L.J.; Alfaro, M.E. Fitting models of continuous trait evolution to incompletely sampled comparative data using approximate Bayesian computation. Evolution 2012, 66, 752–762. [Google Scholar] [CrossRef] [PubMed]
- Paradis, E.; Schliep, K. Ape 5.0: An environment for modern phylogenetics and evolutionary analyses in R. Bioinformatics 2018, 35, 526–528. [Google Scholar] [CrossRef]
- Pennell, M.W.; Eastman, J.M.; Slater, G.J.; Brown, J.W.; Uyeda, J.C.; FitzJohn, R.G.; Alfaro, M.E.; Harmon, L.J. Geiger v2.0: An expanded suite of methods for fitting macroevolutionary models to phylogenetic trees. Bioinformatics 2014, 30, 2216–2218. [Google Scholar] [CrossRef]
- Harmon, L.J.; Weir, J.T.; Brock, C.D.; Glor, R.E.; Challenger, W. GEIGER: Investigating evolutionary radiations. Bioinformatics 2007, 24, 129–131. [Google Scholar] [CrossRef] [Green Version]
- Pinheiro, J.; Bates, D.; DebRoy, S.; Sarkar, D.; Team, R.C. Nlme: Linear and Nonlinear Mixed Effects Models. R Package Version 2019, 3, 1–140. [Google Scholar]
- Baldwin, B.G.; Thornhill, A.H.; Freyman, W.A.; Ackerly, D.D.; Kling, M.M.; Morueta-Holme, N.; Mishler, B.D. Species richness and endemism in the native flora of California. Am. J. Bot. 2017, 104, 487–501. [Google Scholar] [CrossRef] [Green Version]
- Anten, N.P.R.; Schieving, F. The role of wood mass density and mechanical constraints in the economy of tree architecture. Am. Nat. 2010, 175, 250–260. [Google Scholar] [CrossRef] [PubMed]
- Hacke, U.G.; Sperry, J.S.; Pockman, W.T.; Davis, S.D.; McCulloh, K.A. Trends in wood density and structure are linked to prevention of xylem implosion by negative pressure. Oecologia 2001, 126, 457–461. [Google Scholar] [CrossRef] [PubMed]
- Lachenbruch, B.; McCulloh, K.A. Traits, properties, and performance: How woody plants combine hydraulic and mechanical functions in a cell, tissue, or whole plant. New Phytol. 2014, 204, 747–764. [Google Scholar] [CrossRef] [PubMed]
- Mahall, B.E.; Tyler, C.M.; Cole, E.S.; Mata, C. A comparative study of oak (Quercus, Fagaceae) seedling physiology during summer drought in southern California. Am. J. Bot. 2009, 96, 751–761. [Google Scholar] [CrossRef]
- Mclaughlin, B.C.; Zavaleta, E.S. Predicting species responses to climate change: Demography and climate microrefugia in California valley oak (Quercus lobata). Glob. Chang. Biol. 2012, 18, 2301–2312. [Google Scholar] [CrossRef]
- Tarelkin, Y.; Hufkens, K.; Hahn, S.; Van den Bulcke, J.; Bastin, J.F.; Ilondea, B.A.; Debeir, O.; Van Acker, J.; Beeckman, H.; De Cannière, C. Wood anatomy variability under contrasted environmental conditions of common deciduous and evergreen species from central African forests. Trees 2019, 33, 893–909. [Google Scholar] [CrossRef]
- Pretzsch, H.; Biber, P.; Schütze, G.; Kemmerer, J.; Uhl, E. Wood density reduced while wood volume growth accelerated in Central European forests since 1870. For. Ecol. Manag. 2018, 429, 589–616. [Google Scholar] [CrossRef]
- Sapes, G.; Serra-Diaz, J.M.; Lloret, F. Species climatic niche explains drought-induced die-off in a Mediterranean woody community. Ecosphere 2017, 8, e01833. [Google Scholar] [CrossRef]
- Brando, P.M.; Nepstad, D.C.; Balch, J.K.; Bolker, B.; Christman, M.C.; Coe, M.; Putz, F.E. Fire-induced tree mortality in a neotropical forest: The roles of bark traits, tree size, wood density and fire behavior. Glob. Chang. Biol. 2012, 18, 630–641. [Google Scholar] [CrossRef]


| Model | Degrees of Freedom | AICc |
|---|---|---|
| Null (WD~1) | 2 | −24.22 |
| WD~taper | 3 | −22.29 |
| WD~habitat | 3 | −31.84 |
| WD~taper + habitat | 4 | −29.22 |
| WD~taper + habitat + taper/habitat | 5 | −29.49 |
| WD~taper + taper/habitat | 4 | −32.95 |
| Model | Degrees of Freedom | AICc |
|---|---|---|
| Null | 2 | −21.20 |
| WD~CMD 0.05 | 3 | −29.21 |
| WD~MAP 0.05 | 3 | −22.04 |
| WD~PET 0.05 | 3 | −28.84 |
| WD~MAT 0.05 | 3 | −25.75 |
| WD~CMD 0.05 + habitat | 4 | −36.07 |
| WD~CMD 0.05 + habitat/CMD 0.05 | 4 | −27.80 |
| WD~CMD 0.05 + habitat + habitat/CMD 0.05 | 5 | −32.58 |
| Model | Degrees of Freedom | AICc |
|---|---|---|
| Null (WD~1) | 2 | −21.20 |
| WD~CMD 0.05 | 3 | −29.21 |
| WD~CMD 0.05 + taper + habitat + taper/habitat | 6 | −37.76 |
| WD~CMD 0.05 + taper + taper/habitat | 5 | −41.74 |
| WD~taper + habitat + taper/habitat | 5 | −29.49 |
| WD~CMD 0.05 + habitat | 4 | −36.07 |
| WD~habitat | 3 | −31.84 |
| WD~taper | 3 | −22.29 |
© 2020 by the authors. Licensee MDPI, Basel, Switzerland. This article is an open access article distributed under the terms and conditions of the Creative Commons Attribution (CC BY) license (http://creativecommons.org/licenses/by/4.0/).
Share and Cite
Nelson, R.A.; Francis, E.J.; Berry, J.A.; Cornwell, W.K.; Anderegg, L.D.L. The Role of Climate Niche, Geofloristic History, Habitat Preference, and Allometry on Wood Density within a California Plant Community. Forests 2020, 11, 105. https://0-doi-org.brum.beds.ac.uk/10.3390/f11010105
Nelson RA, Francis EJ, Berry JA, Cornwell WK, Anderegg LDL. The Role of Climate Niche, Geofloristic History, Habitat Preference, and Allometry on Wood Density within a California Plant Community. Forests. 2020; 11(1):105. https://0-doi-org.brum.beds.ac.uk/10.3390/f11010105
Chicago/Turabian StyleNelson, Rebecca A., Emily J. Francis, Joseph A. Berry, William K. Cornwell, and Leander D. L. Anderegg. 2020. "The Role of Climate Niche, Geofloristic History, Habitat Preference, and Allometry on Wood Density within a California Plant Community" Forests 11, no. 1: 105. https://0-doi-org.brum.beds.ac.uk/10.3390/f11010105