Impact of Land Use/Cover Change on Ecosystem Service Values in the Kilombero Valley Floodplain, Southeastern Tanzania


1
School of Environment, Northeast Normal University, Changchun 130024, China
2
Department of Environmental Studies, The Open University of Tanzania, P.O. Box 23409, Dar es Salaam 14110, Tanzania
3
State Environmental Protection Key Laboratory of Wetland Ecology and Vegetation Restoration, Northeast Normal University, Changchun 130024, China
4
Institute of Resources Assessment, University of Dar es Salaam, P.O. Box 35097, Dar es Salaam 14129, Tanzania
*
Author to whom correspondence should be addressed.
Forests 2020, 11(1), 109; https://0-doi-org.brum.beds.ac.uk/10.3390/f11010109
Submission received: 5 November 2019
/
Revised: 12 January 2020
/
Accepted: 12 January 2020
/
Published: 15 January 2020
(This article belongs to the Section Forest Economics, Policy, and Social Science)
Abstract
:Land use/cover change (LUCC) attributed to natural factors and human activities has led to the loss of ecosystem services, making the quantitative valuation of ecosystem services the scientific focal pointfor sustainable development. This study assessed changes in the ecosystem services values (ESVs) due to LUCC during the period 1990–2016 in the Kilombero Valley floodplain, located in southeastern Tanzania. Moderate resolution Landsat images from 1990, 2010 and 2016 were obtained and analyzed using a random forest (RF) algorithm for classification, and ArcGIS Desktop software (version 10.2, Esri, Redlands, CA, USA) for mapping to assess the LUCC. The ESVs were estimated based on the benefit transfer approach using adopted global value coefficients and modified local value coefficients. The results revealed that the aggregated ESVs of the forests, bushlands, wetlands, and water had decreased, consequently leading to a total loss of US$ 811.5 million (26.6%) in ESVs over the past 26 years when calculated with the modified local value coefficients to US$ 3000.7 million (42.3%) when calculated with global value coefficients. Moreover, the loss in the ESV was attributed to the decreased values of water regulation, climate regulation, erosion control, nutrient cyclying, habitat/refugia, and water supply, with the exception of the values of food production and biological control, which gradually increased during the study period. This study provided minimum estimates of the ecosystem service values, which willcontribute to the formulation of policy actions and strategies for sustainable management of the Kilombero Valley floodplain and inform various stakeholders on the tradeoffs involved in the use of land resources.
1. Introduction
Ecosystem services are the benefits that human beings derive, directly or indirectly from ecosystem functions [1,2,3]. These services are categorized into four major categories: provisioning services, supporting services, regulating services and cultural services [3,4]. The ecosystem goods and services support ecological processes and functions and provide resources for the survival of all organisms. Global land use/cover change (LUCC) affects the status and integrity of different ecosystems, leading to the loss of the ecosystem services and functions in the recent decades [5,6,7,8,9,10]. The valuation of ecosystem services with LUCC assessments has become a focal point for most scientific researches because it raises awareness [5,11], provides information on the most valuable ecosystem services that need to be conserved [9,12], improves decision making for the allocation of scarce resources among competing demands [2,10,13] and assists the formulation of policies and strategies that ensure sustainable management of an ecosystem [14,15]. Ecosystem services valuation is the estimation of the marginal value of ecosystem services that determines the costs of losing or the benefit of preserving a given amount or quality of an ecosystem service [16]. The valuation methods of ecosystem services have been divided into two categories: first, the primary valuation methods that follow different economic approaches, which involve market prices, travel cost, the hedonic method, production approaches, conjoint analysis, opportunity cost and replacement cost [9,14]. The second is the biome or land use proxy-based method, which is based on the benefit transfer approach and applies the use of the existing ESV information or data from one area to a new region that has little or no data [14,17]. The benefit transfer approach is more widely used method due to scarcity of primary data and limited financial resources. It provides first-hand information for decision-makers on various aspects of policy actions and strategies for sustainable management of landscape resources [11,18,19]. Moreover, ecosystem services are conditioned by the patterns, scales and intensities of changes in land use and land cover (LULC) types [6,20]. These variations in LULC types in a given area can be used as a substitute for biomes/a proxy to estimate ecosystem service values (ESVs) at the specific landscape level [7].
Moreover, the valuation of the ecosystem services and their changes has drawn much attention after publication by Constanza et al. [1] that proposed 17 types of ecosystem services coefficients of 16 biomes and the estimated the ecosystem services values at the global scale. Since then, there have been numerous studies that value ecosystem services at the national level [21,22] and at the state/regional level [11,19,23], based on these proposed value coefficients [24]. In addition, for the corresponding value coefficients of different biomes, the Economics of Ecosystems and Biodiversity (TEEB) valuation database was also developed mainly based on the literature of case studies in different parts of the globe [25]. Most studies employed these proposed value coefficients through a benefit transfer approach together with remote sensing and GIS technologies estimation to estimate the ESV and mapping their distributions [21,26]. This approach has been practical to estimate ESVs and suggests management options for regions with scarce data [7,24]. Though there have been efforts to estimate ESVs for areas with scarce data, there are few studies on the ecosystem services valuation in relation to the LUCC dynamics in East Africa, particularly, Tanzania. Thus, this study used the Kilombero Valley floodplain in Tanzania as the case study.
The Kilombero Valley floodplain in Tanzania provides important ecosystem services to the local communities, which directly or indirectly improved their wellbeing, as they solely depend on the exploitation of natural resources for their livelihood and income [27,28]. Nevertheless, the valley is experiencing land use intensification and wetland degradation due to population pressure, government policies that aimed at increasing agricultural investments both foreign investment and private-public partnerships, and the current climate change/variability [29,30,31,32]. Leemhuis et al. [31] revealed that the continuous land use/cover change towards deforestation, agriculture expansion and intensifications in this valley has led to a severe shift in water balance components and impact on the wetland ecosystem, particularly the degradation of the existing wildlife corridors. Despite these studies, the effects of temporal and spatial land use/cover change on ecosystem service values in the Kilombero Valley floodplain are not well understood. It is important to evaluate ecosystem service values as they raise awareness of the consequences, select valuable ecosystem services for conservation and improved decision making regarding the management of an ecosystem. Additionaly, the approach of deriving ecosystem service values from the global and modified local coefficients with higher local validity for the study area is limited. Therefore, the objectives of this study are:
- (1)
- (2)
- To explore the changes of individual ecosystem function values due to the effects of dynamics in each land use and land cover type. The discussion offers suggestions of possible policy actions and strategies that can be employed for environmental management of the degraded Kilombero Valley floodplain and other areas of similar ecological importance.
2. Methodology
2.1. Study Area
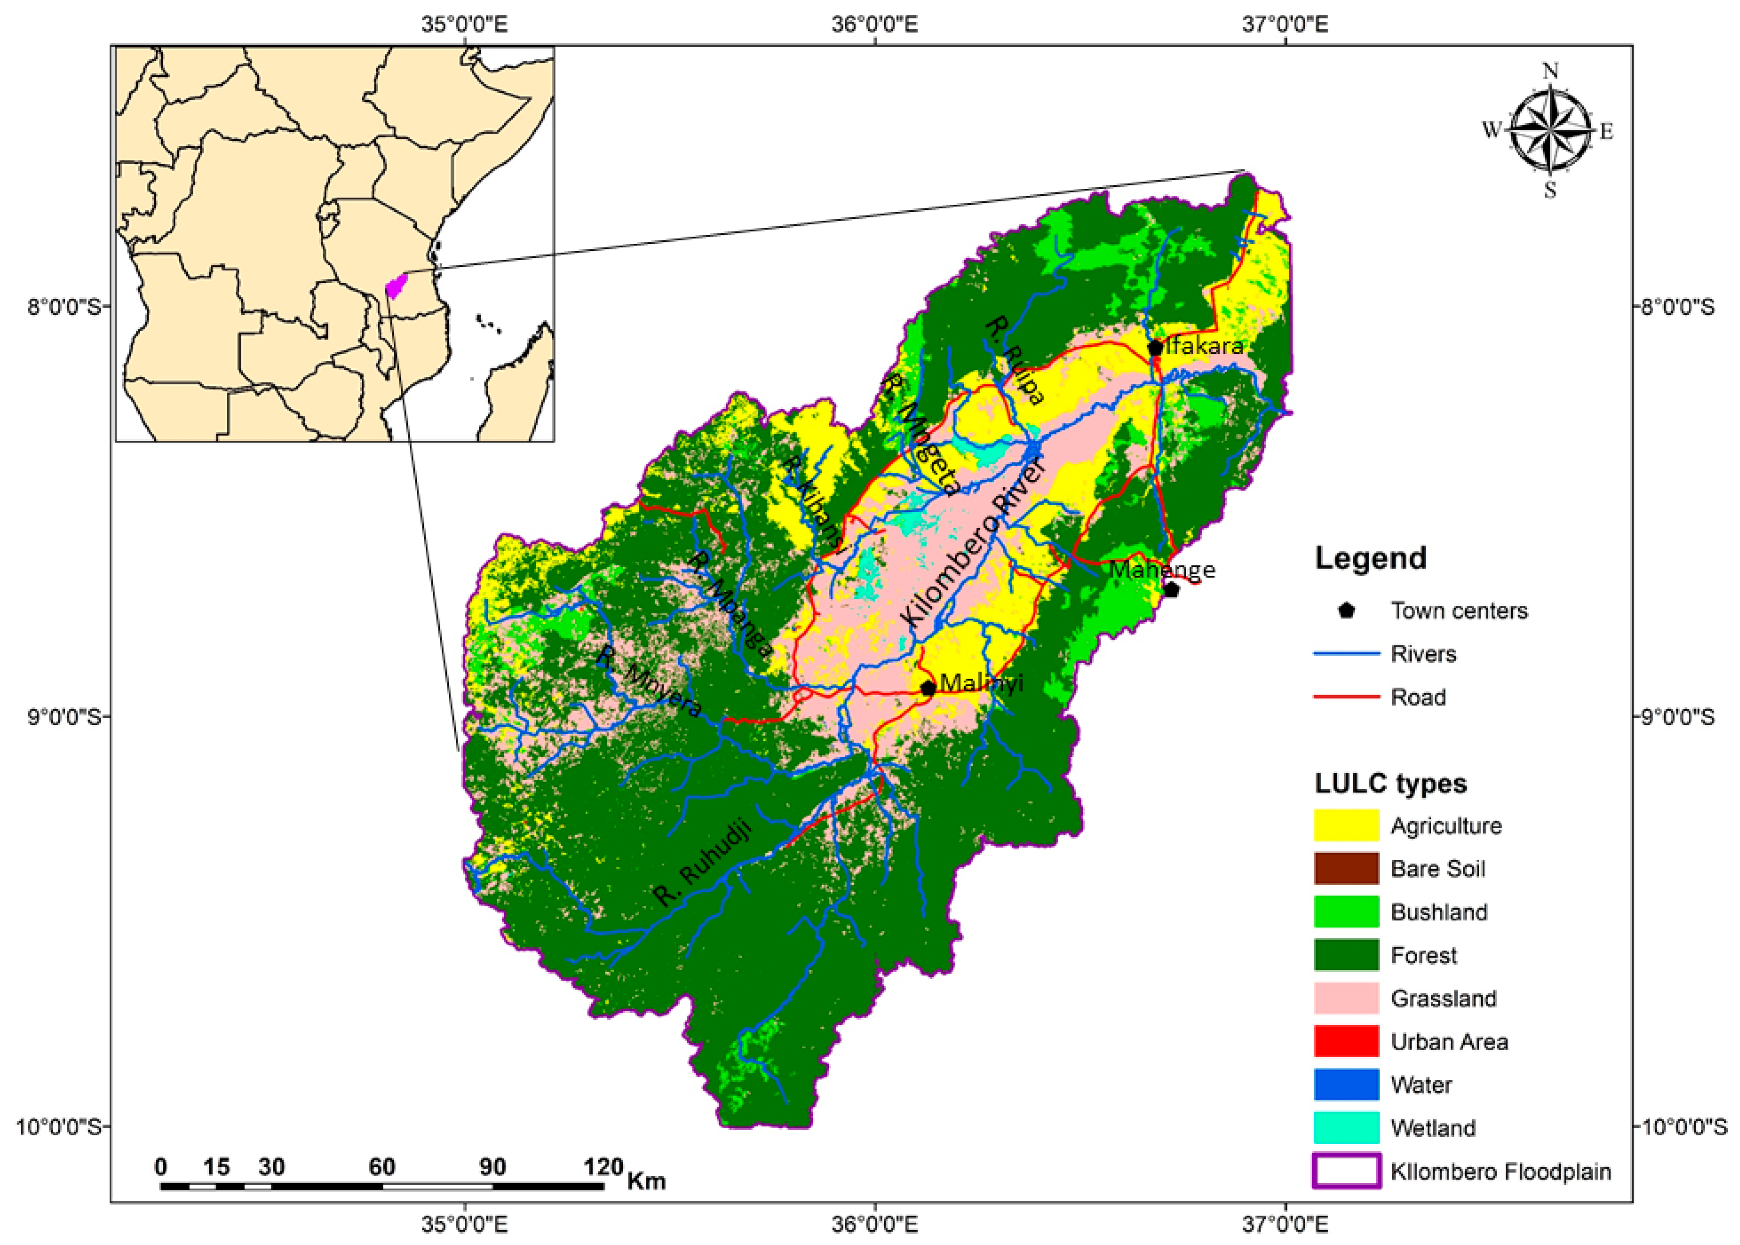
The Kilombero Valley floodplain, located in the Morogoro region of southeastern Tanzania, was selected as the study area for this research. Kilombero Valley is located in the floodplain of the Kilombero River catchment, that lies between the Udzungwa great escarpment in the north and the Mahenge Highlands in the south covering an area of approximately 30,500 km². The valley is administratively separated into three districts: the Kilombero, Ulanga and Malinyi districts (10°00′–08°40′ S and 35°10′–37°10′ E) and divided by the Kilombero River (Figure 1). The Kilombero River itself receives inflow from the permanent and seasonal Rivers from the Mountains, feeding the seasonal Kilombero wetlands that cover 7967 km² representing the largest freshwater wetland in Africa below 300 m above sea level. These wetlands have a rich endemic species of flora and fauna and encompass the number of wildlife corridors. It was designated as a Ramsar site in 2002 and therefore managed by the Ministry of Natural Resources and Tourism through stipulated rules and regulations following the Ramsar convention [34].
The Kilombero Valley floodplain is characterized by a sub-humid tropical climate with an annual rainfall of approximately 1200–1400 mm with relative mean humidity ranging between 70 and 90%. However, the precipitation in the valley floodplain shows high spatiotemporal variability, whereby the mountainous area receives up to 2100 mm precipitation, which is 1000 mm more precipitation compared to the floodplain [32]. It has two rainy seasons with an annual mean temperature between 24 °C in the valley and 17 °C in the higher altitudes [32]. Geologically, the valley floodplain is described by sedimentary basin infillings forming a seasonal alluvial floodplain dominated by fluvisols. Natural vegetation in the Kilombero Valley floodplain depends on the gradients from the rivers; on the riverside vegetation is often dominated by Hyparrhenia spp. and Reed (Phragmites mauritianus Kunth.), followed by the low-lying valley grassland with the perennial grass including Guinea grass (Panicum maximum Jacq.), marginal grasslands occasionally with trees, marginal woodlands, combretacoes wooded grasslands, and last, miombo woodland and forests exists on the upper valley [35]. The natural forests and miombo woodlands occupy the large part of the valley.
The predominantly socioeconomic activities in this valley floodplain are crop production, livestock keeping and fishing [32]. The fertile floodplain has been an enticement for farmers to engage in crop production. Approximately 80% of the rural population in KVFP is engaged in subsistence, small-scale irrigated and rain-fed agriculture, mainly rice, maize, sugarcane, and more recently cocoa and banana [36]. Nationally, agriculture accounts for 25% of Gross Domestic Product (GDP), and at the local level it accounts for three quarters of the individual rural households income [32]. Currently, rice and sugarcane cultivation and livestock keeping dominate the landscape land use system.
2.2. Data Used and Methods
The datasets used for this study were acquired from various sources (see Table 1 and Table 2). The LULC datasets were acquired from Msofe et al. [29]. The datasets were generated by conducting supervised images classification employing random forest (RF) algorithm on imagery from Landsat-5 Thematic Mapper (TM) of 1990 and 2010 and the Landsat-8, Operational Land Imager (OLI) of 2016 with the spatial resolution of 30 m, which were then mapped using ArcGIS Desktop version 10.2 software, Esri, California, USA. The land use and land cover types were classified into eight classes i.e., forest, bushland, grassland, agriculture, urban area, bare soil, water, and wetland. LULC change detection was performed using spatial automatic overlay analysis and the Zonal Tabulate Area function in ArcGIS version 10.2 to generate the Markov chain transition matrix of the study area. Then, the post classification process was executed by recoding, majority filtering, clumping, elimination and mosaicking of the classified maps to reduce errors in the produced maps.
Furthermore, an accuracy assessment was performed and indicated good overall classification results, with an accuracy of 86.7% and a kappa coefficient of 0.82, which satisfied the requirements of accuracy test and validated the classification results [29]. The eight LULC types were then compared with their corresponding equivalent biome, which were developed Costanza et al. [1], Kindu et al. [7] and Temesgen et al. [33]. The most representative biome was used as a proxy for each LULC type, including (1) cropland for agriculture; (2) desert for bare land; (3) tropical forest for bushland; (4) tropical forest for forest; (5) grass/rangelands for grassland; (6) urban area for settlement; (7) rivers/lakes for water and (8) wetland/marsh for wetland (see Table 1).
This study employed the benefit transfer approach to estimate the ecosystem service values based on the adopted global and modified local value coefficients of the ecosystem services for the target LULC types; for examples, see [6,11,37]. The adopted modified local value coefficients of the ecosystem services for cropland, desert, tropical forest, grasslands, urban and freshwater biomes were obtained from Kindu et al. [7], whereas the value coefficients for wetland/marsh biome were obtained from Temesgen et al. [33]. These coefficients were generated based on expert knowledge of the ecological conditions of the Ethiopian highlands landscape and from other literature, mainly from the TEEB valuation database [10]. The modification of ES value coefficients was performed based on the benefit transfer (BT) approach, which refers to the adaptation of existing values or data from one site to estimate the ESVs of other new similar sites in the absence of the site-specific valuation information [14,17]. It is principally useful when primary data collection is not feasible due to budget or time constraints [14]. These studies considered values from tropical areas with LULC types similar to their studied geographical setting to ensure the applicability of the transferred data from the TEEB valuation database. Moreover, the value coefficients from these studies were obtained in tropical highlands areas similar to the geographical setting of our study area. The global ecosystem service value coefficients were employed from ecosystem services valuation model of Costanza et al. [1]. Table 2 gives the detailed ecosystem service functions and their modified local value coefficients of each LULC type. All value coefficients were converted into 1994 US$ ha−1 year−1 to facilitate the estimation process of the ESVs and their changes.
2.3. Data Analyses
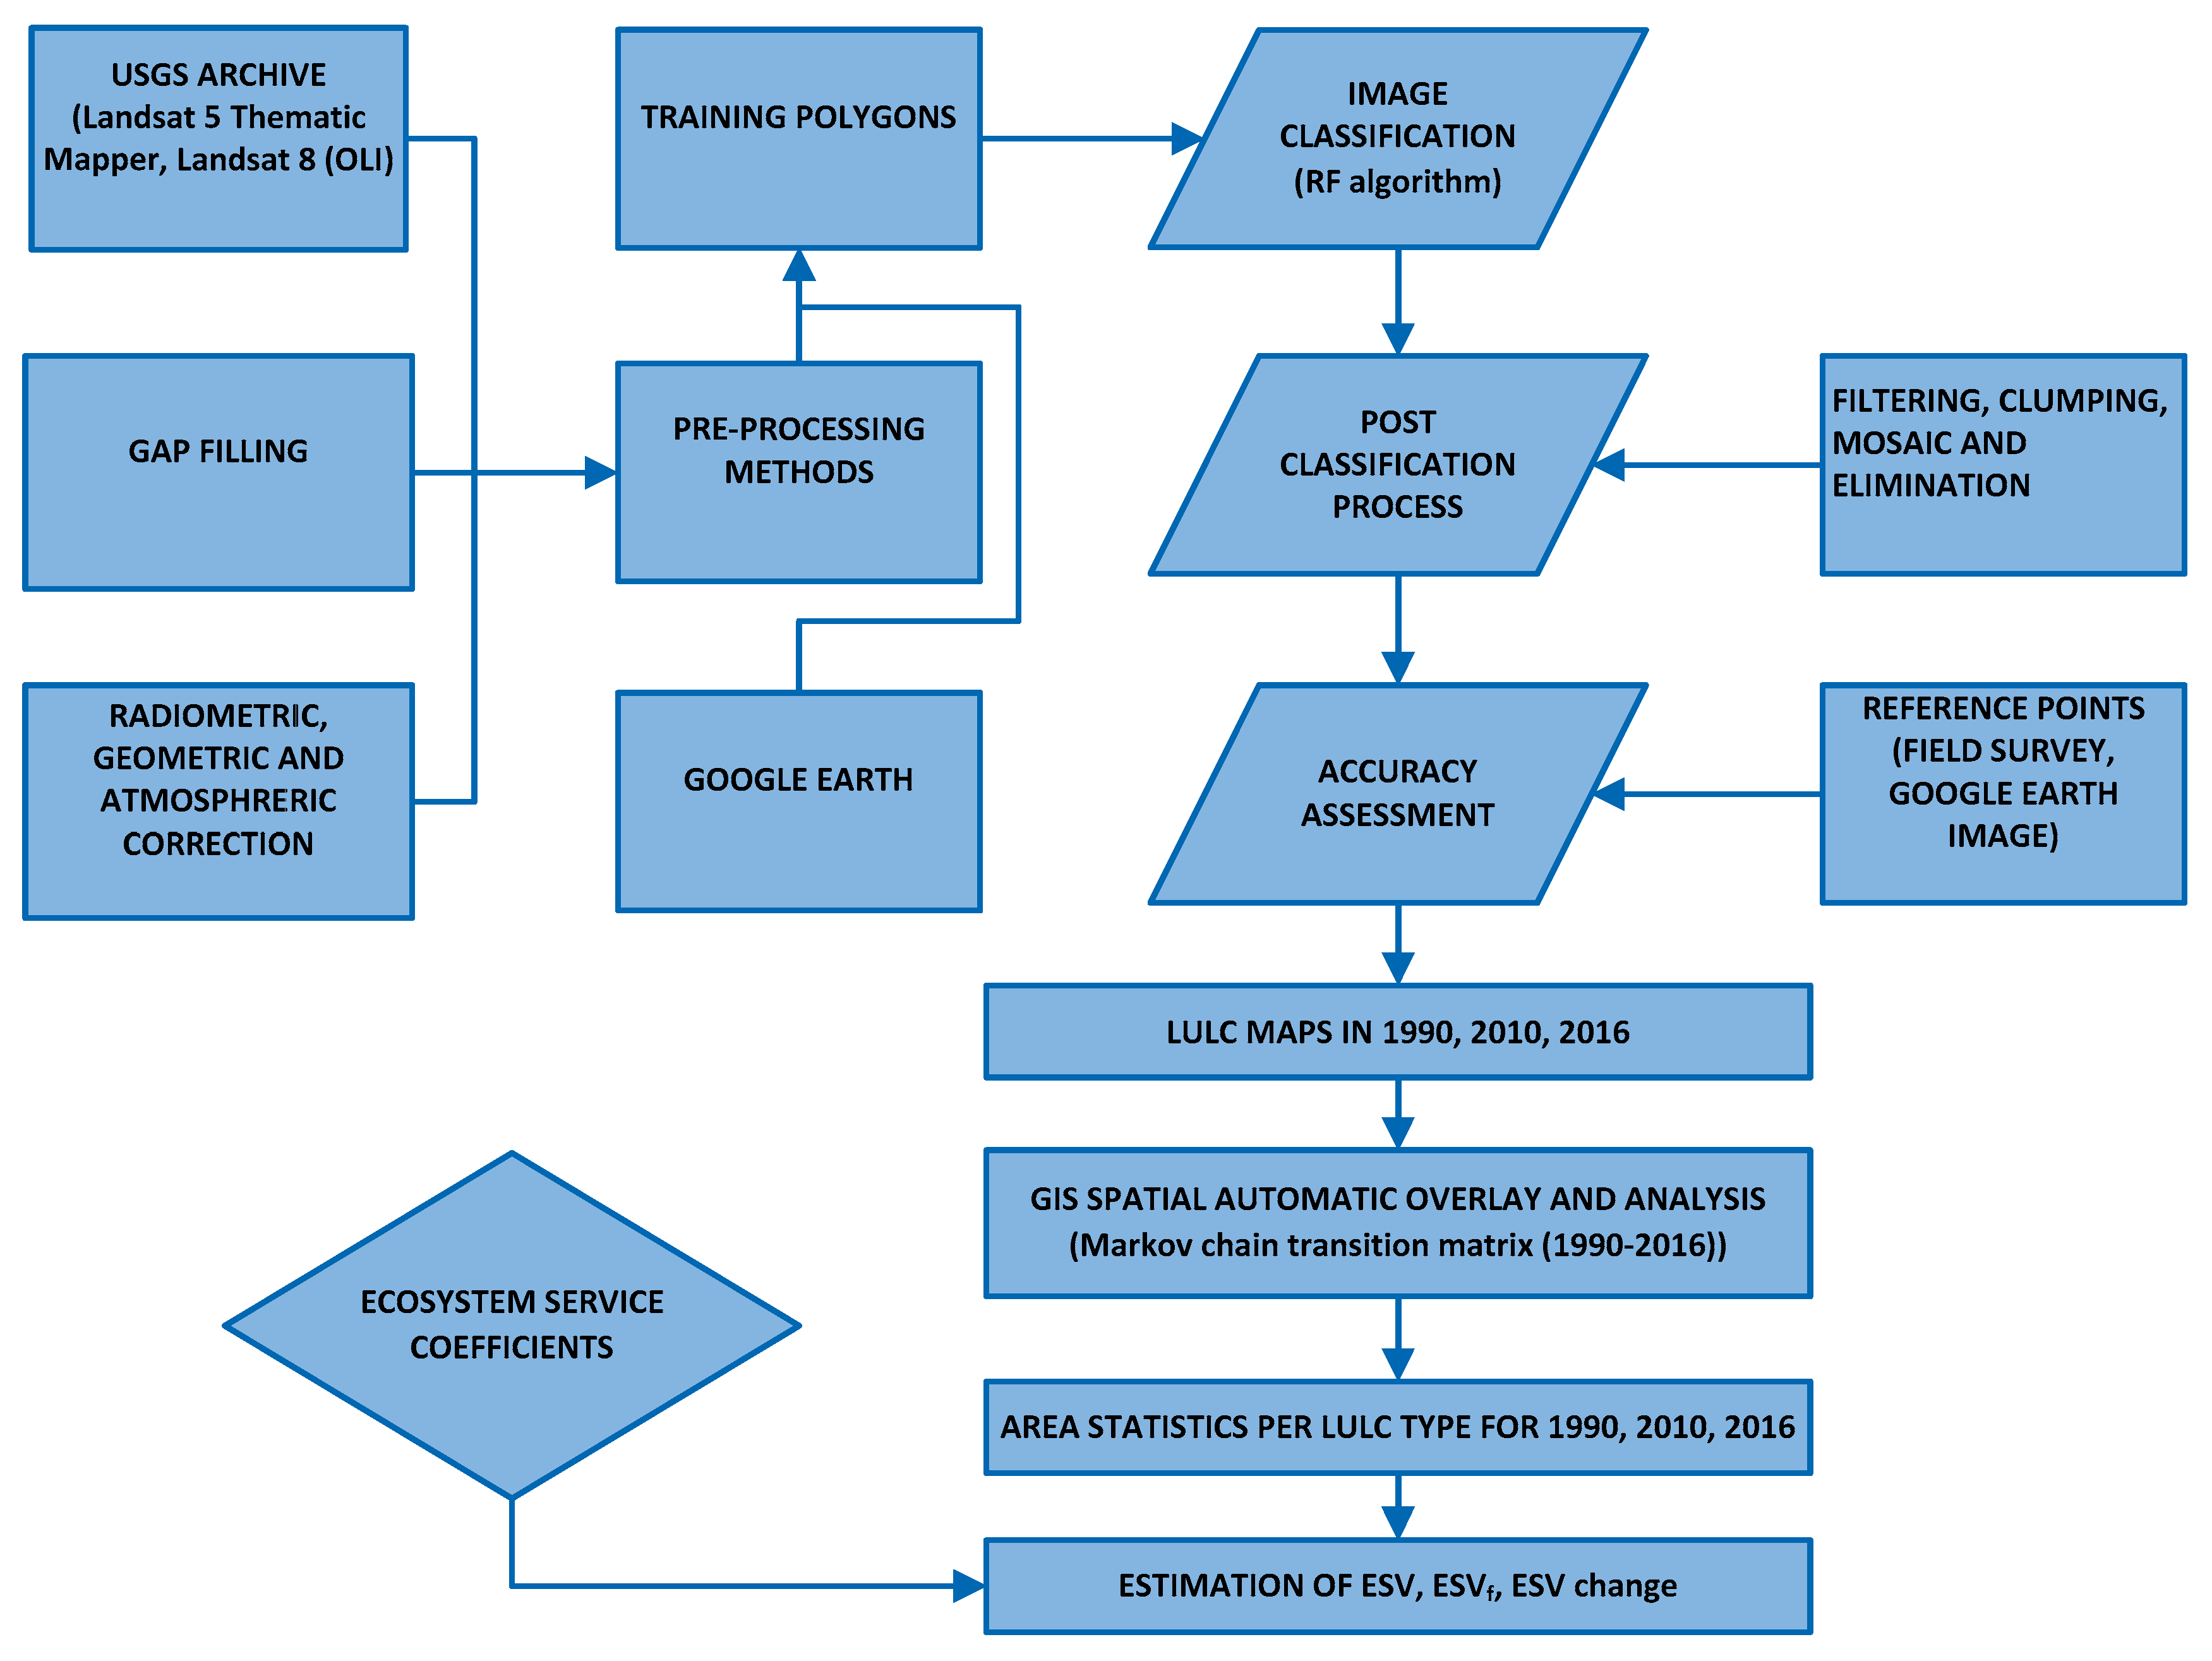
Most assessment of the ESVs use a benefit transfer approach based on the global value coefficients or modified value coefficients developed by other scholars, especially in data-deficient areas [1,2,9,38]. The overall methodological approach used in this study for the estimation of the ESVs for 1990, 2010 and 2016 years and the computation of changes between study periods is shown in Figure 2.
The LULC datasets for each year, which were used as proxies for the measurement of the ESVs were prepared, and the corresponding area in hectares was assessed and presented in a raster in the GIS. In the ecosystem service valuation process, the value coefficients are assigned to each LULC type, according to this study value coefficients used were those of Costanza et al. [1] and the adopted local modified ecosystem services coefficients followed those of Kindu et al. and Temesgen et al. [7,33] (see Table 1). Then, the total value of ecosystem services in the study area for 1990, 2010 and 2016 was calculated by multiplying the area of a given LULC type by the corresponding modified ecosystem service value coefficients that were extracted from weight factors of the ecosystem services per hectare of each biome, see equation (1), which was used by [7,11], as follows:
where ESV = the total estimated ecosystem service value, Ak = the area (ha) and VCk = the value coefficient (US$ ha−1 year−1) for LULC type ‘k’. The ESVs for all land use and land cover (LULC) types were calculated with the exception of those for bare soil and settlement as they appeared to be zero in both cases because their value coefficients equaled zero. Moreover, the change in the ESVs was determined by calculating the differences between the estimated values for each LULC category in 1990, 2010 and 2016. The percentage changes in the ESVs between the years were calculated based on the equation below:
where ESVt2 (US$ ha−1 year−1) = the estimated ecosystem service value in the most recent year, and ESVt1 (US$ ha−1 year−1) = the estimated ecosystem service value in the previous year. Positive values suggest an increase in the ESVs, whereas negative values imply a decrease in the ESVs. Moreover, we also estimated the values of the services provided by individual ecosystem functions within the study area using the following equation:
where ESVf is the estimated ecosystem service value of function f, Ak is the area (ha) and VCfk is the value coefficient of the function f (US$ ha−1 year−1) for LULC category ‘k’. The contributions of the individual ecosystem functions to the overall value of the ecosystem services per year were calculated and summarized in the tables.
3. Results
3.1. States of and Changes in the Ecosystem Service Values
The evaluation of the ecosystem service values of the Kilombero Valley floodplain for the years 1990, 2010 and 2016 is presented in Table 3 and Figure 3. It showed that the total estimated ESVs of the whole study area were approximately US$ 3049.7 million in 1990, US$ 2657.4 million in 2010 and US$ 2238.2 million in 2016 (see Table 3 Part a) when the locally modified value coefficients were used. In general, the total estimated ESVs had decreased by US$ 811.5 million (26.6%) during the period from 1990 to 2016. The gradual decline of the total ESV over the last 26 years was described by the difference in the ESVs among the LULC types within the different years in the study area. The aggregated ESVs of forest, bushland, wetland, and water decreased from US$ 2948.4 million (96.7%) in 1990 to US$ 1940.6 million (86.7%) in 2016 and primarily accounted for the total loss in the ESVs in the Kilombero Valley floodplain (see Table 3 Part a). The consistently decreased area coverage of forest, bushland, wetland, and water led to decreased ESVs (Figure 3), affecting the total estimated ESV of the study area.This was evident from the fact that the aggregated ESVs of the forest, bushland, wetland, and water ecosystems declined by approximately US$ −1007.8 million in the last 26 years, which was significantly higher than the total decline in ESVs in the whole study area, which decreased by approximately US$ −881.5 million (see Table 3 Part a). Moreover, wetlands and water have very small areas but have high contributions to the total ecosystem service values due to their large value coefficients (see Table 1). In 1990, wetlands and water accounted for 292 million (9.6%) and 185.6 million (6.1%), respectively, of the total ESV, whereas in 2016, wetlands and water accounted for 53.9 million (2.4%) and 24.3 million (1.1%), respectively, of the total ESV(see Table 3 Part a), indicating a decreasing trend. Similarly, when the global coefficients developed earlier were used, the ESVs were observed to decline from US$ 7094.7, 5558.1, and 4094.0 million in 1990, 2010 and 2016, respectively (see Table 3 Part b), leading to a total loss of US$ 3000.7 million (42.3%). This estimate was approximately 3.4 times higher than the loss estimated with the modified local value coefficients were adopted. The amount of ESVs also differed among the LULC types in different years.
3.2. Relationship between Changes in ESV and Land Use/Cover Change
This study found that there were changes in ESVs, particularly towards the decline in the total ESVs over 1990–2010, 2010–2016 and the entire study period 1990–2016. The total amounts of the changes in the ESVs were US$ 392.3 million (12.9%), US$ 419.2 million (15.8%) and US$ 811.5 million (26.6%) for 1990–2010, 2010–2016 and 1990–2016, respectively, when the adopted modified local value coefficients were used (see Table 4 Part a).
This decline in the total ESVs was reflected by a decrease in the ESVs of forest, bushland, wetland and water from US$ 308.7 million (10.1%), US$ 299.7 million (9.8%), US$ 238.1 million (7.8%), and US$ 161.3 million (5.3%), respectively, of the values that existed in 1990. However, the ESV of agriculture increased for the entired duration of the study, with the amount of approximately US$ 77.4 million of the value existed in 1990 (see Table 4 Part a). With the global coefficients, although the amounts differed, a significant decrease in the total values was also observed in 1990–2010, 2010–2016 and 1990–2016 (see Table 4 Part b).
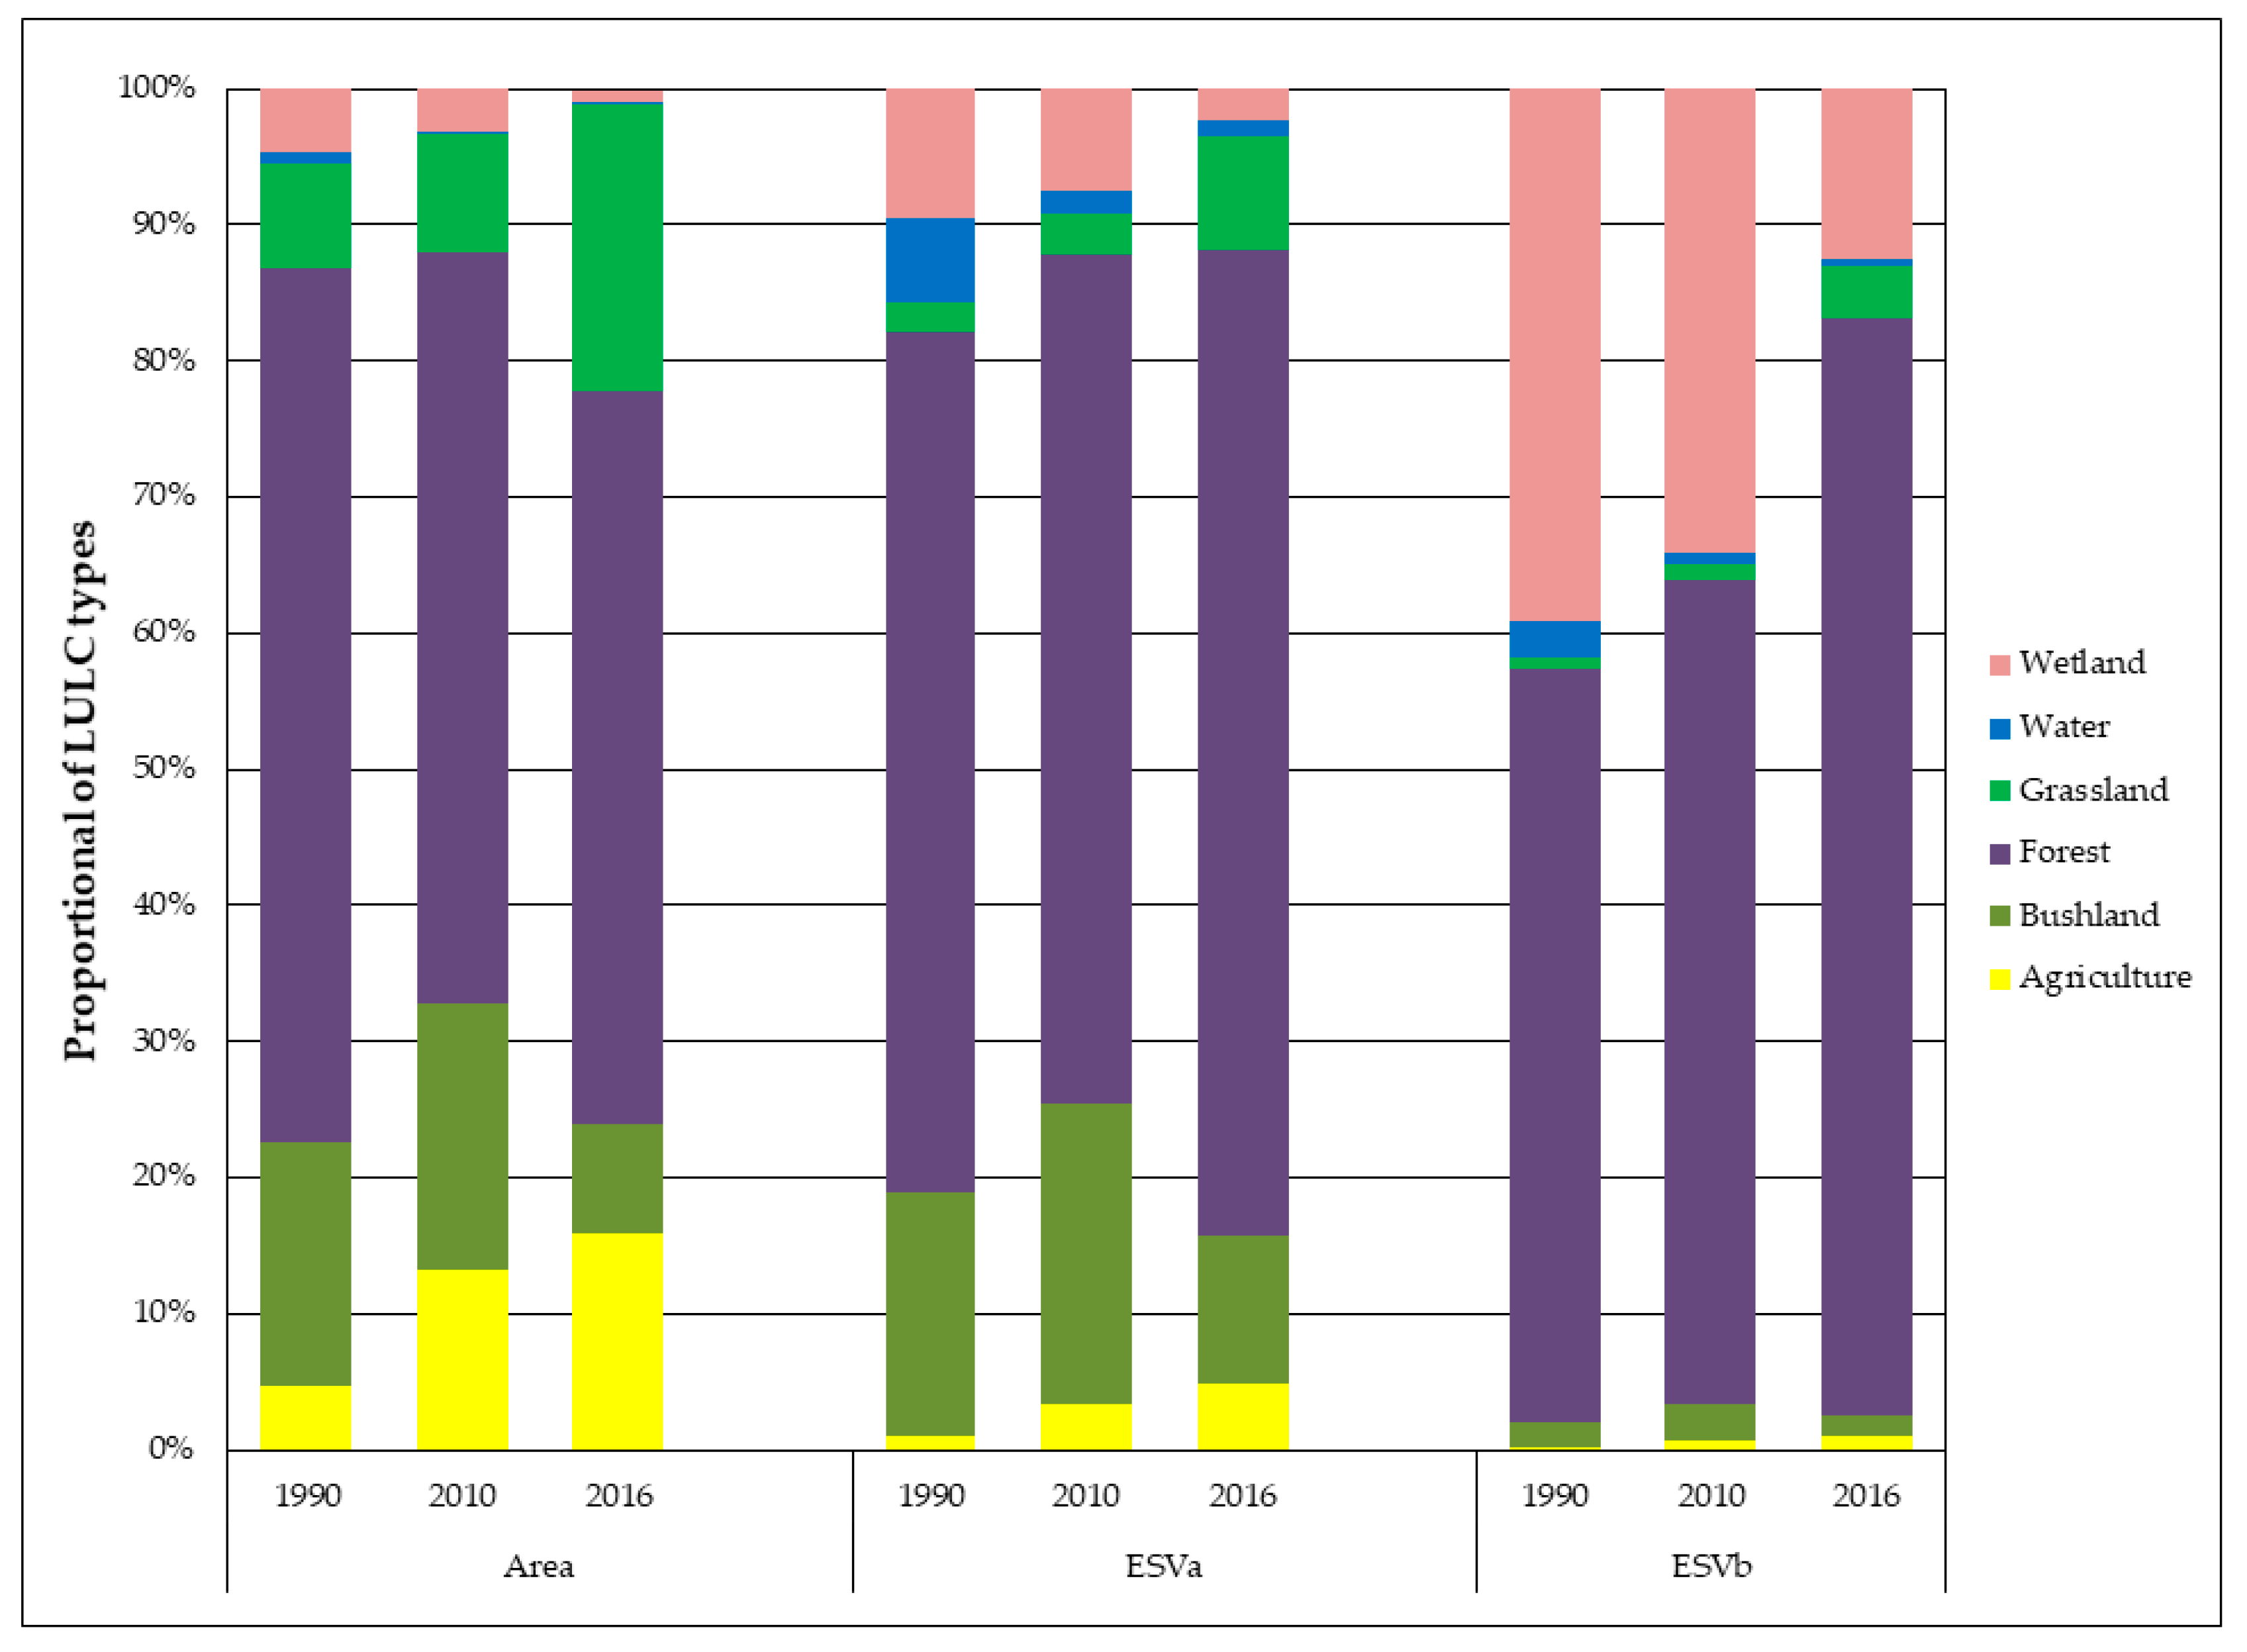
In general, the changes in the total ESVs were influenced by the changes in the areas of the LULC types in the study area different years (Figure 3). The LULC types have been changing towards decreased forest, bushland, wetland and water during the study period. The statistics of the LULC types in the area ratio showed that forest decreased from 64.1% in 1990 to 53.9% in 2016, implying a decrease of 10.3%. Moreover, the area of bushland also declined from 18% in 1990 to 18.1% in 2016, implying a decrease of 10%. The wetland area and water decreased from 4.6% to 0.4% and 0.8% to 0.1%, respectively, during the study duration (Figure 3).
The Markov chain transition matrix, showed that from 1990–2010, the forest area decreased by 2752 km2, of which 1651 km2 was converted into bushland, and 422 km2 and 444 km2 were changed to agricultural land and grassland, respectively. The wetlands decreased by 449 km2, with 324 km2 converted to grassland and 57 km2 into grassland (see Table 5). From 2010–2016, the area of forest decreased by 337 km2, of which 39.5% changed to grassland and 30.5% and 27% were converted into bushland and agricultural land, respectively. The area of bushland decreased by 34883 km2 with 44.7%, 34.1% and 20.5% converted to forest, grassland and agriculture, respectively. The wetlands were reduced by 705 km2, with 72.6% and 18.9% changing to grassland and agricultural, respectively (see Table 6). These changes have consequently led to significant decreased in the total ecosystem service values in the study area. For instance, in 1990, for the adopted modified local coefficients, the ESVs of forests, bushland, wetland and water accounted for approximately 1928.4 million (63.2%), 542.2 million (17.8%), 292 million (9.6%) and 185.6 million (6.1%), respectively, of the total ecosystem service values in the study area. In 2010, the forest contributed 1656.8 million (62.3%) of the total ESVs in the study area; bushland contributed 586.4 million (22.1%); wetland, 199.3 million (7.5%); and water, 45.4 million (1.7%). In 2016, forest also accounted for the large part of the ESVs i.e., 1619.7 million (72.4%), while bushland, wetland and water accounted for approximately 242.7 million (10.8%), 53.9 million (2.4%) and 24.3 million (1.1%), respectively, of the total ESVs in the study area (see Table 3). Additionally, the forest ecosystem greatly affected the total ecosystem service values in the study area, as the ecosystem service values declined significantly by 271.5 million (8.9%) from 1990–2010 and 37.2 million (1.4%) from 2010–2016, implying a decrease of 308.7 million (10.1%) (see Table 4).
However, the areas of agricultural land and grassland increased by 11.3% and 13.3%, respectively (Figure 3), implying an increase change in their ESVs of approximately US$ 77.4 million (2.5%) for agricultural land and US$ 118.9 million (3.9%) for the grassland, during the entire study period. Nevertheless, the increased in ESVs of agricultural land and grassland couldnot offset the contribution ofwetlands, forests, water, and bushlands to the loss in the total ESV in the study area.The area used for agriculture increased almost 11.3 times during the study period, but the corresponding ESV illustrated a slight increase from 1% in 1990 to 4.9% in 2016, implying an increasing trend of 2.5% (see Table 4)., This trend was lower compared to the increased area of agricultural land because the value coefficient of the agricultural land was lower than that of wetlands, water, and forests (see Table 1). This influence of land use/cover change on the total ESV was similar to that found when using global value coefficients.
3.3. Estimated Values of Ecosystem Functions and their Changes
The estimated annual value of the ecosystem functions and their changes in each year for the adopted modified local and global coefficients are shown in Table 7. It was revealed that 16 out of the 18 ecosystem services included in this study declined significantly when measured with the modified local coefficients (Table 7).
The exceptions were the food production and biological control, for which the ESVs increased by US$ 70 million and US$ 10.5 million, respectively, over the last 26 years, and the others declined spontaneously. There were six ecosystem services that decreased significantly and compromised 89.4% of the total ESV in 1990; water regulation (US$ 172.7 million), climate regulation (US$ 154.1 million), erosion control (US$146.1 million), nutrient cycling (US$122.2 million), habitat refugia (US$ 68 million) and water supply (US$ 62.1 million) (see Table 7). The decline in ESVs of water regulation, climate regulation, erosion control, nutrient cycling, habitat/refugia, and water supply were associated with the deforestation in the study area. The deforestation associated with forest conversion to cropland was intensive, as forest ecosystem had a large contribution to the decline in the total ESV of 10.1% and 8.9% as calculated by the modified local and global value coefficients, respectively (see Table 4). Moreover, the overall order of the contribution to the total ESV by the ecosystem service categories was as follows, from (high to low): regulating services (US$ 1862.3 million), which were followed by supporting services (US$ 641.7 million); provisioning services (US$ 518.0 million) and cultural services (US$ 27.7 million). This order of contribution remained the same through the study period, even though the contribution of the individual ecosystem service functions to the total ESV decreased by US$ 811.5 million throughout the study period. Although the amount was different when using the global coefficients, the trend of the contributions of the ecosystem services to the total ESV was observed to be similar (see Table 7).
4. Discussion
4.1. Changes in the Ecosystem Service Values and Land Use/Cover Change
The LULC data derived from remotely sensed imagery and GIS analysiswere employed as a proxy for the measurement together with their corresponding value coefficients to assess the changes in the ESVs in response to land use/cover change in the Kilombero Valley floodplain, southeastern Tanzania, based on the benefit transfer approach. This approach is currently being used by various researchers to evaluate ecosystem service values and their changes despite criticism of assumed uniformity within the land uses and the lack of consideration of the variation in the socioeconomic conditions within an area [7]. The benefit transfer approachallows elimination of the cost of ground data collection, and gathers quick and reliable information for similar data in data scarce areas [1,7,11,25,39]. In this study, the proxy LULC dataset produced by Msofe et al. [29] from the Landsat 5 Thematic Mapper™ and Landsat 8 Operational Land Imager (OLI) images and their corresponding global ecosystem service value coefficients that were adopted from Constanza et al. [1] as well as the modified local value coefficients from Kindu et al. and Temesgen et al. [7,33] were used to estimate the ecosystem service values and their changes. The changes in patterns of land use and land cover types were some of the important drivers that affected the quality and quantity of ecosystem services and the provision of functions [2]. The results showed that land use/cover change have been towards decreased forests, bushlands, wetlands, and water while agricultural land and grassland have increased, affecting the sustainability of the provision of ecosystem services to the Kilombero Valley floodplain ecosystem. These changes are due to population growth, intensification of human activities and government policies and initiatives that aim to improve the economy of the country without considering the environmental consequences [29,31].
The results of the estimated ESVs in the study area showed that the total ESV obtained from the adopted modified local value coefficients had decreased by US$ 811.5 million (26.6%) over the period from 1990 to 2016, whereas the loss was estimated to be US$ 3000.7 million (42.3%) when using the global value coefficients established by Constanza et al. [1]. This estimate was approximately 3.4 times higher than the loss estimated with the adopted modified local value coefficients. The decline in the total ESV was attributed to the decrease in the ESVs of forests, wetlands, bushlands and water, consistency with varied proportions during the study period. The reduction of these ecosystem service values was mainly attributed to the LUCC, which mainly decreased in area of the forests, bushlands, wetlands and water in the study area (Figure 3). The interaction of the changes in these LULC types affected the total estimated ecosystem service values in the study area. It was revealed that the ecosystem service values for the forest ecosystems contributed significantly to the declining total ESV by 10.1% and 8.9% according to the modified local value coefficients and global value coefficients, respectively (see Table 3 and Table 4). The aggregated area of change in the wetland and water was relatively small compared to those of other land use/cover types; however, they have a considerable impact on the total value of the ES due to their higher value coefficients.This was similar to the findings of other studies, which revealed that land use/cover change resulted in significant loss in the values of ecosystem services [5,6,7,19,23].
The quantitative results of our study for 1990–2010, 2010–2016 and 1990–2016 revealed the extent of the changes in the ESVs that occurred as a result of LUCC throughout the study period. In general, the total estimated ecosystem service values showed a declining trend for both the modified local value coefficients and the global value coefficients by Costanza et al. [1]. The total amounts of the changes in the ESVs were US$ 392.3 million (12.9%), US$ 419.2 million (15.8%) and US$ 811.5 million (26.6%) for 1990–2010, 2010–2016 and 1990–2016, respectively, when adopted locally modified value coefficients were used. With the global coefficients, although the amount differed, a significant decrease of the total values was also observed over the study period.
Moreover, our study revealed that there was a decrease in the contributions of the individual ecosystem service functions to the total ESV in the study area. Significant decreases occurred in the values of water regulation, climate regulation, erosion control, nutrient cycling habitat/refugia, and water supply, with the exception of the value of food production and biological control, which gradually increased during the study period. The increase in the value of food production was mainly due to the increase in the agricultural land. This was similar to the results of Tolessa et al. and Rai et al. [6,40], which revealed that the increased value of food production as the provisioning services was attributed to the increase in croplands in their study areas. Moreover, our estimation results it showed that the ecological degradation in the Kilombero valley floodplain had a larger affect on the provision of the ecosystem services in different categories, particularly the regulatory, provisioning and supporting services. This was also supported by Wilson et al. [32], who revealed that deforestation, agricultural expansion and the intensification of human activities have led to ecological degradation in the Kilombero Valley floodplain and have profoundly decreased large mammal populations, caused the loss of soil fertilityand increased soil erosion, deterioration of wildlife corridors and the loss of habitat/refugia. The limitation of this study was that we did not employ the coefficient of sensitivity (CS) analysis method to account for the uncertainty of the represented biomes because this method has been criticized by its inability to address the reliability of the ESV estimation. This is because CS analysis is independent from the ±50% change in VC and it always gives values less than 1, which inaccurately indicates that the coefficients are robust [5,41]. Therefore, our study highlighted that further research is needed to establish another coefficient sensitivity analysis method that can account for the uncertainty of the model and the represented biome types.
4.2. Environmental Planning and Management Implications of Changes in the ESV
The valuation of ecosystem services provides useful information for future appropriate intervention policies and laws that protect an ecosystem. It has been argued that the studies estimating ESV and their changes through time often provide useful evidence to guide policy and management decisions, but they rarely provide an indication of where this may be applicable to the protection [42]. This study provided means for comparing the changes in the ESVs from LUCC and identify the policy actions and strategies that can be employed to reduce the impacts, which will contribute to environmental management, spatial planning, and the formulation of the policies for the protection and conservation of the Kilombero Valley floodplain. Payments for environmental services (PES) are tool for managing ecosystems and are associated with ecological and economic services [43]. The Environmental and Management Act-EMA (2004) of Tanzania disputed the provision of PES in watershed and wetlands management, but no schemes have been established so far, probably due to financial constraints, the lack of public awareness and/or technical capacity [44]. However, due to the detrimental environmental degradation in the Kilombero Valley floodplain, particularly deforestation and wetland degradation, the management of the Kilombero Valley floodplain should emphasize decision-making that focuses on the specific ecosystem services and involvesPES to reduce the impacts of LUCC. Moreover, identification of strategic areas where PES and other mechanisms can be established by employing ecosystem-based spatial planning through strategic environmental assessmentto help reduce the ecosystem services loss associated with LUCC [45]. Additionally, there should be emphasis on the establishment of a management authority for the Kilombero Ramsar site, which will integrate various stakeholders, policy frameworks and ensure appropriate decision-making that considers all the elements of the ecological characteristics of the wetlands to assess the impact of human activities, including the effects of large agricultural schemes on wetland ecosystems while ensuring wise use of wetland resources. Furthermore, the development of an awareness-raising program that explains the importance of ecosystem services for human wellbeing and the incorporation of ecosystem services in spatial planning decisions will be a solution for maintaining and enhancing the functioning of ecosystem services in Kilombero and other areas of similar ecological importance.
5. Conclusions
The land use/cover changes in the Kilombero Valley floodplain have resulted in a loss of the ecosystem service values over the last 26 years. It is estimated that the total ESV has decreased by US$ 811.5 million (26.6%) when using the adopted modified local value coefficients to US$ 3000.7 million (42.3%) when using global value coefficients. This loss of ecosystem services is associated with decreased forests, wetlands, bushlands, and water. Moreover, significant changes have occurred in the values of the specific ecosystem functions, such as water regulation, climate regulation, erosion control, nutrient cycling, habitat/refugia, and water supply, which were among the highest contributors to the total ESVs in the Kilombero Valley floodplain. However, the value of food production and biological control has gradually increased during the study period, which is mainly due to increase in the agriculture land and grassland. The estimated losses of ecosystem service values in last 26 years have shown that Kilombero Valley floodplain has been ecologically degraded and that it needs attention. The minimum estimates provided by this study give preliminary information that can be utilized by various development stakeholders to take into account the financial costs of the ecological losses that occurred. Our study further recommends policy actions and strategies that take into consideration the ecosystem-based approach to maintain a balance between development initiatives and ecosystem health. In addition, local communities should adapt climate-smart agriculture, such as agroforestry, to protect forests and payment for environmental services (PES) to protect forests and wetlands, which have had larger contributions to the total ESVs. Nevertheless, the valuation of the ecosystem services showed the status of the ecosystem services in the Kilombero Valley floodplain and the minimum estimated values that provide insight into the tradeoffs involved in land resource use.
Author Contributions
N.K.M. designed the study, analyzed the data, and prepared the manuscript with contributions from L.S., Z.L. and J.L. who contributed to the conceptualization of ideas, the methodology and the review of the manuscript; Supervision, Z.L. All authors have read and agreed to the published version of the manuscript.
Funding
This study was undertaken with the financial support through a Ph.D. scholarship to Nangware Kajia Msofe [JJKH20180024KJ] and [2016YFC0500407]. Sincere thanks also go to her supervisor, Sheng Lianxi for his endless support in carrying out the research and developing the manuscript.
Acknowledgments
Nangware Kajia Msofe is thankful to the Chinese Government Scholarship (CSC) for providing funds to carry out this research as part of her PhD studies. Sincere thanks also go to her supervisor, Sheng Lianxi for his endless support in carrying out the research and developing the manuscript.
Conflicts of Interest
The authors declare that they have no conflict of interest.
References
- Costanza, R.; Darge, R.; de Groot, R.; Farber, S.; Grasso, M.; Hannon, B.; Limburg, K.; Naeem, S.; Oneill, R.V.; Paruelo, J.; et al. The value of the world’s ecosystem services and natural capital. Nature 1997, 387, 253–260. [Google Scholar] [CrossRef]
- Costanza, R.; Groot, R.D.; Sutton, P.; Ploeg, S.V.D.; Anderson, S.J.; Kubiszewski, I.; Farber, S.; Turner, R.K. Changes in the global value of ecosystem services. Glob. Environ. Chang. 2014, 26, 152–158. [Google Scholar] [CrossRef]
- Ecosystem Assessment, M. Ecosystems and Human Well-Being: General Synthesis; In Island Press: Washington, DC, USA, 2005. [Google Scholar]
- Food and Agriculture Organization. Agriculture and Climate Change: FAO Role; In Viale delle Terme di Caracall; FAO: Rome, Italy, 1997. [Google Scholar]
- Gashaw, T.; Tulu, T.; Argaw, M.; Worqlul, A.W.; Tolessa, T.; Kindu, M. Estimating the impacts of land use/land cover changes on Ecosystem Service Values: The case of the Andassa watershed in the Upper Blue Nile basin of Ethiopia. Ecosyst. Serv. 2018, 31, 219–228. [Google Scholar] [CrossRef]
- Tolessa, T.; Senbeta, F.; Kidane, M. The impact of land use/land cover change on ecosystem services in the central highlands of Ethiopia. Ecosyst. Serv. 2017, 23, 47–54. [Google Scholar] [CrossRef]
- Kindu, M.; Schneider, T.; Teketay, D.; Knoke, T. Changes of ecosystem service values in response to land use/land cover dynamics in Munessa-Shashemene landscape of the Ethiopian highlands. Sci. Total Environ. 2016, 547, 137–147. [Google Scholar] [CrossRef] [PubMed]
- Zorrillamiras, P.; Palomo, I.; Gómezbaggethun, E.; Martínlópez, B.; Lomas, P.L.; Montes, C. Effects of land-use change on wetland ecosystem services: A case study in the Doñana marshes (SW Spain). Landsc. Urban Plan. 2014, 122, 160–174. [Google Scholar] [CrossRef]
- De Groot, R.; Brander, L.; van der Ploeg, S.; Costanza, R.; Bernard, F.; Braat, L.; Christie, M.; Crossman, N.; Ghermandi, A.; Hein, L.; et al. Global estimates of the value of ecosystems and their services in monetary units. Ecosyst. Serv. 2012, 1, 50–61. [Google Scholar] [CrossRef]
- TEEB Foundations. The Economics of Ecosystems and Biodiversity: Ecological and Economic Foundations; Earthscan: London, UK, 2010. [Google Scholar]
- Kreuter, U.P.; Harris, H.G.; Matlock, M.D.; Lacey, R.E. Change in ecosystem service values in the San Antonio area, Texas. Ecol. Econ. 2001, 39, 333–346. [Google Scholar] [CrossRef]
- Liu, S.; Costanza, R.; Farber, S.; Troy, A. Valuing ecosystem services: Theory, practice, and the need for a transdisciplinary synthesis. Ann. N. Y. Acad. Sci. 2010, 1185, 54–78. [Google Scholar] [CrossRef]
- Daily, G. Nature’s Services: Societal Dependence on Natural Ecosystems; Island Press: Washington, DC, USA, 1997. [Google Scholar]
- Farber, S.; Costanza, R.D.L.; Erickson, J.; Gross, K.; Grove, M.; Hopkinson, C.S.; Kahn, J.; Pincetl, S.; Troy, A.; Warren, P. Linking ecology and economics for ecosystem management. Bioscience 2006, 56, 121–133. [Google Scholar] [CrossRef] [Green Version]
- Turner, R.K.; Schaafsma, M. Valuation of Coastal and Marine Ecosystem Services: A Literature Review; Springer International Publishing: Basel, Switzerland, 2015. [Google Scholar]
- Pearce, D. Auditing the Earth: The Value of the World’s Ecosystem Services and Natural Capital. Environ. Sci. Policy Sustain. Dev. 1998, 40, 23–28. [Google Scholar] [CrossRef]
- Richardson, L.; Loomis, J.; Kroeger, T.; Casey, F. The role of benefit transfer in ecosystem service valuation. Ecol. Econ. 2015, 115, 51–58. [Google Scholar] [CrossRef]
- Kubiszewski, I.; Costanza, R.; Anderson, S.; Sutton, P. The future value of ecosystem services: Global scenarios and national implications. Ecosyst. Serv. 2017, 26, 289–301. [Google Scholar] [CrossRef]
- Wang, Y.; Dai, E.; Yin, L.; Ma, L. Land use/land cover change and the effects on ecosystem services in the Hengduan Mountain region, China. Ecosyst. Serv. 2018, 34, 55–67. [Google Scholar] [CrossRef]
- Wang, X.; Dong, X.; Liu, H.; Wei, H.; Fan, W.; Lu, N.; Xu, Z.; Ren, J.; Xing, K. Linking land use change, ecosystem services and human well-being: A case study of the Manas River Basin of Xinjiang, China. Ecosyst. Serv. 2017, 27, 113–123. [Google Scholar] [CrossRef]
- Troy, A.; Wilson, M.A. Mapping ecosystem services: Practical challenges and opportunities in linking GIS and value transfer. Ecol. Econ. 2007, 60, 435–449. [Google Scholar] [CrossRef]
- Liu, S.; Costanza, R. Ecosystem services valuation in China. Ecol. Econ. 2010, 69, 1387–1388. [Google Scholar] [CrossRef]
- Zhang, F.; Yushanjiang, A.; Jing, Y. Assessing and predicting changes of the ecosystem service values based on land use/cover change in Ebinur LakeWetland National Nature Reserve, Xinjiang, China. Sci. Total Environ. 2019, 656, 1133–1144. [Google Scholar] [CrossRef]
- Hein, L.; Van Koppen, K.; Groot, R.S.; Van Ierland, E. Spatial scales, stakeholders and the valuation of ecosystem services. Ecol. Econ. 2006, 57, 209–228. [Google Scholar] [CrossRef]
- De Groot, R.S.; Alkemade, R.; Braat, L.; Hein, L.; Willemen, L. Challenges in integrating the concept of ecosystem services and values in landscape planning, management and decision making. Ecol. Complex 2010, 7, 260–272. [Google Scholar] [CrossRef]
- Turner, R.K.; Paavola, J.; Cooper, P.; Farber, S.; Jessamy, V.; Georgiou, S. Valuing nature: Lessons learned and future research directions. Ecol. Econ. 2002, 46, 493–510. [Google Scholar] [CrossRef] [Green Version]
- Kangalawe, R.Y.; Liwenga, E.T. Livelihoods in the wetlands of Kilombero Valley in Tanzania: Opportunities and challenges to integrated water resource management. Phys. Chem. Earth Parts A/B/C 2005, 30, 968–975. [Google Scholar] [CrossRef]
- WWF. For a Living Planet. Available online: http://www.panda.org.za/article.php?id=286 (accessed on 15 May 2018).
- Msofe, N.K.; Sheng, L.; Lyimo, J. Land Use Change Trends and Their Driving Forces in the Kilombero Valley Floodplain, Southeastern Tanzania. Sustainability 2019, 11, 505. [Google Scholar] [CrossRef] [Green Version]
- Muro, J.; Lopez, A.; Strauch, A.; Steinbach, S.; Truckenbrodt, J.; Thonfeld, F. 25 years of landscape changes in the Kilombero floodplain, Tanzania. In Proceedings of the Worldcover 2017 Conference, European Space Agency-ESRIN, Rome, Italy, 14–16 March 2017. [Google Scholar]
- Leemhuis, C.; Thonfeld, F.; Näschen, K.; Steinbach, S.; Muro, J.; Strauch, A.; López, A.; Daconto, G.; Games, I.; Diekkrüger, B. Sustainability in the Food-Water-Ecosystem Nexus: The Role of Land Use and Land Cover Change for Water Resources and Ecosystems in the Kilombero Wetland, Tanzania. Sustainability 2017, 9, 1513. [Google Scholar] [CrossRef] [Green Version]
- Wilson, E.; McInnes, R.; Mbanga, D.P.; Ouedraogo, P. Ramsar Advisory Mission Report; Ramsar Site No. 1173; United Republic of Tanzania: Dar es Salaam, Tanzania, 23 May 2018. [Google Scholar]
- Temesgen, H.; Wu, W.; Shi, X.; Yirsaw, E.; Bekele, B.; Kindu, M. Variation in Ecosystem Service Values in an Agroforestry Dominated Landscape in Ethiopia: Implications for Land Use and Conservation Policy. Sustainability 2018, 10, 1126. [Google Scholar] [CrossRef] [Green Version]
- Ramsar Convention. The Ramsar Convention; Center, R., Ed.; IUCN: Gland, Switzerland, 1971. [Google Scholar]
- Starkey, M.; Birnie, N.; Cameron, A.; Daffa, R.A.; Haddelsey, L.; Hood, L.; Johnson, N.; Kapapa, L.; Makoti, J.; Mwangomo, E.; et al. The Kilombero Valley Wildlife Project: An Ecological and Social Survey in the Kilombero Valley, Tanzania; Kilombero Valley Wildlife Project: Edinburgh, UK, 2002; p. 104. [Google Scholar]
- United Republic of Tanzania, U. Baseline Study of the Kilombero Valley Ramsar Site, Ifakara, Morogoro, Tanzania; Department of Zoology and Wildlife Conservation, University of Dar es Salaam: Dar es Salaam, Tanzania, 2010. [Google Scholar]
- Li, T.H.; Li, W.K.; Qian, Z.H. Variations in ecosystem service value in response to land use changes in Shenzhen. Ecol. Econ. 2010, 69, 1427–1435. [Google Scholar]
- Zhang, Z.Q.; Zhong-Min, X.U.; Cheng, G.D. Valuation of ecosystem services and natural capital. Acta Ecol. Sin. 2001, 21, 1918–1926. [Google Scholar]
- Farber, S.C.; Costanza, R.; Wilson, M.A. Economic and ecological concepts for valuing ecosystem services. Ecol. Econ. 2002, 41, 375–392. [Google Scholar] [CrossRef]
- Rai, R.; Zhang, Y.; Paudel, B.; Acharya, B.K.; Basnet, L. Land Use and Land Cover Dynamics and Assessing the Ecosystem Service Values in the Trans-Boundary Gandaki River Basin, Central Himalayas. Sustainability 2018, 10, 52. [Google Scholar] [CrossRef] [Green Version]
- Aschonitis, V.; Gaglio, M.; Castaldelli, G.; Fano, E. Criticism on elasticity sensitivity coefficient for assessing the robustness and sensitivity of ecosystem services values. Ecosyst. Serv. 2016, 20, 66–68. [Google Scholar] [CrossRef]
- Ferreira, L.M.R.; Esteves, L.S.; de Souza, E.P.; dos Santos, C.A.C. Impact of the Urbanisation Process in the Availability of Ecosystem Services in a Tropical Ecotone Area. Ecosystems 2019, 22, 266–282. [Google Scholar] [CrossRef] [Green Version]
- Ferraro, P.; Kiss, A. Direct payments to conserve biodiversity. Science 2002, 298, 1718–1719. [Google Scholar] [CrossRef] [PubMed] [Green Version]
- Ministry of Natural Resources and Tourism (MNRT). Legal and Institutional Frame Work in the Context of REDD in Tanzania; Institute of Resource Assessment (IRA) University of Dar-Es-Salaam, Tanzania En Route To The Government of the United Republic of Tanzania: Dar es Salaam, Tanzania, 2010; p. 140.
- Rozas-Va’ squez, D.; Furst, C.; Geneletti, D.; Almendra, O. Integration of ecosystem services in strategic environmental assessment across spatial planning scales. Land Use Policy 2018, 71, 303–310. [Google Scholar] [CrossRef]
Figure 1.
Map showing location, current land use and land cover (LULC) types of the Kilombero Valley floodplain, southeastern Tanzania. (Modified after Msofe et al., 2019).
Figure 1.
Map showing location, current land use and land cover (LULC) types of the Kilombero Valley floodplain, southeastern Tanzania. (Modified after Msofe et al., 2019).

Figure 2.
Flowchart of the methodological approach for this study (United States Geological Survey (USGS)); random forest (RF) alogarithm; land use and land cover (LULC); ecosystem service value (ESV); ecosystem service value of function (ESVf)). (Modified after Msofe et al., 2019).
Figure 2.
Flowchart of the methodological approach for this study (United States Geological Survey (USGS)); random forest (RF) alogarithm; land use and land cover (LULC); ecosystem service value (ESV); ecosystem service value of function (ESVf)). (Modified after Msofe et al., 2019).

Figure 3.
Contributions of the areas and ecosystem service values in percentages by LULC types in 1990, 2010, and 2016 in the Kilombero Valley floodplain (ESVa = value obtained using the modified local value coefficients adopted from Kindu et al. and Temesgen et al. [7,33], with permission from Elsevier, 2016 and MDPI, 2018, respectively and ESVb = the value obtained by using the global value coefficients of Costanza et al. [1], with permission from Nature research, 1997).


Table 1.
Land use and land cover (LULC) types with their areas in increment of 102 ha for 1990, 2010 and 2016 adapted from Msofe et al. [29] and biome equivalents with their corresponding ecosystem service value coefficients (VC) in 1994 US$ ha−1year−1 (a) modified local value coefficients (adapted from Kindu et al. and Temesgen et al. [7,33]), with permission from Elsevier, 2016 and MDPI, 2018, respectively (b) global value coefficients (adapted from Costanza et al. [1], with permission from Nature research, 1997).
| LULC Types | Year Area (102 ha) | Local (VC) 1994 US$ ha−1 year−1 | Global (VC) 1994 US$ ha−1 year−1 | |||
|---|---|---|---|---|---|---|
| 1990 | 2010 | 2016 | Equivalent Biome | a | b | |
| Agriculture | 1412 | 4053 | 4842 | Cropland | 226 | 92 |
| Bare land | 11 | 7 | 7 | Desert | 0 | 0 |
| Bushland | 5497 | 5943 | 2460 | Tropical Forest | 987 | 244 |
| Forest | 19,544 | 16,792 | 16,415 | Tropical Forest | 987 | 2008 |
| Grassland | 2370 | 2660 | 6425 | Grasslands | 293 | 244 |
| Settlement | 0 | 1 | 38 | Urban | 0 | 0 |
| Water | 229 | 56 | 30 | Fresh water | 8103 | 8498 |
| Wetland | 1415 | 966 | 261 | Wetland/Marsh | 2064 | 19581 |
Table 2.
Details of the ecosystem service functions and their modified value coefficients for each LULC type in 1994 US$ ha−1 year−1 based on the adopted modified local coefficients.
Table 2.
Details of the ecosystem service functions and their modified value coefficients for each LULC type in 1994 US$ ha−1 year−1 based on the adopted modified local coefficients.
| Ecosystem Services | Each LULC Types of Ecosystem Service Values (1994US$/ha/year) | |||||
|---|---|---|---|---|---|---|
| Agriculture | Bushland | Forest | Grassland | Water | Wetland | |
| Provisioning services | ||||||
| Water supply | 8 | 8 | 2117 | 130.19 | ||
| Food production | 187.56 | 32.0 | 32.0 | 117.45 | 41 | 185.68 |
| Raw material | 51.2 | 51.2 | 151 | |||
| Genetic resources | 41.0 | 41.0 | 49.42 | |||
| Medical services | 71.17 | |||||
| Regulating services | ||||||
| Water regulation | 6 | 6 | 3 | 5445 | 536.02 | |
| Waste treatment | 136.0 | 136.0 | 87 | 431.5 | 23.84 | |
| Erosion control | 245.0 | 245.0 | 29 | 58.74 | ||
| Climate regulation | 223.0 | 223.0 | 143.99 | |||
| Biological control | 24 | 23 | ||||
| Gas regulation | 13.68 | 13.68 | 7 | 48.7 | ||
| Disturbance regulation | 5 | 5 | ||||
| Supporting services | ||||||
| Nutrient cycling | 184.4 | 184.4 | 74.06 | |||
| Pollination | 14 | 7.27 | 7.27 | 25 | ||
| Soil formation | 10 | 10 | 1 | 31.43 | ||
| Habitat/refugia | 17.3 | 17.3 | 496.64 | |||
| Cultural services | ||||||
| Recreation | 4.8 | 4.8 | 0.8 | 69 | 14.96 | |
| Cultural | 2 | 2 | 47.68 | |||
| Total | 225.56 | 986.69 | 986.69 | 293.25 | 8103.5 | 2063.53 |
(Source: Kindu et al., 2016 and Temesgen et al., 2018, with permission from Elsevier, 2016 and MDPI, 2018).
Table 3.
Results of the estimated ecosystem service values per LULC type in the Kilombero Valley floodplain in (1994 US$ million per year) for 1990, 2010 and 2016 using (Part a) adopted modified local value coefficients from Kindu et al. and Temesgen et al. [7,33], with permission from Elsevier, 2016 and MDPI, 2018, respectively (Part b) global value coefficients Costanza et al. [1], with permission from Nature research, 1997.
| 1990 | 2010 | 2016 | ||||
|---|---|---|---|---|---|---|
| Land Use/Cover Type | ESV | % | ESV | % | ESV | % |
| Part a | ||||||
| Agriculture | 31.8 | 1.0 | 91.4 | 3.4 | 109.2 | 4.9 |
| Bushland | 542.4 | 17.8 | 586.4 | 22.1 | 242.7 | 10.8 |
| Forest | 1928.4 | 63.2 | 1656.8 | 62.3 | 1619.7 | 72.4 |
| Grassland | 69.5 | 2.3 | 78.0 | 2.9 | 188.4 | 8.4 |
| Water | 185.6 | 6.1 | 45.4 | 1.7 | 24.3 | 1.1 |
| Wetland | 292.0 | 9.6 | 199.3 | 7.5 | 53.9 | 2.4 |
| Total | 3049.7 | 100 | 2657.4 | 100 | 2238.2 | 100 |
| Part b | ||||||
| Agriculture | 13.0 | 0.2 | 37.3 | 0.7 | 44.5 | 1.1 |
| Bushland | 134.1 | 1.9 | 145.0 | 2.6 | 60.0 | 1.5 |
| Forest | 3924.4 | 55.3 | 3371.8 | 60.7 | 3296.1 | 80.5 |
| Grassland | 57.8 | 0.8 | 64.9 | 1.2 | 156.8 | 3.8 |
| Water | 194.6 | 2.7 | 47.6 | 0.9 | 25.5 | 0.6 |
| Wetland | 2770.7 | 39.1 | 1891.5 | 34.0 | 511.1 | 12.5 |
| Total | 7094.7 | 100 | 5558.1 | 100 | 4094.0 | 100 |
Table 4.
Amount of changes in the ESVs from 1990–2010, 2010–2016 and 1990–2016 in US$ million for each LULC type using (Part a) the adopted modified local value coefficients from Kindu et al. and Temesgen et al. [7,33], with permission from Elsevier, 2016 and MDPI, 2018, respectively (Part b) the global value coefficients from Costanza et al. [1], with permission from Nature research, 1997 and the percentage changes (%).
| Land Use/Cover Type | 1990–2010 | 2010–2016 | 1990–2016 | |||
|---|---|---|---|---|---|---|
| Million US$ | Proportion % | Million US$ | Proportion % | Million US$ | Proportion % | |
| Part a | ||||||
| Agriculture | 59.6 | 2.0 | 17.8 | 0.7 | 77.4 | 2.5 |
| Bushland | 44.0 | 1.4 | −343.7 | −12.9 | −299.7 | −9.8 |
| Forest | −271.5 | −8.9 | −37.2 | −1.4 | −308.7 | −10.1 |
| Grassland | 8.5 | 0.3 | 110.4 | 4.2 | 118.9 | 3.9 |
| Water | −140.2 | −4.6 | −21.1 | −0.8 | −161.3 | −5.3 |
| Wetland | −92.7 | −3.0 | −145.5 | −5.5 | −238.1 | −7.8 |
| Total | −392.3 | −12.9 | −419.2 | −15.8 | −811.5 | −26.6 |
| Part b | ||||||
| Agriculture | 24.3 | 0.3 | 7.3 | 0.1 | 31.6 | 0.4 |
| Bushland | 10.9 | 0.2 | −85.0 | −1.5 | −74.1 | −1.0 |
| Forest | −552.6 | −7.8 | −75.7 | −1.4 | −628.3 | −8.9 |
| Grassland | 7.1 | 0.1 | 91.9 | 1.7 | 98.9 | 1.4 |
| Water | −147.0 | −2.1 | −22.1 | −0.4 | −169.1 | −2.4 |
| Wetland | −879.2 | −12.4 | −1380.5 | −24.8 | −2259.6 | −31.8 |
| Total | −1536.5 | −21.7 | −1464.1 | −26.3 | −3000.7 | −42.3 |
Table 5.
Transition matrix of the land use in the Kilombero Valley floodplain from 1990 to 2010 (km2).
Table 5.
Transition matrix of the land use in the Kilombero Valley floodplain from 1990 to 2010 (km2).
| 1990/2010 | Agriculture | Bare Soil | Bushland | Forest | Grassland | Urban Area | Water | Wetland |
|---|---|---|---|---|---|---|---|---|
| Agriculture | 571 | 3 | 1327 | 1046 | 726 | 1 | 52 | 300 |
| Bare soil | 2 | 2 | 1 | 0 | 1 | 0 | 0 | 1 |
| Bushland | 251 | 3 | 1686 | 3094 | 585 | 0 | 30 | 311 |
| Forest | 422 | 4 | 1615 | 14,022 | 444 | 0 | 49 | 198 |
| Grassland | 97 | 0 | 720 | 1285 | 278 | 0 | 38 | 258 |
| Urban area | 0 | 0 | 1 | 1 | 0 | 0 | 0 | 0 |
| Water | 4 | 0 | 5 | 20 | 5 | 0 | 13 | 10 |
| Wetland | 57 | 0 | 120 | 86 | 324 | 0 | 40 | 341 |
Table 6.
Transition matrix of land use in the Kilombero Valley floodplain from 2010 to 2016 (km2).
| 2010/2016 | Agriculture | Bare Soil | Bushland | Forest | Grassland | Urban Area | Water | Wetland |
|---|---|---|---|---|---|---|---|---|
| Agriculture | 1943 | 1 | 1115 | 1206 | 396 | 2 | 2 | 177 |
| Bare soil | 1 | 0 | 0 | 6 | 0 | 0 | 0 | 0 |
| Bushland | 360 | 1 | 521 | 1359 | 189 | 0 | 1 | 40 |
| Forest | 554 | 0 | 2430 | 12,328 | 1033 | 0 | 16 | 38 |
| Grassland | 1123 | 5 | 1842 | 1769 | 990 | 0 | 16 | 680 |
| Urban area | 17 | 0 | 6 | 13 | 3 | 0 | 0 | 0 |
| Water | 1 | 0 | 2 | 4 | 2 | 0 | 17 | 1 |
| Wetland | 37 | 0 | 32 | 105 | 48 | 0 | 6 | 34 |
Table 7.
Estimated annual value of the ecosystem functions (ESVf in US$ million per year) under each services category for the different years and the changes between years (1990–2016).
Table 7.
Estimated annual value of the ecosystem functions (ESVf in US$ million per year) under each services category for the different years and the changes between years (1990–2016).
| Ecosystem Services | Using Modified Local Value Coefficient | Using Global Value Coefficient | ||||||
|---|---|---|---|---|---|---|---|---|
| ESVf 1990 | ESVf 2010 | ESVf 2016 | Relative Change to 1990 | ESVf 1990 | ESVf 2010 | ESVf 2016 | Relative Change to 1990 | |
| Provisioning Services | ||||||||
| Water supply | 86.9 | 42.6 | 24.8 | −62.1 | 1139.5 | 759.4 | 217.8 | −921.7 |
| Food production | 161.7 | 198.2 | 231.6 | 70.0 | 130.5 | 138.0 | 139.6 | 9.1 |
| Raw material | 149.7 | 131.1 | 100.7 | −49.0 | 622.6 | 533.7 | 518.4 | −104.2 |
| Genetic resources | 109.7 | 98.0 | 78.7 | −31.0 | 80.1 | 68.8 | 67.3 | −12.8 |
| Medical services | 10.1 | 6.9 | 1.9 | −8.2 | 0.0 | 0.0 | 0.0 | 0.0 |
| Regulating Services | ||||||||
| Water regulation | 216.3 | 96.7 | 43.6 | −172.7 | 143.0 | 46.0 | 29.6 | −113.4 |
| Waste treatment | 374.4 | 337.1 | 314.5 | −59.9 | 488.5 | 384.9 | 265.4 | −223.0 |
| Erosion control | 628.7 | 570.4 | 482.6 | −146.1 | 501.6 | 436.4 | 427.9 | −73.7 |
| Climate regulation | 578.8 | 520.9 | 424.7 | −154.1 | 435.8 | 374.5 | 366.1 | −69.8 |
| Biological control | 8.8 | 15.8 | 26.4 | 17.6 | 21.5 | 29.5 | 32.1 | 10.6 |
| Gas regulation | 42.8 | 37.7 | 31.6 | −11.2 | 43.0 | 31.6 | 13.1 | −29.9 |
| Disturbance regulation | 12.5 | 11.4 | 9.4 | −3.1 | 1034.2 | 707.8 | 197.2 | −837.1 |
| Supporting Services | ||||||||
| Nutrient cycling | 472.2 | 426.4 | 350.0 | −122.2 | 1802.0 | 1548.2 | 1513.5 | −288.5 |
| Pollination | 26.1 | 28.9 | 36.6 | 10.5 | 21.6 | 27.2 | 29.0 | 7.3 |
| Soil formation | 29.7 | 26.0 | 20.3 | −9.4 | 20.3 | 17.7 | 17.3 | −3.0 |
| Habitat/refugia | 113.6 | 87.3 | 45.6 | −68.0 | 62.1 | 42.4 | 11.5 | −50.7 |
| Cultural Services | ||||||||
| Recreation | 15.9 | 13.0 | 10.2 | −5.7 | 295.2 | 238.5 | 199.1 | −96.1 |
| Cultural | 11.8 | 9.2 | 5.0 | −6.7 | 253.1 | 173.5 | 49.2 | −203.8 |
| Total | 3049.7 | 2657.4 | 2238.2 | −811.5 | 7094.7 | 5558.1 | 4094.0 | −3000.7 |
© 2020 by the authors. Licensee MDPI, Basel, Switzerland. This article is an open access article distributed under the terms and conditions of the Creative Commons Attribution (CC BY) license (http://creativecommons.org/licenses/by/4.0/).
Share and Cite
MDPI and ACS Style
Msofe, N.K.; Sheng, L.; Li, Z.; Lyimo, J. Impact of Land Use/Cover Change on Ecosystem Service Values in the Kilombero Valley Floodplain, Southeastern Tanzania. Forests 2020, 11, 109. https://0-doi-org.brum.beds.ac.uk/10.3390/f11010109
AMA Style
Msofe NK, Sheng L, Li Z, Lyimo J. Impact of Land Use/Cover Change on Ecosystem Service Values in the Kilombero Valley Floodplain, Southeastern Tanzania. Forests. 2020; 11(1):109. https://0-doi-org.brum.beds.ac.uk/10.3390/f11010109
Chicago/Turabian StyleMsofe, Nangware Kajia, Lianxi Sheng, Zhenxin Li, and James Lyimo. 2020. "Impact of Land Use/Cover Change on Ecosystem Service Values in the Kilombero Valley Floodplain, Southeastern Tanzania" Forests 11, no. 1: 109. https://0-doi-org.brum.beds.ac.uk/10.3390/f11010109
Note that from the first issue of 2016, this journal uses article numbers instead of page numbers. See further details here.