Fire Suppression Resource Scarcity: Current Metrics and Future Performance Indicators

1
Department of Forest and Rangeland Stewardship, Colorado State University, Fort Collins, CO 80523, USA
2
Rocky Mountain Research Station, US Department of Agriculture Forest Service, 800 East Beckwith Avenue, Missoula, MT 59801, USA
*
Author to whom correspondence should be addressed.
Forests 2020, 11(2), 217; https://0-doi-org.brum.beds.ac.uk/10.3390/f11020217
Submission received: 30 December 2019
/
Revised: 10 February 2020
/
Accepted: 11 February 2020
/
Published: 14 February 2020
(This article belongs to the Special Issue Forest Fire Suppression: Consequences, Management Approaches, and New Paradigms)
Abstract
:Wildland fire occurrence is highly variable in time and space, and in the United States where total area burned can vary substantially, acquiring resources (firefighters, engines, aircraft, etc.) to respond to fire demand is an important consideration. To determine the composition and scale of this set of suppression resources managers may utilize data produced by past supply and demand information. The key challenge with this approach is that there is currently no clear system of record to track suppression resource supply and demand, and there are potential pitfalls within existing systems that may provide misleading information regarding the true levels of resource scarcity. In this manuscript, we investigate the issue of resource scarcity by examining two key resources that operations personnel have identified as both high value and scarce: type 1 firefighting crews and large airtankers. We examine data from the Resource Ordering and Status System and analyze the level of resource scarcity indicated by these data over the 2014–2018 fire seasons. We focus on data metrics with potential utility for managers responsible for annual national-level decisions regarding crew and airtanker acquisition; some of these metrics are already used to inform such decisions. We examine the limitations of each metric and suggest new metrics that could more accurately reflect true resource use and scarcity. Such metrics could lead to a substantially improved decision-making process.
1. Introduction
Fire suppression resources are the core of any wildfire management organization. In the United States (US) where various federal, state, and local agencies generally work together to respond to wildfire protection needs through a shared stewardship, multi-agency approach, each partner Agency provides a different set of suppression resources. These suppression resources are comprised of ground forces (crews of firefighters, bulldozers, fire engines, etc.) and aerial assets (airplanes, helicopters, airtankers, etc.) that employ a range of tactical actions to achieve suppression objectives. The US Forest Service (USFS) employs thousands of wildland firefighters to staff fire engines, hand crews, and other suppression resources, providing the largest share of all wildland fire suppression capacity in the country [1]. In addition, the USFS enters contractual agreements with private vendors to provide crews, engines, helicopters, and aircraft, including large and very large airtankers. The Agency provides these resources to fight fires across all jurisdictions (including non-federal lands) and relies on partnerships and agreements with other federal and non-federal agencies to provide additional resources to help meet suppression demand on National Forest lands. Though they are crucial to wildland firefighting, these ground and aerial resources are limited due to logistical, practical, and geographical considerations. During most fire seasons, the fire response organization in the US experiences at least one period of severe fire activity during which fire suppression resources are scarce, resulting in some unfilled requests for fire suppression support, e.g., [2].
Balancing the demand for fire suppression resources with budgetary constraints is an ongoing Agency priority for the USFS [3,4]. Fire suppression resource use comprises a large portion of USFS fire suppression expenses, and rising fire expenditures associated with changes in wildfire occurrence and management issues continue to challenge the Agency [5]. Currently, USFS fire suppression expenditures (2.6 billion US Dollars in Fiscal Year 2018; see [6]) represent nearly two-thirds of the total Agency budget, up from 16% in 1995 [5]; this increase in fire expenditures has hindered other Agency priorities such as protection of watersheds and cultural resources, maintenance of current programs and infrastructure for a range of multiple uses, benefits, and ecosystem services provided by the National Forests, and other forestry research and technical assistance. A long-sought “fire funding fix” was approved by the US Congress in 2018 to address the negative effects of increasing wildland fire suppression expenditures on the Agency’s non-fire programs. The Wildfire Suppression Funding and Forest Management Activities Act of the 2018 Omnibus Spending Bill stabilizes Agency spending across all programs, but it requires additional accountability and related efficiency metrics reporting on fire system performance in order to maintain lawmaker support for the level of funding provided by the Bill [4]. The Bill’s language provides the Agency substantial leeway in how to design, track, and present such metrics. This presents the USFS with an opportunity to design and implement resource tracking in an informative and relevant manner, facilitating post-season analyses that provide a clear picture of resource use, demand, and scarcity to decision makers. This opportunity helps motivate this assessment of current metrics to identify what information is already available and what is needed to adequately support a transparent and robust decision-making process.
The size and composition of the wildland firefighting resource pool has potential to greatly impact periods of resource scarcity, which in turn impacts both fire outcomes and expenditures. In order “to improve the wildland fire system to one that more reliably protects responders and the public, sustains communities and conserves the land” [7], USFS managers must frequently reassess the pool of national resources to determine if they are adequately able to respond to suppression needs. Efficiently designing this set of wildland suppression resources requires a wealth of information. Among other products, The Predictive Services Program issues seasonal outlooks that provide some insight into potential seasonal fire occurrence and severity related to global and regional weather patterns and signals [8]. Additionally, managers may draw upon their recent experiences from prior fire years and factor in knowledge about anticipated Agency budgets and funding limitations in the coming year. It is infeasible to reliably predict the timing and severity of fire activity in a future year far enough in advance to hire, train, and certify resources to exactly match demand. Compounding these challenges, future fire seasons may not align with previous experiences as fire activity may be changing over time [9,10,11,12]. Fire suppression resources in the US have historically been seasonal resources, becoming available in the spring and leaving the workforce in the fall [13]. This seasonal availability matched historical patterns of fire occurrence. However, while fire seasons may have once been well defined segments of a year, large, destructive fires may now occur any month of the year (Table 1). It is expensive to retain resources that are readily available to respond to potential year-long fire seasons demands, but it is also expensive to miss opportunities to quickly suppress unwanted fires when they are small through aggressive initial attack. In addition to these temporal components of fire activity that affect resource supply decisions, there is also an important spatial component. Resources can be moved to respond to new or anticipated fire demand, but this takes time and money, and may result in missed suppression opportunities elsewhere as these resources become committed to a single incident. Additional human factors affect the mobility of specific resources, particularly when resource availability becomes scarce, as managers’ preferences for sharing resources may wane. Further complicating the problem of designing an efficient set of suppression resources is the potential for additional resources that may be available through military agreements, partner agencies, private vendors, or foreign governments; availability of these resources is not guaranteed and use of these resources typically comes at a higher financial cost.
Drivers of resource scarcity are complex, and similar resource scarcity outcomes may be driven by differing fire scenarios. For example, a lack of resources might be driven by a few very large concurrent fires each using many resources or by several regions with high synchronous initial response needs but few large fires. In a system where federal, experienced career firefighters tend to be seasonal employees, fires occurring outside of the historical core fire season may strain the fire response system as fewer, and potentially less experienced, firefighters and associated resources may be available to fill the unanticipated demand. Scarcity can vary significantly within seasons and days as fire activity and suppression demand are both difficult to predict and highly variable in time and space. Previous research has addressed some of these aspects of wildland firefighting resource scarcity. For example, several studies have looked to identify optimal dispatching practices for local initial response including dynamic response, e.g., [14,15] and standard response [16]. Such research does take into account initial response needs even in times of high fire activity, though typically in such modeling the initial response resources and large fire resources are assumed to be different sets of resources. These methods have been used to design optimal annual engine and crew acquisition and annual and daily stationing for these resources [14,15,16]. However, these have all been studies that examine an area no larger than a USFS Region rather than examining the national set of suppression resources (the USFS splits the US into nine broad geographic areas that may individually differ substantially from the US as a whole). Other local and regional level studies include a characterization of wildland engine scarcity [17] and contracted engine capacity [18], both limited in scale to the USFS Pacific Northwest Region. Since the release of a 2009 Office of the Inspector General (OIG) report [19] recommending that the USFS provide additional analyses regarding airtanker usage, benefits, and fleet configuration, studies have examined the USFS fleet and addressed fleet configuration [20,21] and usage [22,23,24]. Crew corps configuration has been studied for the Pacific Northwest Region [25,26]. However, the previous work that has been done either explicitly addresses only local initial response dispatching, regional needs, or is out of date given the increasing fire activity, changing airtanker fleet, data used, or associated suppression resource demand.
Given the many factors influencing resource use, historical data describing timing, location, severity, and related resource use from previous fire years can help inform what may be needed for future fire occurrence. The key challenge with this approach is that there is no clear system of record to track suppression resource supply and demand, and there are potential pitfalls within existing systems that may provide misleading information regarding the true levels of resource scarcity. In this paper we explore metrics that are currently available to the USFS to describe resource use and scarcity, focusing on those with potential utility for managers responsible for annual national-level decisions regarding crew and airtanker acquisition; some of these metrics are already used to inform such decisions. We examine the limitations of each metric and suggest new metrics that could more accurately reflect true resource use and scarcity. To achieve this, we describe the state of the data from a relevant data collection system that may be used to report on national scale suppression resource scarcity. We focus specifically on two high-value suppression resources: type 1 firefighting crews and large airtankers. These resources were selected because these national assets are highly sought, and managers have identified them as valuable and scarce in a national survey [27]. In addition, because they are intended to be highly mobile and able to respond to national-scale suppression demand, there is some national control in the resource assignment decisions for these resources. These resources also provide an interesting contrast with each other as large airtankers are highly mobile and may be assigned to multiple fires daily while type 1 crews typically travel by car and often are committed to fires for multiple days. To support the Agency’s efforts to increase accountability to meet Omnibus Bill reporting requirements, we introduce suggestions for improved performance measurement capabilities within existing systems or in future data collection efforts. While the analyses and discussion presented here are specific to the US national fire management system, the knowledge gleaned from these efforts could inform resource acquisition decisions at either state or federal levels for other countries.
2. Materials and Methods
The main database used to track supply and demand for wildland fire suppression resources in the US is the Resource Ordering and Status System (ROSS; [28]). ROSS is used by dispatchers to manage requests from incidents for resources and is used extensively in managing resources on large fires and intraregional resource requests (i.e., requests for resources where the resource must come from outside the home unit or a neighboring unit to respond to the incident). If a resource is requested but no resource is available to fill the request, the request is returned to the incident as “Cancelled, Unable to Fill” (UTF). The number of requests returned UTF has become the de facto standard for annual reporting of unmet resource demand (NICC Wildland Fire Annual Reports; e.g., [2]). By 2012, ROSS had been nearly universally adopted for tracking large fire or interregional resource movements in the US. However, because ROSS was designed as a real-time dispatching support tool, not a data repository, there are challenges with accessing and querying data. Additionally, initial response fire suppression use is not well tracked in the system.
Due to changes over time in how large and very large airtankers have been contracted, ordered, and assigned, we do not distinguish large airtankers (LATs) from very large airtankers (VLATs) in our analyses. Herein, the term “large airtankers” (and the acronym LAT) encompasses all fixed-wing suppressant or retardant delivery aircraft meeting the official definition for large airtanker during the year of the analysis (historically, >1800 gallon capacity under “Legacy” contracts, which expired in 2017; currently, >3000 gallon capacity under “Next Generation” contracts [29]). In ROSS this corresponds to all resources classified as “VLAT”, “Type 1 Airtanker”, and “Type 2 Airtanker.” The USFS is the major supplier (largely through contracts) of LATs to the wildland fire system, although some states have contracted independently, or own, a small number of LATs over this period for within-state fire response. Additionally, California provides a large fleet of state-owned airtankers for within-state fire suppression, but these smaller aircraft do not meet the definition for LAT.
There are two types of Type 1 crews in the US: Interagency Hotshot Crews (IHCs) and Type 1 California crews (T1 California). T1 California crews are funded and governed by CalFire, California’s state firefighting agency, and their assignments are limited within the state. Outside of California, “Type 1 Crew” is synonymous with IHC which are specifically designated as national resources, governed by interagency standards [30,31,32]. Our analysis is focused on IHCs as a national, high-value resource, but both IHCs and T1 California crews are ordered the same way in ROSS. Due to this, we are limited in our ability to discern whether unmet demand (UTF) for Type 1 crews in California was due to a scarcity of IHCs or a scarcity of T1 California crews. Measuring met and unmet demand for LATs in states with state-contract aircraft faces similar challenges. Due to this, and additionally because CalFire has a substantial number of resources, we examine ROSS data using two base data sets: (1) all US requests, and (2) all US requests except for California and, additionally, Alaska incident requests. To clearly focus our analyses on national resources that are theoretically subject to a consistent assignment and allocation decision space, we subset data for these two regions. California requests were subset because California brings a plethora of state owned and contracted suppression resources to the table to respond to in-state incidents. The scale of resource availability and demand is so great for this state that these data skew results for any national scale analysis. Due to the remoteness of Alaska relative to the contiguous lower US states, any asset responding to requests there would require a flight and a prepositioning resource allocation decision. While Alaska data likely do not greatly skew the national data, this area was subset to refine our analysis.
We examined five recent fire years, 2014–2018. Our analysis was focused on these five years due to consistent availability of reliable data for multiple data systems of interest, including those tested for potential utility that are not included in our final analysis framework and summary presented in this manuscript (data from calendar year 2019 were not yet available at the time of this analysis). Five years of data will not capture the range of variability in US national fire occurrence, nor do we suggest that this is our intention. Instead, we hope to demonstrate whether or not variability in resource requests appears related to variability in fire demand, and we hope to investigate recent history to see how demand (both met and unmet) may be changing over time. To contextualize the analyses of resource demand and scarcity we first examined the LAT fleet size and the number of IHCs. From 2014 to 2018 the USFS LAT fleet changed substantially while the IHC corps remained relatively unchanged. We note the implications of the changing LAT fleet as we examine metrics of scarcity, since we would expect changing supply to affect unmet demand. We also analyzed LAT flight time by year to see how use aligns with aircraft numbers.
We obtained ROSS requests for all LATs and T1 crews in the US. Data are summarized to provide daily and yearly total filled requests, resources assigned, and UTF requests. We associated each UTF with the incident management team in charge of the fire when the order was placed and grouped the UTF requests into three categories: (1) requests from “large fires” with Type 1, 2, or 3 incident management teams managing the fire at the time of the request (“LF”); (2) requests from initial response or extended response fires that never escalated to Type 1, 2, or 3 team complexity—i.e., no team ever assigned (“IA”); and (3) requests from initial response or extended response fires that turned into a large fire—i.e., the fire did not have a Type 1, 2, or 3 incident management team on the fire at the time of the request, but later required such management (“IA to LF”). We also computed both the ratio of UTFs to filled requests and the ratio of UTFs to resource-use days. This latter metric better reflects total crew resource use given the predominance of multi-day assignments for T1 crews. We looked at daily and aggregate counts of UTF and filled requests across the season in time and space to assess temporal and spatial distribution of annual requests, specifically, we examined the daily number of T1 crews and LATs assigned to a unique fire, requests returned UTF, and the daily ratio of these counts. We further investigated 2018 data in-depth, specifically to explore the regional drivers of resource scarcity.
Finally, we obtained historical daily National Preparedness Level (PL) data for the analysis period. PL is an interagency metric describing fire suppression readiness and resource control. It is a categorical value between 1 and 5, which represents a synthesis of current and future fuel and weather conditions, fire activity, and resource availability [33]. This value provides a broad national overview of concurrent resource demand and capacity of the suppression response system. It also indicates the level of control of national and regional resource assignment decisions. When the national PL is 1, little to no national support is required to meet incident management objectives, and at national PL 5, national resources are heavily committed with significant resource scarcity (e.g., the height of the fire season during a severe year). The PL is set once daily during the core fire season by national level fire managers. While the PL accounts for general resource scarcity, it does not provide any granularity regarding which resources are particularly limited on any given day. To overcome this limitation, we coupled ROSS data with national PLs to characterize the broader suppression picture affecting potential resource competition and scarcity. Given the reliance upon acronyms in this manuscript, we provide a reference table for the reader in Appendix A.
3. Results
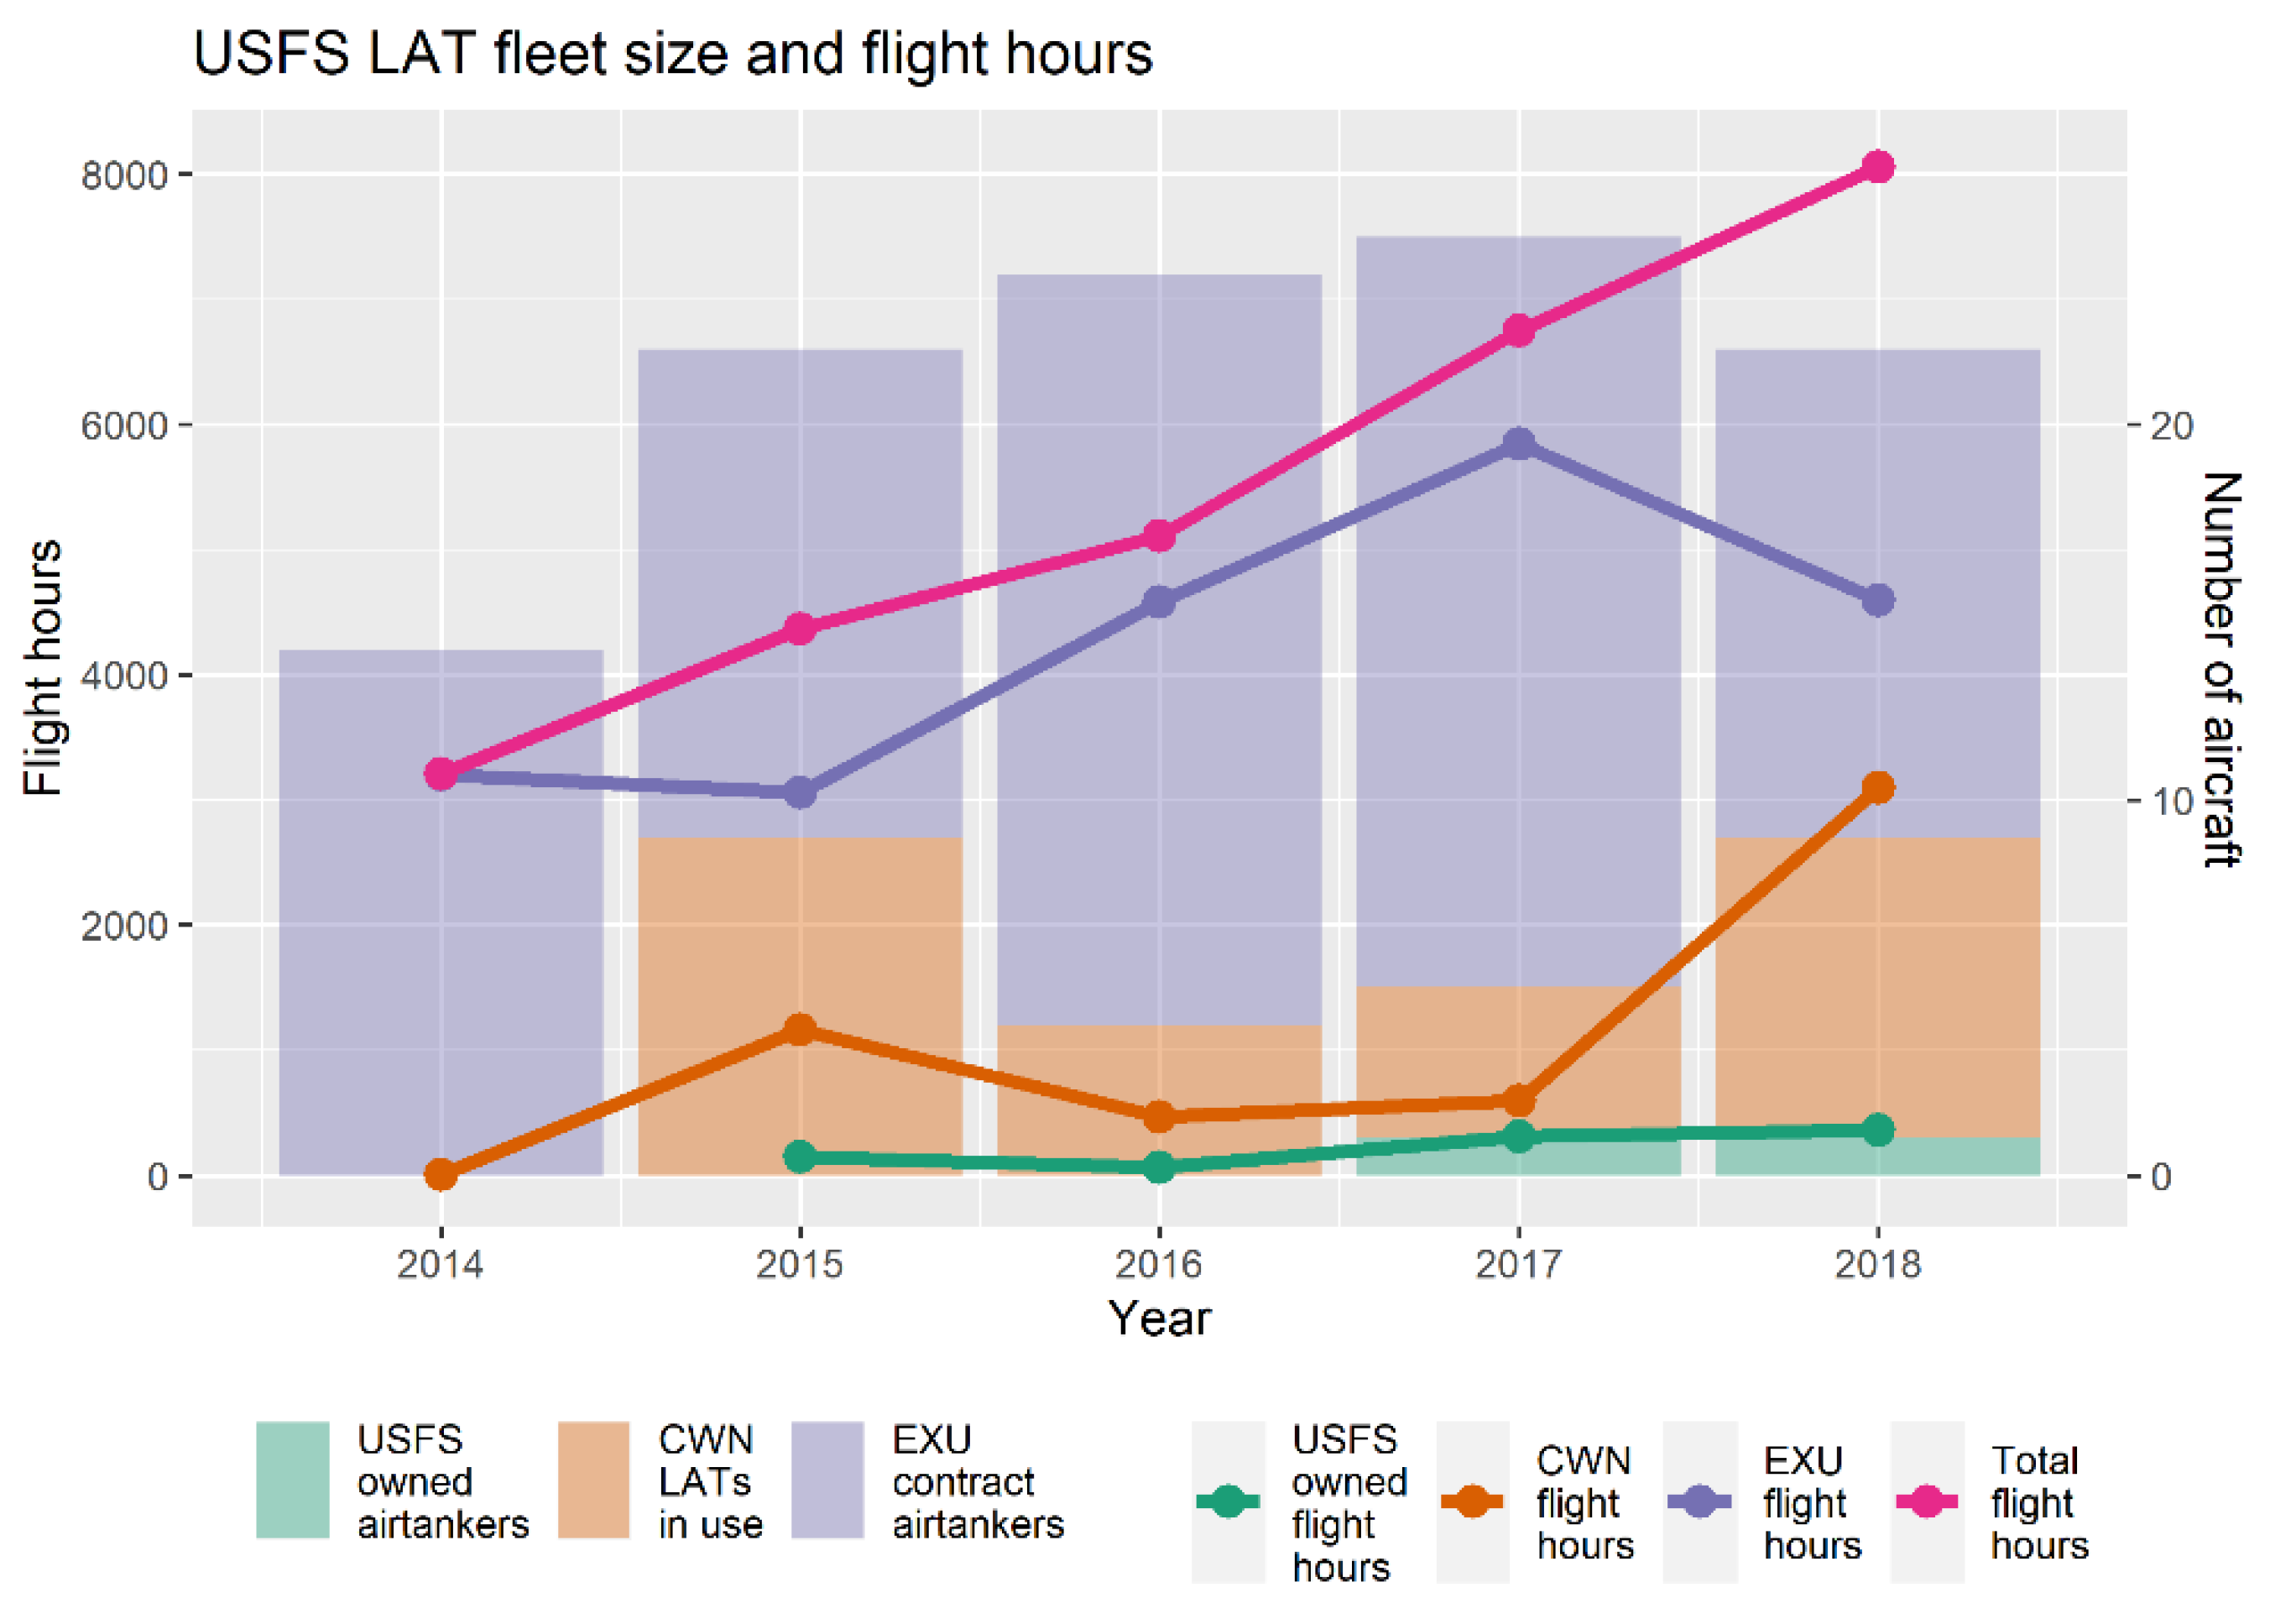
A characterization of the size and configuration of the resource pool is an important first step in an analysis of supply and demand. For the analysis period from 2014 to 2018, the LAT fleet has seen the effects of fleet modernization efforts [34]. In Figure 1, we depict fleet size and use from 2014 to 2018 for the core Agency aircraft and surge capacity aircraft. Core aircraft include the Exclusive Use (EXU) contract LATs and also Agency-owned LATs, which first flew fire missions in 2017 [35]. Surge capacity refers to the capability to expand the size of the resource pool during heightened periods of demand. For aircraft, this includes those airtankers awarded Call When Needed (CWN) contracts, which are not guaranteed use unless the contracts are “activated.” Many LATs with existing CWN contracts may not be utilized during mild fire years; therefore, raw fleet numbers can prove misleading. Instead, Figure 1 depicts the CWN LAT fleet size by plotting the number of aircraft utilized per year, based on flight hours billed in Aviation Business Systems (ABS). Given that some aircraft may report a small number of annual flight hours for training or certification purposes, we included just those aircraft reporting annual flight hours in excess of 26 h (corresponding to the 10th percentile value for annual CWN totals). Military or Canadian surge capacity aircraft are not shown here because their use is not summarized in ABS, and related use data are not readily available. Finally, in addition to fleet size numbers, total annual flight hours billed in ABS by aircraft contract/ownership category are shown. From Figure 1, we see that over this five-year period total LAT flight time has increased every year. In some higher severity fire years (2015 and 2018; [36]), we see increased CWN aircraft activations and use. Notably, the EXU fleet was significantly larger in 2016 and 2017, mainly because the “Next Generation” modern LATs were brought on line while older “Legacy” LATs still retained contracts. These “Legacy” aircraft all retired at the end of 2017, explaining the reduction in EXU numbers and associated EXU flight time in 2018, despite higher overall use by total flight time and a sharp increase in CWN flight hours.
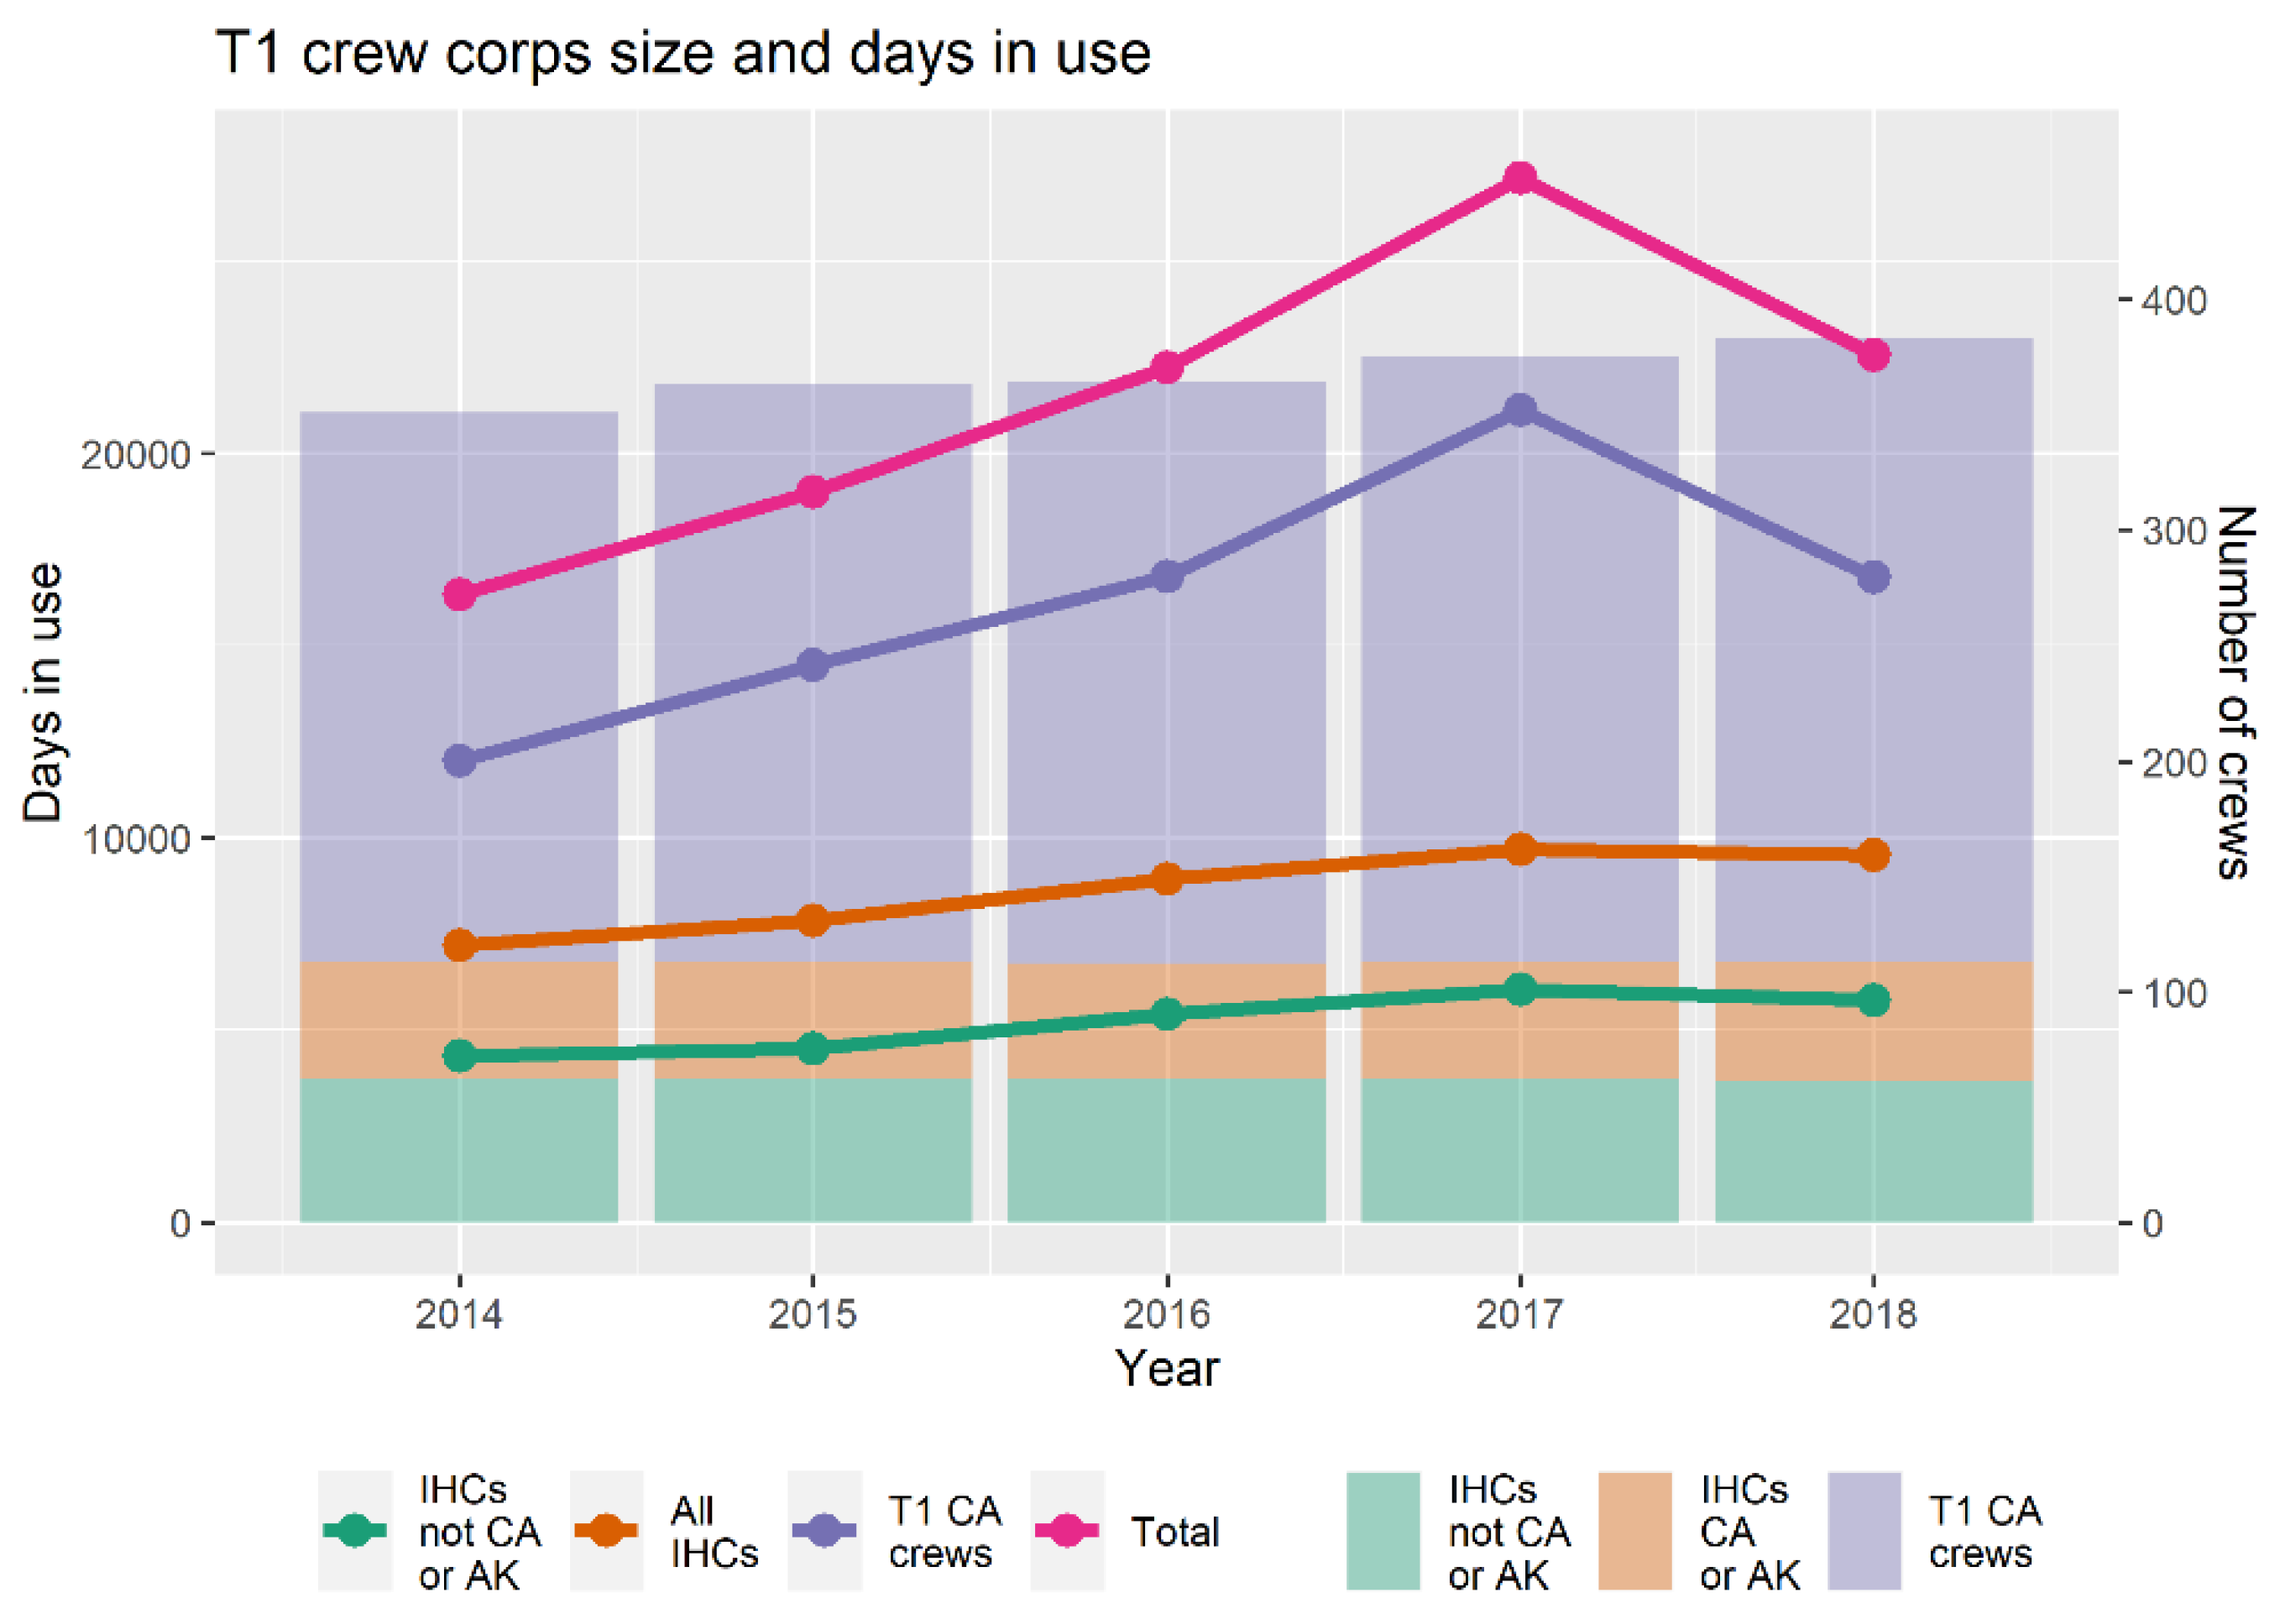
To obtain the number of crews available each year we counted the number of unique crews that were recorded on at least one assignment in ROSS for that year, taking care to avoid double counting single crews with multiple ROSS resource IDs. We categorized the crews as IHCs from California and Alaska, IHCs from other states, and T1 California crews. In addition, we counted the number of days that each crew was assigned to a fire in ROSS and summed these “resource-use days” to get a total number of crew-use days each year. These data are shown in Figure 2. In contrast to LATs, the corps of IHCs remained relatively unchanged from 2014 to 2018; the total number of IHCs varied by only one crew over that time period. The corps of T1 crews from California has grown over time, rising from 238 in 2014 to 270 in 2018. Despite the stability in the number of IHCs, use of the IHCs has risen from 7206 crew-use days in 2014 to 9541 crew-use days in 2018, even with no change in crew corps size. Use of the T1 crews from California has varied more substantially, ranging from 12,001 days in 2014 to a maximum of 21,120 days in 2017. The peak in T1 crew usage in 2017 was driven primarily by the use of T1 California crews.
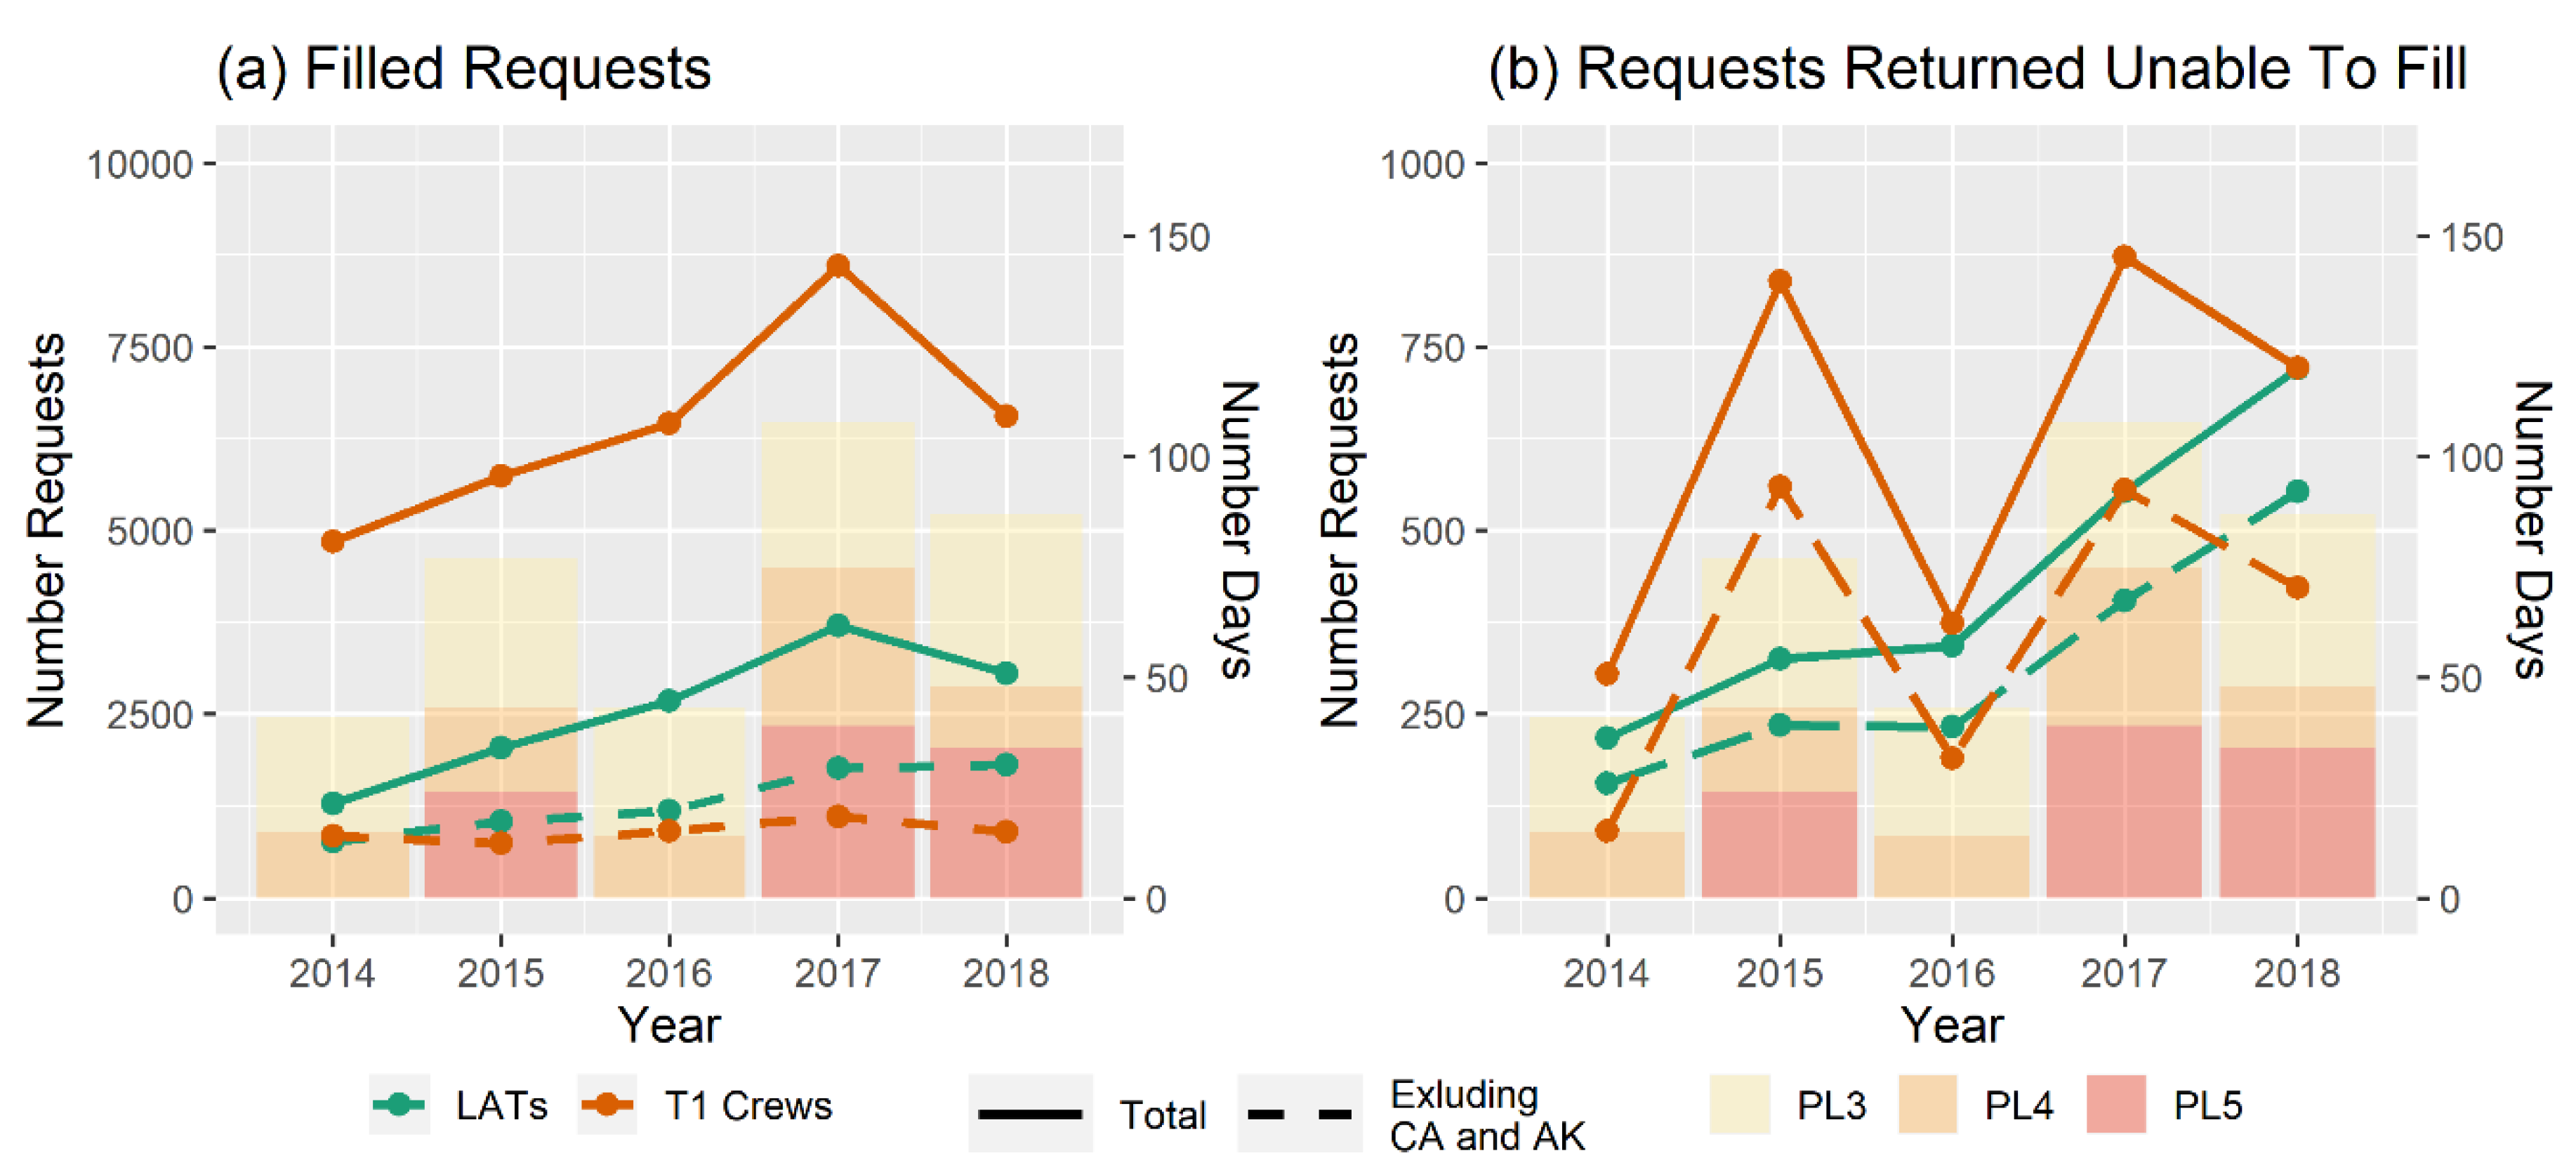
Figure 3 summarizes national Preparedness Level and requests for fire years 2014–2018, plotting both the total days each year that the country was at PL 3, 4, and 5 and the number of filled requests and UTF requests each year for LATs and T1 crews from ROSS. Assuming that resource supply remains constant over time and that the number of days at PL 3, 4, or 5 is a good representative of national resource scarcity, then we would expect to see both the number of filled and UTF requests follow the same pattern as PL. In Figure 3, we instead observe that nationally, filled requests for both T1 crews and LATs increase between 2014 and 2017, dipping slightly in 2018 for T1 crews. Much of this increase is due to demand from California incidents; the increase in filled requests for both T1 crews and LATs is substantially less when the data exclude California and Alaska. Like filled requests, the UTFs do not follow the same pattern as days at PL 3, 4, and 5; however, they nearly follow the same trend as days at PL 4 and 5, with the exception of LAT requests returned UTF in 2018. This increased UTF rate may be explained by the 35% reduction in the size of the EXU LAT fleet, corresponding with a 20% increase in total fleet flight hours.
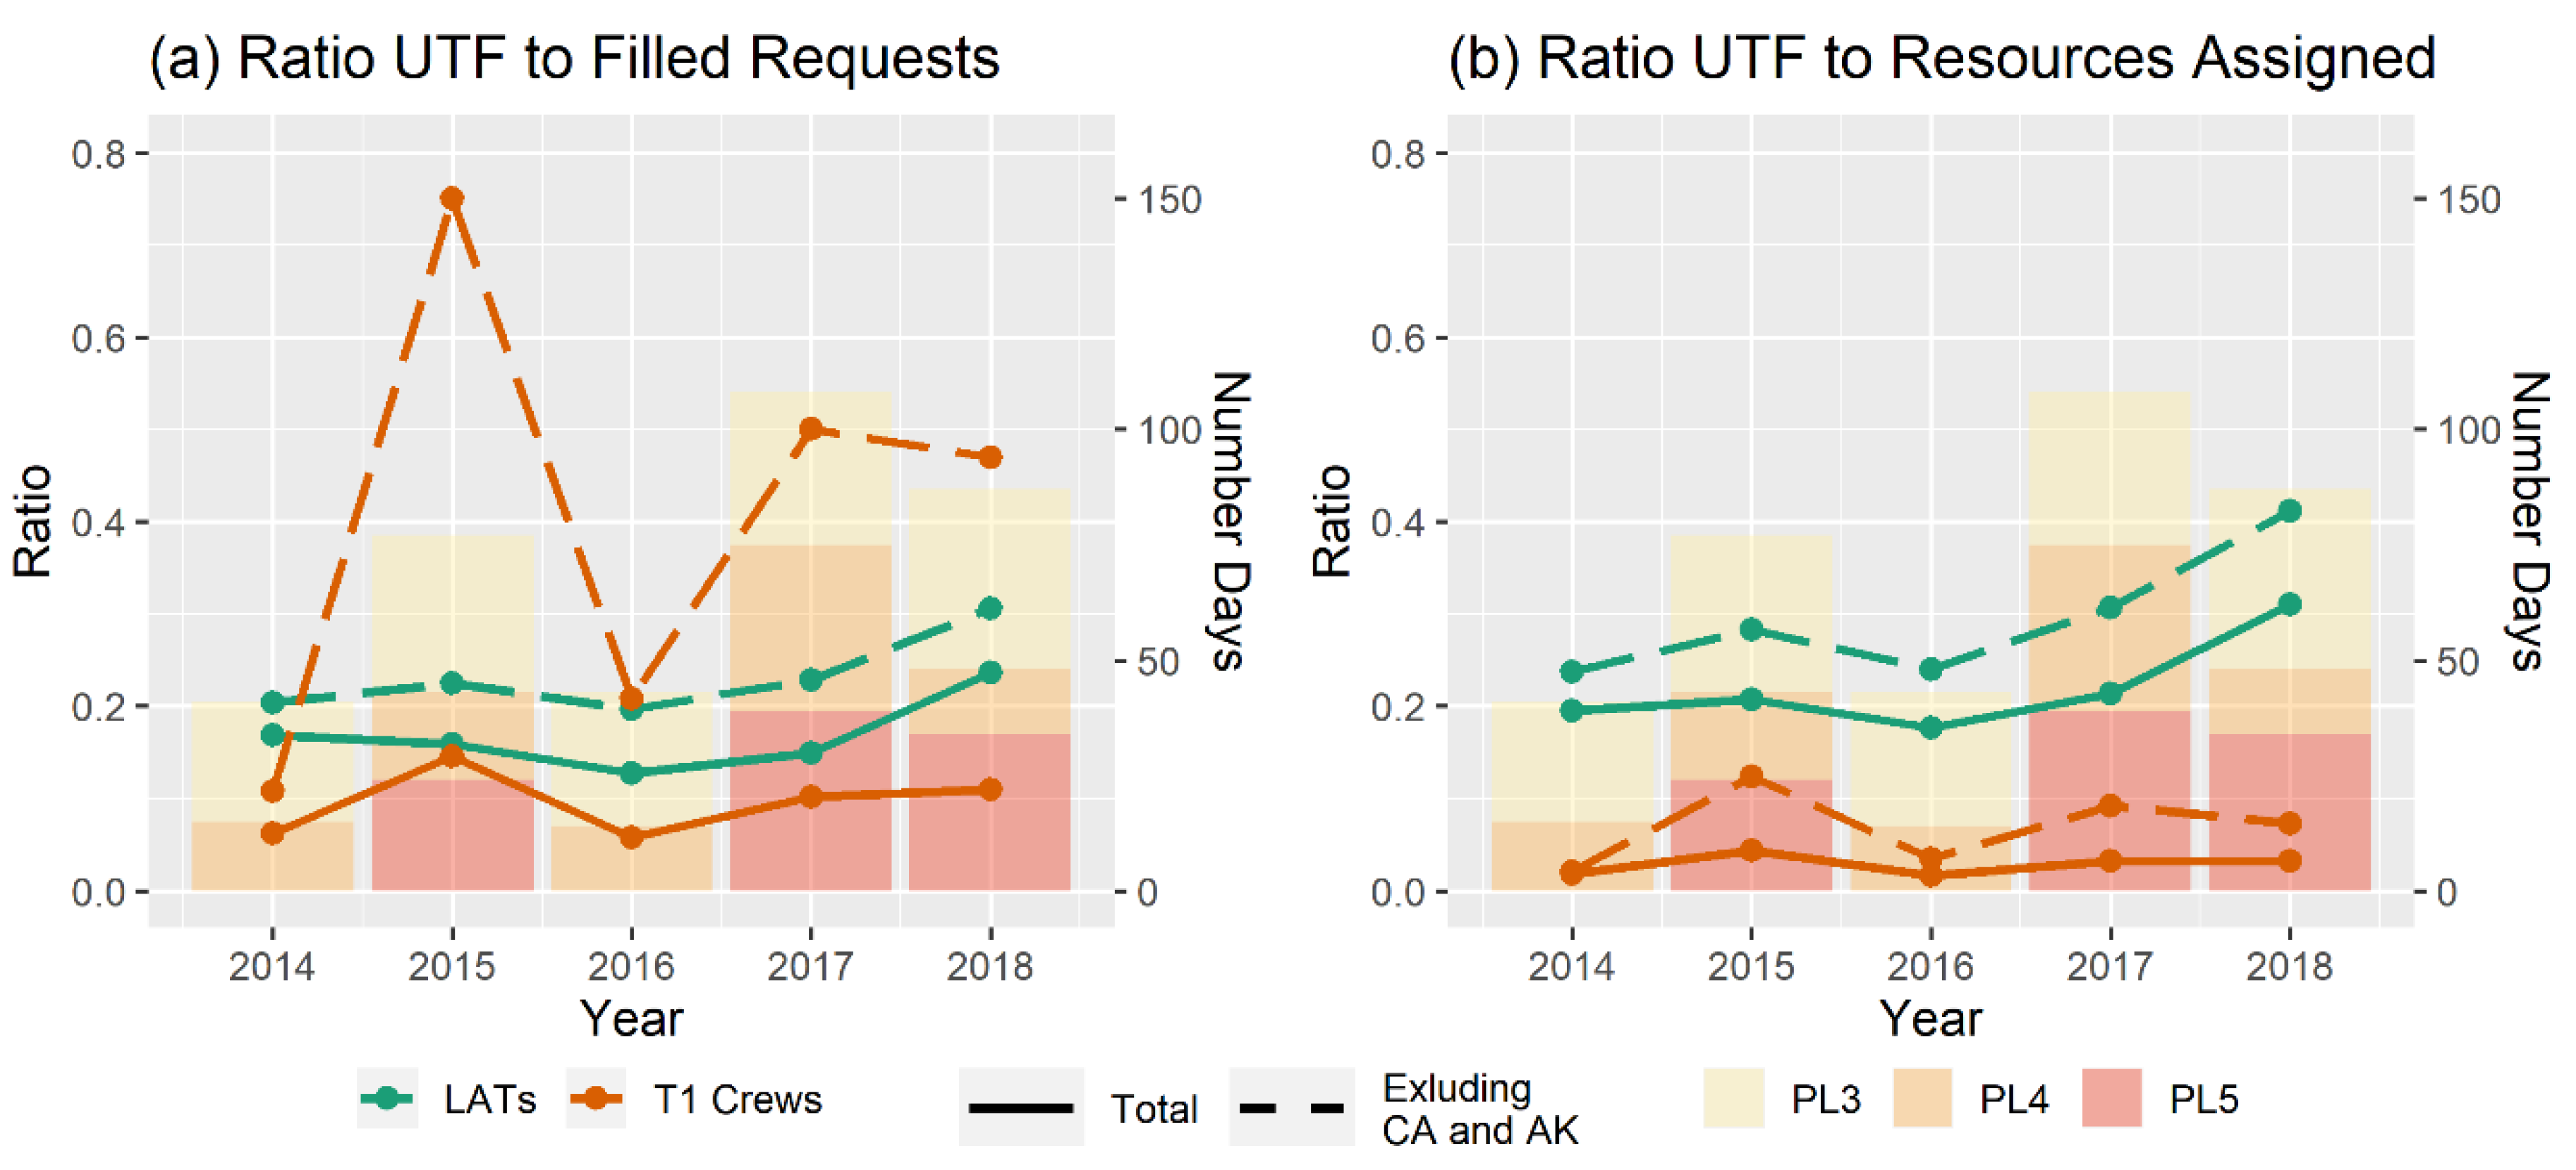
To more closely assess the relative scale of unmet demand, we examined the annual ratios of UTF requests to filled requests (UTF-to-Filled) and UTF requests to resources on assignment (i.e., resource-use days; UTF-to-Assigned); these data are shown in Figure 4. We observe that UTF-to-Filled and UTF-to-Assigned were smallest for both LATs and T1 crews during comparatively low severity fire years (2014 and 2016). Both UTF-to-Filled and UTF-to-Assigned increase between 2017 and 2018 for LATs and decrease for T1 crews, even though 2018 has just a few more days at a high PL than 2017. When we remove California and Alaska from the data we see that UTF-to-Filled and UTF-to-Assigned increase for both LATs and T1 crews, indicating a higher proportion of unmet demand compared to the rest of the country; however, while the scale of the ratios changes, the interannual trends remain the same. Despite the substantially different fire seasons, UTF-to-Filled for LATs is nearly constant from 2014 to 2016, with a slight increase from 2016 to 2018. Although 2018 has substantially fewer days at PL 4 and 5 than 2017, this may be explained by the increase in total use by flight hours, with a heavier reliance on CWN LATs in 2018 (Figure 1). In contrast, UTF-to-Filled and UTF-to-Assigned for T1 crews varies substantially from year to year, peaking during severe fire seasons. Exclusion of California and Alaska data results in a more amplified time series, indicating that during times of heightened national scarcity, the effects are felt more substantially outside of California and Alaska.
Resource assignment length is evident in Figure 4. For LATs, we see similarity in annual plots for UTF-to-Filled and UTF-to-Assigned. LATs are typically released from assignments at the end of each day, so we would expect results for both ratios to be similar, given these typically single-day assignments. In contrast, results are quite different for UTF-to-Filled and UTF-to-Assigned for T1 crews, highlighting the multi-day (or multi-week) assignments that T1 crews may engage in [30]. This illustrates the critical need to examine days of use rather than just filled assignments when assessing resource scarcity for resources where multi-day assignments are typical.
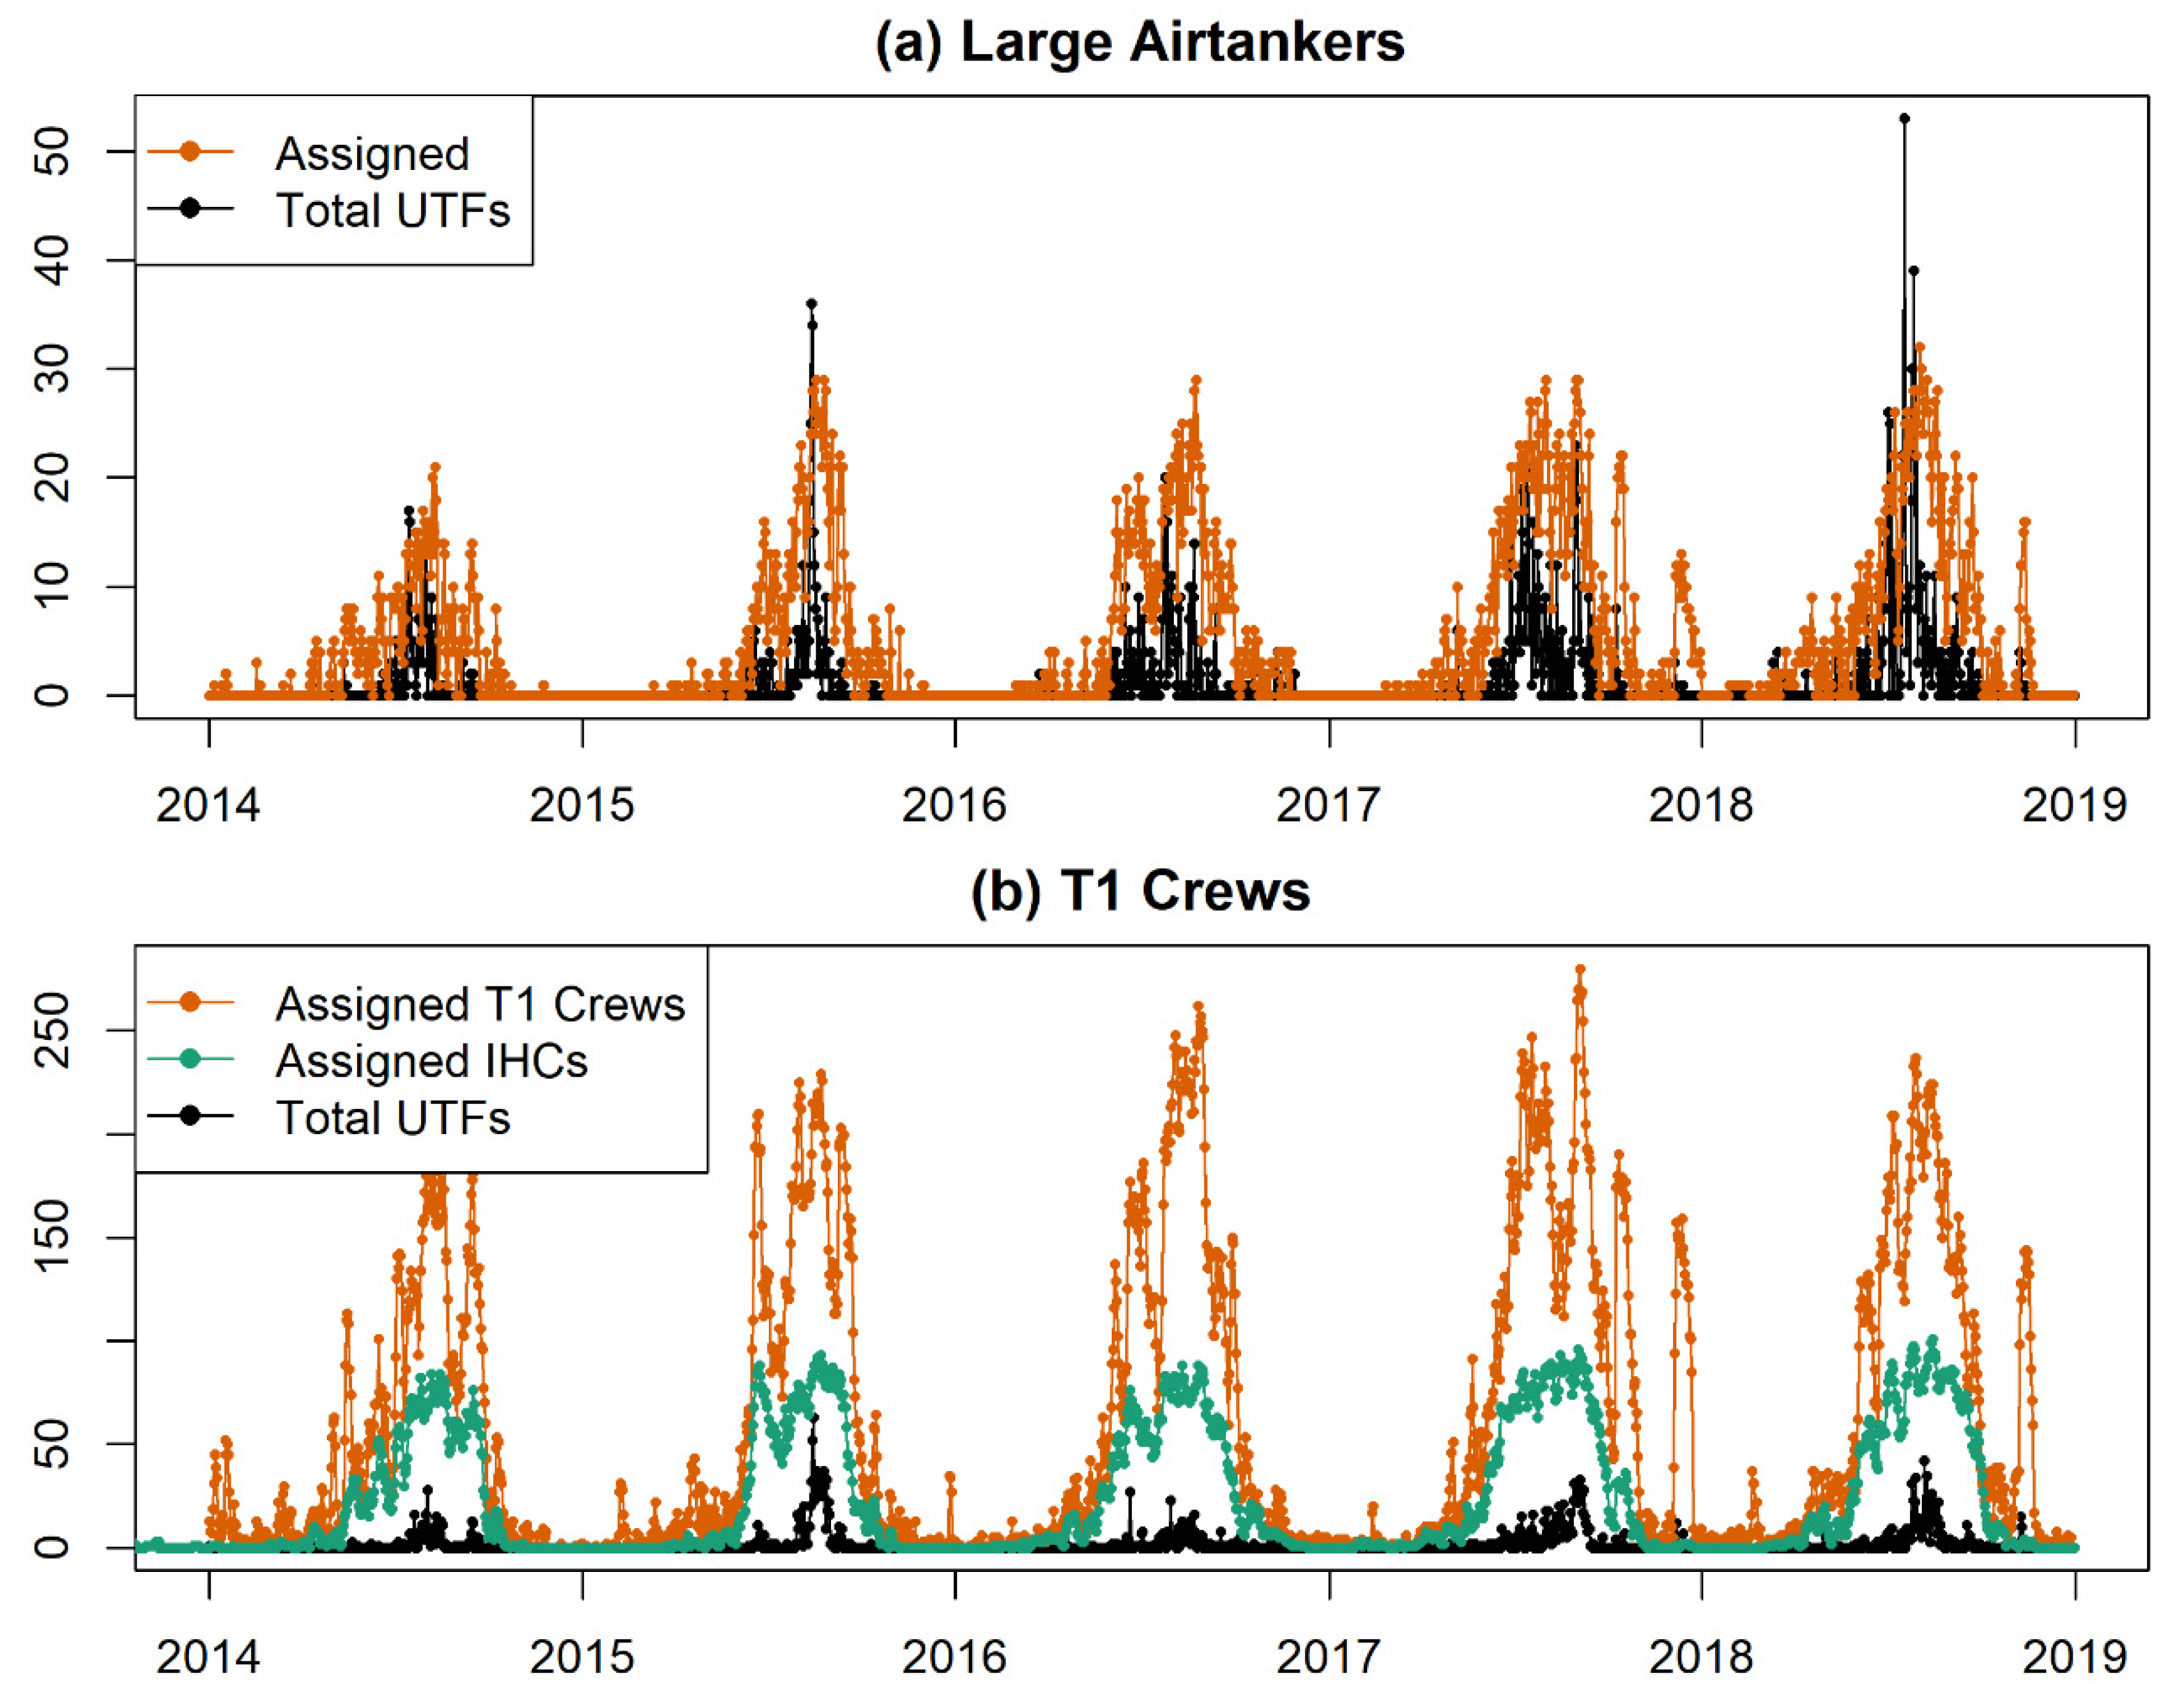
Annual summaries of aggregated daily data provide little insight into the patterns of variability in daily resource needs. Figure 5 shows the daily number of LATs and T1 crews on assignment and requests returned UTF. We see similarity in resource assignments for LATs and T1 crews among different years, regardless of fire year severity. In contrast, UTF values appear to reflect fire year severity, with these values increasing in severe fire years, despite use remaining about the same. There are a few very large spikes in large airtanker requests returned UTF in 2016 and 2018, which are attributed to a few large fires placing many requests for LATs. For example, on July 18, 2018 there were 53 requests for LATs returned UTF, and these requests came from just nine fires. Figure 5 demonstrates that many UTFs originate from short duration (single day) pulses of high demand during the peak of the “typical” fire season. For example, in 2018, just three days (July 18, 25, and 27) comprised 16.7% of all calendar year UTF requests for LATs.
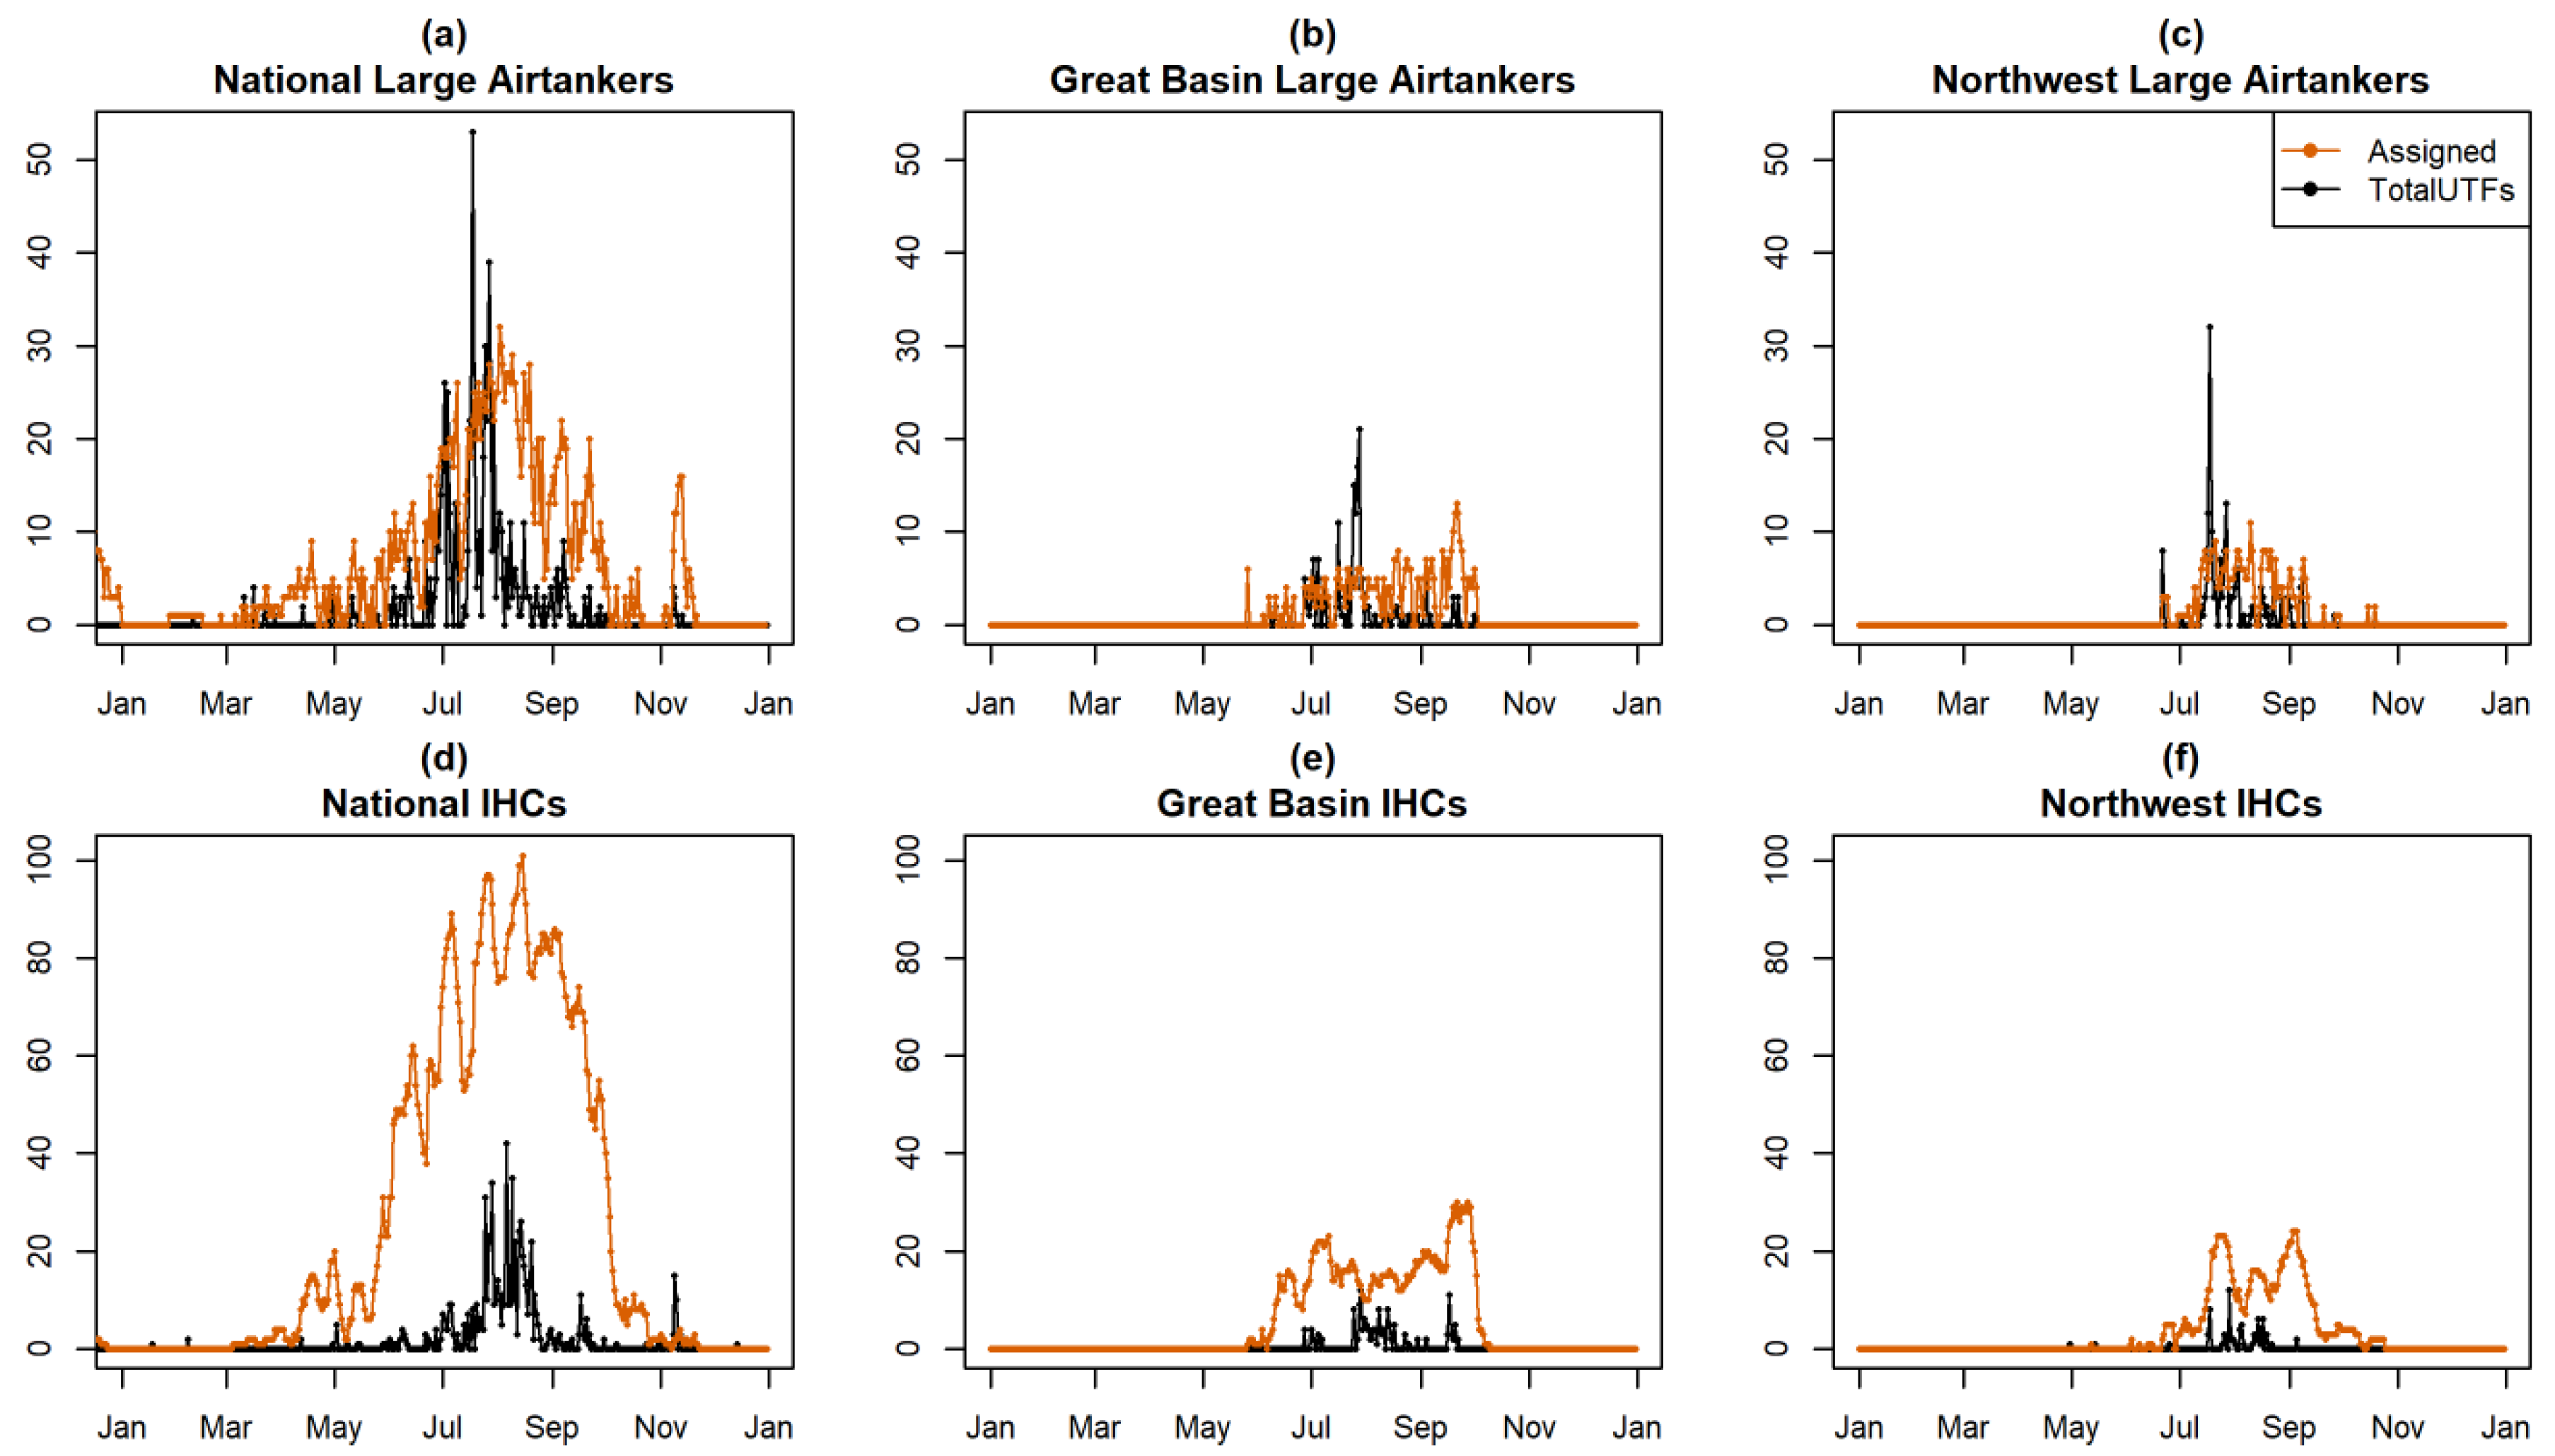
In Figure 6, we further dissect results to describe the spatial extent and distribution of the resource demand. We show the daily number of LATs and T1 crews on assignment and requests returned UTF with the results filtered to highlight the Great Basin and Northwest Geographic Areas for the 2018 fire season; we focus on these two geographic areas as they saw high resource use in 2018. We see a periodicity to the number of T1 crews on assignment nationally (Figure 6d); this may correspond to the 14-day standard assignment length [37]. We can also observe that on the day that UTFs for LATs peaked nationally (Figure 6a; at 53 requests returned UTF on July 18), those UTFs were driven by requests from two regions, the Northwest and the Great Basin, due to synchronous high fire activity (Figure 6b,c). Despite this regional demand, assignments of T1 crews to the Northwest and Great Basin never exceeded half of the total crew assignments (Figure 6e,f), indicating that crews were heavily engaged in other regions at the same time. However, during this period the LAT assignments in the Great Basin and Northwest comprised the majority of the LATs assigned and requests returned UTF in ROSS (Figure 6b,c).
None of the data we have examined thus far allows any insight into characteristics of the fires with UTF requests. Ultimately, managers’ ability to obtain resources may affect the outcome of a fire, and management of fires differs for many reasons, including such things as policy of the responsible agency, relative values at risk, and growth potential. In addition, resource dispatching policies may differ depending on whether requests are prioritized for initial response or assigned to large high risk events. In Figure 7 we examine the number of UTF and filled requests by year, fire type (previously defined: IA, LF, IA to LF), and agency. The agency category includes the Department of Interior (DOI), which represents the other major federal landholder in the US, the Forest Service (USFS), and “Other,” which can include private land and municipalities, but mostly encompasses non-federal fires with state jurisdiction. Note that the set of filled requests in ROSS does not include a substantial proportion of initial response assignments, though it should include most IA requests returned UTF. For airtankers, we observe increasing requests returned UTF (Figure 7c) and filled requests (Figure 7a) for all agencies across the study time period, though the proportion of fire types does not show a pronounced changing trend. For all years, LF in California constitutes a substantial proportion of UTFs for LATs; on average 22.7% of annual requests for LATs returned UTF are from LF in California. Only a very small proportion of IA to LF fires received a UTF for a T1 crew (average of 11%; Figure 7d); however, a much higher proportion of UTFs for airtankers is for IA to LF fires (average of 21%; Figure 7c). As in Figure 3, we see significantly more requests for T1 crews returned UTF on severe fire years (2015, 2017, 2018; Figure 7d), but we also observe that USFS fires account for a substantial portion of these requests. We see increasing use of “Other” T1 crews in filled requests, though we do not see the same increase in use for USFS and DOI, specifically because a majority of these crews responding to the “Other” agency fires are the T1 California crews (Figure 7b). DOI has very few requests and requests returned UTF for T1 crews; “Other” has more UTFs than DOI, but fewer than USFS, in all years for T1 crews, even when fires in California are removed.
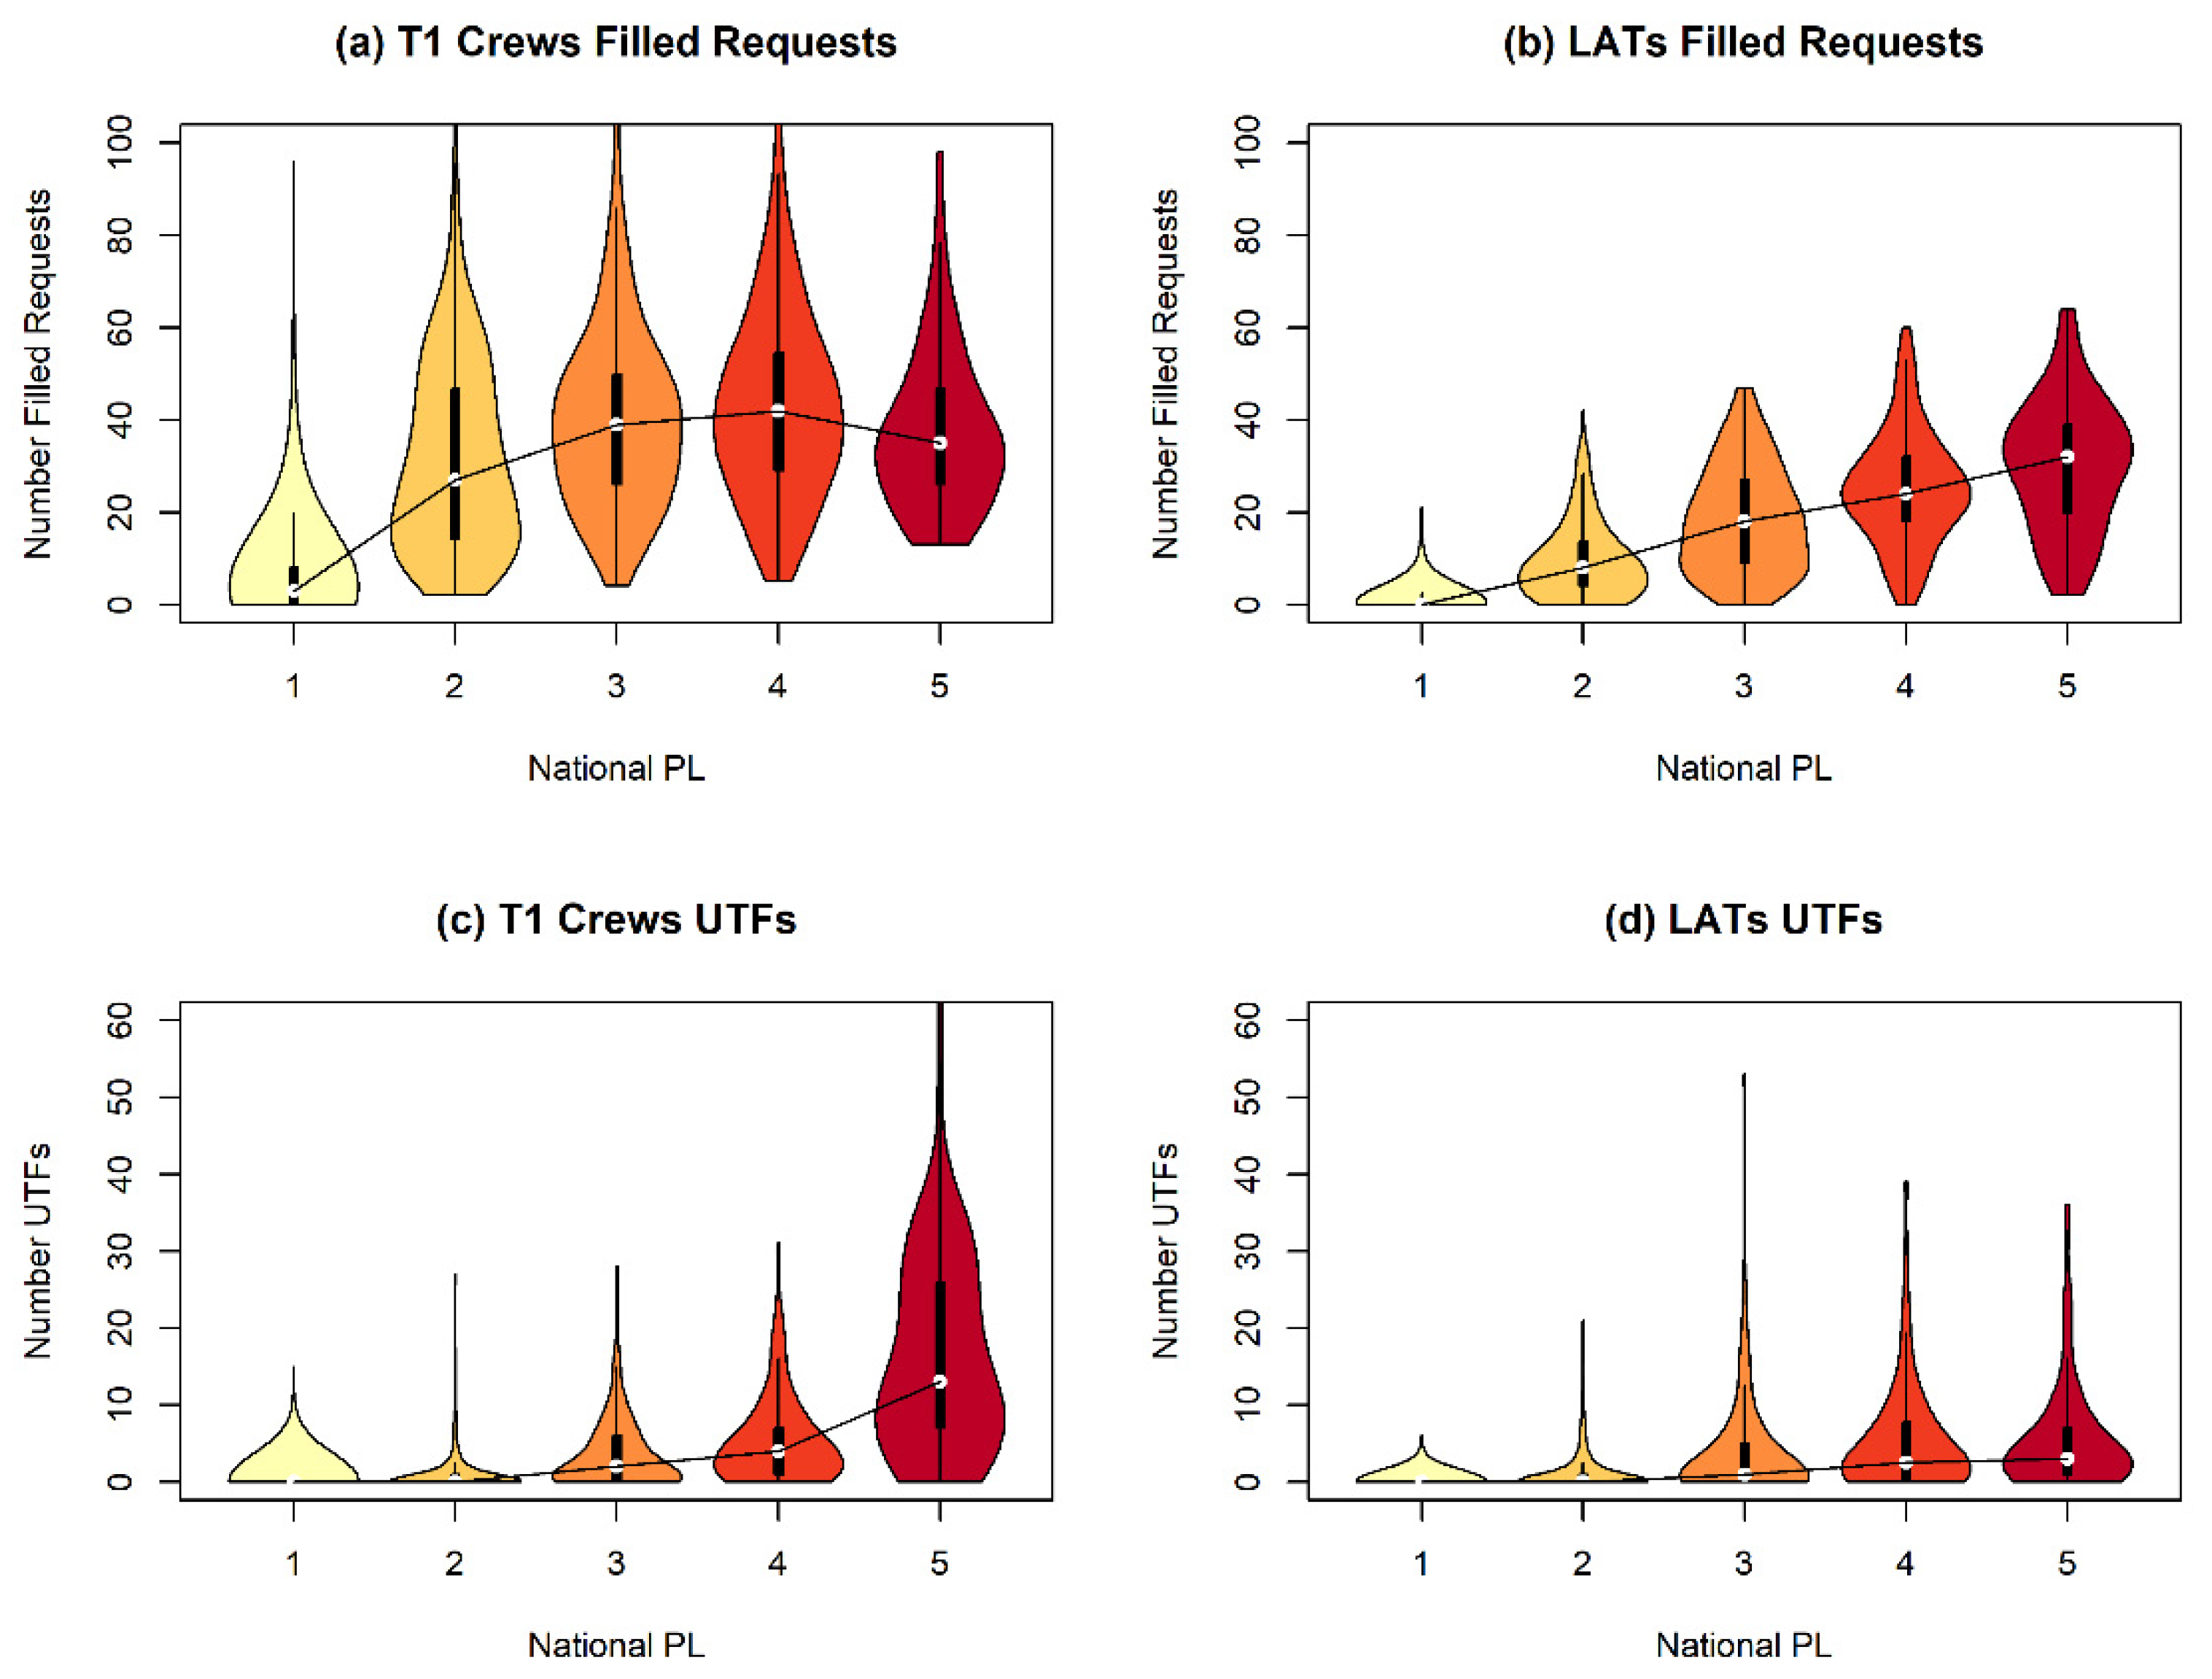
Another important characteristic of requests returned UTF is the national environment at the time the order is placed. Thus, we more carefully examined filled requests and requests returned UTF by the PL on the day of the request. We looked at the daily median and spread of these requests over the 2014–2018 fire seasons, using violin plots (Figure 8). The shape of each “violin” indicates the distribution of the data. Airtankers and T1 Crew filled requests and requests returned UTF follow substantially different patterns. The median number of filled requests for T1 crews peaks at PL4 (Figure 8a) while the number of filled requests for LATs peaks at PL5 (Figure 8b). Requests returned UTF for T1 crews (Figure 8c) increase substantially as PL increases. In contrast, requests returned UTF for LATs (Figure 8d) do not increase as substantially; in fact, the median number of annual requests returned UTF level off at PL 4 and 5. The leveling off of requests returned UTF for LATs may occur because more requests are being filled, while the number of requests returned UTF for T1 crews continues to climb as there are generally fewer requests for T1 crews being filled.
4. Discussion
4.1. Current Metrics: Capabilities and Limitations
ROSS data currently provide the best available interagency summary of national scale resource use. Despite limitations of the data source, it can provide some insight into the wildland fire response system. For example, we see different usage and related scarcity patterns for LATs and T1 crews. While UTF requests for T1 crews tend to reflect the severity of the fire season coincident with PL, UTF requests for LATs seem unaffected by PL, and have instead steadily increased in recent history, along with increased filled requests and increased use (flight time). This pattern may reflect a shift in dispatching practice away from one where initial attack is the priority use for LATs, toward an emphasis on large fire support. Previous analyses of LAT use demonstrated that approximately half of LAT use occurs on initial attack fires [22,23]. Since these analyses, the fleet has modernized; newer jets with higher cruise speeds can respond to more fires in less time. Additionally, large urban interface fires that are efficiently serviced by nearby airtanker bases can see extensive LAT use, which may be contributing to the overall increase in total annual flight time.
These results when evaluated relative to recent survey results published by the authors [27] suggest a significant disconnect between resource scarcity derived from ROSS and perceived resource scarcity from operations personnel. Given the relatively limited number of LATs in the fleet (between 14 and 25; Figure 1) and the total number of annual requests returned UTF (between 217 and 720; Figure 3), when compared to T1 crew data (112 to 113 IHCs, 238 to 270 T1 California crews available, and 304 to 827 annual UTF requests; Figure 2 and Figure 3), demand for LATs appears higher and LATs appear more scarce than T1 crews. In fact, federal fire managers widely ranked T1 crews in a 2017 survey as the single most important resource for direct and indirect attack objectives, with high related perceptions of scarcity. In contrast, few respondents ranked LATs as the single most important resource type, and measures of scarcity were generally lower when directly compared to T1 crew results [27]. The implication here is that raw UTF numbers alone do not adequately characterize resource scarcity, but that these data are informed by additional information on resource value for achieving key management objectives. For example, both LATs and T1 crews may perform actions that impact a fire’s growth; however, there may be additional functions provided by a resource that are critical to the potential success of a management action. The quick response capability of LATs or the versatility of skills and qualifications for T1 crews may each be reasons why a manager may order a specific resource over another, and the incident associated with each request may present widely different temporal and spatial risks to values. Resource order data, whether filled or not, do not reflect this level of detail describing why the resource was requested.
Parsing annual data into spatial and temporal categories can be more revealing than annual summaries. For example, the increase in UTF requests for LATs originates mainly from UTFs generated during the height of the core fire season, which tend to be driven by large fire demand. Previous work characterizing LAT use in US fire suppression demonstrated that approximately half of LAT use occurs during extended attack [22,23,24], predominantly on large fires, and that LAT drops generally occurred close to the wildland urban interface and major highways [23]. Although demand in some cases may be relatively concentrated and close to an airtanker base, a modest increase in the number of LATs available would not significantly address these large pulses of demand. Attempts to acquire a sufficient number of aircraft to fully meet demand (i.e., eliminate UTFs) would likely be quite expensive and could result in either underutilization during a majority of the season, or increased utilization under conditions where LATs are thought to be less effective, simply because they are available for ordering and use. Further, the ability to parse data by agency is important. In severe fire years, USFS requests for T1 crews increase substantially, but this does not hold true for other agencies. Finally, the spatial and temporal distribution of requests returned UTF across the season may help quantify demand for more locally based resources or more highly mobile national assets.
Notably, ROSS data have key limitations, which can lead to incorrect interpretations of data summaries if not fully understood. For example, ROSS data seem to accurately describe T1 crew assignments and movement, given the tendency of these resources to be committed to multi-day assignments and to travel by ground-based transportation between wildfires. While some initial response assignments for T1 crews may be missing from ROSS data, our spot checking has found ROSS to be a mostly complete data source for IHC assignment data after 2012. Conversely, due to regional differences in ordering and dispatching practices, particularly for highly mobile and limited aircraft like LATs, ROSS data often do not capture all assignments and use. To illustrate, we pulled data for a single national contract LAT flying in July of 2017 from several applicable datasets: ROSS assignment records, ABS financial records, and Additional Telemetry Unit (ATU) use records providing geospatial drop location data [38]. In ROSS, this aircraft was assigned to and released from a single wildfire on July 22, 2017, and the next ROSS assignment does not appear until seven days later on July 29, 2017; i.e., this LAT was assigned to no fires or regional preposition order during this time. However, ABS data show the aircraft flying 22.14 flight hours in support of several regional fires in the interim, and delivering 125,998 gallons of retardant. ATU data validate these ABS charges, with 39 drop events on regional fires. The reason there is no ROSS order for these flights is because the aircraft origin and destination airport were the same for all missions. As the aircraft was not repositioned to another airtanker base, no order was generated in ROSS. This is common practice for the Geographic Area in question, but this is not in alignment with national policy and practice for ordering national resources. Further, aviation assets are ordered and managed differently than other ground-based assets, so these analytical caveats are not the same across all resource types. Extensive knowledge of resource and regionally specific dispatch practices is required to avoid potential mischaracterization of historical ROSS data.
Another key limitation of ROSS data relates to human behaviors that may affect ROSS ordering practices. In ROSS, some managers may not ask for all the resources they need, particularly if it is unlikely those requests would get filled. For example, in Figure 8 we can observe that, on average, there are very similar numbers of requests returned UTF for airtankers on days when the nation is at PL 4 and at PL 5; we would expect to see higher numbers of UTFs on days with PL 5, such as we observe for T1 crews. Other managers may request resources anyway, then continue to request substitutions until they feel their needs are met. There is no clear analytical path to accurately capture this potential unlogged or over-represented demand in ROSS.
Further analytical challenges affect the utility of ROSS requests. In ROSS, we have no way to determine consistently from archived data whether limitations on related resources may be the actual cause of a primary UTF; for LATs, a key example would be an inability to simultaneously fill a leadplane order (some LATs may not be assigned without a coincident leadplane assigned). Once an order is returned UTF, we cannot determine whether ensuing resource orders were potential substitutions for unfilled primary orders, and ultimately the effect that these UTFs may have had on a manager’s ability to meet suppression objectives. In addition, ROSS data only go back to 2007, with the current archival process only dating back to 2012. Thus, our ability to compare current fire years with previous fire years and to examine long term trends is limited.
While our analyses focused on ROSS requests and PL data, there are multiple other data sources with information on resources that we ruled out for national scale assessment of resource demand and use, including local Computer Aided Dispatch (CAD) programs, agency-specific fire reports (e.g., FIRESTAT for the USFS; [39]), resource geospatial tracking systems, such as Automated Flight Following (AFF; [40]), and other financial record systems. These data systems were discarded for potential national-scale characterization of suppression resource demand because they tend to be agency-specific, and many have data that are difficult to access or synthesize at broad scales. We spent considerable time investigating the potential utility of the ICS-209 critical needs fields [41] as a novel source of resource demand data. We parsed the open text fields to obtain counts of large fires listing specific resources as critical needs for near-term management periods. Unfortunately, we found little value in the dataset for assessment of resource demand due to non-standardization of the data and redundancy of some information with ROSS UTF data.
Implications for decisions affecting resource availability are potentially significant, given related values at risk for some wildfires. Theoretically, each UTF request may force the requesting fire manager to shift strategies or tactics to work within the capabilities of the available resources. Resource unavailability can lead to missed opportunities for initial attack containment or effective large fire management during key weather windows. Still, unlimited resources do not guarantee successful management, and further, a system with an overabundance of resources can encourage overuse. It is well documented that fire managers have incentives to order resources beyond the level of marginal economic value in the current system [42,43,44]. Given these incentives, a system with a so-called overabundance of resources could lead managers to redefine their expectations of resource availability, adjusting those demands upwards. The system would end up using more resources and still having unmet “need”. Given the highly variable nature of fire seasons, a fire response system with no scarcity would be very expensive and likely quite inefficient.
4.2. Future Metrics: Improved Performance Measurement
Our work revealing the deficiencies with the current resource scarcity metrics raises two key questions: What does a functional resource scarcity performance indicator look like? What data do we need to calculate such a metric? We believe this metric is attainable through existing systems, with the prerequisite that first establishes consistent national policy and mandates compliance regarding the ordering of national resources through a single national system; specifically, policy requiring managers to order what they think they need through the national ordering channels. It should be clearly communicated to the broader fire community that ROSS request data (or data from a future national system) will be the foundation for assessment of national resource demand—both filled and unfilled—thereby encouraging managers and dispatchers to log requests, even if the chances of receiving resources are low.
To prevent potential inflation of demand to attempt to shape future resource availability and to better track what the resources are needed for, we propose two new data fields to be collected with request data. First, we propose a new categorical field that distills order urgency and risk information. We propose a numerical scale from 1 to 4, where 1 is immediate need to protect lives, 2 is urgent need for initial attack to prevent escape, 3 is urgent need for extended attack to protect high value assets, and 4 is time-sensitive need to improve operational effectiveness of other actions. None of the definitions for these numerical categories assign judgement about the importance of the requests, but instead assign an urgency value with an underlying categorical reason for the request. The intent of this information is essentially to hold requestors accountable to the need for the resources in a non-judgmental, standardized way. In other words, the intent is to not question the requestor’s expertise or judgement, but to obtain more information to better inform resource use decisions. This categorical field could distill some valuable information that is already collected but may be missed in archived data because it is instead captured on paper forms or non-standardized electronic logs at dispatch centers or airtanker bases. Additionally, this categorical field is different than existing ROSS fields that specify a date and time the resource is needed by; these existing fields are not readily analyzed and do not indicate what the resource is needed for. Finally, the values we suggest would greatly benefit from input from an interagency body of operations professionals prior to adoption of any formalized data requirement. A broader or more clearly defined range of choices may be required in order to capture all potential scenarios. Nevertheless, the objective of this proposed field is to obtain key information not currently captured on urgency and risk that is key to real-time prioritization decisions and longer term analytical assessment of resource needs.
Second, we propose a new data field to track the task for which the resource is needed. This could help address existing issues around resource substitution and prioritization because we could analyze the data to determine the implications of resource scarcity for management actions. This field would need to be specific to each resource category, and should be formatted with pre-populated values, versus as an open text field, to facilitate effective analyses. Many current fire data collection tools are limited in analytical value by the use of open text fields (e.g., the ICS-209 critical needs fields [41] previously described). The pre-populated values we suggest must be thoughtfully generated with input from operations experts, but should remain highly general to limit impacts on operational efficiency from a dispatch perspective. These data, if collected as proposed for nationally available resources, could demonstrate unmet objectives stemming from resource scarcity. This, in turn, could help analytically determine whether adjustments in national resource numbers are warranted.
While the reality of this proposed metric is technically manageable since it builds off of an existing system, we recognize significant hurdles that must be cleared to make adjustments to existing interagency systems. While the USFS plays a key role in shaping the interagency dispatching environment, decisions about ROSS are ultimately governed by an interagency Change Control Board [45]. The USFS has limited ability to direct ROSS changes, and further, the ROSS system is on the verge of retirement, with a modernized dispatch program called Interagency Resource Ordering Capability (IROC; [46]) planned for roll-out in the spring of 2020 [47]. This new system may facilitate implementation of the metric as proposed or highlight unforeseen issues, given the untested functionality of IROC. Nevertheless, our intent in this manuscript was to delve into the details of existing resource demand and use metrics to explain the limitations and justify the need for improved data collection. We propose a future performance indicator for resource use in an abstract concept; whether this exists in ROSS, IROC, or a yet to be determined data collection mechanism, we recognize that resource request data are important for resource acquisition decisions, and that they are much more complex than simple summaries of UTF requests.
5. Conclusions
Through this work, we focused on ROSS request data to assess the utility of the dataset to describe resource scarcity. We generally focused at the national and annual scales through the lens of resource acquisition decision-making. Resource scarcity metrics are fundamental to an efficient wildfire suppression response, and these data are needed to facilitate improved, transparent, and analytical decision-making, positioning the USFS to more efficiently respond to challenges from a changing fire environment and associated budgetary pressures. Our analysis demonstrates that annual ROSS request summaries mischaracterize demand because they may not represent the population of use and scarcity, they do not necessarily gauge resource scarcity for core assets due to an increasing reliance upon surge capacity resources for some resource types, and they are not the most fitting summary of demand for resources with multi-day assignments (Figure 4). ROSS request data (in its current form) provide limited utility for guiding resource acquisition decisions, provided those decisions are based upon the historical ability to meet specific levels of demand.
Fire managers can generally address resource scarcity by choosing from three actions: (1) add more resources to the system, (2) improve efficiency of existing resource use in the system, and (3) restrict use of existing resources under conditions where they will not likely be effective. Each of these choices essentially increases the number of resources available to meet other demand; however, each comes with challenges. First, simply adding more resources requires an initial investment that may not pay out, depending on the severity of the fire year. As previously described, an overabundance of resources does not predicate improved fire response, and it may further incentivize managers to over order resources [42,43,44]. Second, in order to improve efficiency of resource use, we must first be able to describe our response. Yet our currently limited understanding of both resource use and suppression effectiveness [48,49] challenges the utility of this management action. Further, resource movement and prepositioning is an important consideration for efficiency questions. A growing body of research has helped build a foundation of knowledge in this area (e.g., [17,18,50,51,52]); however, there is still much to be learned for the wide variety of resource types and agencies at play in the national response arena. Finally, imposing restrictions on resource use in an interagency realm is fraught with challenges, particularly given different agency priorities with respect to fire management policy, values at risk, and relative appetite for beneficial fire opportunities. Regional or national control of limited or high-value assets should be informed by an analytical basis of suppression effectiveness; yet, this information is not well established. Ultimately, the path toward improved system performance (i.e., improved fire response) may include a combination of all three actions, but fundamentally, each decision requires a more thorough characterization of historical demand, related resource use, and management implications of unmet demand. This progress first requires an improved performance indicator for fire suppression resource scarcity to form the analytical foundation for future work.
Author Contributions
Conceptualization, E.J.B., D.E.C. and C.S.S.; methodology, E.J.B., D.E.C., and C.S.S.; software, E.J.B.; validation, E.J.B., D.E.C. and C.S.S.; formal analysis, E.J.B., D.E.C. and C.S.S.; investigation, E.J.B. and C.S.S.; resources, E.J.B., D.E.C. and C.S.S.; data curation, E.J.B. and C.S.S.; writing—original draft preparation, E.J.B. and C.S.S.; writing—review and editing, E.J.B., D.E.C. and C.S.S.; visualization, E.J.B. and C.S.S.; supervision, D.E.C.; project administration, E.J.B., D.E.C. and C.S.S.; funding acquisition, D.E.C. All authors have read and agreed to the published version of the manuscript.
Funding
This research was funded by joint venture agreement number 18-JV-11221636-099 between Colorado State University and the USDA Forest Service Rocky Mountain Research Station.
Conflicts of Interest
The authors declare no conflict of interest. The funders had no role in the design of the study; in the collection, analyses, or interpretation of data; in the writing of the manuscript, or in the decision to publish the results.
Appendix A
In this appendix we provide a table of acronyms for the readers’ convenience.

Table A1.
A list of acronyms used in this paper.
| Acronym | Definition |
|---|---|
| ABS | Aviation Business Systems |
| ATU | Additional Telemetry Unit |
| CA | California |
| CWN | Call When Needed |
| DOI | Department of the Interior |
| EXU | Exclusive Use |
| IA | Initial Attack |
| IHC | Interagency Hotshot Crew |
| IROC | Interagency Resource Ordering Capability |
| LAT | Large Airtanker |
| LF | Large Fire |
| NICC | National Interagency Coordination Center |
| PL | Preparedness Level |
| ROSS | Resource Ordering and Status System |
| T1 | Type One |
| US | United States |
| USFS | United States Forest Service |
| UTF | Unable to Fill |
References
- U.S. Forest Service. The U.S. Forest Service-An Overview; U.S. Forest Service: Washington, DC, USA. Available online: https://www.fs.fed.us/sites/default/files/legacy_files/media/types/publication/field_pdf/USFS-overview-0106MJS.pdf (accessed on 19 December 2019).
- National Interagency Coordination Center. National Interagency Coordination Center Wildland Fire Summary and Statistics Annual Report 2017; National Interagency Coordination Center: Boise, ID, USA, 2017. Available online: https://www.predictiveservices.nifc.gov/intelligence/2018_statssumm/annual_report_2017.pdf (accessed on 19 December 2019).
- Christiansen, V. Leadership Corner: A fire budget for the 21st century; U.S. Forest Service: Washington, DC, USA, 30 March 2018. Available online: https://www.fs.fed.us/inside-fs/leadership/fire-budget-21st-century; (accessed on 19 December 2019).
- U.S. Congress. CONSOLIDATED APPROPRIATIONS ACT, 2018; U.S. Congress: Washington, DC, USA, 2018. Available online: https://www.congress.gov/115/plaws/publ141/PLAW-115publ141.pdf (accessed on 19 December 2019).
- U.S. Forest Service. The Rising Cost of Wildfire Operations: Effects on the Forest Service’s Non-Fire Work; U.S. Forest Service: Washington, DC, USA, 2015. Available online: https://www.fs.fed.us/sites/default/files/2015-Fire-Budget-Report.pdf (accessed on 19 December 2019).
- National Interagency Fire Center. Federal Firefighting Costs (Suppression Only); National Interagency Fire Center: Boise, ID, USA. Available online: https://www.nifc.gov/fireInfo/fireInfo_documents/SuppCosts.pdf (accessed on 19 December 2019).
- Christiansen, V. Chief’s Letter of Intent for Wildland Fire-2019; U.S. Forest Service: Washington, DC, USA, 11 April 2019. Available online: https://www.fs.fed.us/sites/default/files/Chief-Letter-of-Intent-for-Wildland-Fire-2019.pdf (accessed on 19 December 2019).
- National Interagency Coordination Center. National Significant Wildland Fire Potential Outlook; National Interagency Coordination Center: Boise, ID, USA. Available online: https://www.predictiveservices.nifc.gov/outlooks/outlooks.htm (accessed on 19 December 2019).
- Westerling, A.L. Warming and Earlier Spring Increase Western U.S. Forest Wildfire Activity. Science 2006, 313, 940–943. [Google Scholar] [CrossRef] [Green Version]
- Jolly, W.M.; Cochrane, M.A.; Freeborn, P.H.; Holden, Z.A.; Brown, T.J.; Williamson, G.J.; Bowman, D.M.J.S. Climate-induced variations in global wildfire danger from 1979 to 2013. Nat. Commun. 2015, 6, 7537. [Google Scholar] [CrossRef]
- Barbero, R.; Abatzoglou, J.T.; Larkin, N.K.; Kolden, C.A.; Stocks, B. Climate change presents increased potential for very large fires in the contiguous United States. Int. J. Wildland Fire 2015, 24, 892. [Google Scholar] [CrossRef]
- Abatzoglou, J.T.; Williams, A.P. Impact of anthropogenic climate change on wildfire across western US forests. Proc. Natl. Acad. Sci. USA 2016, 113, 11770–11775. [Google Scholar] [CrossRef] [Green Version]
- National Wildfire Coordinating Group. How to Become a Wildland Firefighter; National Wildfire Coordinating Group: Boise, ID, USA, Last Modified 25 February 2019. Available online: https://www.nwcg.gov/how-to-become-a-wildland-firefighter (accessed on 19 December 2019).
- Wei, Y.; Bevers, M.; Belval, E.; Bird, B. A Chance-Constrained Programming Model to Allocate Wildfire Initial Attack Resources for a Fire Season. For. Sci. 2015, 61, 278–288. [Google Scholar] [CrossRef]
- Ntaimo, L.; Gallego-Arrubla, J.A.; Gan, J.; Stripling, C.; Young, J.; Spencer, T. A Simulation and Stochastic Integer Programming Approach to Wildfire Initial Attack Planning. For. Sci. 2013, 59, 105–117. [Google Scholar] [CrossRef] [Green Version]
- Haight, R.G.; Fried, J.S. Deploying Wildland Fire Suppression Resources with a Scenario-Based Standard Response Model. INFOR 2007, 45, 31–39. [Google Scholar] [CrossRef]
- Lyon, K.M.; Huber-Stearns, H.R.; Moseley, C.; Bone, C.; Mosurinjohn, N.A. Sharing contracted resources for fire suppression: Engine dispatch in the Northwestern United States. Int. J. Wildland Fire 2017, 26, 113–121. [Google Scholar] [CrossRef]
- Huber-Stearns, H.; Moseley, C.; Bone, C.; Mosurinjohn, N.; Lyon, K.M. An Initial Look at Contracted Wildfire Response Capacity in the American West. J. For. 2019, 117, 1–8. [Google Scholar] [CrossRef]
- Office of the Inspector Genera. Forest Service’s Replacement Plan for Firefighting Aerial Resources; Report Number USDA/OIG-A/08601-53-SF; Office of the Inspector General: Washington, DC, USA, 2009. Available online: https://www.usda.gov/oig/webdocs/08601-53-SF.pdf (accessed on 19 December 2019).
- Keating, E.G.; Morral, A.R.; Price, C.C.; Woods, D.; Norton, D.M.; Panis, C.; Saltzman, E.; Sanchez, R. Air Attack Against Wildfires; RAND Corporation: Santa Monica, CA, USA, 2012. [Google Scholar]
- AVID. Firefighting Aircraft Study; AG-024B-C-12-0006; AVID LLC: Yorktown, VA, USA, 2013; Available online: https://wildfiretoday.com/documents/AVID_firefighting_aircraft_study.pdf (accessed on 19 December 2019).
- Calkin, D.E.; Stonesifer, C.S.; Thompson, M.P.; McHugh, C.W. Large airtanker use and outcomes in suppressing wildland fires in the United States. Int. J. Wildland Fire 2014, 23, 259–271. [Google Scholar] [CrossRef]
- Stonesifer, C.S.; Calkin, D.E.; Thompson, M.P.; Stockmann, K.D. Fighting fire in the heat of the day: An analysis of operational and environmental conditions of use for large airtankers in United States fire suppression. Int. J. Wildland Fire 2016, 25, 520–533. [Google Scholar] [CrossRef]
- Thompson, M.P.; Calkin, D.E.; Herynk, J.; McHugh, C.W.; Short, K.C. Airtankers and wildfire management in the US Forest Service: Examining data availability and exploring usage and cost trends. Int. J. Wildland Fire 2013, 22, 223–233. [Google Scholar] [CrossRef]
- Donovan, G.H. A comparison of the costs of forest service and contract fire crews in the Pacific Northwest. West. J. Appl. Sci. 2005, 20, 233–239. [Google Scholar] [CrossRef] [Green Version]
- Donovan, G.H. Determining the optimal mix of federal and contract fire crews: A case study from the Pacific Northwest. Ecol. Model. 2006, 194, 372–378. [Google Scholar] [CrossRef]
- Stonesifer, C.S.; Calkin, D.E.; Hand, M.S. Federal fire managers’ perceptions of the importance, scarcity and substitutability of suppression resources. Int. J. Wildland Fire 2017, 26, 598–603. [Google Scholar] [CrossRef]
- Lockheed Martin Enterprise Solutions & Services. Resource Ordering and Status System (ROSS); 2012. Available online: https://famit.nwcg.gov/applications/ROSS (accessed on 19 December 2019).
- U.S. Forest Service. Standards for Airtanker Operations; U.S. Forest Service: Washington, DC, USA, July 2019. Available online: https://www.fs.usda.gov/sites/default/files/2019-09/standards_for_airtanker_operations_-_final_-_2019_approved_0.pdf (accessed on 19 December 2019).
- Interagency Standards for Fire and Fire Aviation Operations Group. Interagency Standards for Fire and Fire Aviation Operations; NFES 2092; National Interagency Fire Center: Boise, ID, USA, 2019. Available online: https://www.nifc.gov/PUBLICATIONS/redbook/2019/RedBookAll.pdf (accessed on 19 December 2019).
- National Interagency Hotshot Steering Committee. Standards for Interagency Hotshot Crew Operations; National Interagency Fire Center: Boise, ID, USA, 2016. Available online: https://www.nifc.gov/policies/policies_documents/StandardsInteragencyHotshotCrewOps.pdf (accessed on 19 December 2019).
- California Wildfire Coordinating Group. California Mobilization Guide 2019; California Wildland Fire Coordinating Group: Riverside, CA, USA, 2019. Available online: https://gacc.nifc.gov/oncc/mob_guide/2019/CWCG%20Mob%20Guide_2019.pdf (accessed on 19 December 2019).
- National Interagency Fire Center. National Preparedness Levels; National Interagency Fire Center: Boise, ID, USA. Available online: http://nifc.gov/fireinfo_prepLevels.html (accessed on 28 January 2020).
- U.S. Forest Service. Large Airtanker Modernization Strategy; U.S. Forest Service: Washington, DC, USA, 2012. Available online: https://www.fs.usda.gov/sites/default/files/aviation_strategy_implementation-final-4.3.18.pdf (accessed on 28 January 2020).
- U.S. Department of Agriculture Forest Service Fire & Aviation Management and Department of the Interior Office of Wildland Fire. 2017 Aviation Annual Report; U.S. Department of Agriculture Forest Service Fire & Aviation Management: Washington, DC, USA; Department of the Interior Office of Wildland Fire: Washington, DC, USA, 2017. Available online: https://www.fs.fed.us/sites/default/files/2019-07/cy2017_usfs_aviation_report_final_20190702.pdf (accessed on 19 December 2019).
- Congressional Research Service. Wildfire Statistics. In Focus; Congressional Research Service: Washington, DC, USA, 3 October 2019; p. 2. Available online: https://fas.org/sgp/crs/misc/IF10244.pdf (accessed on 19 December 2019).
- National Interagency Coordination Center. National Interagency Mobilization Guide; National Interagency Fire Center: Boise, ID, USA, 2019. Available online: https://www.nifc.gov/nicc/mobguide/Mobilization_Guide.pdf (accessed on 19 December 2019).
- U.S. Department of Agriculture Forest Service Fire & Aviation Management and Department of the Interior Office of Wildland Fire. Aircraft Inspector Guide; U.S. Department of Agriculture Forest Service Fire & Aviation Management: Washington, DC, USA; Department of the Interior Office of Wildland Fire: Washington, DC, USA, June 2018. Available online: https://www.fs.fed.us/sites/default/files/2019-05/18-278212_aig_final_pre_policy_rev_6_28_2018_spf_letter.pdf (accessed on 19 December 2019).
- U.S. Department of Agriculture Forest Service Fire & Aviation Management. FAM-IT Portal; U.S. Department of Agriculture Forest Service Fire & Aviation Management: Washington, DC, USA. Available online: https://famit.nwcg.gov/applications/FireStat (accessed on 11 December 2019).
- Automated Flight Following. Available online: https://www.aff.gov/home.aspx (accessed on 11 December 2019).
- National Interagency Fire Center Predictive Services. ICS-209: When to Report Wildland Fire Incidents; National Interagency Fire Center Predictive Services: Boise, ID, USA, 2011. Available online: https://www.predictiveservices.nifc.gov/intelligence/ICS-209%20When%20to%20Report%20Wildland%20Fire%20Incidents.pdf (accessed on 11 December 2019).
- Donovan, G.H.; Brown, T.C. An alternative incentive structure for wildfire management on national forest land. For. Sci. 2005, 51, 387–395. [Google Scholar]
- Donovan, G.H.; Prestemon, J.P.; Gebert, K. The Effect of Newspaper Coverage and Political Pressure on Wildfire Suppression Costs. Soc. Nat. Resour. 2011, 24, 785–798. [Google Scholar] [CrossRef] [Green Version]
- Thompson, M.P.; Calkin, D.E.; Finney, M.A.; Gebert, K.M.; Hand, M.S. A Risk-Based Approach to Wildland Fire Budgetary Planning. For. Sci. 2013, 59, 63–77. [Google Scholar] [CrossRef] [Green Version]
- U.S. Department of Agriculture Forest Service Fire & Aviation Management. FAM-IT Portal: Change Control Board; U.S. Department of Agriculture Forest Service Fire & Aviation Management: Washington, DC, USA. Available online: https://famit.nwcg.gov/applications/ROSS/history/ccb (accessed on 11 December 2019).
- U.S. Forest Service State and Private Forestry. Charter for the Interagency Resource Ordering Capability (IROC); U.S. Forest Service State and Private Forestry: Washington, DC, USA, 2016. Available online: https://famit.nwcg.gov/sites/default/files/WFIT_IROC_USDA_InvestmentCharter_20160107_signed%20%282%29.pdf (accessed on 11 December 2019).
- ROSS/IROC Newsletter; October 2019. Available online: https://famit.nwcg.gov/sites/default/files/news/ROSS-IROC%20Newsletter%20October%202019_0.pdf (accessed on 11 December 2019).
- Plucinski, M.P. Contain and Control: Wildfire Suppression Effectiveness at Incidents and Across Landscapes. Curr. For. Rep. 2019, 5, 20–40. [Google Scholar] [CrossRef]
- Simpson, H.; Bradstock, R.; Price, O. A Temporal Framework of Large Wildfire Suppression in Practice, a Qualitative Descriptive Study. Forests 2019, 10, 884. [Google Scholar] [CrossRef] [Green Version]
- Wei, Y.; Belval, E.J.; Thompson, M.P.; Calkin, D.E.; Stonesifer, C.S. A simulation and optimisation procedure to model daily suppression resource transfers during a fire season in Colorado. Int. J. Wildland Fire 2016, 26, 630–641. [Google Scholar] [CrossRef] [Green Version]
- Belval, E.J.; Wei, Y.; Calkin, D.E.; Stonesifer, C.S.; Thompson, M.P.; Tipton, J.R. Studying interregional wildland fire engine assignments for large fire suppression. Int. J. Wildland Fire 2017, 26, 642–653. [Google Scholar] [CrossRef]
- Belval, E.J.; Calkin, D.E.; Wei, Y.; Stonesifer, C.S.; Thompson, M.P.; Masarie, A. Examining dispatching practices for Interagency Hotshot Crews to reduce seasonal travel distance and manage fatigue. Int. J. Wildland Fire 2018, 27, 569–580. [Google Scholar] [CrossRef] [Green Version]
Figure 1.
Forest Service large airtanker fleet size and use over time. Fleet size depicted by contract/ownership category (Exclusive Use—EXU; Call When Needed—CWN; United States Forest Service (USFS) Owned); fleet size data obtained from USFS Fire and Aviation Management Annual Aviation Reports (Available at: https://www.fs.fed.us/managing-land/fire/aviation/publications) and derived from Aviation Business System (ABS) billing data. Total annual flight time derived from ABS.

Figure 2.
T1 crew corps size and use over time. Corps size depicted by crew type (Interagency Hotshot Crew not from California or Alaska, Interagency Hotshot Crew from California or Alaska, or T1 crew from California that is not an Interagency Hotshot Crew); corps size and number of days of crew usage data obtained from the Resource Ordering and Status System (ROSS). The T1 California crew hours include the California Interagency Hotshot Crews (IHCs).

Figure 3.
The number of large airtanker and type 1 crew (a) filled requests and (b) requests returned Unable to Fill in ROSS by calendar year against the number of days at or above Preparedness Level 3 for calendar years 2014–2018. The solid lines all requests within the US. The dashed lines are for all requests except California and Alaska.

Figure 4.
The ratio of large airtanker and type 1 crew of request returned Unable to Fill to Filled requests (a) and resources on assignment (b) in ROSS by calendar year against the number of days at or above Preparedness Level 3 for calendar years 2014–2018. The solid lines are all requests within the US. The dotted lines are for all requests except California and Alaska.

Figure 5.
Two daily metrics of resource use and scarcity for large airtankers (a) and Type 1 crews (b). The orange line indicates the number of such resources assigned each day as recorded in ROSS. The black line indicates the number of requests returned Unable to Fill (UTF) as recorded in ROSS. The data summary utilizes all requests within the United States.

Figure 6.
Three subsets of data (one subset per column) showing the two daily metrics of resource use and scarcity for large airtankers (top row of each set) and IHCs (bottom row of each set) from all 2018 ROSS requests. The orange line indicates the number of such resources assigned each day as recorded in ROSS. The black line indicates the number of requests returned Unable to Fill (UTF) as recorded in ROSS. The left two graphs are all requests within the US. The middle two graphs are all requests from the Great Basin Geographic Area. The right two graphs are all requests from the Northwest Geographic Area.

Figure 7.
The number of filled requests for large airtankers (a), number of filled requests for Type 1 crews (b), number of requests returned UTF for large airtankers (c), and number of requests returned UTF for Type 1 crews (d) by year (2014–2018), bars colored by the type of fire and the fire location, i.e., inside or outside of California (CA) and Alaska (AK), requesting the resource.

Figure 8.
Violin plots showing the total number of filled requests daily by Preparedness Level (PL) for all days from 2014 to 2018 for (a) T1 crews and (b) large airtankers (LATs). In addition, violin plots showing the total number of requests returned UTF daily by PL for all days from 2014 to 2018 for (c) T1 crews and (d) LATs.

Table 1.
Selected examples of destructive “off-season” wildfires, illustrating the shift from a “fire season” to a “fire year” in the US.
Table 1.
Selected examples of destructive “off-season” wildfires, illustrating the shift from a “fire season” to a “fire year” in the US.
| Ignition Month/Year | Fire Name | Ignition State | Final Fire Size (Hectares) |
|---|---|---|---|
| February, 2015 | Round | California | 2645 |
| November, 2016 | Chimney Tops 2 | Tennessee | 6936 |
| March, 2017 | Northwest Oklahoma Complex | Oklahoma/Kansas | 315,368 |
| December, 2017 | Thomas | California | 114,078 |
| November, 2018 | Camp | California | 62,053 |
© 2020 by the authors. Licensee MDPI, Basel, Switzerland. This article is an open access article distributed under the terms and conditions of the Creative Commons Attribution (CC BY) license (http://creativecommons.org/licenses/by/4.0/).
Share and Cite
MDPI and ACS Style
Belval, E.J.; Stonesifer, C.S.; Calkin, D.E. Fire Suppression Resource Scarcity: Current Metrics and Future Performance Indicators. Forests 2020, 11, 217. https://0-doi-org.brum.beds.ac.uk/10.3390/f11020217
AMA Style
Belval EJ, Stonesifer CS, Calkin DE. Fire Suppression Resource Scarcity: Current Metrics and Future Performance Indicators. Forests. 2020; 11(2):217. https://0-doi-org.brum.beds.ac.uk/10.3390/f11020217
Chicago/Turabian StyleBelval, Erin J, Crystal S Stonesifer, and David E Calkin. 2020. "Fire Suppression Resource Scarcity: Current Metrics and Future Performance Indicators" Forests 11, no. 2: 217. https://0-doi-org.brum.beds.ac.uk/10.3390/f11020217
Note that from the first issue of 2016, this journal uses article numbers instead of page numbers. See further details here.