Testing the Effect of Snag and Cavity Supply on Deadwood-Associated Species in a Managed Boreal Forest


 , ,
, ,
Abstract
:1. Introduction
2. Methods
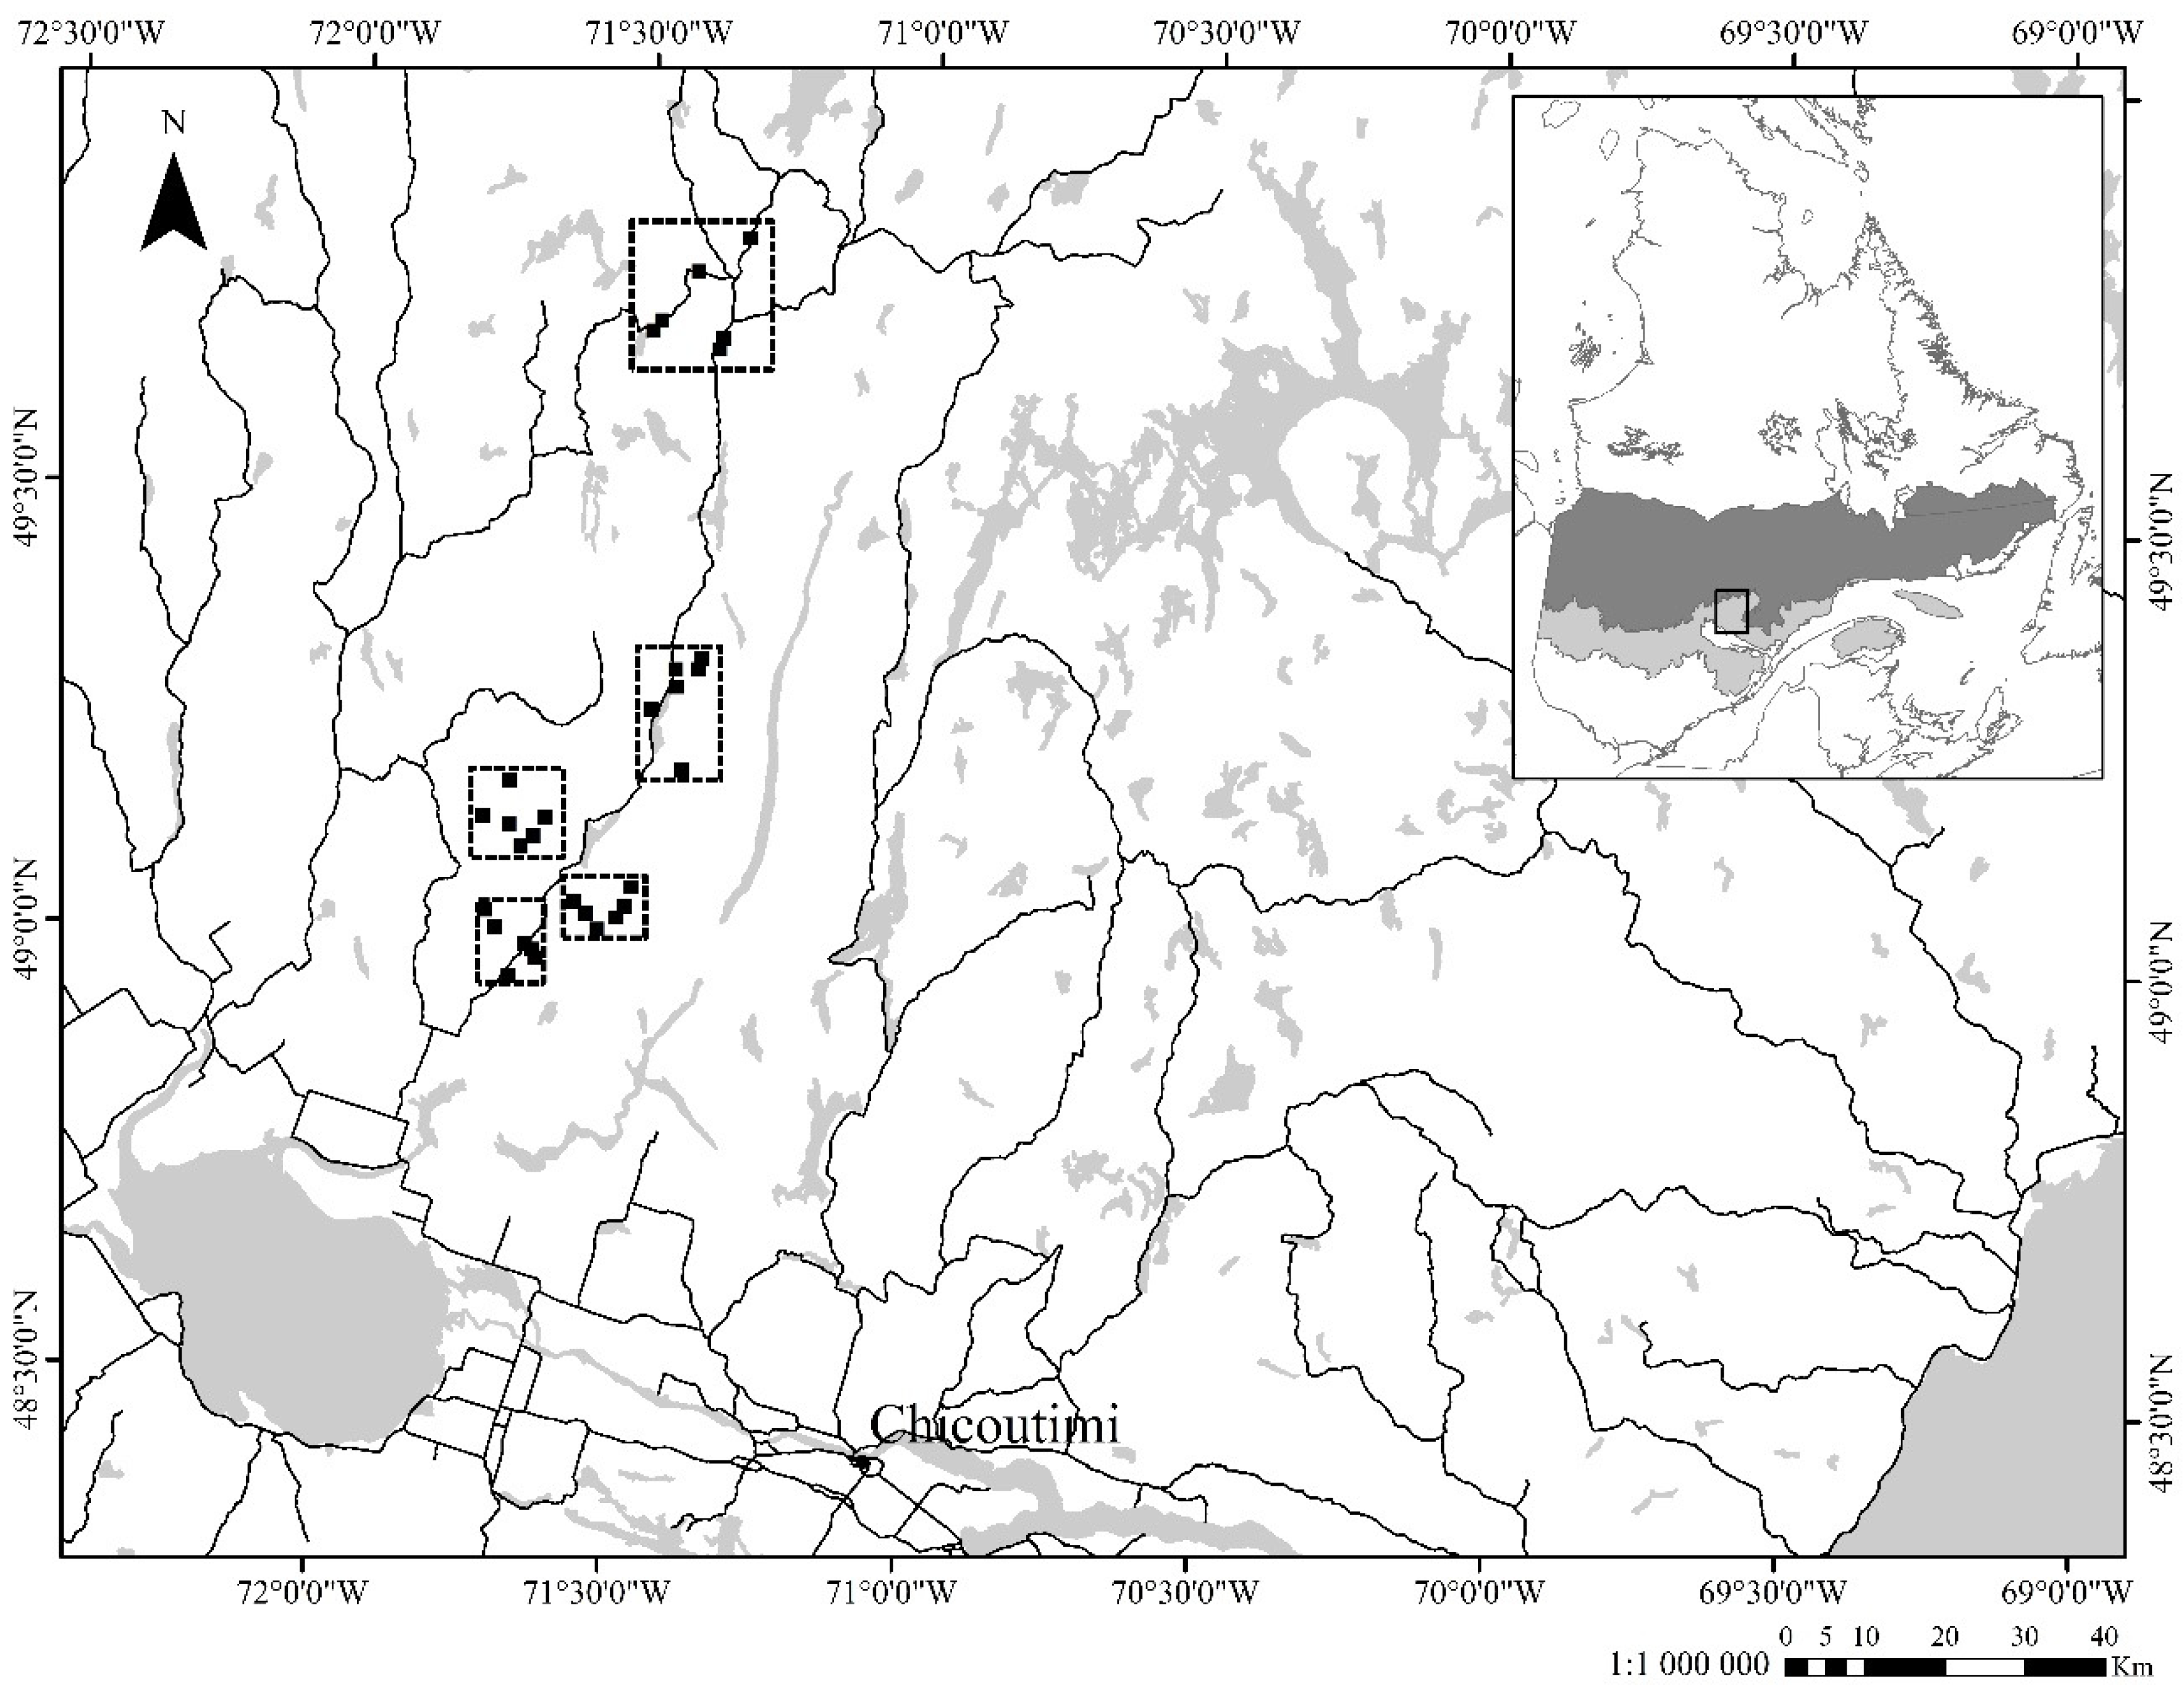
2.1. Study Area
2.2. Experimental Design and Data Collection
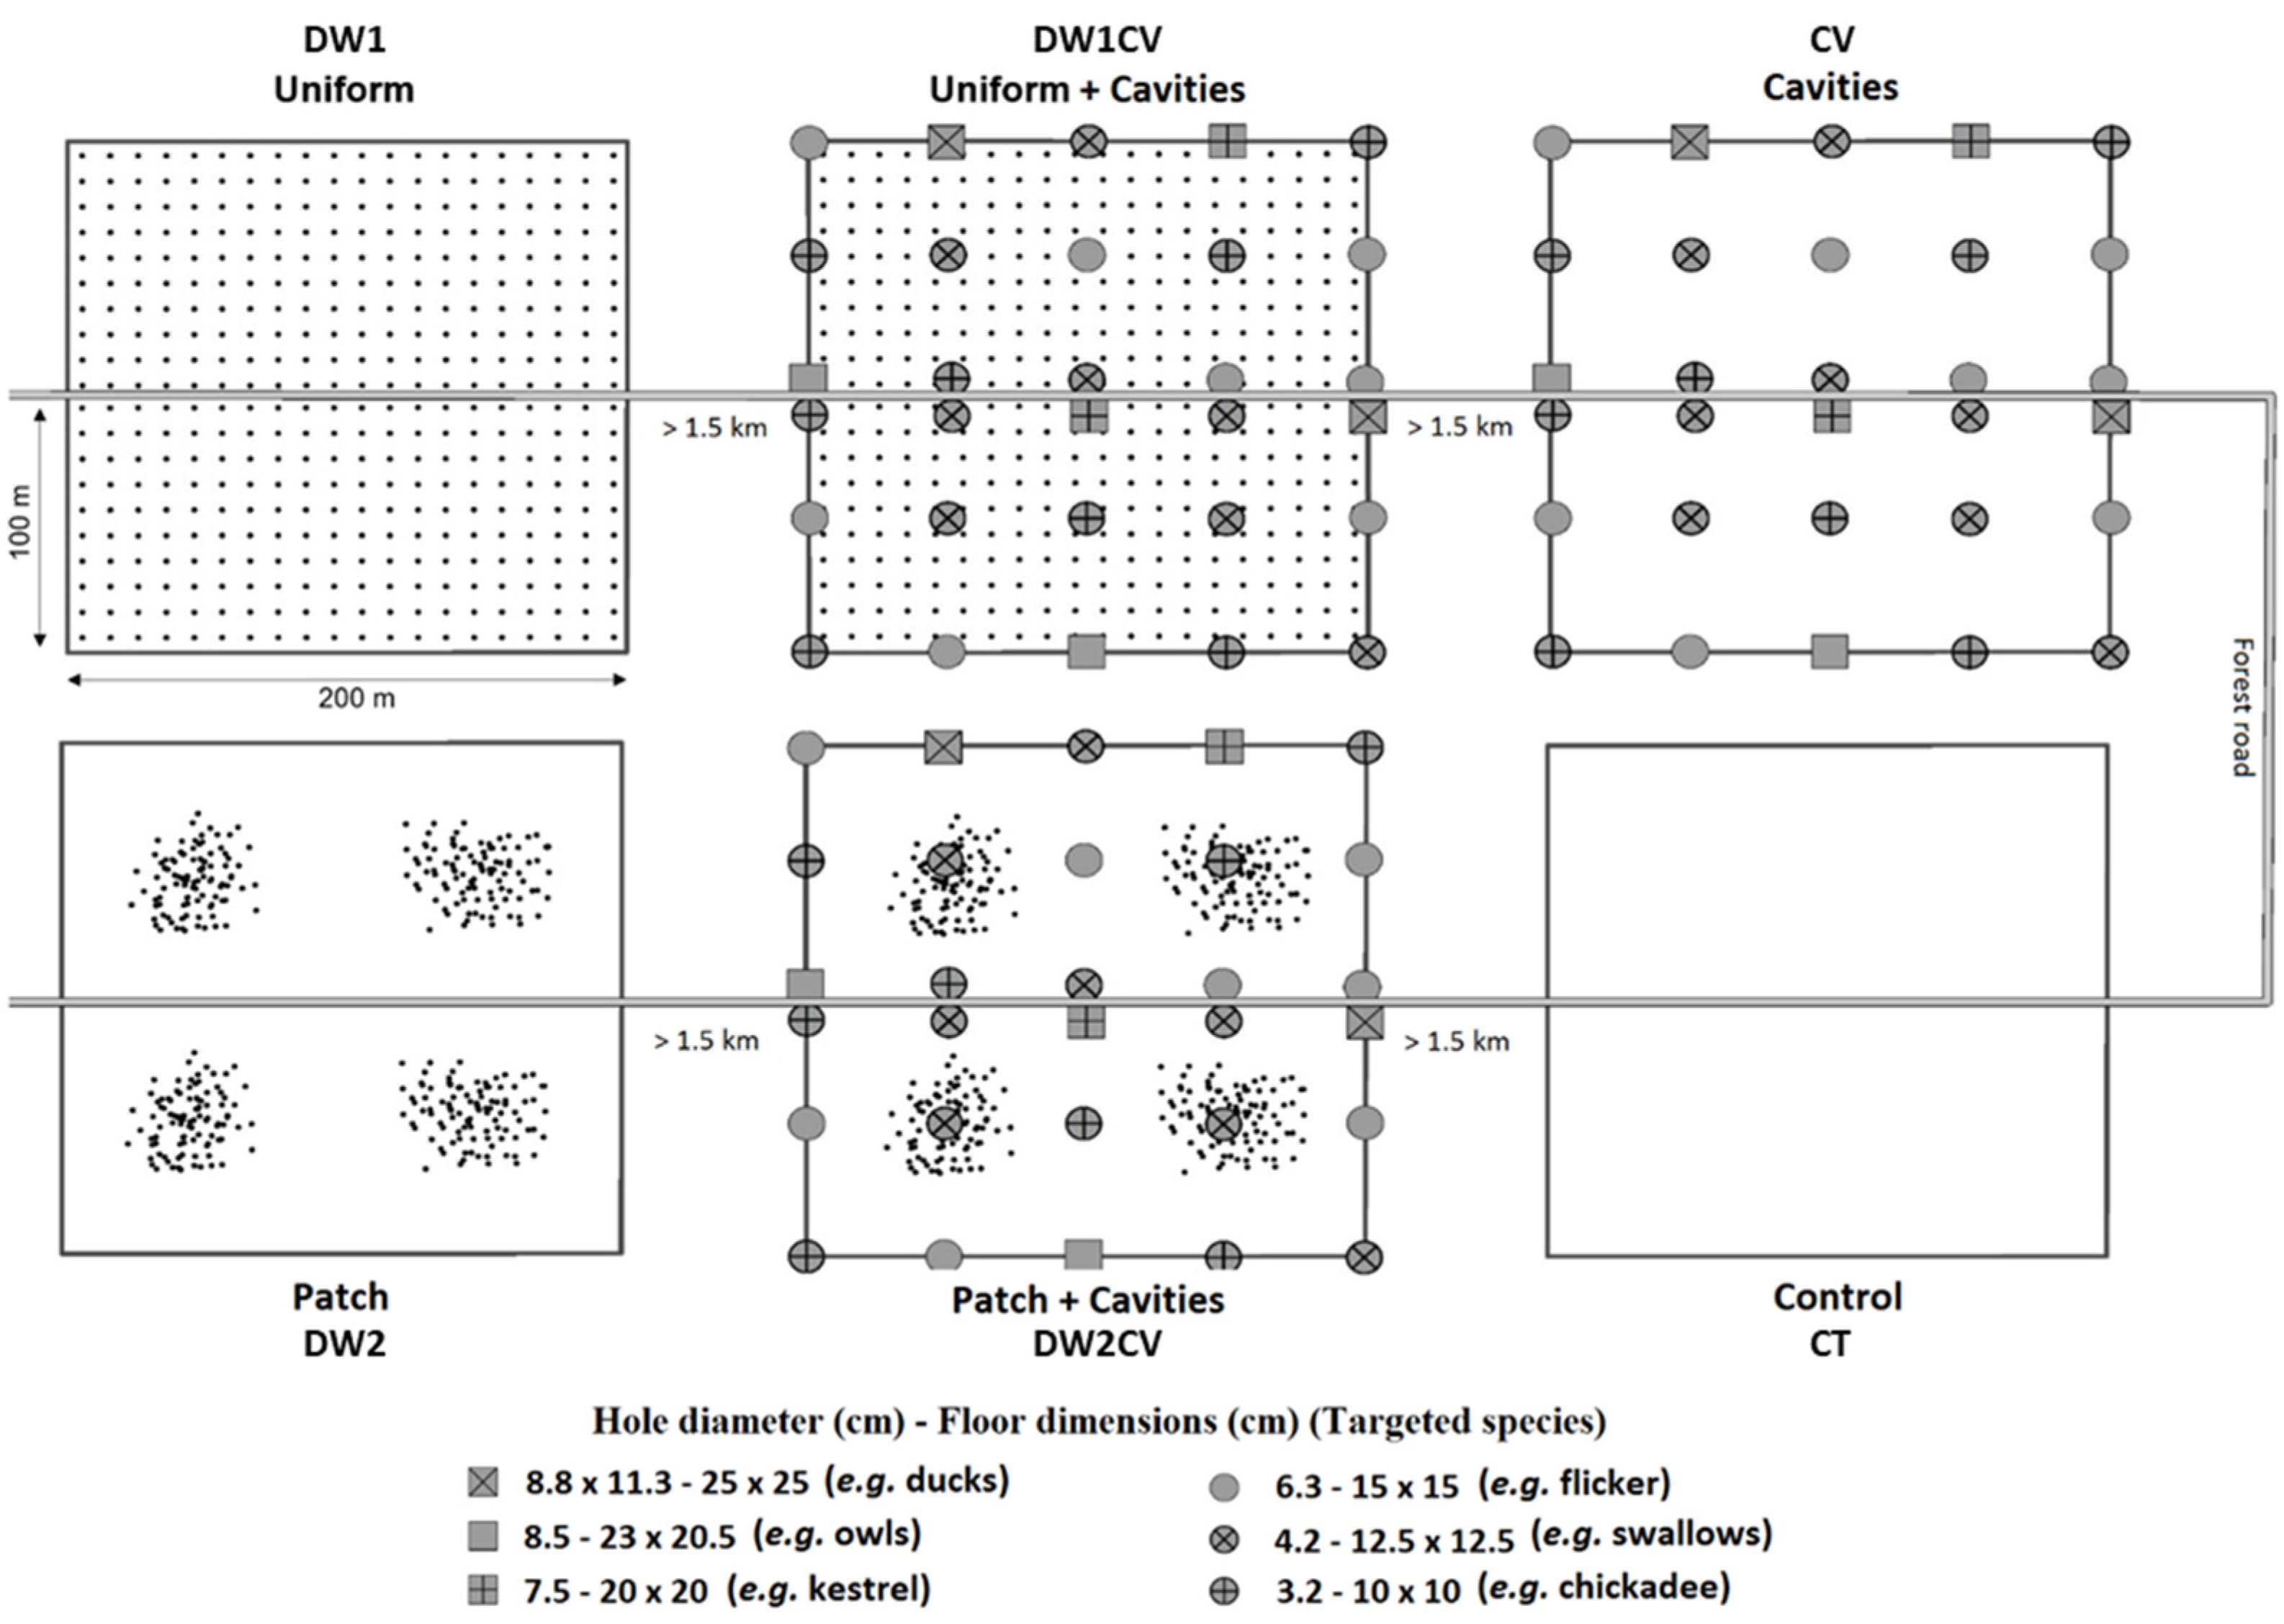
2.2.1. Experimental Design
2.2.2. Deadwood Supply
2.2.3. Cavity Supply
2.2.4. Insect Survey
2.2.5. Foraging Marks Survey
2.2.6. Cavity Survey
2.2.7. Vegetation Survey
2.3. Statistical Analysis
2.3.1. Saproxylic Beetles
2.3.2. Foraging Marks
3. Results
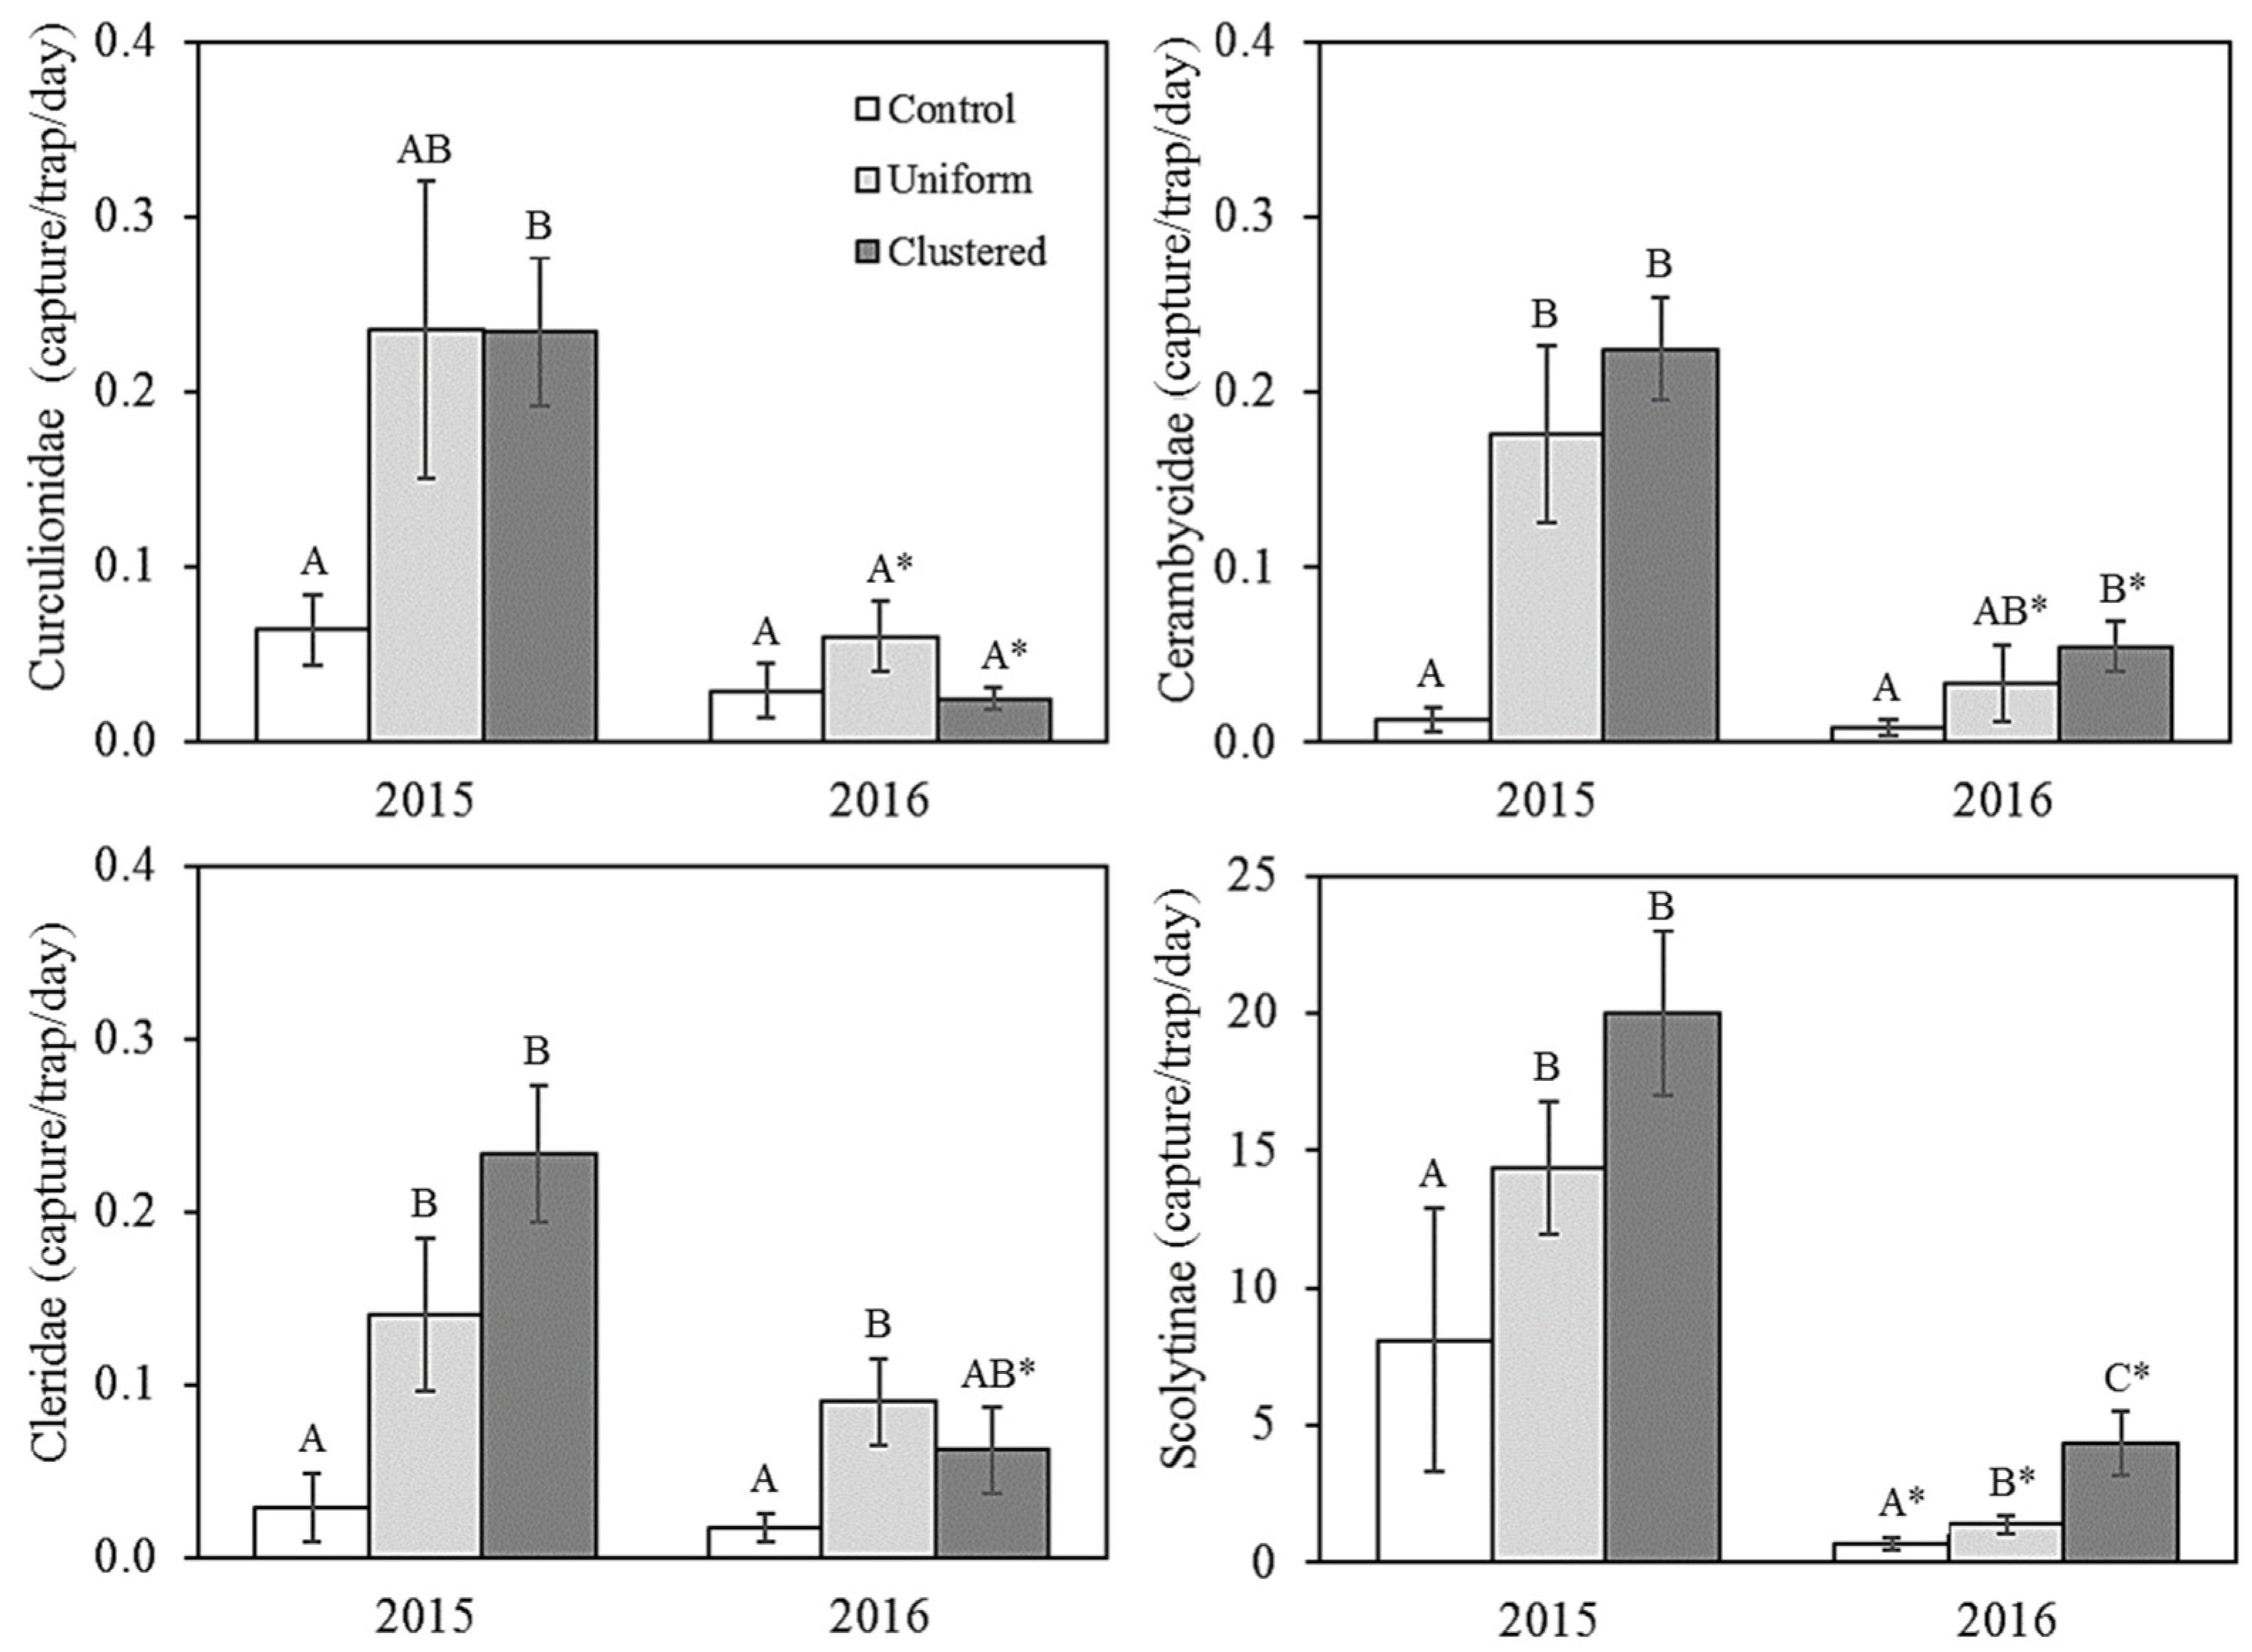
3.1. Saproxylic Insects
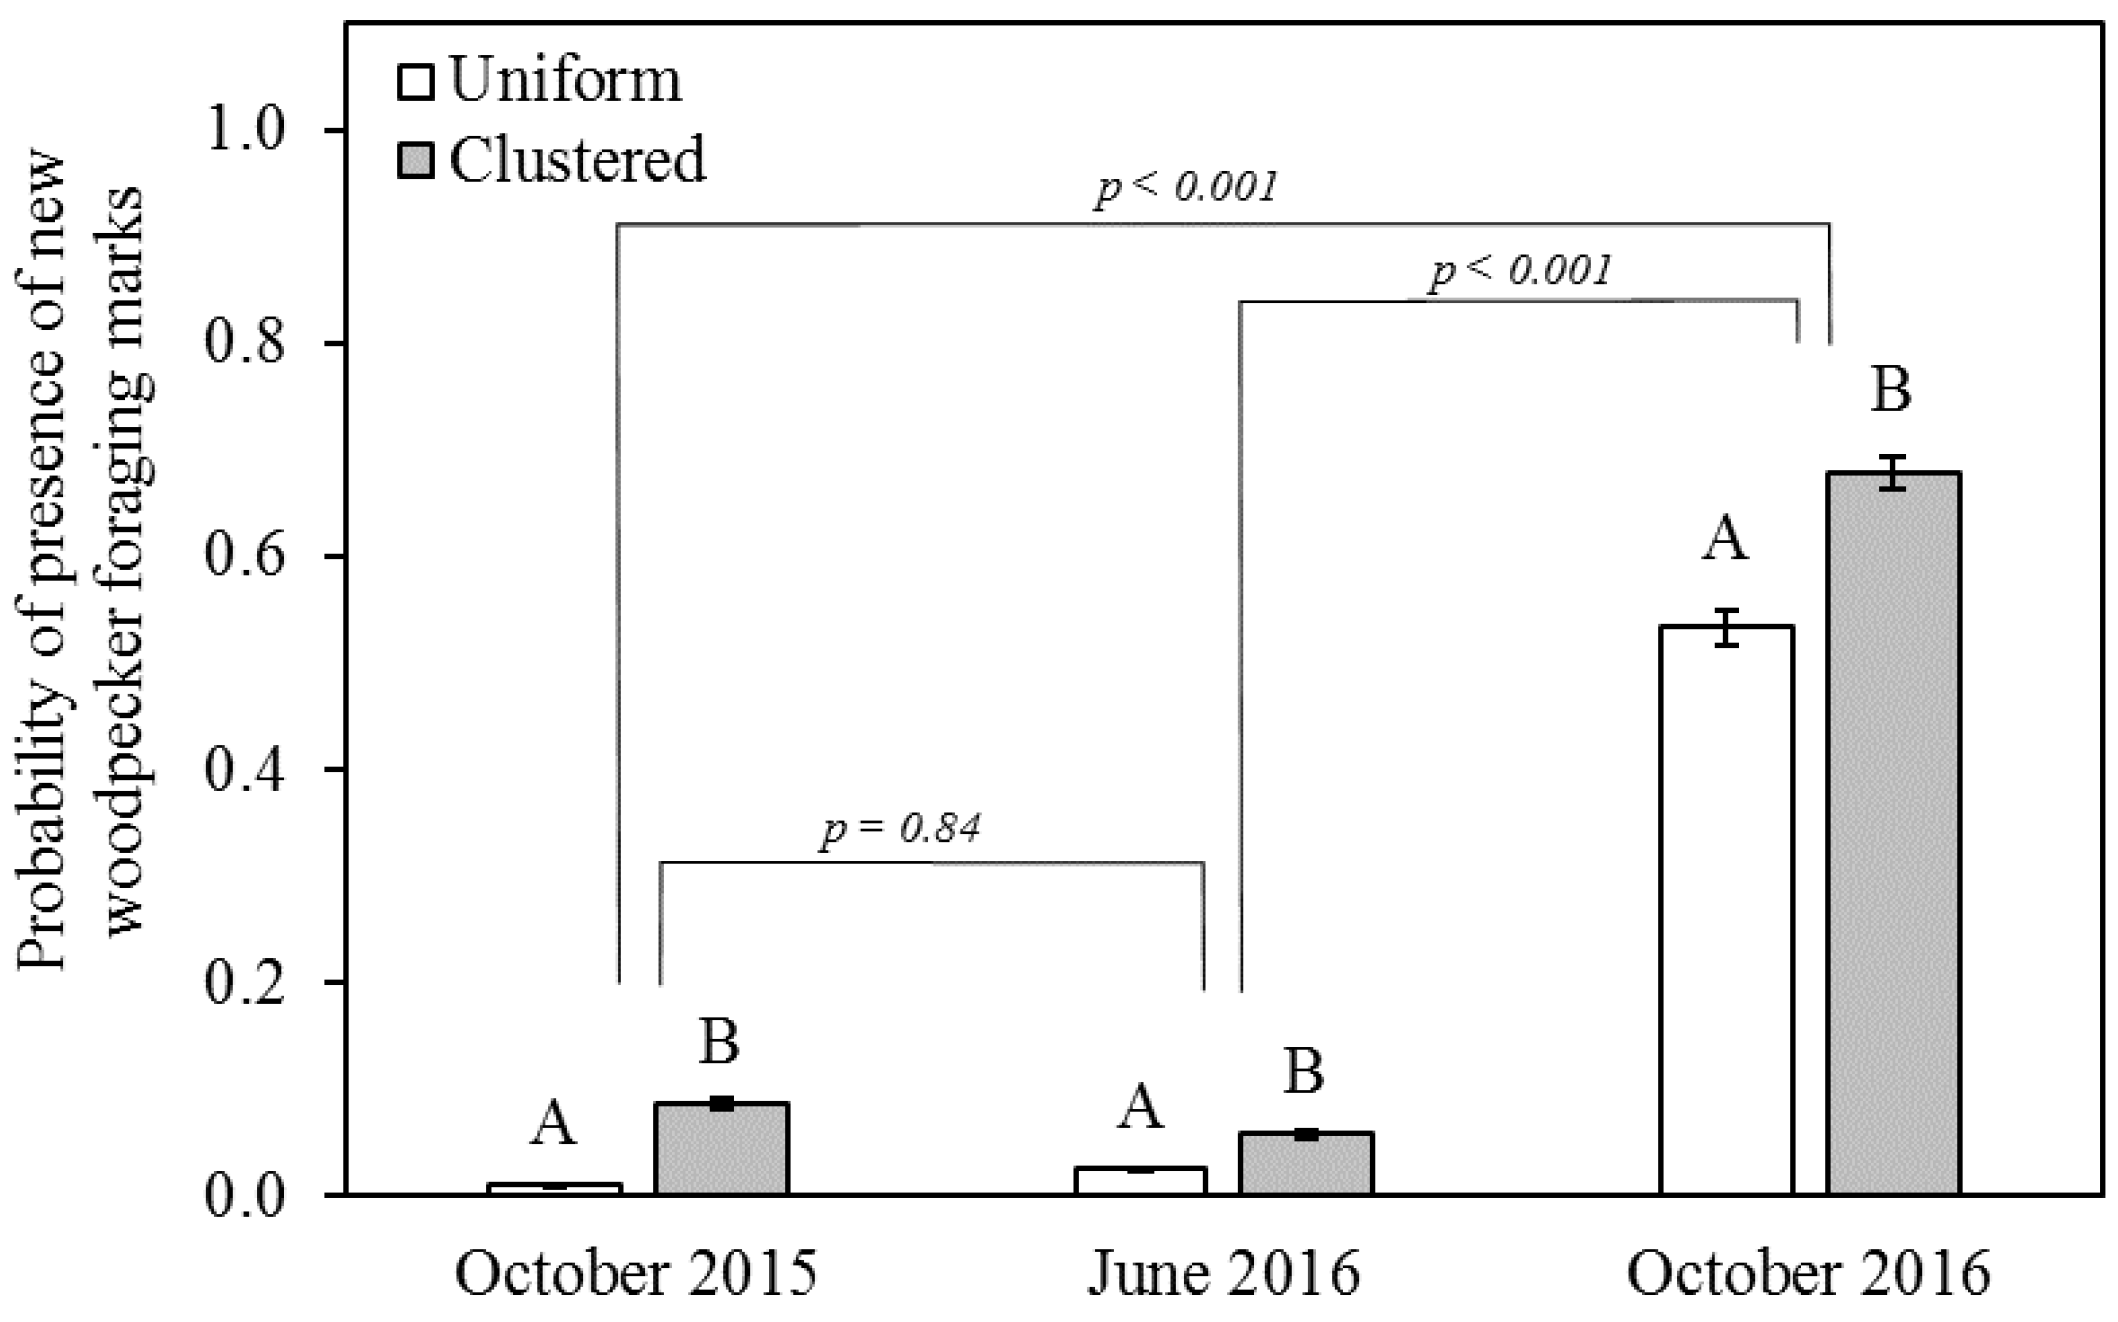
3.2. Foraging Marks
3.3. Cavity Survey
4. Discussion
4.1. Differences between Snag-Supply Treatments
4.2. Effect of Spatial Scale on Snag Use
4.3. Time Lag between Beetle Capture and Woodpecker Foraging-Mark Abundance
4.4. Other Time-Related Effects on the Response of Insects and Birds to Snag Supply
4.5. Effect of Cavity Supply
5. Conclusions
Supplementary Materials
Author Contributions
Funding
Acknowledgments
Conflicts of Interest
References
- Cyr, D.; Gauthier, S.; Bergeron, Y.; Carcaillet, C. Forest management is driving the eastern North American boreal forest outside its natural range of variability. Front. Ecol. Environ. 2009, 7, 519–524. [Google Scholar] [CrossRef]
- Boucher, D.; De Grandpré, L.; Kneeshaw, D.; St-Onge, B.; Ruel, J.-C.; Waldron, K.; Lussier, J.-M. Effects of 80 years of forest management on landscape structure and pattern in the eastern Canadian boreal forest. Landsc. Ecol. 2015, 30, 1913–1929. [Google Scholar] [CrossRef]
- Vaillancourt, M.A.; Drapeau, P.; Gauthier, S.; Robert, M. Availability of standing trees for large cavity-nesting birds in the eastern boreal forest of Québec, Canada. For. Ecol. Manag. 2008, 255, 2272–2285. [Google Scholar] [CrossRef]
- Drapeau, P.; Nappi, A.; Imbeau, L.; Saint-Germain, M. Standing deadwood for keystone bird species in the eastern boreal forest: Managing for snag dynamics. For. Chron. 2009, 85, 227–234. [Google Scholar] [CrossRef] [Green Version]
- Imbeau, L.; St-Laurent, M.H.; Marzell, L.; Brodeur, V. Current capacity to conduct ecologically sustainable forest management in northeastern canada reveals challenges for conservation of biodiversity. Can. J. For. Res. 2015, 45, 567–578. [Google Scholar] [CrossRef]
- Nappi, A.; Drapeau, P.; Savard, J.-P.L. Salvage logging after wildfire in the boreal forest: Is it becoming a hot issue for wildlife? For. Chron. 2004, 80, 67–74. [Google Scholar] [CrossRef]
- Siitonen, J. Threatened saproxylic species. In Biodiversity in Deadwood; Stokland, J.N., Siitonen, J., Jonsson, B.G., Eds.; Cambridge University Press: Cambridge, UK, 2012; pp. 356–379. [Google Scholar]
- Imbeau, L.; Mönkkönen, M.; Desrochers, A. Long-term effects of forestry on birds of the eastern canadian boreal forests: A comparison with fennoscandia. Conserv. Biol. 2001, 15, 1151–1162. [Google Scholar] [CrossRef]
- Gauthier, S.; Vaillancourt, M.A.; Leduc, A.; De Grandpré, L.; Kneeshaw, D.; Morin, H.; Drapeau, P.; Bergeron, Y. Ecosystem Management in the Boreal Forest; Presses de l’Université du Québec: Québec, QC, Canada, 2009. [Google Scholar]
- Boucher, Y.; Perrault-Hébert, M.; Fournier, R.; Drapeau, P.; Auger, I. Cumulative patterns of logging and fire (1940–2009): Consequences on the structure of the eastern Canadian boreal forest. Landsc. Ecol. 2016, 2, 361–375. [Google Scholar] [CrossRef]
- Siitonen, J. Forest management, coase woody debris and saproxylic organisms: Fennoscandian boreal forests as an example. Ecol. Bull. 2001, 49, 11–41. [Google Scholar]
- Stokland, J.N.; Siitonen, J.; Jonsson, B.G. Biodiversity in Dead Wood; Cambridge University Press: Cambridge, UK, 2012; p. 509. [Google Scholar]
- Edworthy, A.B.; Drever, M.C.; Martin, K. Woodpeckers increase in abundance but maintain fecundity in response to an outbreak of mountain pine bark beetles. For. Ecol. Manag. 2011, 261, 203–210. [Google Scholar] [CrossRef]
- Nappi, A.; Drapeau, P.; Saint-Germain, M.; Angers, V.A. Effect of fire severity on long-term occupancy of burned boreal conifer forests by saproxylic insects and wood-foraging birds. Int. J. Wildland Fire 2010, 19, 500–511. [Google Scholar] [CrossRef]
- Tremblay, J.A.; Ibarzabal, J.; Savard, J.-P.L. Foraging ecology of black-backed woodpeckers (Picoides arcticus) in unburned eastern boreal forest stands. Can. J. For. Res. 2010, 40, 991–999. [Google Scholar] [CrossRef]
- Nappi, A.; Drapeau, P.; Leduc, A. How important is dead wood for woodpeckers foraging in eastern North American boreal forests? For. Ecol. Manag. 2015, 346, 10–21. [Google Scholar] [CrossRef]
- Cadieux, P.; Drapeau, P. Are old boreal forests a safe bet for the conservation of the avifauna associated with decayed wood in eastern Canada? For. Ecol. Manag. 2017, 385, 127–139. [Google Scholar] [CrossRef]
- Ouellet-Lapointe, U.; Drapeau, P.; Cadieux, P.; Imbeau, L. Woodpecker excavations suitability for and occupancy by cavity users in the boreal mixedwood forest of eastern Canada. Ecoscience 2015, 19, 391–397. [Google Scholar] [CrossRef]
- Aitken, K.E.H.; Martin, K. The importance of excavators in hole-nesting communities: Availability and use of natural tree holes in old mixed forests of western Canada. J. Ornithol. 2007, 148, 425–434. [Google Scholar] [CrossRef]
- Martin, K.; Aitken, K.E.H.; Wiebe, K.L. Nest sites and nest webs for cavity-nesting communities in interior British Columbia, Canada: Nest characteristics and niche partitioning. Condor 2004, 106, 5–19. [Google Scholar] [CrossRef]
- Santaniello, F.; Djupstrom, L.B.; Ranius, T.; Weslien, J.; Rudolphi, J.; Sonesson, J. Simulated long-term effects of varying tree retention on wood production, dead wood and carbon stock changes. J. Environ. Manag. 2017, 201, 37–44. [Google Scholar] [CrossRef]
- Remm, J.; Lõhmus, A.; Remm, K. Tree cavities in riverine forests: What determines their occurrence and use by hole-nesting passerines? For. Ecol. Manag. 2006, 221, 267–277. [Google Scholar] [CrossRef]
- Vaillancourt, M.-A. Effets des régimes de perturbation par le chablis sur la biodiversité et les implications pour la récupération: Revue de littérature. In Direction du Développement Socio-Économique des Partenariats et de L’éducation; Ministère des Ressources Naturelles et de la Faune: Québec, QC, Canada, 2008. [Google Scholar]
- Moussaoui, L.; Fenton, N.J.; Leduc, A.; Bergeron, Y. Can retention harvest maintain natural structural complexity? A comparison of post-harvest and post-fire residual patches in boreal forest. Forests 2016, 7, 243. [Google Scholar] [CrossRef] [Green Version]
- Hane, M.E.; Kroll, A.J.; Johnson, J.R.; Rochelle, M.; Arnett, E.B. Experimental effects of structural enrichment on avian nest survival. For. Ecol. Manag. 2012, 282, 167–174. [Google Scholar] [CrossRef]
- Seibold, S.; Bässler, C.; Brandl, R.; Gossner, M.M.; Thorn, S.; Ulyshen, M.D.; Müller, J. Experimental studies of dead-wood biodiversity—A review identifying global gaps in knowledge. Biol. Conserv. 2015, 191, 139–149. [Google Scholar] [CrossRef]
- Thibault, M.; Moreau, G. Enhancing bark- and wood-boring beetle colonization and survival in vertical deadwood during thinning entries. J. Insect Conserv. 2016, 20, 789–796. [Google Scholar] [CrossRef]
- Ranius, T.; Caruso, A.; Jonsell, M.; Juutinen, A.; Thor, G.; Rudolphi, J. Dead wood creation to compensate for habitat loss from intensive forestry. Biol. Conserv. 2014, 169, 277–284. [Google Scholar] [CrossRef] [Green Version]
- Barry, A.M.; Hagar, J.C.; Rivers, J.W. Long-term dynamics and characteristics of snags created for wildlife habitat. For. Ecol. Manag. 2017, 403, 145–151. [Google Scholar] [CrossRef]
- Aitken, K.E.H.; Martin, K. Experimental test of nest-site limitation in mature mixed forests of central British Columbia, Canada. J. Wildlife Manag. 2012, 76, 557–565. [Google Scholar] [CrossRef]
- Newton, I. The role of nest sites in limiting the numbers of hole-nesting birds: A review. Biol. Conserv. 1994, 70, 265–276. [Google Scholar] [CrossRef]
- Saint-Germain, M.; Buddle, C.M.; Drapeau, P. Sampling saproxylic coleoptera: Scale issues and the importance of behavior. Environ. Entomol. 2006, 35, 478–487. [Google Scholar] [CrossRef]
- Kroll, A.J.; Duke, S.D.; Hane, M.E.; Johnson, J.R.; Rochelle, M.; Betts, M.G.; Arnett, E.B. Landscape composition influences avian colonization of experimentally created snags. Biol. Conserv. 2012, 152, 145–151. [Google Scholar] [CrossRef]
- Saucier, J.P.; Grondin, P.; Robitaille, A.; Gosselin, J.; Morneau, C.; Richard, J.H.; Brisson, J.; Sirois, L.; Leduc, A.; Morin, H.; et al. Écologie forestière. In Manuel de Foresterie; Éditions Multi-Mondes: Montréal, QC, Canada, 2009; pp. 133–279. [Google Scholar]
- Tremblay, J.A.; Savard, J.-P.L.; Ibarzabal, J. Structural retention requirements for a key ecosystem engineer in conifer-dominated stands of a boreal managed landscape in eastern Canada. For. Ecol. Manag. 2015, 357, 220–227. [Google Scholar] [CrossRef]
- Kaila, L. A new method for collecting quantitative samples of insects associated with decaying wood or wood fungi. Entomol. Fenn. 1993, 4, 21–23. [Google Scholar] [CrossRef]
- John, F.; Sanford, W. An R Companion to Applied Regression; SAGE Inc.: Thousand Oaks, CA, USA, 2011. [Google Scholar]
- Bates, D.; Maechler, M.; Bolker, B.; Walker, S. Fitting Linear Mixed-Effects Models Using lme4. J. Stat. Softw. 2015, 67, 1–48. [Google Scholar] [CrossRef]
- Lenth, R.V. Least-Squares Means: The R Package lsmeans. J. Stat. Softw. 2016, 69, 1–33. [Google Scholar] [CrossRef] [Green Version]
- Lindelöw, Å.; Risberg, B.; Sjödin, K. Attraction during flight of scolytids and other bark-and wood-dwelling beetles to volatiles from fresh and stored spruce wood. Can. J. For. Res. 1992, 22, 224–228. [Google Scholar] [CrossRef]
- Park, J.; Reid, M.L. Distribution of a bark beetle, Trypodendron lineatum, in a harvested landscape. For. Ecol. Manag. 2007, 242, 236–242. [Google Scholar] [CrossRef]
- Vergara, P.M.; Soto, G.E.; Moreira-Arce, D.; Rodewald, A.D.; Meneses, L.O.; Pérez-Hernández, C.G. Foraging behaviour in magellanic woodpeckers is consistent with a multi-scale assessment of tree quality. PLoS ONE 2016, 11, e0159096. [Google Scholar] [CrossRef]
- Craig, C.; Mazerolle, M.J.; Taylor, P.D.; Tremblay, J.A.; Villard, M.-A. Predictors of habitat use and nesting success for two sympatric species of boreal woodpeckers in an unburned, managed forest landscape. For. Ecol. Manag. 2019, 438, 134–141. [Google Scholar] [CrossRef]
- Gagné, C.; Imbeau, L.; Drapeau, P. Anthropogenic edges: Their influence on the American three-toed woodpecker (Picoides dorsalis) foraging behaviour in managed boreal forests of Quebec. For. Ecol. Manag. 2007, 252, 191–200. [Google Scholar] [CrossRef]
- Imbeau, L.; Desrochers, A. Foraging ecology and use of drumming trees by three-toed woodpeckers. J. Wildlife Manag. 2002, 66, 222–231. [Google Scholar] [CrossRef]
- Azeria, E.T.; Ibarzabal, J.; Hebert, C. Effects of habitat characteristics and interspecific interactions on co-occurrence patterns of saproxylic beetles breeding in tree boles after forest fire: Null model analyses. Oecologia 2012, 168, 1123–1135. [Google Scholar] [CrossRef]
- Saint-Germain, M.; Drapeau, P.; Hébert, C. Xylophagous insect species composition and patterns of substratum use on fire-killed black spruce in central Quebec. Can. J. For. Res. 2004, 34, 677–685. [Google Scholar] [CrossRef]
- Franceschi, V.R.; Krokene, P.; Christiansen, E.; Krekling, T. Anatomical and chemical defenses of conifer bark against bark beetles and other pests. New Phytol. 2005, 167, 353–375. [Google Scholar] [CrossRef] [PubMed]
- Béland, J.M.; Bauce, É.; Cloutier, C.; Berthiaume, R.; Hébert, C. Early responses of bark and wood boring beetles to an outbreak of the hemlock looper Lambdina fiscellaria (Guenée) (Lepidoptera: Geometridae) in a boreal balsam fir forest of North America. Agric. For. Entomol. 2019, 21, 407–416. [Google Scholar] [CrossRef]
- Boucher, J.; Azeria, E.T.; Ibarzabal, J.; Hébert, C. Saproxylic beetles in disturbed boreal forests: Temporal dynamics, habitat associations, and community structure. Ecoscience 2012, 19, 328–343. [Google Scholar] [CrossRef]
- Bauer, J.; Vité, J.P. Host selection by Trypodendron lineatum. Die Naturwissenschaften 1975, 62, 539. [Google Scholar] [CrossRef]
- McIntosh, R.L.; McLean, J.A. Developmental threshold for the striped ambrosia beetle Trypodendron lineatum: A first estimate. J. Enthomol. Soc. Brit. Columbia 1997, 94, 19–26. [Google Scholar]
- Dyer, E.D.A.; Chapman, J.A. Flight and attack of the ambrosia beetle, Trypodendron lineatum (Oliv.) in relation to felling date of logs. Can. Entomol. 1965, 97, 42–57. [Google Scholar] [CrossRef]
- Francezon, N.; Stevanovic, T. Chemical Composition of Essential Oil and Hydrosol from Picea mariana Bark Residue. BioRessources 2017, 12, 2635–2645. [Google Scholar] [CrossRef] [Green Version]
- Nijholt, W.W. The striped ambrosia beetle. In Forest Service; Natural Ressources Canada: Victoria, BC, Canada, 1979; p. 35. [Google Scholar]
- Tremblay, J.A.; Dixon, R.D.; Saab, V.A.; Pyle, P.; Patten, M.A. Black-backed Woodpecker (Picoides arcticus), version 3.0. In The Birds of North America; Cornell Lab of Ornithology: Ithaca, NY, USA, 2016. [Google Scholar]
- Tremblay, J.A.; L., L.J.D.; Imbeau, L. American Three-toed Woodpecker (Picoides dorsalis), version 2.0. In The Birds of North America; Cornell Lab of Ornithology: Ithaca, NY, USA, 2018. [Google Scholar]
- Vergara, P.M.; Saura, S.; Pérez-Hernández, C.G.; Soto, G.E. Hierarchical spatial decisions in fragmented landscapes: Modeling the foraging movements of woodpeckers. Ecol. Model. 2015, 300, 114–122. [Google Scholar] [CrossRef]
- Dyer, E. Attack and Brood Production of Ambrosia Beetles in Logging Debris. Can. Entomol. 1963, 95, 624–631. [Google Scholar] [CrossRef]
- Tremblay, J.A.; Fontaine, G.L.; Ibarzabal, J.; Savard, J.-P.L.; Béland, J.-M.; Hébert, C. Diet composition of two Boreal Woodpeckers (Picoides arcticus and P. dorsalis) in eastern Canada. (unpublished; manuscript in preparation).
- Rota, C.T.; Rumble, M.A.; Lehman, C.P.; Kesler, D.C.; Millspaugh, J.J. Apparent foraging success reflects habitat quality in an irruptive species, the Black-backed Woodpecker. Condor Ornithol. Appl. 2015, 117, 178–191. [Google Scholar] [CrossRef]
- Cockle, K.L.; Martin, K.; Drever, M.C. Supply of tree-holes limits nest density of cavity-nesting birds in primary and logged subtropical Atlantic forest. Biol. Conserv. 2010, 143, 2851–2857. [Google Scholar] [CrossRef]
- Miller, K.E. Nest-site limitation of secondary cavity-nesting birds in even-age southern pine forests. Wilson J. Ornithol. 2010, 122, 126–134. [Google Scholar] [CrossRef]
- Robles, H.; Ciudad, C.; Matthysen, E. Responses to experimental reduction and increase of cavities by a secondary cavity-nesting bird community in cavity-rich Pyrenean oak forests. For. Ecol. Manag. 2012, 277, 46–53. [Google Scholar] [CrossRef]
- Brawn, J.D.; Balda, R.P. Population biology of cavity nesters in northern Arizona: Do nest sites limit breeding densities? Condor 1988, 90, 61–71. [Google Scholar] [CrossRef]
- Cuatianquiz Lima, C.; Macias Garcia, C. Pre- and post-experimental manipulation assessments confirm the increase in number of birds due to the addition of nest boxes. PeerJ 2016, 4, e1806. [Google Scholar] [CrossRef] [Green Version]
- Stanback, M.T.; Rockwell, E.K. Nest-Site Fidelity in Eastern Bluebirds (Sialia Sialis) Depends on the Quality of Alternate Cavities. Auk 2003, 120, 1029–1032. [Google Scholar] [CrossRef]
- Steenhof, K.; Peterson, B.E. Site fidelity, mate fidelity, and breeding dispersal in American kestrels. Wilson J. Ornithol. 2009, 121, 12–21. [Google Scholar] [CrossRef]
- Priol, P.; Mazerolle, M.J.; Imbeau, L.; Drapeau, P.; Trudeau, C.; Ramiere, J. Using dynamic N-mixture models to test cavity limitation on northern flying squirrel demographic parameters using experimental nest box supplementation. Ecol. Evol. 2014, 4, 2165–2177. [Google Scholar] [CrossRef]
- Trudeau, C.; Imbeau, L.; Drapeau, P.; Mazerolle, M.J. Winter site occupancy patterns of the northern flying squirrel in boreal mixed-wood forests. Mamm. Biol. Z. Säugetierkd. 2012, 77, 258–263. [Google Scholar] [CrossRef]
- Benhamou, S. Space use and foraging movements in the American red squirrel (Tamiasciurus hudsonicus). Behav. Process. 1996, 37, 89–102. [Google Scholar] [CrossRef]
- Ransome, D.B.; Sullivan, T.P. Effects of food and den-site supplementation on populations of Glaucomys sabrinus and Tamiasciurus douglasii. J. Mammal. 2004, 85, 206–215. [Google Scholar] [CrossRef] [Green Version]
- Jetté, J.-P.; Leblanc, M.; Bouchard, M.; Déry, S.; Villeneuve, N. Intégration des enjeux écologiques dans les plans d’aménagement forestier intégré. Partie I—Analyse des enjeux, version 1.1. In Direction de L’aménagement et de L’environnement Forestiers; Ministère des Ressources Naturelles et de la Faune: Québec, QC, Canada, 2012; p. 159. [Google Scholar]
- Versluijs, M.; Roberge, J.-M.; Eggers, S.; Boer, J.; Hjältén, J. Ecological restoration for biodiversity conservation improves habitat quality for an insectivorous passerine in boreal forest. Biol. Conserv. 2019, 237, 90–96. [Google Scholar] [CrossRef]


| Code | Habitat Variable |
|---|---|
| Landscape scale | |
| RC | Recent cuts (% of the buffer zone) |
| ≤10-year-old interventions (excludes thinning) | |
| MP | Major natural perturbations (% of the buffer zone) |
| Severe insect outbreak, burn, windthrow, or deterioration (≤40 years); affects ≥75% of the basal area of the stand | |
| PP | Partial natural perturbations (% of the buffer zone) |
| Partial insect outbreak, burn, windthrow, or deterioration (≤40 years); affects between 25% and 75% of the basal area of the stand | |
| OF | Mature/old-growth stands (% of the buffer zone) |
| ≥90-year-old even-aged or uneven-aged stands | |
| ALL | RC + MP + PP + OF |
| Site scale | |
| DBH.mean | Mean DBH of trees within a site |
| Tree scale | |
| DBH.Grd | DBH of a girdled tree |
| MS.Grd | Mortality stage of a girdled tree |
| Insect (Sub)Families | ||||
|---|---|---|---|---|
| df | Wald Chi-Square | p-Value | ||
| Curculionidae | Treatment | 2 | 8.08 | 0.018 |
| Year | 1 | 39.73 | <0.001 | |
| Treatment: Year | 2 | 7.19 | 0.027 | |
| Cerambycidae | Treatment | 2 | 20.86 | <0.001 |
| Year | 1 | 18.33 | <0.001 | |
| Treatment: Year | 2 | 1.89 | 0.387 | |
| Clearidae | Treatment | 2 | 13.48 | 0.001 |
| Year | 1 | 15.99 | <0.001 | |
| Treatment: Year | 2 | 4.99 | 0.083 | |
| Scolytinae | Treatment | 2 | 14.91 | <0.001 |
| Year | 1 | 48.23 | <0.001 | |
| Treatment: Year | 2 | 3.61 | 0.165 | |
© 2020 by the authors. Licensee MDPI, Basel, Switzerland. This article is an open access article distributed under the terms and conditions of the Creative Commons Attribution (CC BY) license (http://creativecommons.org/licenses/by/4.0/).
Share and Cite
Dufour-Pelletier, S.; A. Tremblay, J.; Hébert, C.; Lachat, T.; Ibarzabal, J. Testing the Effect of Snag and Cavity Supply on Deadwood-Associated Species in a Managed Boreal Forest. Forests 2020, 11, 424. https://0-doi-org.brum.beds.ac.uk/10.3390/f11040424
Dufour-Pelletier S, A. Tremblay J, Hébert C, Lachat T, Ibarzabal J. Testing the Effect of Snag and Cavity Supply on Deadwood-Associated Species in a Managed Boreal Forest. Forests. 2020; 11(4):424. https://0-doi-org.brum.beds.ac.uk/10.3390/f11040424
Chicago/Turabian StyleDufour-Pelletier, Samuel, Junior A. Tremblay, Christian Hébert, Thibault Lachat, and Jacques Ibarzabal. 2020. "Testing the Effect of Snag and Cavity Supply on Deadwood-Associated Species in a Managed Boreal Forest" Forests 11, no. 4: 424. https://0-doi-org.brum.beds.ac.uk/10.3390/f11040424