Impact of Invasive Tree Species on Natural Regeneration Species Composition, Diversity, and Density


1
Institute of Dendrology, Polish Academy of Sciences, Parkowa 5, 62-035 Kórnik, Poland
2
Department of Forest Protection, Faculty of Forestry, Poznań University of Life Sciences, Wojska Polskiego 71c, 60-625 Poznań, Poland
*
Author to whom correspondence should be addressed.
Forests 2020, 11(4), 456; https://0-doi-org.brum.beds.ac.uk/10.3390/f11040456
Submission received: 25 February 2020
/
Revised: 30 March 2020
/
Accepted: 14 April 2020
/
Published: 17 April 2020
(This article belongs to the Special Issue The Effects of Species Invasions and Dispersal on Forest Communities)
Abstract
:Invasive tree species decrease ecosystem resilience with negative impacts on natural regeneration. The influence of alien tree species on ecosystems is unevenly recognized and does not always account for different habitat specificity. We assessed the impacts of the three most frequent invasive tree species in European forests: Prunus serotina Ehrh., Quercus rubra L., and Robinia pseudoacacia L. on natural regeneration diversity, species composition, and density. We hypothesized that invaded forest types, in comparison with non-invaded, will differ in terms of species composition, will have lower taxonomic, functional, and phylogenetic diversity of natural regeneration, and will have lower densities of native tree species. We used a set of 189 study plots (200 m2) in a systematic design, established in various forest types in Wielkopolski National Park (West Poland). We analyzed impacts of forest type, accounting for soil C:N ratio, soil pH, and light availability on natural regeneration (woody species up to 0.5 m height) species composition, diversity, and density. We found an overlap of species composition among invaded and non-invaded forests and low impacts of invasive species on taxonomic diversity and functional richness. We found no impacts on phylogenetic diversity and other functional diversity components. In contrast, we found that the natural regeneration of forest-forming tree species reached lower densities in invaded than non-invaded forest types. However, sub-canopy and shrub species reached higher densities in invaded than non-invaded forest types. We confirmed that invasive tree species affect natural regeneration by decreasing the regeneration density of native tree species (in eight of nine tree species studied), species composition homogenization, and supporting natural regeneration of sub-canopy and shrub species. Therefore, the restoration of invaded forests requires eradication of invasive tree species to decrease propagule pressure and to stop decreases in the abundance of native tree species’ natural regeneration.
1. Introduction
Natural regeneration is a crucial process maintaining persistence of forests and emergence of new generations of trees [1,2]. Young trees are especially vulnerable to abiotic conditions [3,4,5], competition with overstory and understory [6,7], pathogens [8,9], and herbivory [10,11]. During spontaneous succession, natural regeneration is necessary for tree species composition changes and forest development [12,13,14]. The role of emerging tree species is crucial in the persistence of old-growth forests [15,16,17], in post-disturbance resilience of ecosystems [18,19,20], or in human-mediated transition of ecosystems [21,22].
Invasive tree species are considered to be one of the most serious threats for native ecosystems [23,24]. Due to species-specific effects on light availability [25,26] and nutrient cycling [27,28], alien tree species significantly alter the functioning of invaded ecosystems [29,30]. As a consequence, alien tree species influence dependent native organisms: soil microbes [31], invertebrates [32,33], fungi [34,35], bryophytes [36,37], and vascular plants [38,39,40].
Alien tree species might influence natural regeneration by directly limiting the growth of native species saplings, as well as by increasing competition in the regeneration layer by self-sowing. Direct limitation might be connected with light interception. Invasive trees shed numerous seeds beneath their canopies, increasing the number of emerging seedlings. This influences competition for light and soil resources [41,42]. Due to vicinity of propagule source, regeneration of invasive trees may reach high biomass and densities [43,44]. Therefore, invasive trees might slow down succession by decreasing recruitment probability of native tree species [45,46,47].
Previous studies of invasive tree species on natural regeneration covered, e.g., subtropical forests in Argentina [48], urban forests in Berlin [14], Mediterranean forests in Chile [49,50], riparian forests in Italy [45], coniferous forests in Poland [47], as well as experimental studies [42,51]. We aimed to assess the impact of the three most frequent invasive tree species in European forests [52,53] on natural regeneration diversity, species composition, and density of woody species. We hypothesized that forest types with significant biomass of invasive species, in comparison with non-invaded forests, accounting for differences in soil fertility and light availability, will: (1) differ in terms of species composition, (2) have lower taxonomic, functional and phylogenetic diversity of natural regeneration, and (3) have lower densities of native tree species.
2. Materials and Methods
2.1. Species Studied
We focused on the three most frequent invasive tree species in European forests: Prunus serotina, Quercus rubra, and Robinia pseudoacacia. All these species were first cultivated as ornamental plants. Then, they were introduced in forest ecosystems, for wood production and soil improvement reasons [54,55,56]. These species are functionally different. Prunus serotina is a species regenerating in gap-phase forest development, with a scattered distribution in the native range. In contrast, in the introduced range, it forms dense shrub layers beneath Pinus sylvestris canopies and is bird-dispersed [54,57,58]. Quercus rubra is a gap-phase species, with moderate shade tolerance and high litter production, with low decomposition rates [31,59]. Acorns of Q. rubra are dispersed by rodents and birds, but most of them fall beneath its canopy [60,61]. Robinia pseudoacacia is a wind-dispersed pioneer species [55]. Due to symbiosis with Frankia spp., R. pseudoacacia fixes atmospheric nitrogen, increasing its availability in soil [62,63]. Among these species, P. serotina natural regeneration is the most light-demanding, while R. pseudoacacia – the least [64]. All of these species pose serious threats to biodiversity [54,55,63,65].
2.2. Study Area
We conducted our study in Wielkopolski National Park (WNP; W Poland; 52°16′ N, 16°48′ E; 7584 ha). WNP serves as a model object for invasive tree species ecology, due to presence of the highest richness of alien woody taxa among all national parks in Poland (158 taxa) [66]. Due to the post-glacial landscape and high geomorphological diversity, WNP is covered by a wide range of forest ecosystem types. Moreover, part of WNP forests were formerly managed as plantations of Pinus sylvestris [67]. WNP climate is temperate, transitional between oceanic and continental, with mean annual temperature of 8.4 °C and mean annual precipitation of 521 mm, for the years 1951–2010 (measurements in Poznań, c. 15 km from WNP).
2.3. Study Design
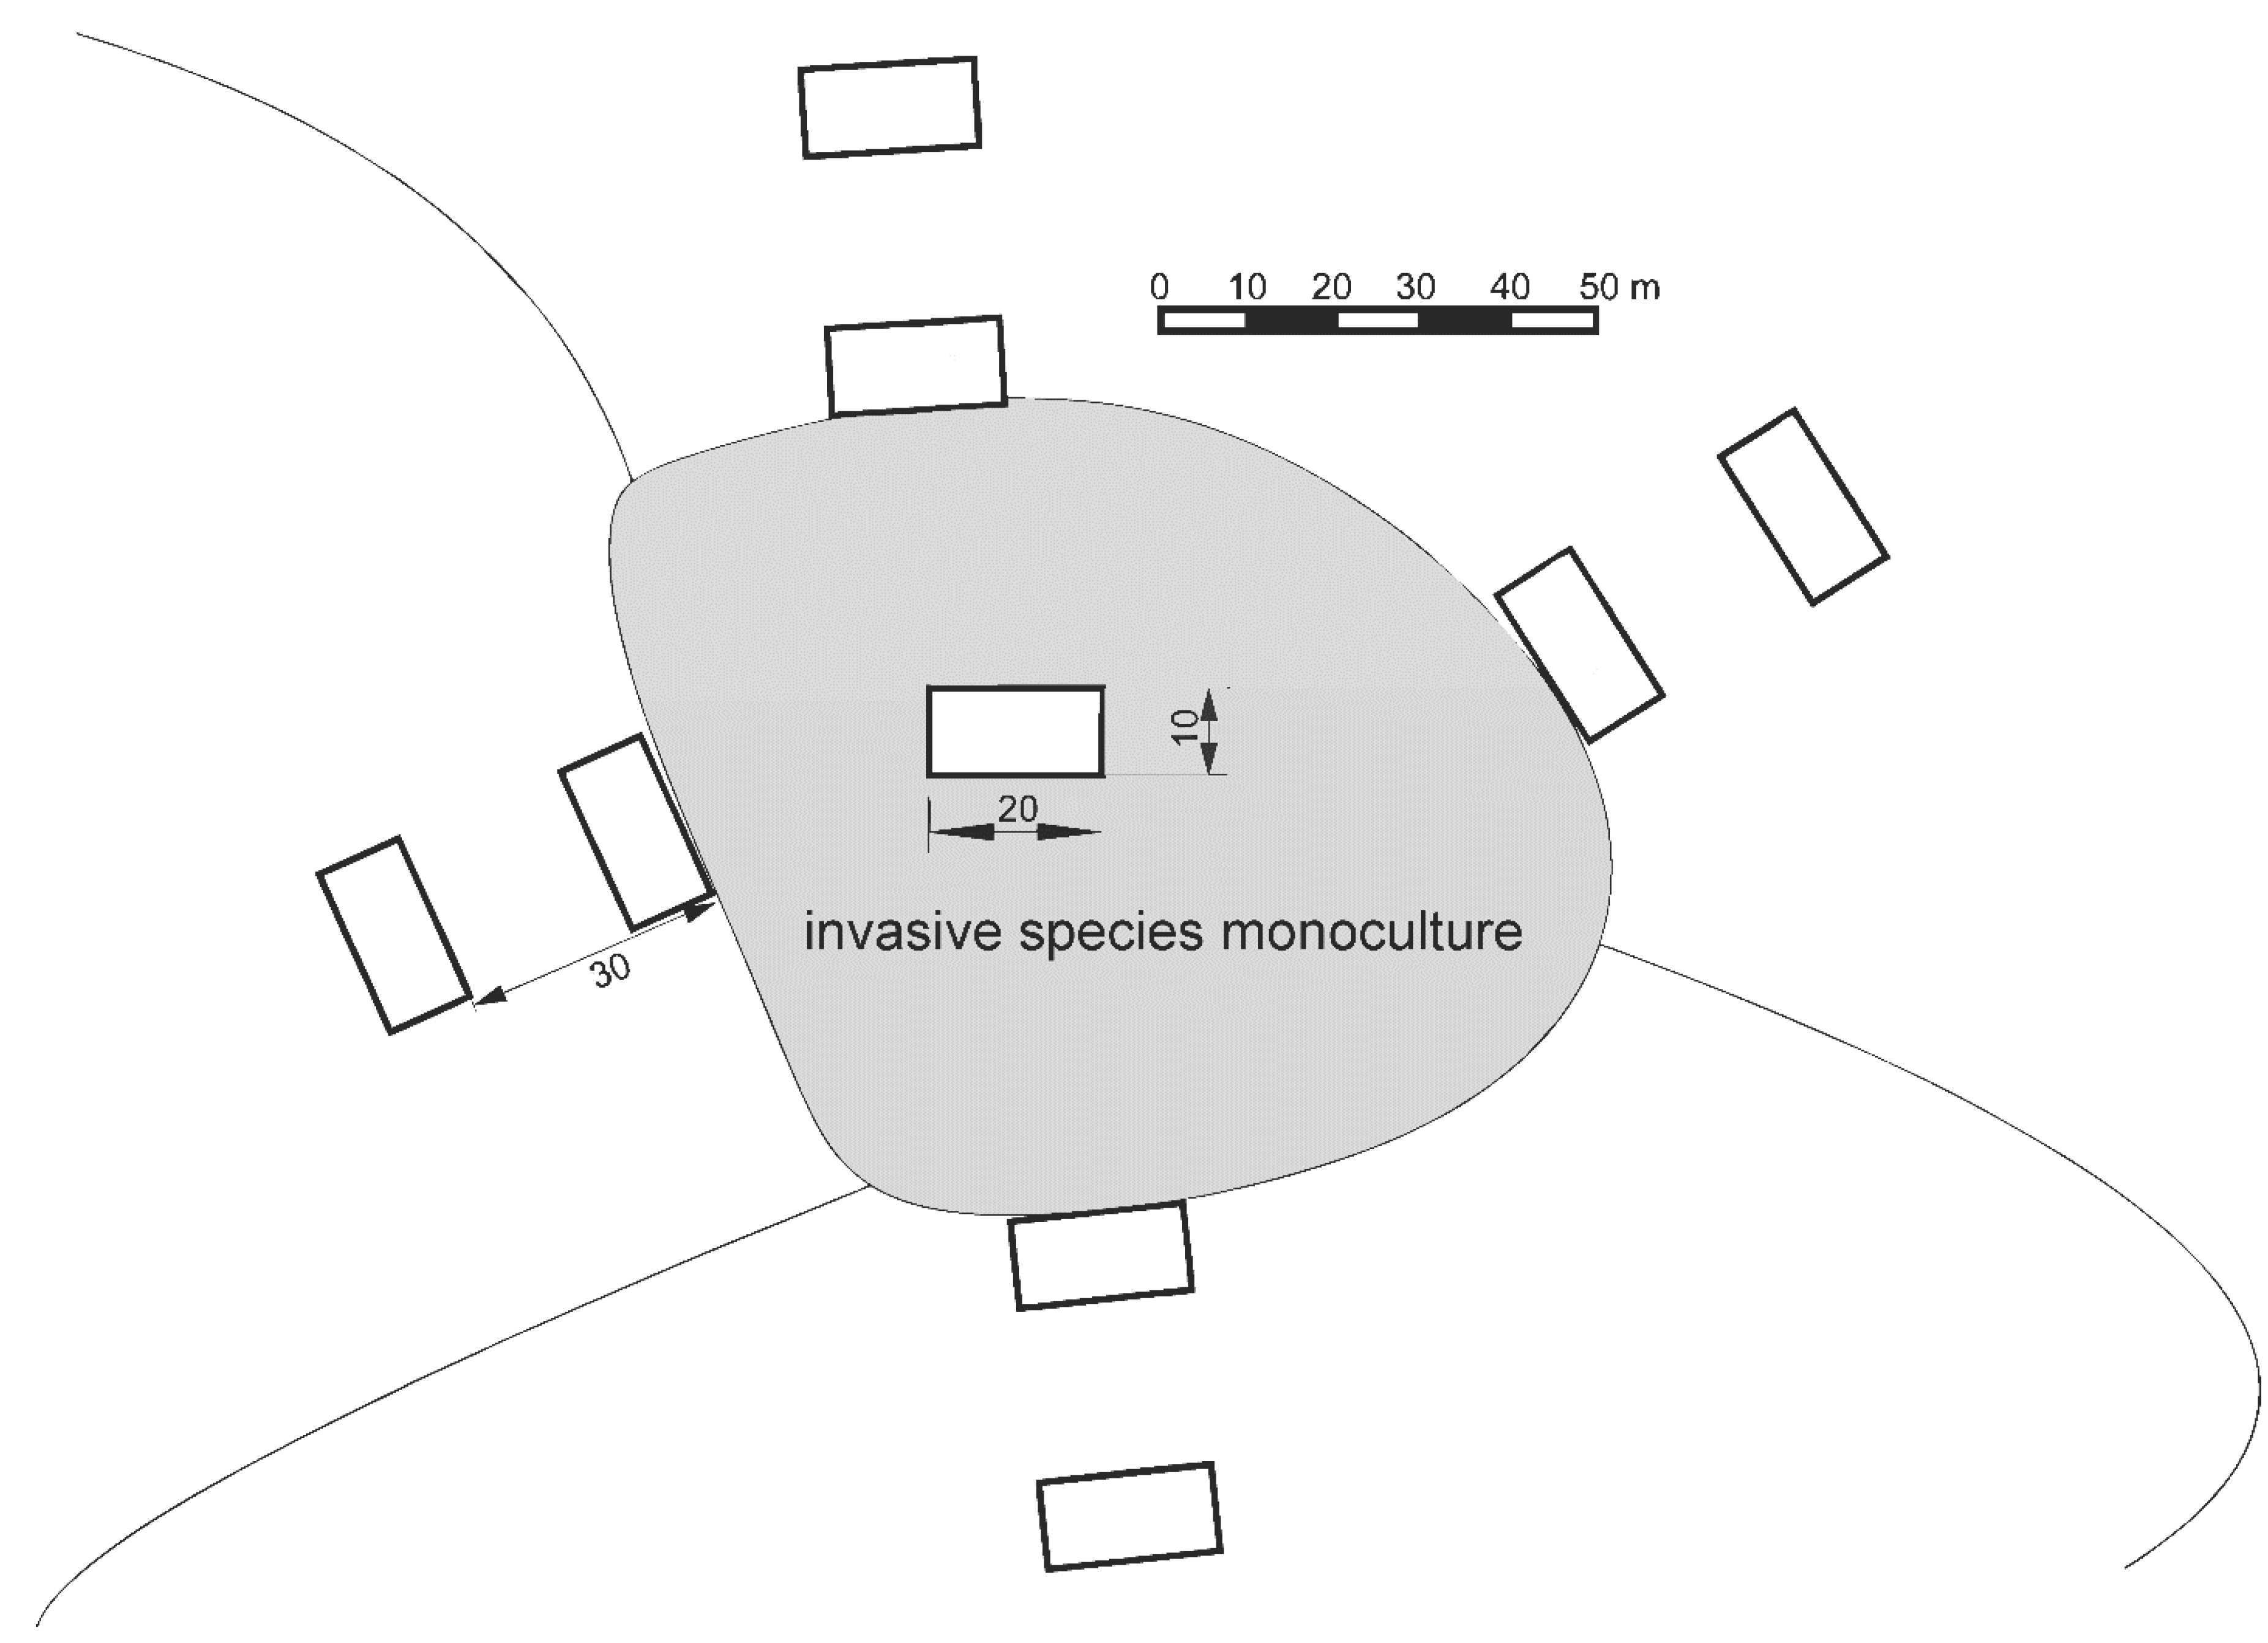
We investigated the effects of invasive tree species within a set of 189 systematically distributed study plots, with nine plots in each of 21 blocks (Figure 1) [68]. The blocks were chosen according to the following criteria: presence of fruiting population of studied invasive tree species, homogeneity of stand and understory species composition, and their being surrounded by other forest types. Prior to the establishment of study plots, we examined WNP forest management plans to locate potential study sites, and made field visits to ensure they met these criteria before investigation. We established blocks in monocultures of invasive species (or in the case of P. serotina in P. sylvestris monocultures dominated by P. serotina). We stablished plots to assess the effects of decreasing propagule pressure on invasive tree species’ natural regeneration [64]. The center of each block was one study plot, in the center of a monoculture of invasive species. We established four additional plots systematically, off of the North, South, East, and West sides of the central plot, nearly outside the alien species monoculture. Then, we established another set of four plots, located 30 m away from each of the four additional plots. We decided to establish study plots using a systematic design to avoid subjectivity. Each study plot was a 200 m2 rectangle, resulting from pooling two 10 × 10 m plots to avoid potential relocation errors and pseudoreplications, as described in our previous study [68]. Due to the systematic design three study plots occurred in non-forest ecosystems, and were excluded from analyses (thus final n = 186; Figure A1 and Figure A2). Although our study plots were arranged in a block design, due to a high level of spatial heterogeneity, they usually represented various soil types and vegetation types. As resource availability gradients were more important drivers of clustering among plots than block design (see details in [64]), we assumed that our study plots are independent observations. This system was developed to assess impacts of distance from seed source on abundance of alien tree species’ natural regeneration. Therefore, edge plots could be affected by the proximity of invasive species-dominated stands. However, due to spatial heterogeneity and high abundance of alien tree species in WPN, both plot groups (near invaded stands and 30 m from invaded stands) can be invaded by other alien tree species (Figure A1 and Figure A2).
We divided study plots into categories representing the main types of forest ecosystems in WNP, based on dominant tree species (i.e., with the highest basal area), soil type, plant association, and invasion level (Table 1). Due to different ecological requirements and management history, we divided Pinus sylvestris forests into two groups: poor and plantation. Poor P. sylvestris forests refer to mesic habitats, mostly growing on brunic arenosols, where this species naturally occurs. In contrast, P. sylvestris plantation refers to forests occupying more fertile soils, usually cambisols and luvisols, which naturally host Quercus-Acer-Tilia forests. We classified forests as invaded by P. serotina when its density in the shrub layer (individuals with height over 1.3 m) exceeded 500 ind. ha-1. We also classified forests as invaded by Q. rubra or R. pseudoacacia when its contribution to basal area exceeded 25% (however, it mostly exceeded 75%). Both Q. rubra and R. pseudoacacia were also intentionally planted in WNP [66,67]. We decided to divide forest types according to dominant species rather than into invaded/non-invaded due to dominant-specific effects, which are not included in measured variables, e.g., soil biota [32], decomposition rate [59] or annual litterfall [69]. The age (of dominant tree species) of the forests studied ranged from 23 to 139 years [70], however only ten plots had tree stands younger than 60 years old.
2.4. Data Collection
We investigated natural regeneration within study plots in July 2015. Within each study plot we counted seedlings (trees germinated in the current year) and saplings (one-year-old and older trees up to 0.5 m height) of each tree and shrub species, including both native and non-native species. Taxonomic nomenclature follows GBIF [71]. In total, we counted 54,593 plants, representing 53 species (Table A1). As it was impossible to assess whether a particular individual originated from seed or clonal growth without excavating the root system, we treated each shoot as an individual. This did not allow us to account for the clonal growth of some species.
We characterized potential predictors influencing seedling survival using light availability, soil pH and soil C:N. We measured light availability in August 2016 using a LAI-2200 plant canopy analyzer (Li-Cor Inc., Lincoln, NE, USA). We measured diffuse non-interceptance (DIFN), the fraction of open canopy above the understory. Within each study plot, we took eight series of ten measurements. We decided to measure DIFN in summer, during the maximum canopy development, to account for maximum light availability limitation. We measured soil pH from six soil subsamples per study plot. Subsamples were collected systematically along plot borders, from 0–10 cm depth. Then, we measured pH of soil solution in distilled water after 24 h using an electronic pH-meter. The same samples were analyzed for total carbon content and total nitrogen content, using the dry combustion method (PN-ISO 10694:2002) and Kjeldahl’s method (PN-EN 16169:2012), respectively, in an accredited laboratory (Jars Sp. z.o.o., Legionowo, Poland). We calculated C:N ratio as a synthetic index of soil fertility. We also used natural regeneration density of the invasive species studied to show their effects on natural regeneration, at the level of competition between saplings.
2.5. Data Analysis
2.5.1. Natural Regeneration Species Composition
All analyses were conducted using R software (The R Foundation for Statistical Computing Platform; Vienna, Austria, version 3.5.3) [72]. We used detrended correspondence analysis (DCA), as a method of indirect ordination, developed for analyzes across long environmental gradients [73]. Due to the long fertility gradient (from nutrient poor to rich soils) in our dataset and higher stability of DCA than multidimensional scaling, we decided to use DCA. We also conducted preliminary multidimensional scaling analysis, which had a poorer fit to the data than DCA. DCA is a modification of correspondence analysis, a common method of multidimensionality reduction in vegetation analyses. In DCA gradients are standardized by standard deviation, to avoid artifacts connected with gradient folding (so-called arch-effects or horseshoe-effects). We performed DCA using the vegan package [74], using study plots as analysis units and all density of all woody species (expressed in ind. 200 m−2) recorded in the plot as variables. To stabilize variance and overcome wide ranges of particular species densities, we log-transformed them prior to analysis. We also checked correlation of vectors representing soil pH, soil C:N ratio, and DIFN with ordination results using permutation tests (n = 999) to check how measured variables were correlated with gradients revealed by DCA.
2.5.2. Natural Regeneration Species Diversity
For each study plot we calculated taxonomic species richness and Shannon’s diversity index, Faith’s phylogenetic diversity (PD), mean nearest taxon distance (MNTD), and mean pairwise distance (MPD), and several indices of functional diversity: functional richness (FRic), divergence (FDiv), dispersion (FDis) and evenness (FEve). All these indices were calculated using both native and non-native species. To compute phylogenetic diversity indices, we extracted the phylogenetic tree covering all taxa noted in study plots from the V.PhyloMaker package [75]. We measured Faith’s PD as a sum of all branch lengths in the plant community, MPD as mean pairwise distance between all taxa in the community and MNTD as mean of minimal distances between all taxa in the community using the PhyloMeasures package [76]. To avoid the influence of species richness on these variables, we standardized them according to the null model, i.e., mean and standard deviation (SD) of phylogenetic diversity metrics for a given species richness. For each set of phylogenetic tree tips, the observed metric has been standardized by subtracting the mean and dividing by SD. Null model mean and SD were calculated among all sets of tips that have the same number of elements as the tips set, with uniform probability among all possible tips samples of a given species richness [76]. To calculate functional diversity, we used a set of traits extracted from LEDA [77], BiolFlor [78], BIEN [79] and global wood density database [80], as well as Ellenberg ecological indicator values [81], as proxies of species requirements. In total we used 12 traits (ecological indicator values for light, temperature, moisture, soil reaction and nitrogen, flowering start and duration, pollination mode, specific leaf area, seed mass, height and wood density), with completeness from 39% (soil nitrogen and reaction indicators) to 100% (pollination mode, flowering, seed mass and height).
We assessed differences in species diversity between stand types using linear models accounting for soil pH, soil C:N ratio, DIFN, natural regeneration density of the invasive species studied, and forest type. We included soil and light variables in models to account for their impacts on natural regeneration. We evaluated influence of forest type using Tukey’s posteriori test, implemented in the multcomp package [82]. For species richness we used generalized linear models (GLM), assuming Poisson distribution of the dependent variable. Although models could reveal differences among forest types with p-values < 0.05, in Tukey’s tests we applied single-step adjustment of p-values, to account for multiple hypothesis testing. Single-step adjustment decreases the probability of committing Type I error (i.e., rejection of the true null hypothesis), and also accounts for correlations among variables tested [82].
2.5.3. Natural Regeneration Density
We assessed impacts of forest type on natural regeneration density of the species studied, using zero-inflated Poisson GLM, implemented in the pcsl package [83]. This is a hurdle model, estimating both probability of occurrence (assuming binomial distribution) and abundance (assuming Poisson distribution). In our case, we assumed that species presence (binomial part of the model) depends on soil C:N ratio, soil pH, natural regeneration density of the invasive species studied and DIFN, while the count part of the model (information about species density)—also depends on forest type. Therefore, we assumed that tree species effect is more important for a particular species abundance than presence, accounting for impact of seed source, which is one of the most important drivers of natural regeneration [7,64]. As zero-inflated Poisson GLM provides estimates for both count and binomial parts of the distribution, standard posteriori tests are not available. Therefore, we used ceteris paribus comparisons, i.e., model predictions assuming all variables at constant (mean) levels with an exception of the considered variable [84,85]. In our case, we compared mean predictions for each forest type, assuming mean values of DIFN, natural regeneration density of the invasive species studied, soil pH and C:N ratio, to assess how forest type influences a particular species density in similar soil and light availability conditions. This analysis allows us to describe the dissimilarity among groups based on likelihood ratio tests [84]. For that reason, sometimes, GLM revealed p-values >0.05, while likelihood ratio tests revealed differences between forest types.
3. Results
3.1. Impact of Alien Tree Species on Natural Regeneration Species Composition
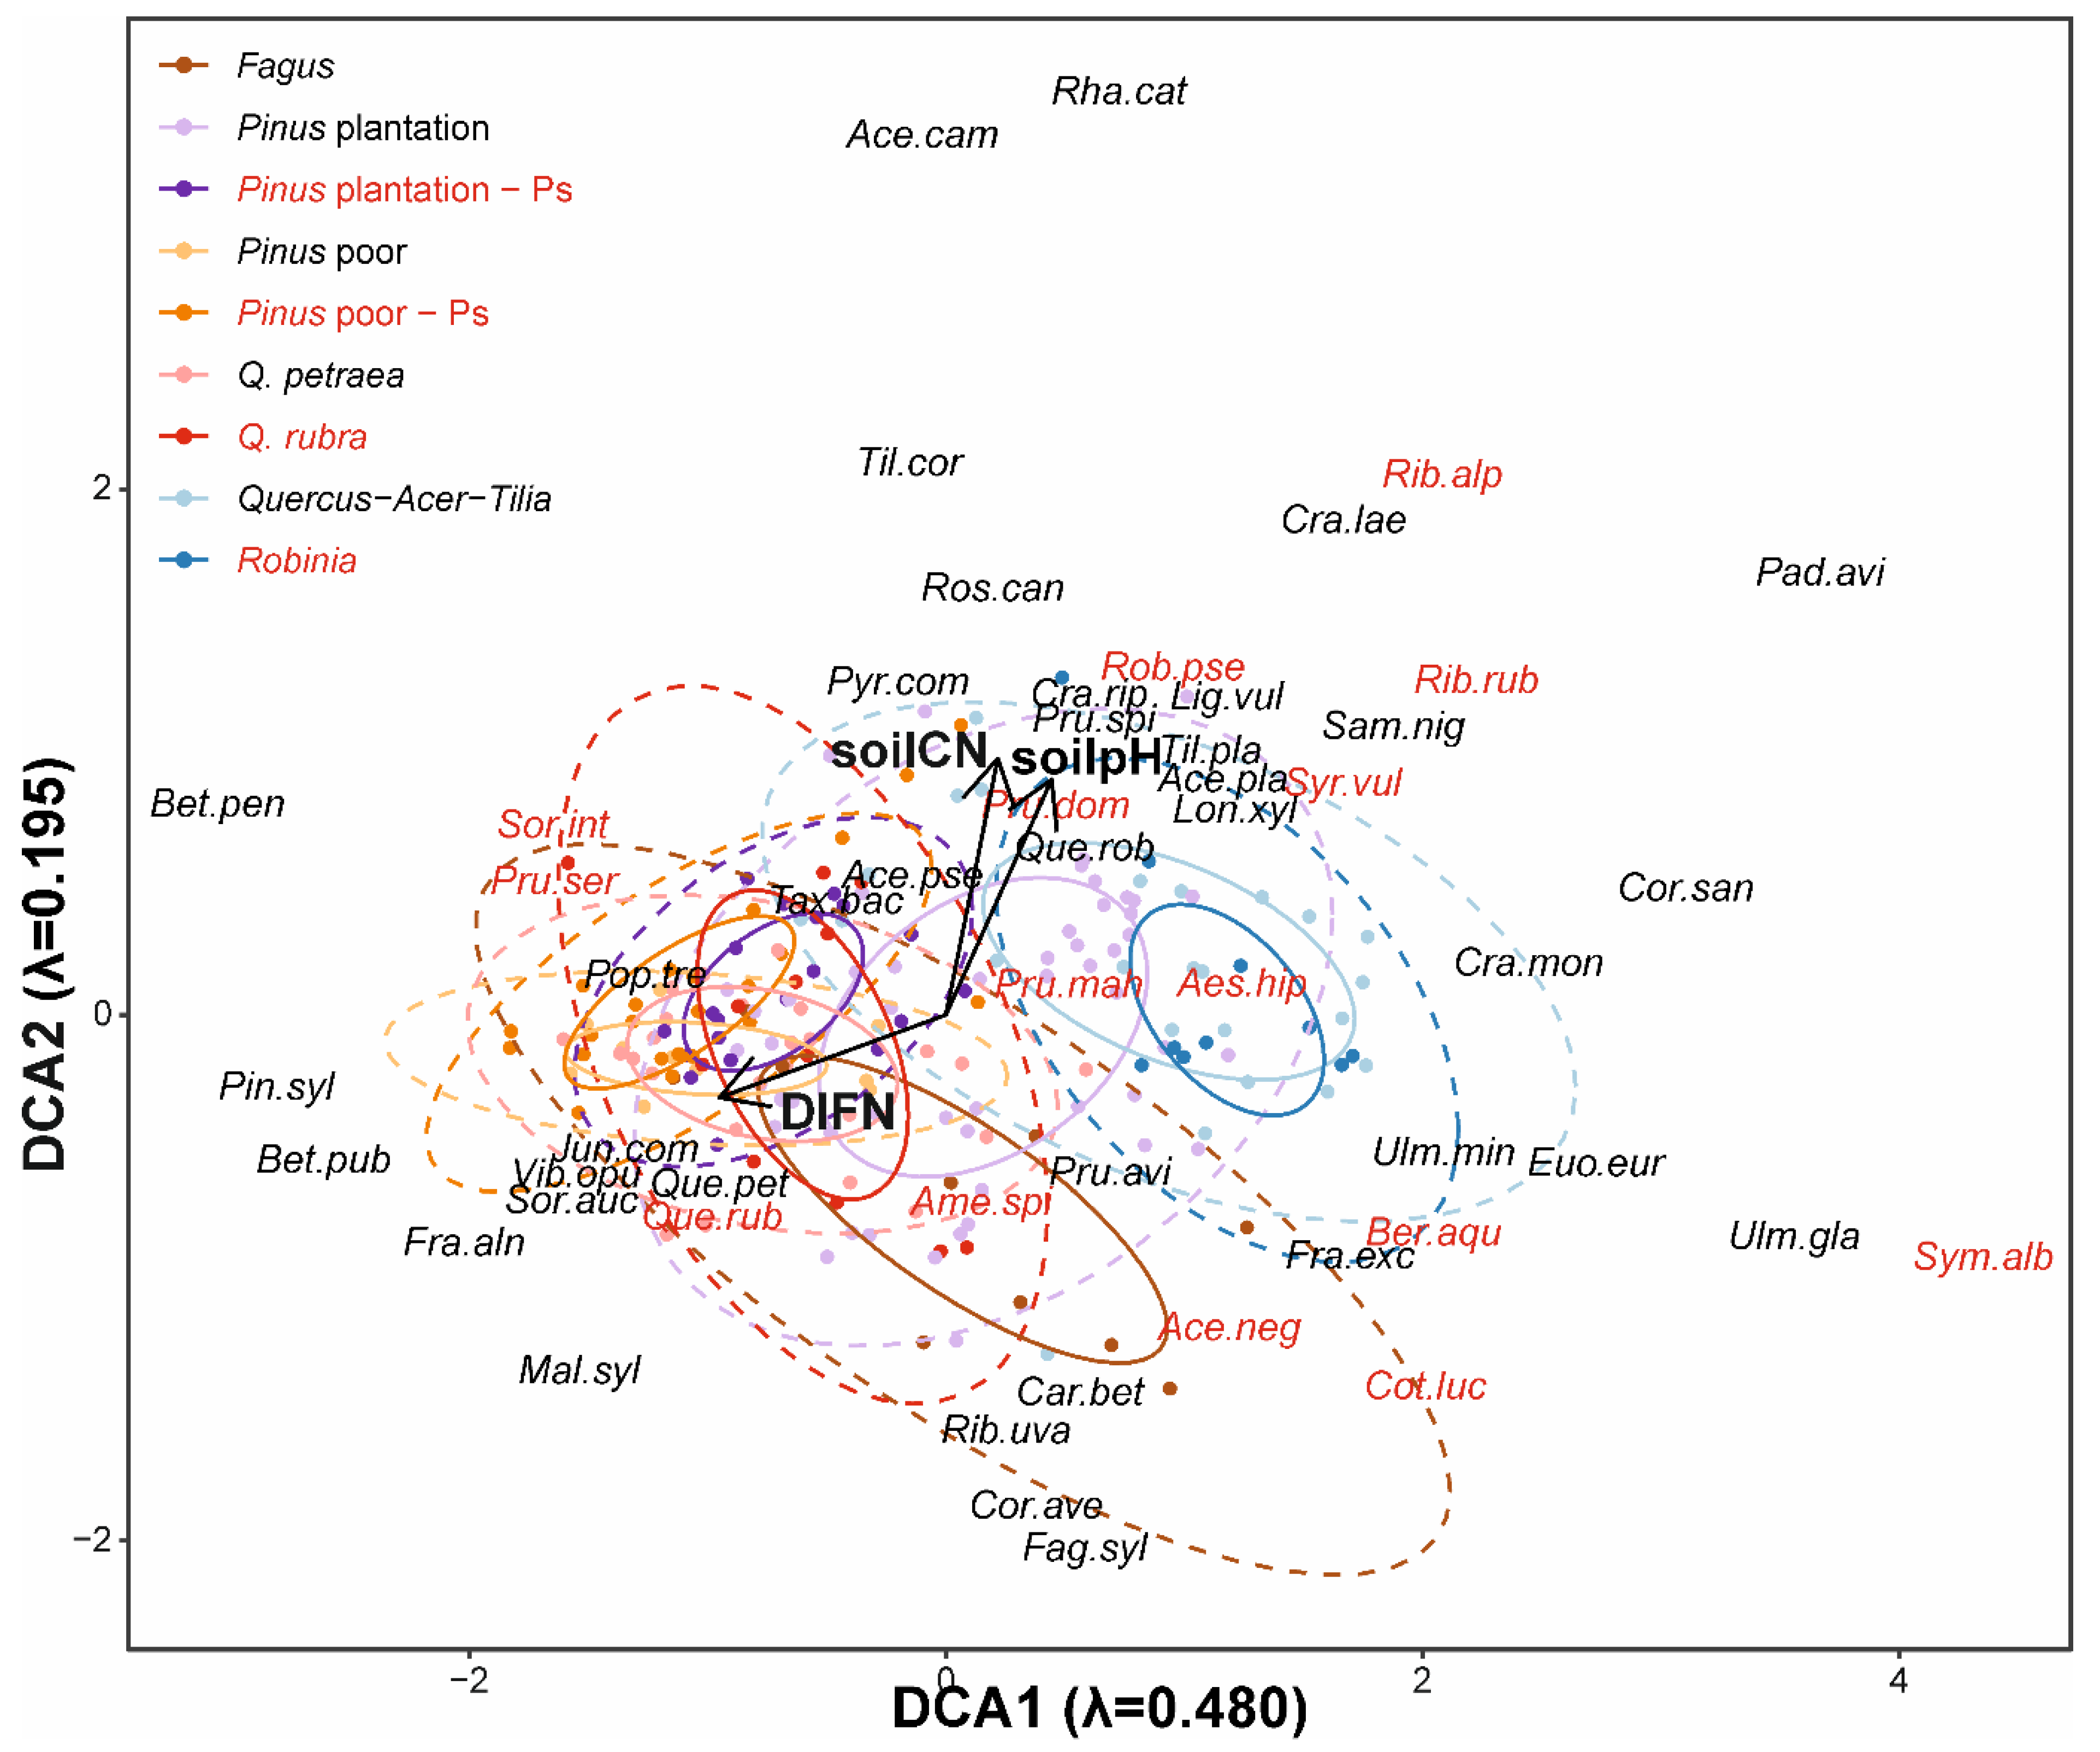
The DCA ordination grouped study plots along two gradients, representing variability of soil pH and light availability (Figure 2). Forest types overlapped each other in the ordination space, revealing continuity of vegetation. Along the DCA1 axis, forests were ordered from sites with high light availability, dominated by P. sylvestris, to the most shaded Quercus-Acer-Tilia and R. pseudoacacia forests. Axis DCA2 revealed shifts along soil reaction and fertility gradients. Composition of natural regeneration in particular forest types differed along the DCA1 axis and division into forest types was correlated with DCA results (r2 = 0.359, p < 0.001). Points representing 50% of the species composition variability of P. sylvestris forests invaded by P. serotina overlapped between areas representing divided types of P. sylvestris forests—poor stands and plantations. Points representing Q. rubra forests partially overlapped the area of Q. petraea forests, which were close to poor P. sylvestris stands. Similarly, the area representing Q. rubra stands only partially overlapped the area of F. sylvatica forests, shifted more into the lower part of ordination space. Forests with R. pseudoacacia mostly overlapped the area represented by Quercus-Acer-Tilia forests, as well as P. sylvestris plantations, which were similar to almost all forest types.
3.2. Impact of Alien Tree Species on Natural Regeneration Diversity
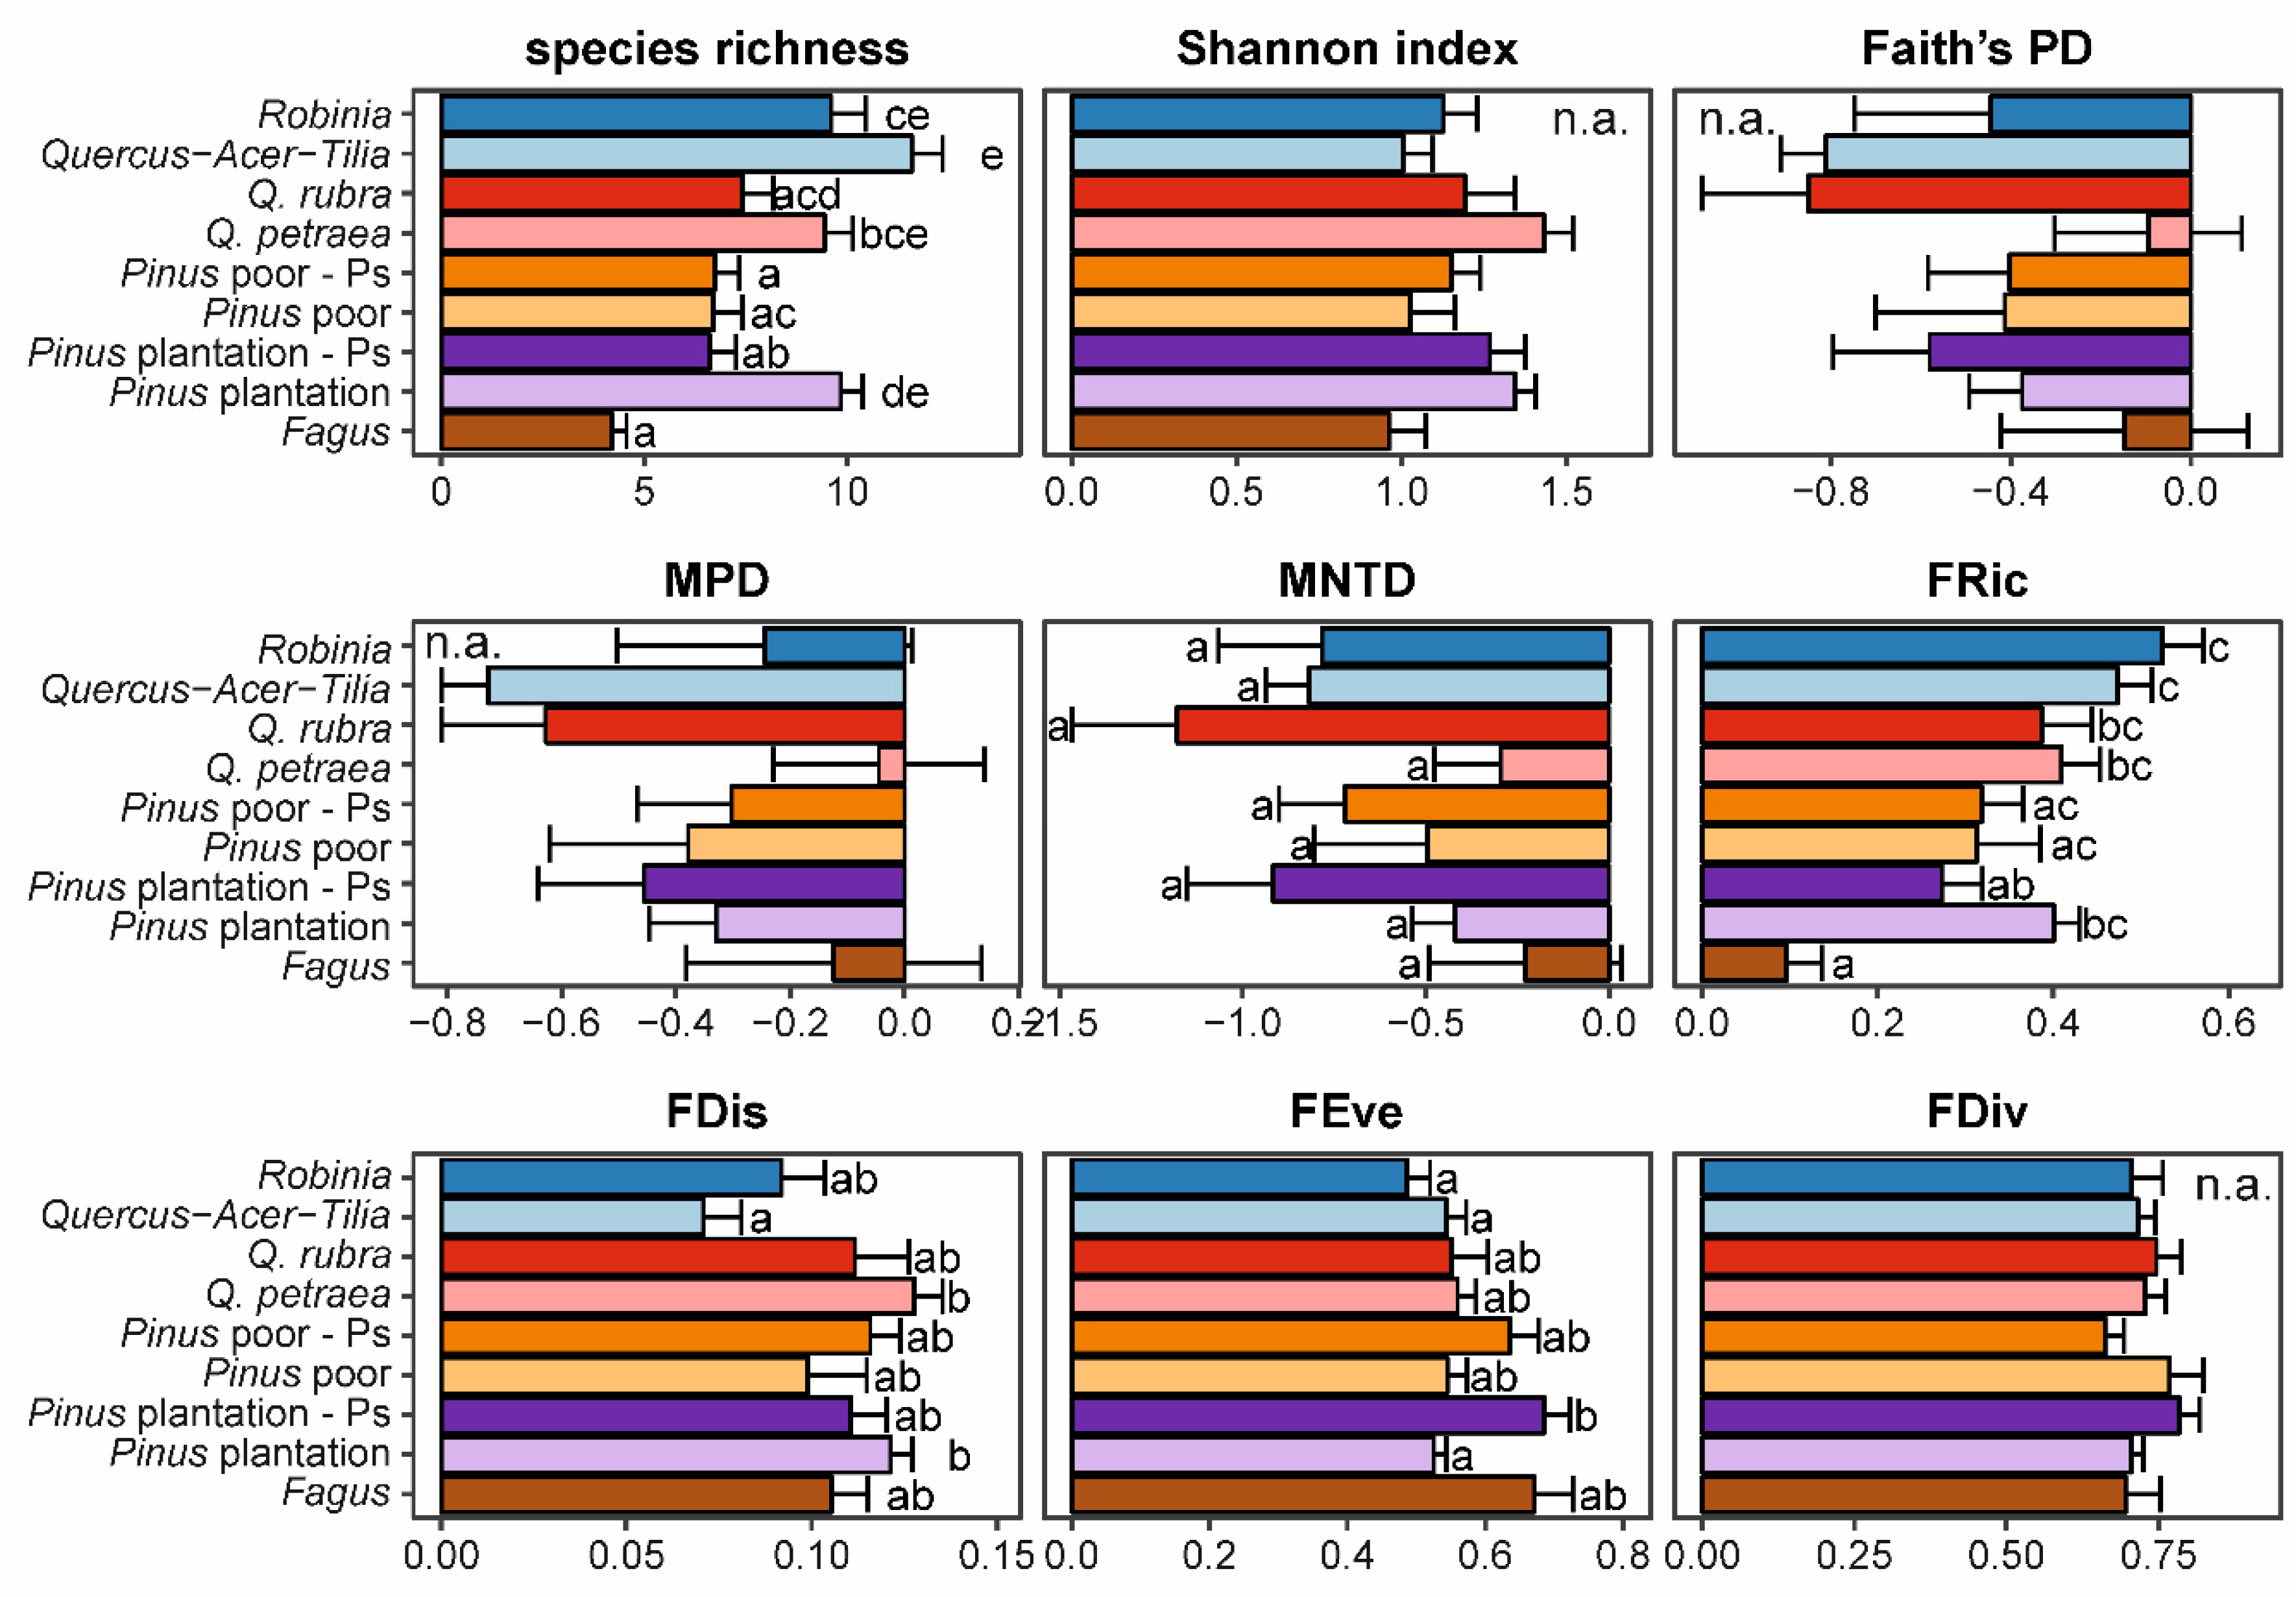
We found that forest type had impacts on species richness, MNTD, FRic, FDis and FEve (Supplementary Table S1, Figure 3). Invaded and non-invaded stands differed most strongly in species richness in P. sylvestris plantations as invaded plots had 6.6 ± 0.7 species while non-invaded plots had 9.8 ± 0.5. Less distinct differences occurred in R. pseudoacacia forests, which had 9.6 ± 0.8 species, while Quercus-Acer-Tilia had 11.6 ± 0.8. However, these forest types did not differ according to the Tukey’s test. Similarly, forests with Q. rubra had 7.4 ± 0.8 species, while Q. petraea had 9.4 ± 0.7 (but not significantly different at p = 0.05). Forests with F. sylvatica had the lowest species richness—4.2 ± 0.4 species. Similar trends (but not included in final models) occurred for the Shannon index. No differences in phylogenetic diversity were revealed by Tukey tests. However, lower values were found in R. pseudoacacia than in Quercus-Acer-Tilia, and higher values in invaded than non-invaded P. sylvestris plantations. For functional diversity we found that only invaded P. sylvestris plantations had lower FRic than other types of forests (with the exception of F. sylvatica forests). For FDis we found the lowest values in Quercus-Acer-Tilia forest, and the highest in non-invaded P. sylvestris plantations. In contrast, we found the highest FEve in the invaded P. sylvestris plantations while the lowest was in R. pseudoacacia forests and non-invaded P. sylvestris plantations. We did not find any impacts of natural regeneration density of the invasive species studied on any biodiversity index included in the study.
3.3. Impacts on Natural Regeneration Densities of the Most Frequent Native Tree Species
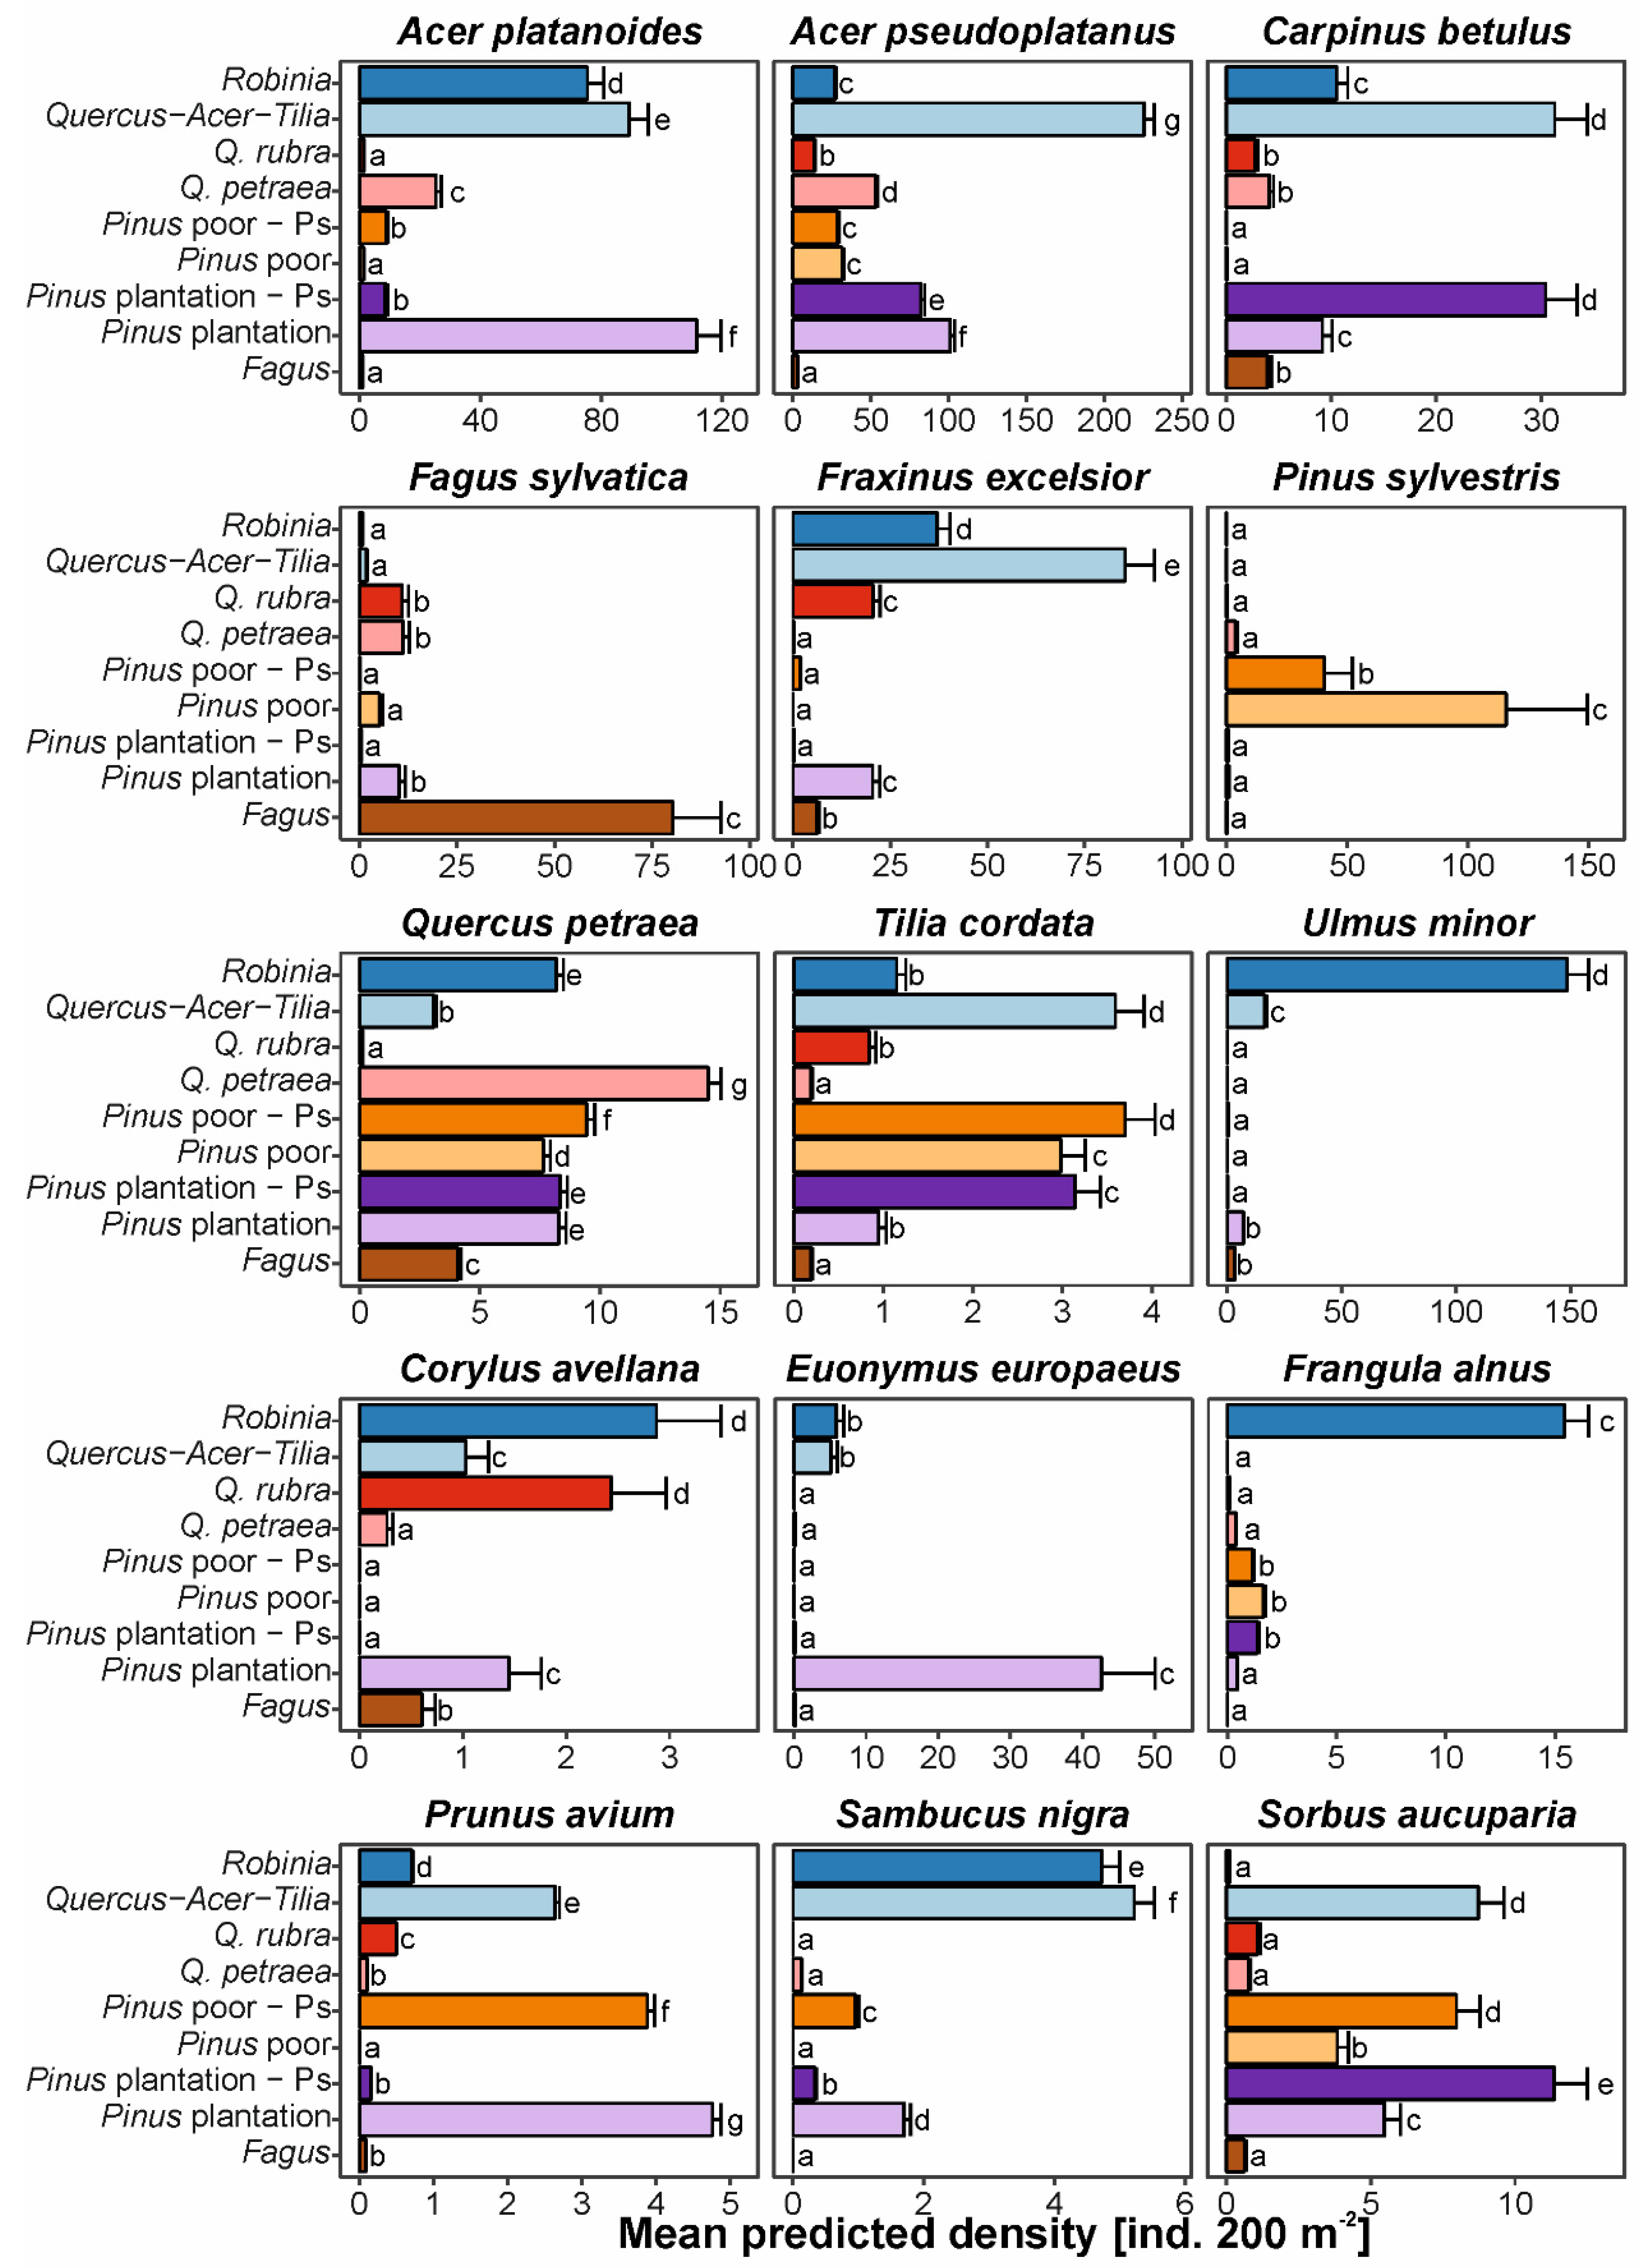
Analyses of regeneration densities for particular tree species revealed that eight of nine dominant or co-dominant tree species reached higher densities in their native optimum forest types than in invaded forests (Figure 4, Supplementary Table S2). The exception was Ulmus minor, which reached the highest densities in R. pseudoacacia forests. However, some species reached similar densities in invaded forest types, not paired with their optimum native types, for example Carpinus betulus had similar densities in invaded P. sylvestris plantations and Tilia cordata in invaded P. sylvestris poor forests. Three of the six shrub species studied reached their highest densities in invaded forests, two (Corylus avellana, Frangula alnus) in R. pseudoacacia forests and one (S. aucuparia) in P. sylvestris plantations invaded by P. serotina. In contrast, Sambucus nigra reached the highest densities in Quercus-Acer-Tilia forest and Prunus avium and Euonymus europaea in P. sylvestris plantations. We found that sapling densities of the invasive species studied negatively influenced the binomial part of density models for three species: A. platanoides, P. sylvestris and S. aucuparia, and negatively influenced the count part of models for A. platanoides and S. nigra. For A. pseudoplatanus, C. betulus, E. europaea, F. sylvatica, F. excelsior, P. sylvestris, Q. petraea, S. aucuparia, and T. cordata, we found positive but low influences of sapling densities of the invasive species studied on natural regeneration density (estimate ± SE varied from 0.0016 ± 0.0008 to 0.0078 ± 0.0004, Supplementary Table S3).
4. Discussion
4.1. Continuity in Species Composition of Natural Regeneration
Our study revealed low differences in species composition between similar types of invaded and non-invaded forests. This might be caused by two issues: vegetation continuity and the spread of invasive tree species. Due to systematic design of our study, we sampled vegetation patches which did not always resemble textbook examples of plant communities [86,87]. Therefore, our study design covered a continuum of plots from invaded to non-invaded, as well as light availability and soil fertility gradients [88]. A continuous transition between invaded and uninvaded plots could be regarded in conditions of only one invasive species. However, in the study area, spatial heterogeneity of geomorphology and dominant tree species led to overstory dominant-specific impacts of particular native tree species. For example, F. sylvatica canopies, despite functional similarity to Q. petraea, transmit less light, and therefore reduce species richness and abundance. This did not allow us to apply a simple invaded-uninvaded approach [89] to assess effects of the invasive species studied, due to diverse types of uninvaded ecosystems. A more important factor is spread of invasive tree species’ natural regeneration to the non-invaded plots. High densities and biomass of invasive tree species [64,90], recorded also in plots with non-invaded canopies, contributed to the biotic homogenization of regeneration layers [91,92]. DCA ordination scores of invasive tree species studied showed that Q. rubra and Q. petraea, as well as R. pseudoacacia and Acer platanoides, occupied similar niches, regardless of forest type. Due to high dispersal capacity (over 500 m) of wind-dispersed R. pseudoacacia [55] and animal dispersed P. serotina [93,94] and Q. rubra [61,95], the species studied were able to effectively colonize all study plots. Similarly, Šibíková et al. [40] confirmed the homogenizing effect of R. pseudoacacia on forest vegetation. However, models did not reveal influences of sapling densities of the invasive species studied on natural regeneration diversity indices, and found limited impacts on regeneration densities of particular species. This would indicate a low fulfilment of ecological niches within study sites, providing opportunity for growth of numerous species. Low impacts of invasive species saplings densities suggests that native tree species are limited by overstory–understory interactions with invasive species rather than by competition in the regeneration layer.
4.2. Low and Context-Dependent Impacts of Particular Invasive Species on Natural Regeneration Diversities
Our study confirmed the widely-known context-dependence of invasive species impacts [96,97,98]. For example, P. serotina decreased functional richness in P. sylvestris plantations, while we did not observe this in poor stands of P. sylvestris. This might be connected with higher likelihoods of P. sylvestris plantations occupying rich soils to be colonized by multiple species [99,100]. This might be connected with both higher light transmittance [26,101], as well as higher rates of bird visitation, and resulting defecation of bird-dispersed seeds [94,102]. Pinus sylvestris plantations provide suitable conditions for P. serotina growth which, due to ability for quick growth, is able to overgrow native tree species [103,104]. In poor stands, where soil fertility is a limiting factor for tree species, light competition is lower and despite the limited pool of species able to occur, functional richness is similar in both invaded and non-invaded stands. Context-dependence is also clear when comparing plantations of native (P. sylvestris) and non-native (Q. rubra and R. pseudoacacia) species, as plantations of P. sylvestris, due to higher light transmittance, host more species than Q. rubra. Dissimilarity in natural regeneration species composition between P. sylvestris and R. pseudoacacia plantations may result from higher proportion of shade-tolerant and nitrogen-demanding species beneath R. pseudoacacia canopies.
We found lower species richness and higher functional richness and dispersion in R. pseudoacacia and Quercus-Acer-Tilia stands (although with p > 0.05, but biologically relevant). Due to nitrogen fixation, forests with R. pseudoacacia have been reported with similar understory species richness as native forests [30]. In our case, we found lower species richness in R. pseudoacacia forests, which might be connected with our focus on woody species rather than understory herbaceous species. Differences between Q. rubra and Q. petraea forests also were low. This might be connected with functional similarity of both dominant tree species. Although Q. rubra is known to transmit less light than Q. petraea or Q. robur [25,58], we accounted for light availability in our models, to exclude this effect from comparisons among forest types.
Low effects on community metrics of biodiversity resulted from homogenization and replacement of native tree species by alien species. Moreover, this might be connected with lower survival probability of both alien and native tree species in invaded stands [50,68]. Our results also revealed a lack of differences in phylogenetic diversity among forest types. This is in line with Piwczyński et al. [105], explaining this pattern of shaping phylogenetic structure of the plant community by higher importance of soil pH, fertility, and light availability, rather than species identity. Due to the higher differences in particular species densities than community structure among forest types studied, phylogenetic diversity based on a species presence–absence matrix might not be sensitive enough to detect the influence of invasive tree species.
4.3. Decreasing Ability of Native Trees to Regenerate
Our study revealed that native forest-forming species usually reached lower densities in invaded forest types than in non-invaded. This is in line with Kowarik et al. [14], who found that forest-forming tree species occurred with higher frequency in plots with native tree species than with alien. Similarly, the invasive shrub Ligustrum lucidus decreases abundance of native tree species in subtropical Argentina [48]. Our results contradict Terwei et al. [45], who found a negative impact of P. serotina on U. minor natural regeneration and no impact of R. pseuodacacia. Also, Terwei et al. [45] did not find either a positive impact of P. serotina or a negative impact of R. pseudoacacia on C. betulus. The only similar result is the impact of R. pseudoacacia on Q. petraea natural regeneration, in line with the positive impact of R. pseudoacacia on Q. robur [45]. The differences might be connected with the different type of ecosystem studied, i.e., riparian forest in northern Italy.
4.4. Study Limitations
Despite accounting for the main gradients of species diversity in the vegetation—soil fertility, pH and light availability [90], our results might depend on other factors not studied. The most important is basing the study on one year of observation. Our earlier study within the same study plots revealed that seedling survival rates have significant seasonal variation [68]. However, in this study, we accounted for seedlings and saplings (i.e., natural regeneration which survived one year), which are more persistent [5,45]. We could also miss the effect of higher light availability in spring, which could affect germination, as we did not measure light availability before canopy development. Some minor bias might be caused by mismatch between year of natural regeneration investigation and light availability measurement. However, we did not report significant changes in canopy cover in both study years. Another factor is not accounting for deer browsing, which is an important limiting factor of natural regeneration [11,106]. Although we did not account for dispersal limitation [44,102], due to proximity of study plots to heterogenous stands, we assumed lack of seed dispersal limitation caused by the distance to the propagule sources. Another potential limitation might be connected with study design—all studied stands were located near invaded stands, thus some of them might be affected by edge effects. On the other hand, spatial heterogeneity and proximity of other invaded stands did not allow us to distinguish clear edge zones, and we may treat them as different stands. Bearing in mind all acknowledged drawbacks, we believe that results of our study allow for inference about the impacts of the invasive tree species studied on natural regeneration in temperate European forests.
5. Conclusions
Our study revealed context-dependent influences of invasive tree species on natural regeneration. We found that similar invaded and non-invaded forest types have similar seedling and sapling banks, due to homogenization caused by natural regeneration of invasive trees. We found differences in natural regeneration in terms of taxonomic and functional diversity among forest types, connected with environmental filtering, by both alien and native tree species. Invasive tree species decreased the extent of natural regeneration of native forest-forming tree species, while they supported the natural regeneration of some shrub or sub-canopy species. The latter occupy regeneration niches of forest-forming species. This led to the persistence of invasive tree species by decreasing ecosystem resilience. Therefore, the restoration of invaded forest patches requires the eradication of invasive tree species, not only as propagule sources, but also as factors decreasing the ability for the spontaneous regeneration of native tree species.
Supplementary Materials
The following are available online at https://0-www-mdpi-com.brum.beds.ac.uk/1999-4907/11/4/456/s1, Table S1: Models of species diversity as functions of forest type, DIFN, invasive sapling density, soil C:N ratio and soil pH (best fit model, according to AIC). Species richness was estimated using Poisson generalized linear models (GLM) while other metrics of biodiversity – by linear regression; Table S2: Models of particular species’ natural regeneration density (ind. 200 m−2) as functions of forest type, DIFN, invasive sapling density, soil C:N ratio and soil pH, estimated using zero-inflated Poisson generalized linear models.
Author Contributions
Conceptualization, M.K.D. and A.M.J.; methodology, M.K.D. and A.M.J.; data collection and formal analysis, M.K.D.; data curation, M.K.D.; writing—original draft preparation, M.K.D.; writing—review and editing, A.M.J.; supervision, A.M.J.; funding acquisition, M.K.D. and A.M.J. All authors have read and agreed to the published version of the manuscript.
Funding
The study was financed by National Science Centre, Poland, under the project no. 2015/19/N/NZ8/03822 entitled: ‘Ecophysiological and ecological determinants of invasiveness of trees and shrubs with the examples of Padus serotina, Quercus rubra and Robinia pseudoacacia’. The study was partially supported by the Institute of Dendrology, Polish Academy of Sciences.
Acknowledgments
We are grateful to the two anonymous Reviewers for helpful comments on the earlier draft of the manuscript.
Conflicts of Interest
The authors declare no conflict of interest. The funders had no role in the design of the study; in the collection, analyses, or interpretation of data; in the writing of the manuscript, or in the decision to publish the results.
Appendix A. Spatial Distribution of Forest Types within Blocks and Species Frequency within Studied Forest Types
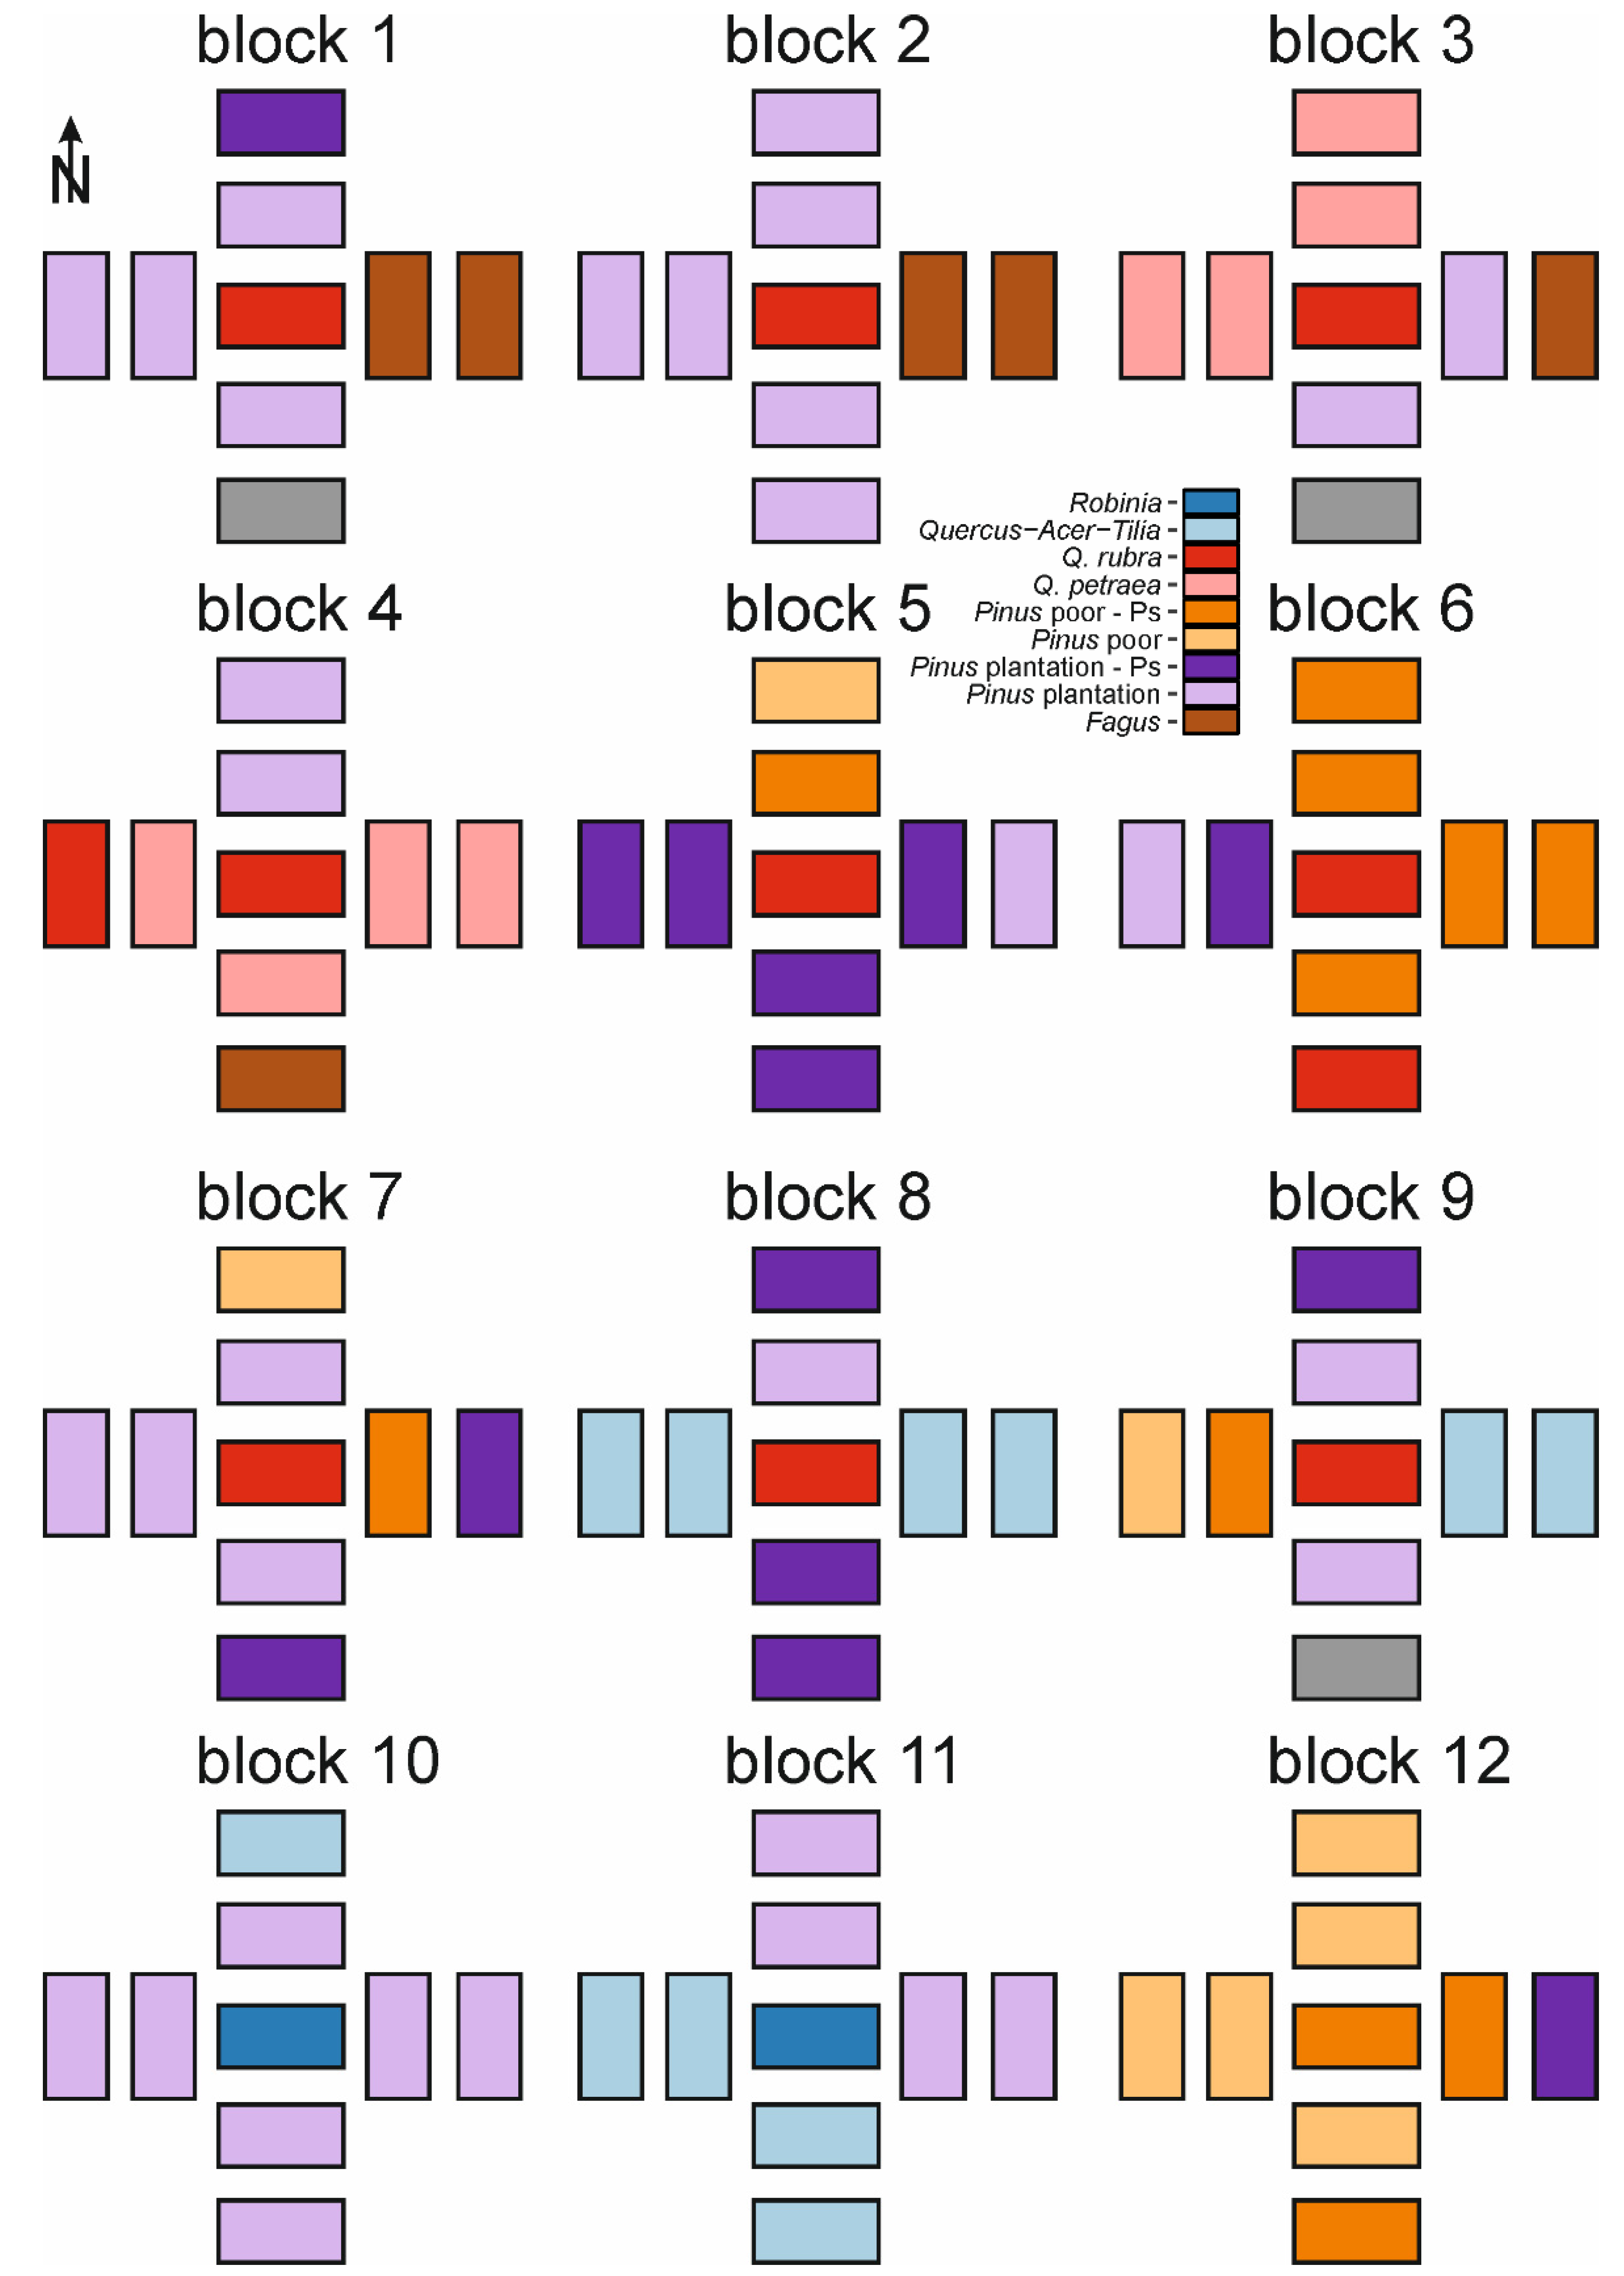
Figure A1.
Schematic distribution of forest types within study blocks 1–12. Schemes do not account for distances between plots. For details of study design see Figure 1.
Figure A1.
Schematic distribution of forest types within study blocks 1–12. Schemes do not account for distances between plots. For details of study design see Figure 1.

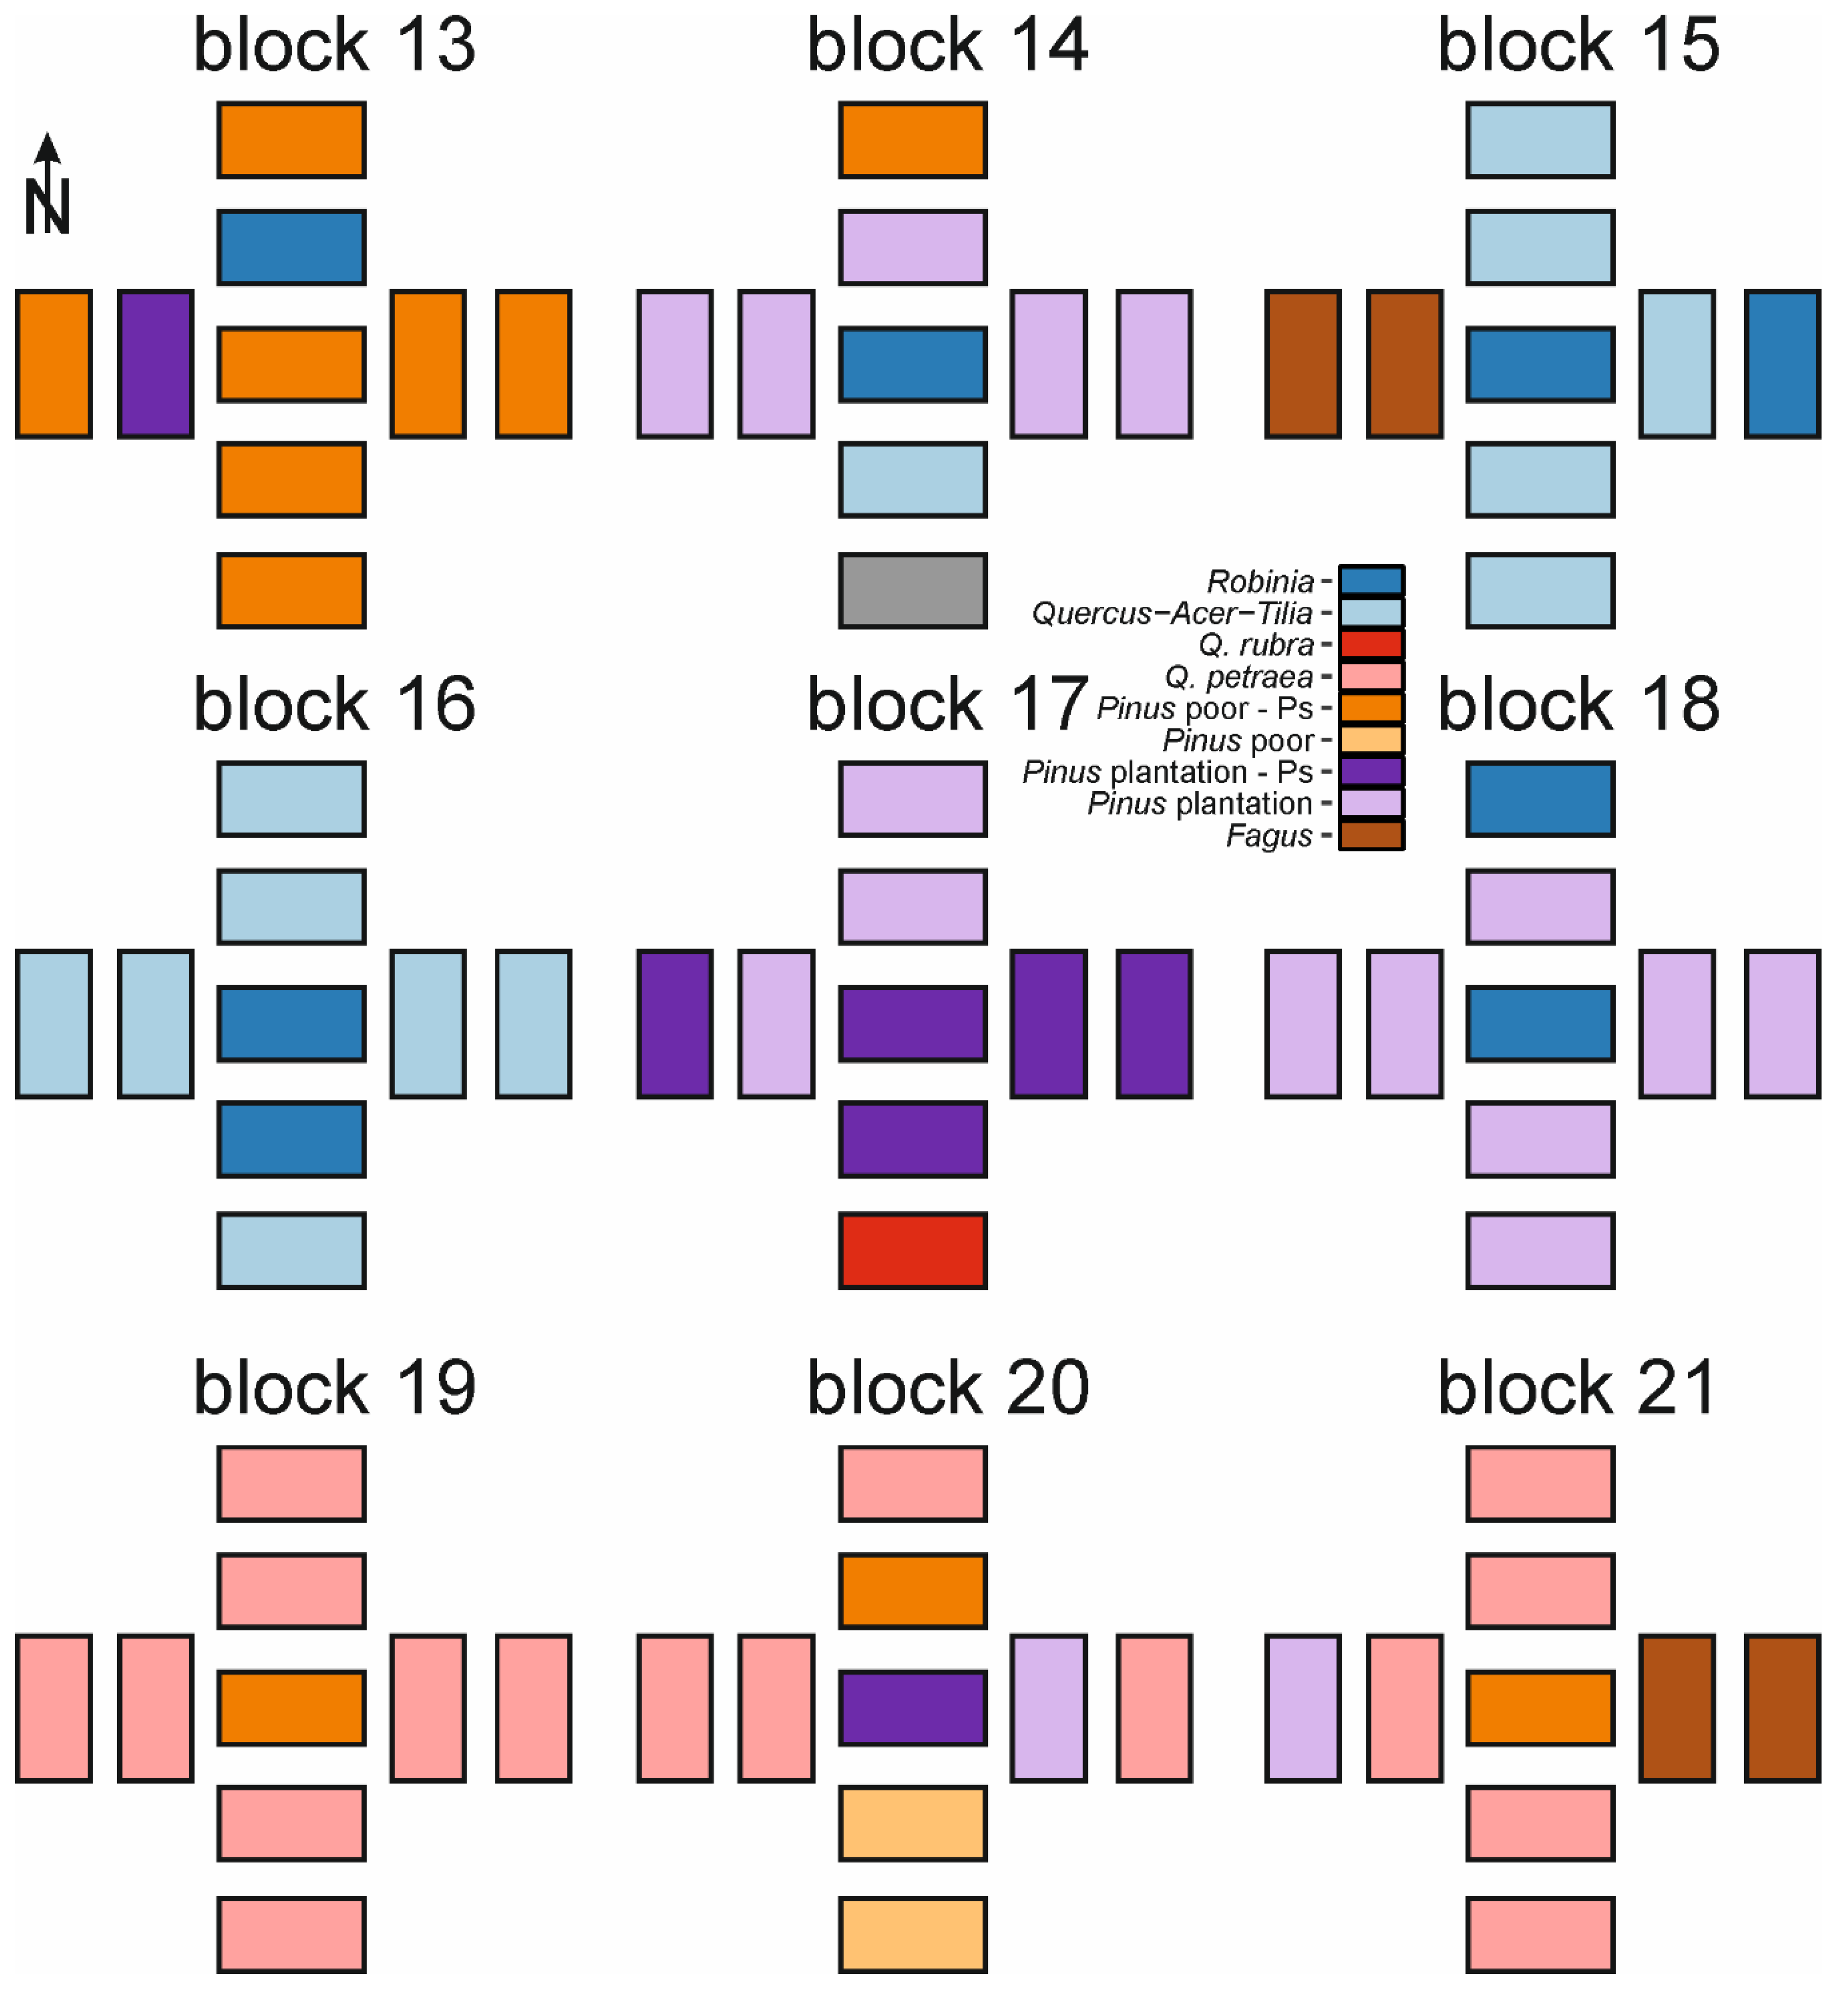
Figure A2.
Schematic distribution of forest types within study blocks 13-21. Schemes do not account for distances between plots. For details of study design see Figure 1.
Figure A2.
Schematic distribution of forest types within study blocks 13-21. Schemes do not account for distances between plots. For details of study design see Figure 1.


Table A1.
Frequency (%) of species recorded during the study within forest types (see Table 1 for explanations).
Table A1.
Frequency (%) of species recorded during the study within forest types (see Table 1 for explanations).
| Species | Fagus (n = 10) | Pinus plantation (n = 52) | Pinus plantation-Ps (n = 20) | Pinus poor (n = 10) | Pinus poor-Ps (n = 23) | Q. petraea (n = 25) | Q. rubra (n = 12) | Quercus-Acer-Tilia (n = 24) | Robinia (n = 10) |
|---|---|---|---|---|---|---|---|---|---|
| Acer campestre L. | 0.0 | 3.8 | 15.0 | 10.0 | 21.7 | 0.0 | 0.0 | 25.0 | 10.0 |
| Acer negundo L. | 0.0 | 1.9 | 5.0 | 0.0 | 0.0 | 0.0 | 0.0 | 8.3 | 0.0 |
| Acer platanoides L. | 20.0 | 69.2 | 40.0 | 40.0 | 26.1 | 28.0 | 25.0 | 100.0 | 100.0 |
| Acer pseudoplatanus L. | 60.0 | 90.4 | 100.0 | 100.0 | 87.0 | 72.0 | 83.3 | 83.3 | 100.0 |
| Aesculus hippocastanum L. | 0.0 | 1.9 | 5.0 | 0.0 | 0.0 | 0.0 | 0.0 | 0.0 | 20.0 |
| Amelanchier spicata K.Koch | 0.0 | 7.7 | 5.0 | 0.0 | 0.0 | 0.0 | 0.0 | 0.0 | 10.0 |
| Berberis aquifolium Pursh | 0.0 | 7.7 | 0.0 | 0.0 | 0.0 | 0.0 | 0.0 | 4.2 | 10.0 |
| Betula pendula Roth | 0.0 | 0.0 | 15.0 | 10.0 | 39.1 | 12.0 | 0.0 | 4.2 | 0.0 |
| Betula pubescens Ehrh. | 0.0 | 0.0 | 0.0 | 10.0 | 0.0 | 0.0 | 0.0 | 0.0 | 0.0 |
| Carpinus betulus L. | 20.0 | 61.5 | 30.0 | 30.0 | 8.7 | 28.0 | 25.0 | 33.3 | 60.0 |
| Cornus sanguinea L. | 0.0 | 0.0 | 0.0 | 0.0 | 0.0 | 0.0 | 0.0 | 29.2 | 0.0 |
| Corylus avellana L. | 20.0 | 23.1 | 0.0 | 0.0 | 0.0 | 12.0 | 8.3 | 8.3 | 20.0 |
| Cotoneaster lucidus Schltdl. | 0.0 | 9.6 | 0.0 | 0.0 | 0.0 | 0.0 | 0.0 | 0.0 | 20.0 |
| Crataegus laevigata DC. | 0.0 | 0.0 | 0.0 | 0.0 | 0.0 | 0.0 | 0.0 | 4.2 | 0.0 |
| Crataegus monogyna Jacq. | 0.0 | 0.0 | 0.0 | 0.0 | 0.0 | 0.0 | 0.0 | 0.0 | 10.0 |
| Crataegus rhipidophylla Gand. | 0.0 | 7.7 | 10.0 | 0.0 | 4.3 | 4.0 | 8.3 | 12.5 | 20.0 |
| Euonymus europaeus L. | 10.0 | 17.3 | 5.0 | 0.0 | 0.0 | 4.0 | 0.0 | 50.0 | 90.0 |
| Fagus sylvatica L. | 100.0 | 38.5 | 15.0 | 40.0 | 4.3 | 68.0 | 33.3 | 45.8 | 70.0 |
| Frangula alnus Mill. | 0.0 | 15.4 | 40.0 | 50.0 | 43.5 | 16.0 | 8.3 | 0.0 | 10.0 |
| Fraxinus excelsior L. | 40.0 | 48.1 | 15.0 | 0.0 | 8.7 | 4.0 | 8.3 | 58.3 | 70.0 |
| Juniperus communis L. | 0.0 | 3.8 | 10.0 | 10.0 | 0.0 | 0.0 | 8.3 | 0.0 | 0.0 |
| Ligustrum vulgare L. | 0.0 | 7.7 | 0.0 | 0.0 | 4.3 | 0.0 | 0.0 | 8.3 | 10.0 |
| Lonicera xylosteum L. | 10.0 | 19.2 | 15.0 | 0.0 | 0.0 | 4.0 | 0.0 | 20.8 | 20.0 |
| Malus sylvestris Mill. | 0.0 | 1.9 | 25.0 | 0.0 | 0.0 | 8.0 | 0.0 | 0.0 | 0.0 |
| Pinus sylvestris L. | 10.0 | 5.8 | 25.0 | 60.0 | 47.8 | 36.0 | 16.7 | 0.0 | 0.0 |
| Populus tremula L. | 0.0 | 1.9 | 0.0 | 20.0 | 8.7 | 4.0 | 0.0 | 0.0 | 10.0 |
| Prunus avium (L.) L. | 10.0 | 26.9 | 10.0 | 0.0 | 8.7 | 12.0 | 8.3 | 29.2 | 20.0 |
| Prunus domestica L. | 20.0 | 42.3 | 50.0 | 10.0 | 26.1 | 16.0 | 8.3 | 37.5 | 60.0 |
| Prunus mahaleb L. | 0.0 | 5.8 | 5.0 | 0.0 | 4.3 | 8.0 | 0.0 | 0.0 | 0.0 |
| Prunus padus L. | 0.0 | 0.0 | 0.0 | 0.0 | 0.0 | 0.0 | 0.0 | 4.2 | 0.0 |
| Prunus serotina Ehrh. | 40.0 | 48.1 | 100.0 | 80.0 | 100.0 | 76.0 | 58.3 | 37.5 | 30.0 |
| Prunus spinosa L. | 0.0 | 7.7 | 0.0 | 10.0 | 0.0 | 0.0 | 8.3 | 4.2 | 0.0 |
| Pyrus communis L. | 0.0 | 11.5 | 25.0 | 10.0 | 21.7 | 8.0 | 0.0 | 12.5 | 10.0 |
| Quercus petraea (Matt.) Liebl. | 80.0 | 73.1 | 100.0 | 100.0 | 95.7 | 96.0 | 16.7 | 54.2 | 70.0 |
| Quercus robur L. | 0.0 | 5.8 | 15.0 | 0.0 | 0.0 | 0.0 | 0.0 | 8.3 | 10.0 |
| Quercus rubra L. | 50.0 | 61.5 | 90.0 | 50.0 | 60.9 | 28.0 | 83.3 | 25.0 | 10.0 |
| Rhamnus cathartica L. | 0.0 | 0.0 | 5.0 | 0.0 | 4.3 | 0.0 | 0.0 | 0.0 | 20.0 |
| Ribes alpinum L. | 0.0 | 0.0 | 0.0 | 0.0 | 0.0 | 0.0 | 0.0 | 4.2 | 0.0 |
| Ribes rubrum L. | 0.0 | 7.7 | 0.0 | 0.0 | 0.0 | 0.0 | 0.0 | 8.3 | 40.0 |
| Ribes uva-crispa L. | 0.0 | 13.5 | 5.0 | 10.0 | 0.0 | 4.0 | 0.0 | 4.2 | 0.0 |
| Robinia pseudoacacia L. | 30.0 | 48.1 | 35.0 | 0.0 | 8.7 | 4.0 | 8.3 | 37.5 | 60.0 |
| Rosa canina L. | 0.0 | 5.8 | 15.0 | 10.0 | 17.4 | 8.0 | 0.0 | 4.2 | 20.0 |
| Sambucus nigra L. | 0.0 | 32.7 | 25.0 | 0.0 | 17.4 | 8.0 | 0.0 | 62.5 | 90.0 |
| Sorbus aucuparia L. | 30.0 | 40.4 | 90.0 | 40.0 | 78.3 | 48.0 | 33.3 | 12.5 | 10.0 |
| Sorbus intermedia (Ehrh.) Pers. | 0.0 | 3.8 | 15.0 | 10.0 | 8.7 | 8.0 | 0.0 | 0.0 | 10.0 |
| Symphoricarpos albus (L.) C.Koch | 0.0 | 0.0 | 0.0 | 0.0 | 0.0 | 0.0 | 0.0 | 0.0 | 10.0 |
| Syringa vulgaris L. | 0.0 | 1.9 | 0.0 | 0.0 | 0.0 | 0.0 | 0.0 | 4.2 | 10.0 |
| Taxus baccata L. | 0.0 | 5.8 | 20.0 | 0.0 | 4.3 | 0.0 | 0.0 | 4.2 | 10.0 |
| Tilia cordata Mill. | 10.0 | 34.6 | 55.0 | 10.0 | 39.1 | 8.0 | 16.7 | 37.5 | 20.0 |
| Tilia platyphyllos Scop. | 0.0 | 9.6 | 0.0 | 0.0 | 0.0 | 0.0 | 0.0 | 8.3 | 0.0 |
| Ulmus glabra Huds. | 10.0 | 0.0 | 0.0 | 0.0 | 0.0 | 0.0 | 0.0 | 33.3 | 20.0 |
| Ulmus minor Mill. | 10.0 | 34.6 | 10.0 | 0.0 | 8.7 | 4.0 | 0.0 | 54.2 | 90.0 |
| Viburnum opulus L. | 0.0 | 1.9 | 0.0 | 0.0 | 0.0 | 0.0 | 0.0 | 0.0 | 0.0 |
References
- Baraloto, C.; Goldberg, D.E.; Bonal, D. Performance trade-offs among tropical tree seedlings in contrasting microhabitats. Ecology 2005, 86, 2461–2472. [Google Scholar] [CrossRef] [Green Version]
- Gazda, A.; Kościelniak, P.; Hardy, M.; Muter, E.; Kędra, K.; Bodziarczyk, J.; Frączek, M.; Chwistek, K.; Różański, W.; Szwagrzyk, J. Upward expansion of distribution ranges of tree species: Contrasting results from two national parks in Western Carpathians. Sci. Total Environ. 2019, 653, 920–929. [Google Scholar] [CrossRef] [PubMed]
- Niinemets, Ü.; Valladares, F. Tolerance to shade, drought, and waterlogging of temperate Northern Hemisphere trees and shrubs. Ecol. Monogr. 2006, 76, 521–547. [Google Scholar] [CrossRef]
- Legras, E.C.; Vander Wall, S.B.; Board, D.I. The role of germination microsite in the establishment of sugar pine and Jeffrey pine seedlings. For. Ecol. Manag. 2010, 260, 806–813. [Google Scholar] [CrossRef]
- Canham, C.D.; Murphy, L. The demography of tree species response to climate: Seedling recruitment and survival. Ecosphere 2016, 7, e01424. [Google Scholar] [CrossRef]
- Lorimer, C.G.; Chapman, J.W.; Lambert, W.D. Tall Understorey Vegetation as a Factor in the Poor Development of Oak Seedlings Beneath Mature Stands. J. Ecol. 1994, 82, 227–237. [Google Scholar] [CrossRef]
- Dech, J.P.; Robinson, L.M.; Nosko, P. Understorey plant community characteristics and natural hardwood regeneration under three partial harvest treatments applied in a northern red oak (Quercus rubra L.) stand in the Great Lakes-St. Lawrence forest region of Canada. For. Ecol. Manag. 2008, 256, 760–773. [Google Scholar] [CrossRef]
- Packer, A.; Clay, K. Soil pathogens and Prunus serotina seedling and sapling growth near conspecific trees. Ecology 2003, 84, 108–119. [Google Scholar] [CrossRef]
- Bakys, R.; Vasaitis, R.; Barklund, P.; Ihrmark, K.; Stenlid, J. Investigations concerning the role of Chalara fraxinea in declining Fraxinus excelsior. Plant Pathol. 2009, 58, 284–292. [Google Scholar] [CrossRef]
- Kain, M.; Battaglia, L.; Royo, A.; Carson, W.P. Over-browsing in Pennsylvania creates a depauperate forest dominated by an understory tree: Results from a 60-year-old deer exclosure. J. Torrey Biol. Soc. 2011, 138, 322–326. [Google Scholar] [CrossRef]
- Iszkuło, G.; Nowak-Dyjeta, K.; Sekiewicz, M. Influence of initial light intensity and deer browsing on Taxus baccata saplings: A six years field study. Dendrobiology 2014, 71, 93–99. [Google Scholar] [CrossRef] [Green Version]
- Orwig, D.A.; Cogbill, C.V.; Foster, D.R.; O’Keefe, J.F. Variations in Old-Growth Structure and Definitions: Forest Dynamics on Wachusett Mountain, Massachusetts. Ecol. Appl. 2001, 11, 437–452. [Google Scholar] [CrossRef]
- Prach, K.; Pyšek, P.; Bastl, M. Spontaneous vegetation succession in human-disturbed habitats: A pattern across seres. Appl. Veg. Sci. 2001, 4, 83–88. [Google Scholar] [CrossRef]
- Kowarik, I.; Hiller, A.; Planchuelo, G.; Seitz, B.; von der Lippe, M.; Buchholz, S. Emerging Urban Forests: Opportunities for Promoting the Wild Side of the Urban Green Infrastructure. Sustainability 2019, 11, 6318. [Google Scholar] [CrossRef] [Green Version]
- Parker, G.R.; Leopold, D.J.; Eichenberger, J.K. Tree dynamics in an old-growth, deciduous forest. For. Ecol. Manag. 1985, 11, 31–57. [Google Scholar] [CrossRef]
- Orczewska, A.; Czortek, P.; Jaroszewicz, B. The impact of salvage logging on herb layer species composition and plant community recovery in Białowieża Forest. Biodivers. Conserv. 2019, 28, 3407–3428. [Google Scholar] [CrossRef] [Green Version]
- Jaroszewicz, B.; Cholewińska, O.; Gutowski, J.M.; Samojlik, T.; Zimny, M.; Latałowa, M. Białowieża Forest—A Relic of the High Naturalness of European Forests. Forests 2019, 10, 849. [Google Scholar] [CrossRef] [Green Version]
- Clarke, P.J.; Keith, D.A.; Vincent, B.E.; Letten, A.D. Post-grazing and post-fire vegetation dynamics: Long-term changes in mountain bogs reveal community resilience. J. Veg. Sci. 2015, 26, 278–290. [Google Scholar] [CrossRef]
- Pröll, G.; Darabant, A.; Gratzer, G.; Katzensteiner, K. Unfavourable microsites, competing vegetation and browsing restrict post-disturbance tree regeneration on extreme sites in the Northern Calcareous Alps. Eur. J. For. Res. 2015, 134, 293–308. [Google Scholar] [CrossRef]
- Czortek, P.; Ratyńska, H.; Dyderski, M.K.; Jagodziński, A.M.; Orczewska, A.; Jaroszewicz, B. Cessation of livestock grazing and windthrow drive a shift in plant species composition in the Western Tatra Mts. Tuexenia 2018, 37, 177–196. [Google Scholar]
- Holmgren, M.; Lin, C.-Y.; Murillo, J.E.; Nieuwenhuis, A.; Penninkhof, J.; Sanders, N.; Bart, T.; Veen, H.; Vasander, H.; Vollebregt, M.E.; et al. Positive shrub–tree interactions facilitate woody encroachment in boreal peatlands. J. Ecol. 2015, 103, 58–66. [Google Scholar] [CrossRef]
- Jagodziński, A.M.; Horodecki, P.; Rawlik, K.; Dyderski, M.K. Do understorey or overstorey traits drive tree encroachment on a drained raised bog? Plant Biol. 2017, 19, 571–583. [Google Scholar] [CrossRef] [PubMed]
- Brundu, G.; Richardson, D.M. Planted forests and invasive alien trees in Europe: A Code for managing existing and future plantings to mitigate the risk of negative impacts from invasions. NeoBiota 2016, 30, 5–47. [Google Scholar] [CrossRef]
- Hejda, M.; Hanzelka, J.; Kadlec, T.; Štrobl, M.; Pyšek, P.; Reif, J. Impacts of an invasive tree across trophic levels: Species richness, community composition and resident species’ traits. Divers. Distrib. 2017, 23, 997–1007. [Google Scholar] [CrossRef]
- Niinemets, Ü. A review of light interception in plant stands from leaf to canopy in different plant functional types and in species with varying shade tolerance. Ecol. Res. 2010, 25, 693–714. [Google Scholar] [CrossRef]
- Dyderski, M.K.; Jagodziński, A.M. Similar Impacts of Alien and Native Tree Species on Understory Light Availability in a Temperate Forest. Forests 2019, 10, 951. [Google Scholar] [CrossRef] [Green Version]
- Castro-Díez, P.; Godoy, O.; Alonso, A.; Gallardo, A.; Saldaña, A. What explains variation in the impacts of exotic plant invasions on the nitrogen cycle? A meta-analysis. Ecol. Lett. 2014, 17, 1–12. [Google Scholar] [CrossRef] [Green Version]
- Mueller, K.E.; Hobbie, S.E.; Chorover, J.; Reich, P.B.; Eisenhauer, N.; Castellano, M.J.; Chadwick, O.A.; Dobies, T.; Hale, C.M.; Jagodziński, A.M.; et al. Effects of litter traits, soil biota, and soil chemistry on soil carbon stocks at a common garden with 14 tree species. Biogeochemistry 2015, 123, 313–327. [Google Scholar] [CrossRef]
- Castro-Díez, P.; Vaz, A.S.; Silva, J.S.; Van Loo, M.; Alonso, Á.; Aponte, C.; Bayón, Á.; Bellingham, P.J.; Chiuffo, M.C.; DiManno, N.; et al. Global effects of non-native tree species on multiple ecosystem services. Biol. Rev. 2019, 94, 1477–1501. [Google Scholar] [CrossRef]
- Gentili, R.; Ferrè, C.; Cardarelli, E.; Montagnani, C.; Bogliani, G.; Citterio, S.; Comolli, R. Comparing Negative Impacts of Prunus serotina, Quercus rubra and Robinia pseudoacacia on Native Forest Ecosystems. Forests 2019, 10, 842. [Google Scholar] [CrossRef] [Green Version]
- Stanek, M.; Stefanowicz, A.M. Invasive Quercus rubra negatively affected soil microbial communities relative to native Quercus robur in a semi-natural forest. Sci. Total Environ. 2019, 696, 133977. [Google Scholar] [CrossRef] [PubMed]
- Mueller, K.E.; Eisenhauer, N.; Reich, P.B.; Hobbie, S.E.; Chadwick, O.A.; Chorover, J.; Dobies, T.; Hale, C.M.; Jagodziński, A.M.; Kałucka, I.; et al. Light, earthworms, and soil resources as predictors of diversity of 10 soil invertebrate groups across monocultures of 14 tree species. Soil Biol. Biochem. 2016, 92, 184–198. [Google Scholar] [CrossRef]
- Kohyt, J.; Skubała, P. Oribatid mite (Acari: Oribatida) communities reveal the negative impact of the red oak (Quercus rubra L.) on soil fauna in Polish commercial forests. Pedobiologia 2019, 79, 150594. [Google Scholar] [CrossRef]
- Dickie, I.A.; Bolstridge, N.; Cooper, J.A.; Peltzer, D.A. Co-invasion by Pinus and its mycorrhizal fungi. New Phytol. 2010, 187, 475–484. [Google Scholar] [CrossRef]
- Kałucka, I.L.; Jagodziński, A.M. Successional traits of ectomycorrhizal fungi in forest reclamation after surface mining and agricultural disturbances: A review. Dendrobiology 2016, 76, 91–104. [Google Scholar] [CrossRef]
- Woziwoda, B.; Staniaszek-Kik, M.; Stefańska-Krzaczek, E. Assemblages of native bryophytes in secondary forests with introduced Quercus rubra. Nord. J. Bot. 2017, 35, 111–120. [Google Scholar] [CrossRef]
- Jagodziński, A.M.; Wierzcholska, S.; Dyderski, M.K.; Horodecki, P.; Rusińska, A.; Gdula, A.K.; Kasprowicz, M. Tree species effects on bryophyte guilds on a reclaimed post-mining site. Ecol. Eng. 2018, 110, 117–127. [Google Scholar] [CrossRef]
- Taylor, K.T.; Maxwell, B.D.; Pauchard, A.; Nuñez, M.A.; Rew, L.J. Native versus non-native invasions: Similarities and differences in the biodiversity impacts of Pinus contorta in introduced and native ranges. Divers. Distrib. 2016, 22, 578–588. [Google Scholar] [CrossRef] [Green Version]
- Woziwoda, B.; Dyderski, M.K.; Jagodziński, A.M. Effects of land use change and Quercus rubra introduction on Vaccinium myrtillus performance in Pinus sylvestris forests. For. Ecol. Manag. 2019, 440, 1–11. [Google Scholar] [CrossRef]
- Šibíková, M.; Jarolímek, I.; Hegedüšová, K.; Májeková, J.; Mikulová, K.; Slabejová, D.; Škodová, I.; Zaliberová, M.; Medvecká, J. Effect of planting alien Robinia pseudoacacia trees on homogenization of Central European forest vegetation. Sci. Total Environ. 2019, 687, 1164–1175. [Google Scholar] [CrossRef]
- González-Muñoz, N.; Castro-Díez, P.; Godoy, O. Lack of superiority of invasive over co-occurring native riparian tree seedling species. Biol. Invasions 2014, 16, 269–281. [Google Scholar] [CrossRef]
- Kawaletz, H.; Mölder, I.; Annighöfer, P.; Terwei, A.; Zerbe, S.; Ammer, C. Back to the roots: How do seedlings of native tree species react to the competition by exotic species? Ann. For. Sci. 2014, 71, 337–347. [Google Scholar] [CrossRef] [Green Version]
- Lockwood, J.L.; Cassey, P.; Blackburn, T. The role of propagule pressure in explaining species invasions. Trends Ecol. Evol. 2005, 20, 223–228. [Google Scholar] [CrossRef] [PubMed]
- Jagodziński, A.M.; Dyderski, M.K.; Horodecki, P.; Rawlik, K. Limited dispersal prevents Quercus rubra invasion in a 14-species common garden experiment. Divers. Distrib. 2018, 24, 403–414. [Google Scholar] [CrossRef] [Green Version]
- Terwei, A.; Zerbe, S.; Zeileis, A.; Annighöfer, P.; Kawaletz, H.; Mölder, I.; Ammer, C. Which are the factors controlling tree seedling establishment in North Italian floodplain forests invaded by non-native tree species? For. Ecol. Manag. 2013, 304, 192–203. [Google Scholar] [CrossRef]
- Terwei, A.; Zerbe, S.; Mölder, I.; Annighöfer, P.; Kawaletz, H.; Ammer, C. Response of floodplain understorey species to environmental gradients and tree invasion: A functional trait perspective. Biol. Invasions 2016, 18, 2951–2973. [Google Scholar] [CrossRef]
- Woziwoda, B.; Dyderski, M.K.; Kobus, S.; Parzych, A.; Jagodziński, A.M. Natural regeneration and recruitment of native Quercus robur and introduced Q. rubra in European oak-pine mixed forests. For. Ecol. Manag. 2019, 449, 117473. [Google Scholar] [CrossRef]
- Lichstein, J.W.; Grau, H.R.; Aragón, R.; Ejrnæs, R. Recruitment limitation in secondary forests dominated by an exotic tree. J. Veg. Sci. 2004, 15, 721–728. [Google Scholar] [CrossRef]
- Peña, E.; Hidalgo, M.; Langdon, B.; Pauchard, A. Patterns of spread of Pinus contorta Dougl. ex Loud. invasion in a Natural Reserve in southern South America. For. Ecol. Manag. 2008, 256, 1049–1054. [Google Scholar] [CrossRef]
- Fuentes-Ramírez, A.; Pauchard, A.; Cavieres, L.A.; García, R.A. Survival and growth of Acacia dealbata vs. native trees across an invasion front in south-central Chile. For. Ecol. Manag. 2011, 261, 1003–1009. [Google Scholar]
- Gorchov, D.L.; Trisel, D.E. Competitive effects of the invasive shrub, Lonicera maackii (Rupr.) Herder (Caprifoliaceae), on the growth and survival of native tree seedlings. Plant Ecol. 2003, 166, 13–24. [Google Scholar] [CrossRef]
- Wagner, V.; Chytrý, M.; Jiménez-Alfaro, B.; Pergl, J.; Hennekens, S.; Biurrun, I.; Knollová, I.; Berg, C.; Vassilev, K.; Rodwell, J.S.; et al. Alien plant invasions in European woodlands. Divers. Distrib. 2017, 23, 969–981. [Google Scholar] [CrossRef]
- Brus, R.; Pötzelsberger, E.; Lapin, K.; Brundu, G.; Orazio, C.; Straigyte, L.; Hasenauer, H. Extent, distribution and origin of non-native forest tree species in Europe. Scand. J. For. Res. 2019, 34, 533–544. [Google Scholar] [CrossRef]
- Starfinger, U.; Kowarik, I.; Rode, M.; Schepker, H. From desirable ornamental plant to pest to accepted addition to the flora?—The perception of an alien tree species through the centuries. Biol. Invasions 2003, 5, 323–335. [Google Scholar] [CrossRef]
- Cierjacks, A.; Kowarik, I.; Joshi, J.; Hempel, S.; Ristow, M.; von der Lippe, M.; Weber, E. Biological Flora of the British Isles: Robinia pseudoacacia. J. Ecol. 2013, 101, 1623–1640. [Google Scholar] [CrossRef]
- Woziwoda, B.; Potocki, M.; Sagan, J.; Zasada, M.; Tomusiak, R.; Wilczynski, S. Commercial forestry as a vector of alien tree species-the case of Quercus rubra L. introduction in Poland. Balt. For. 2014, 20, 131–141. [Google Scholar]
- Jagodziński, A.M.; Dyderski, M.K.; Rawlik, M.; Banaszczak, P. Plantation of coniferous trees modifies risk and size of Padus serotina (Ehrh.) Borkh. invasion—Evidence from a Rogów Arboretum case study. For. Ecol. Manag. 2015, 357, 84–94. [Google Scholar]
- Jagodziński, A.M.; Dyderski, M.K.; Horodecki, P.; Knight, K.S.; Rawlik, K.; Szmyt, J. Light and propagule pressure affect invasion intensity of Prunus serotina in a 14-tree species forest common garden experiment. NeoBiota 2019, 46, 1–21. [Google Scholar] [CrossRef]
- Horodecki, P.; Jagodziński, A.M. Tree species effects on litter decomposition in pure stands on afforested post-mining sites. For. Ecol. Manag. 2017, 406, 1–11. [Google Scholar] [CrossRef]
- Bieberich, J.; Lauerer, M.; Aas, G. Acorns of introduced Quercus rubra are neglected by European Jay but spread by mice. Ann. For. Res. 2016, 59, 249–258. [Google Scholar] [CrossRef] [Green Version]
- Myczko, Ł.; Dylewski, Ł.; Zduniak, P.; Sparks, T.H.; Tryjanowski, P. Predation and dispersal of acorns by European Jay (Garrulus glandarius) differs between a native (Pedunculate Oak Quercus robur) and an introduced oak species (Northern Red Oak Quercus rubra) in Europe. For. Ecol. Manag. 2014, 331, 35–39. [Google Scholar] [CrossRef]
- Rice, S.K.; Westerman, B.; Federici, R. Impacts of the exotic, nitrogen-fixing black locust (Robinia pseudoacacia) on nitrogen-cycling in a pine–oak ecosystem. Plant Ecol. 2004, 174, 97–107. [Google Scholar] [CrossRef]
- Vítková, M.; Müllerová, J.; Sádlo, J.; Pergl, J.; Pyšek, P. Black locust (Robinia pseudoacacia) beloved and despised: A story of an invasive tree in Central Europe. For. Ecol. Manag. 2017, 384, 287–302. [Google Scholar] [CrossRef] [PubMed]
- Dyderski, M.K.; Jagodziński, A.M. Drivers of invasive tree and shrub natural regeneration in temperate forests. Biol. Invasions 2018, 20, 2363–2379. [Google Scholar] [CrossRef] [Green Version]
- Woziwoda, B.; Kopeć, D.; Witkowski, J. The negative impact of intentionally introduced Quercus rubra L. on a forest community. Acta Soc. Bot. Pol. 2014, 83, 39–49. [Google Scholar] [CrossRef]
- Purcel, A. Obce gatunki drzew i krzewów w Wielkopolskim Parku Narodowym—ich występowanie i rola w biocenozach Parku. Morena 2009, 14, 35–191. [Google Scholar]
- Nowak, G.; Kara, M.; Bernat, Z.; Cykowiak, Z. Wybrane zagadnienia z planu ochrony ekosystemów leśnych Wielkopolskiego Parku Narodowego. Morena 2000, 7, 85–129. [Google Scholar]
- Dyderski, M.K.; Jagodziński, A.M. Seedling survival of Prunus serotina Ehrh., Quercus rubra L. and Robinia pseudoacacia L. in temperate forests of Western Poland. For. Ecol. Manag. 2019, 450, 117498. [Google Scholar] [CrossRef]
- Reich, P.B.; Oleksyn, J.; Modrzynski, J.; Mrozinski, P.; Hobbie, S.E.; Eissenstat, D.M.; Chorover, J.; Chadwick, O.A.; Hale, C.M.; Tjoelker, M.G. Linking litter calcium, earthworms and soil properties: A common garden test with 14 tree species. Ecol. Lett. 2005, 8, 811–818. [Google Scholar] [CrossRef]
- Bank Danych o Lasach. Available online: http://www.bdl.lasy.gov.pl/ (accessed on 31 January 2017).
- GBIF. Global Biodiversity Information Facility. Available online: http://www.gbif.org/ (accessed on 16 April 2020).
- R Core Team R: A Language and Environment for Statistical Computing; R Foundation for Statistical Computing: Vienna, Austria, 2019.
- Hill, M.O.; Gauch, H.G. Detrended correspondence analysis: An improved ordination technique. Vegetatio 1980, 42, 47–58. [Google Scholar] [CrossRef]
- Oksanen, J.; Blanchet, F.G.; Kindt, R.; Legendre, P.; Michin, P.R.; O’Hara, R.B.; Simpson, G.L.; Solymos, P.; Henry, M.; Stevens, H.; et al. “Vegan” 2.3.3.—Community Ecology Package. Available online: https://cran.r-project.org/package=vegan (accessed on 16 April 2020).
- Jin, Y.; Qian, H.V. PhyloMaker: An R package that can generate very large phylogenies for vascular plants. Ecography 2019, 42, 1353–1359. [Google Scholar] [CrossRef] [Green Version]
- Tsirogiannis, C.; Sandel, B. PhyloMeasures: A package for computing phylogenetic biodiversity measures and their statistical moments. Ecography 2016, 39, 709–714. [Google Scholar] [CrossRef]
- Kleyer, M.; Bekker, R.M.; Knevel, I.C.; Bakker, J.P.; Thompson, K.; Sonnenschein, M.; Poschlod, P.; Van Groenendael, J.M.; Klimeš, L.; Klimešová, J.; et al. The LEDA Traitbase: A database of life-history traits of the Northwest European flora. J. Ecol. 2008, 96, 1266–1274. [Google Scholar] [CrossRef]
- Klotz, S.; Kühn, I.; Durka, W. BIOLFLOR—Eine Datenbank zu biologisch-ökologischen Merkmalen der Gefäßpflanzen in Deutschland. Schriftenreihe für Vegetationskunde; Schriftenreihe für Vegetationskunde; Bundesamt für Naturschutz: Bonn, Germany, 2002. [Google Scholar]
- Enquist, B.J.; Condit, R.; Peet, R.K.; Schildhauer, M.; Thiers, B.M. Cyberinfrastructure for an integrated botanical information network to investigate the ecological impacts of global climate change on plant biodiversity. PeerJ Prepr. 2016, 4, e2615v2. [Google Scholar]
- Zanne, A.E.; Lopez-Gonzalez, G.; Coomes, D.A.; Ilic, J.; Jansen, S.; Lewis, S.L.; Miller, R.B.; Swenson, N.G.; Wiemann, M.C.; Chave, J. Data from: Towards a worldwide wood economics spectrum. 2019. Available online: https://datadryad.org/stash/dataset/doi:10.5061/dryad.234 (accessed on 16 April 2020). [CrossRef]
- Ellenberg, H.; Leuschner, C. Vegetation Mitteleuropas mit den Alpen in ökologischer, Dynamischer und Historischer Sicht; UTB: Stuttgart, Germany, 2010. [Google Scholar]
- Bretz, F.; Hothorn, T.; Westfall, P.H. Multiple Comparisons Using R; CRC Press: Boca Raton, FL, USA, 2011; ISBN 978-1-58488-574-0. [Google Scholar]
- Zeileis, A.; Kleiber, C.; Jackman, S. Regression Models for Count Data in R. J. Stat. Softw. 2008, 27, 1–21. [Google Scholar] [CrossRef] [Green Version]
- Sitko, A.; Biecek, P. The Merging Path Plot: Adaptive fusing of k-groups with likelihood-based model selection. arXiv 2017, arXiv:1709.04412. [Google Scholar]
- Biecek, P. DALEX: Explainers for Complex Predictive Models in R. J. Mach. Learn. Res. 2018, 19, 3245–3249. [Google Scholar]
- Lepš, J.; Hadincová, V. How reliable are our vegetation analyses? J. Veg. Sci. 1992, 3, 119–124. [Google Scholar] [CrossRef]
- Holeksa, J.; Woźniak, G. Biased vegetation patterns and detection of vegetation changes using phytosociological databases. A case study in the forests of the Babia Góra National Park (the West Carpathians, Poland). Phytocoenologia 2005, 35, 1–18. [Google Scholar] [CrossRef]
- Bigelow, S.W.; Canham, C.D. Community organization of tree species along soil gradients in a north-eastern USA forest. J. Ecol. 2002, 90, 188–200. [Google Scholar] [CrossRef] [Green Version]
- Barney, J.N.; Tekiela, D.R.; Barrios-Garcia, M.N.; Dimarco, R.D.; Hufbauer, R.A.; Leipzig-Scott, P.; Nuñez, M.A.; Pauchard, A.; Pyšek, P.; Vítková, M.; et al. Global Invader Impact Network (GIIN): Toward standardized evaluation of the ecological impacts of invasive plants. Ecol. Evol. 2015, 5, 2878–2889. [Google Scholar] [CrossRef] [PubMed]
- Dyderski, M.K.; Jagodziński, A.M. Low impact of disturbance on ecological success of invasive tree and shrub species in temperate forests. Plant Ecol. 2018, 219, 1369–1380. [Google Scholar] [CrossRef] [Green Version]
- Lososová, Z.; Chytrý, M.; Danihelka, J.; Tichý, L.; Ricotta, C. Biotic homogenization of urban floras by alien species: The role of species turnover and richness differences. J. Veg. Sci. 2016, 27, 452–459. [Google Scholar] [CrossRef]
- Olden, J.D.; Comte, L.; Giam, X. The Homogocene: A research prospectus for the study of biotic homogenisation. NeoBiota 2018, 37, 23–36. [Google Scholar] [CrossRef] [Green Version]
- Pairon, M.; Chabrerie, O.; Casado, C.M.; Jacquemart, A.-L. Sexual regeneration traits linked to black cherry (Prunus serotina Ehrh.) invasiveness. Acta Oecologica 2006, 30, 238–247. [Google Scholar] [CrossRef]
- Dylewski, Ł.; Kurek, P.; Wiatrowska, B.; Jerzak, L.; Tryjanowski, P. Man-made perching sites—Electricity pylons accelerate fleshy-fruited plants succession in farmlands. Flora 2017, 231, 51–56. [Google Scholar] [CrossRef]
- Wróbel, A.; Zwolak, R. Habitat-dependent seed dispersal of an introduced tree species by native rodents. For. Ecol. Manag. 2019, 433, 563–568. [Google Scholar] [CrossRef]
- González-Moreno, P.; Diez, J.M.; Ibáñez, I.; Font, X.; Vilà, M. Plant invasions are context-dependent: Multiscale effects of climate, human activity and habitat. Divers. Distrib. 2014, 20, 720–731. [Google Scholar] [CrossRef] [Green Version]
- Dyderski, M.K.; Jagodziński, A.M. Context-Dependence of Urban Forest Vegetation Invasion Level and Alien Species’ Ecological Success. Forests 2019, 10, 26. [Google Scholar] [CrossRef] [Green Version]
- Sapsford, S.J.; Brandt, A.J.; Davis, K.T.; Peralta, G.; Dickie, I.A.; Gibson, R.D.; Green, J.L.; Hulme, P.E.; Nuñez, M.A.; Orwin, K.H.; et al. Towards a framework for understanding the context-dependence of impacts of non-native tree species. Funct. Ecol. 2020. [Google Scholar] [CrossRef]
- Zerbe, S.; Wirth, P. Non-indigenous plant species and their ecological range in Central European pine (Pinus sylvestris L.) forests. Ann. For. Sci. 2006, 63, 189–203. [Google Scholar] [CrossRef] [Green Version]
- Felton, A.; Lindbladh, M.; Brunet, J.; Fritz, Ö. Replacing coniferous monocultures with mixed-species production stands: An assessment of the potential benefits for forest biodiversity in northern Europe. For. Ecol. Manag. 2010, 260, 939–947. [Google Scholar] [CrossRef]
- Knight, K.S.; Oleksyn, J.; Jagodziński, A.M.; Reich, P.B.; Kasprowicz, M. Overstorey tree species regulate colonization by native and exotic plants: A source of positive relationships between understorey diversity and invasibility. Divers. Distrib. 2008, 14, 666–675. [Google Scholar] [CrossRef]
- Jordano, P.; Schupp, E.W. Seed disperser effectiveness: The quantity component and patterns of seed rain for Prunus mahaleb. Ecol. Monogr. 2000, 70, 591–615. [Google Scholar] [CrossRef]
- Closset-Kopp, D.; Chabrerie, O.; Valentin, B.; Delachapelle, H.; Decocq, G. When Oskar meets Alice: Does a lack of trade-off in r/K-strategies make Prunus serotina a successful invader of European forests? For. Ecol. Manag. 2007, 247, 120–130. [Google Scholar] [CrossRef]
- Halarewicz, A.; Żołnierz, L. Changes in the understorey of mixed coniferous forest plant communities dominated by the American black cherry (Prunus serotina Ehrh.). For. Ecol. Manag. 2014, 313, 91–97. [Google Scholar] [CrossRef]
- Piwczyński, M.; Puchałka, R.; Ulrich, W. Influence of tree plantations on the phylogenetic structure of understorey plant communities. For. Ecol. Manag. 2016, 376, 231–237. [Google Scholar] [CrossRef]
- Stagne, E.E.; Shea, K.L. Effects of Deer Browsing, Fabric Mats, and Tree Shelters on Quercus rubra Seedlings. Restor. Ecol. 1998, 6, 29–34. [Google Scholar]
Figure 1.
Example scheme of the study plot blocks (21 blocks, each composed of nine plots). Adapted from Dyderski & Jagodziński [26,64,68].

Figure 2.
Results of detrended correspondence analysis (DCA) analysis based on natural regeneration densities of 186 study plots (λ – eigenvalue). Arrows indicate gradients of soil pH (r2 = 0.048, p = 0.017), soil C:N (r2 = 0.001, p = 0.947) and DIFN (diffusive non-interceptance; r2 = 0.0564, p = 0.010). Solid line ellipses indicate area of 50% of the points, dashed line – of 95% of points. Italic labels indicate centoids of species scores (abbreviations from the first three letters from binomial names); black color indicates native species, and red – alien species.

Figure 3.
Mean (± SE) values of diversity indices (PD—phylogenetic diversity, MPD—mean pairwise distance, MNTD—mean nearest taxon distance, FRic—functional richness, FDis—functional dispersion, FEve—functional evenness, FDiv—functional divergence) within studied forest types. Letters denote groups which did not differ at confidence level α = 0.05 after multiple hypotheses adjustment (see Table S1), n.a. indicates that forest type has been not included in the final model for a particular variable.

Figure 4.
Mean (± SE) predicted density (ind. 200 m−2) of the most frequent native tree (first three rows) and shrub (last two rows) species within studied forest types. Letters denote groups for which predicted responses did not differ at confidence level α = 0.05 after likelihood ratio tests (for full models see Table S2).

Table 1.
Overview of forest types (n = 186) and summary statistics of measured variables: mean ± SE (min-max).
Table 1.
Overview of forest types (n = 186) and summary statistics of measured variables: mean ± SE (min-max).
| Type | n | DIFN | Soil pH | Soil C:N | Dominant Tree Species |
|---|---|---|---|---|---|
| Fagus | 10 | 0.024 ± 0.003 (0.012–0.045) | 4.06 ± 0.10 (3.64–4.64) | 40.85 ± 2.94 (29.89–58.55) | Fagus sylvatica |
| Pinus plantation | 52 | 0.031 ± 0.005 (0.007–0.251) | 4.31 ± 0.10 (3.71–6.65) | 38.71 ± 0.91 (26.42–57.15) | Pinus sylvestris, Acer pseudoplatanus, Quercus petraea |
| Pinus plantation-Ps | 20 | 0.039 ± 0.006 (0.010–0.111) | 4.13 ± 0.06 (3.78–4.86) | 37.31 ± 1.04 (29.43–48.93) | P. sylvestris, A. pseudoplatanus, Q. petraea |
| Pinus poor | 10 | 0.102 ± 0.018 (0.024–0.168) | 3.93 ± 0.04 (3.76–4.16) | 40.93 ± 1.27 (34.75–47.57) | P. sylvestris |
| Pinus poor-Ps | 23 | 0.075 ± 0.009 (0.019–0.151) | 4.20 ± 0.07 (3.78–5.06) | 43.08 ± 1.25 (31.91–54.44) | P. sylvestris |
| Q. petraea | 25 | 0.057 ± 0.006 (0.017–0.120) | 3.91 ± 0.04 (3.56–4.32) | 42.77 ± 1.16 (30.26–51.32) | Q. petraea |
| Q. rubra | 12 | 0.039 ± 0.005 (0.013–0.078) | 4.21 ± 0.12 (3.67–5.16) | 48.52 ± 2.26 (32.75–61.92) | Q. rubra |
| Quercus-Acer-Tilia | 24 | 0.024 ± 0.001 (0.007–0.034) | 5.64 ± 0.20 (3.95–7.10) | 36.77 ± 1.13 (26.10–47.06) | Q. petraea, A. platanoides, A. pseuodoplatanus, Tilia cordata, Carpinus betulus |
| Robinia | 10 | 0.020 ± 0.002 (0.014–0.035) | 5.66 ± 0.36 (3.79–6.89) | 29.19 ± 1.24 (25.38–35.49) | Robinia pseudoacacia, Ulmus minor |
DIFN—diffuse non-interceptance, measure of light availability (dimensionless). Type with ‘- Ps’ indicates Prunus serotina invasion; n—number of replications per type, SE—standard error.
© 2020 by the authors. Licensee MDPI, Basel, Switzerland. This article is an open access article distributed under the terms and conditions of the Creative Commons Attribution (CC BY) license (http://creativecommons.org/licenses/by/4.0/).
Share and Cite
MDPI and ACS Style
Dyderski, M.K.; Jagodziński, A.M. Impact of Invasive Tree Species on Natural Regeneration Species Composition, Diversity, and Density. Forests 2020, 11, 456. https://0-doi-org.brum.beds.ac.uk/10.3390/f11040456
AMA Style
Dyderski MK, Jagodziński AM. Impact of Invasive Tree Species on Natural Regeneration Species Composition, Diversity, and Density. Forests. 2020; 11(4):456. https://0-doi-org.brum.beds.ac.uk/10.3390/f11040456
Chicago/Turabian StyleDyderski, Marcin K., and Andrzej M. Jagodziński. 2020. "Impact of Invasive Tree Species on Natural Regeneration Species Composition, Diversity, and Density" Forests 11, no. 4: 456. https://0-doi-org.brum.beds.ac.uk/10.3390/f11040456
Note that from the first issue of 2016, this journal uses article numbers instead of page numbers. See further details here.