Modeling and Monitoring of Wood Moisture Content Using Time-Domain Reflectometry


1
Warnell School of Forestry and Natural Resources, University of Georgia, Athens , GA 30602, USA
2
Department of Wood Science and Engineering, College of Forestry, Oregon State University, Corvallis, OR 97331, USA
3
National Council for Air and Stream Improvement (NCASI), Aubrey, TX 76227, USA
*
Author to whom correspondence should be addressed.
Forests 2020, 11(4), 479; https://0-doi-org.brum.beds.ac.uk/10.3390/f11040479
Submission received: 6 April 2020
/
Revised: 20 April 2020
/
Accepted: 22 April 2020
/
Published: 24 April 2020
(This article belongs to the Section Wood Science and Forest Products)
Abstract
:Time-domain reflectometry (TDR) can monitor the moisture content (MC) of water saturated logs stored in wet-decks where the MC exceeds the range that can be measured using traditional moisture meters (>50%). For this application to become routine, it is required that TDR monitoring of wet-decks occurs after establishment, and tools are needed that automate data collection and analysis. We developed models that predict wood MC using three-rod epoxy encased TDR probes inserted into the transverse surface of bolts (prior wet-deck studies were installed on the tangential surface). Models were developed for southern pine, sweetgum, yellow poplar, hickory, red oak, and white oak using a Campbell Scientific TDR100. For each species, at least 37 bolts were soaked for a minimum of three months and then air dried with TDR waveforms, and MC was periodically recorded. Calibrations were developed between MC and the TDR signal using nonlinear mixed effects models. Fixed effects ranged from excellent (southern pine R2 = 0.93) to poor (red oak R2 = 0.36, hickory R2 = 0.38). Independent of wood species, random effects all had a R2 greater than 0.80, which indicates that TDR detects changes in MC at the individual sample level. Use of TDR combined with a datalogger was demonstrated in an operational wet-deck that monitored changes in MC over 12 months, and in a laboratory trial where bolts were exposed to successive wet-dry cycles over 400 days. Both applications demonstrated the utility of TDR to monitor changes in wood MC in high MC environments where periodic measurement is not feasible due to operational safety concerns. Because a saturated TDR reading indicates a saturated MC, and because of the relatively accurate random effects found here, developing individual species models is not necessary for monitoring purposes. Therefore, application of TDR monitoring can be broadly applied for wet-decks, regardless of the species stored.
1. Introduction
The pulp and paper industry in the southeastern United States stores extra wood either onsite or in satellite wood yards. The purpose of this stored material is to ensure that manufacturing facilities maintain enough raw material to maintain production if wood deliveries are interrupted owing to weather, seasonal logging difficulties, or other unforeseeable disruptions in the fiber supply chain. In the southeastern US, these disruptions typically occur during the winter and spring seasons, when evapotranspiration is reduced and rainfall increased, which creates unfavorable forest soil conditions that are not conducive to sustainable forest management practices [1]. To limit impacts to forest soils and water quality, logging operations generally do not occur during these wet periods, which subsequently results in disruption of roundwood fiber deliveries to mills in the region. Except for periods of planned maintenance, pulp and paper facilities run 24 hours a day and 7 days a week, and any disruption that would shut a mill down would cause both significant financial costs and environmental impacts.
Depending on the expected period of time wood will be kept, logs are either “dry-stored” or “wet-stored”. In general, if logs are retained for periods beyond 2–3 weeks, they are wet-stored [2]. Before the 1940s, wood was stored in large ponds with high maintenance and removal costs [3]. In later years, this method was abandoned for a simpler alternative; spraying water over logs with commercially available irrigation sprinklers. Continuous water spray maintains log quality by preventing fiber degradation since application of water to logs creates anaerobic conditions within the wood, preventing fungal degradation [4]. Wet-storage areas are generally referred to by industry as “wet-decks” or “wet-yards.” Pulp and paper producing facilities are large users of wood with an average mill in the Southeast US consuming 6800 tons of roundwood per day [5]. In order for wet-decks to effectively supplement a mills’ daily fiber needs, they must be of sufficient capacity. We estimate that approximately 17 million tons of roundwood are stored annually in the southeastern US by the pulp and paper industry.
Water at wet-deck facilities is usually pumped from an underground aquifer or directly from a surface water source, and then stored in a holding or retention pond, which serves as the supply and recollection center for all water sprayed on-site. A continuously operating system of pumps deliver water from a holding pond through a pipe and sprinkler network. Though much of the water is recycled through a series of ditches returning runoff to the retention pond, a portion of water is lost through evaporation. Currently there are no means of optimizing water delivery systems of wet-storage facilities, primarily because no commercial sensor exists to continuously monitor log moisture at water saturated conditions. Saturated conditions are often higher than the green moisture content of standing trees, and thus are also well above the fiber saturation point (~30%) of wood. It is not practical to periodically measure log moisture content via destructive sampling, due to concerns over employee safety when working on or near a 6 m tall log pile while using a chainsaw. As a result, the long-held paradigm within the industry remains: continuously apply water, approximately 100 mm every day to stored logs, up until the material is used by the mill.
Given the large volume of water applied in wet-decks, it is clearly evident that optimizing water delivery systems of log storage facilities in the Southeast will result in decreases in water and energy use. Commercially available wood moisture content sensors are abundant but focus on typical moisture contents for forest products used in-service, that being less than 30 percent moisture content (dry-basis), with some sensors able to measure up to a maximum of 50 percent [6]. Conversely, wood stored in wet-decks has an abundance of water well above the capabilities of today’s commercially available sensors. To this end, our recent research has focused on the use of time-domain reflectometry (TDR) to estimate the high moisture contents encountered in water saturated logs stored in wet-decks [7,8,9] and standing trees [10].
TDR is frequently used to detect faults in cables by measuring changes in velocity and thus time required to send a signal along a length of cable; changes in impedance of the signal are also measured [11,12]. For example, a coaxial cable with impedance of 50 Ω that has water contacting the cable along the length will have lower impedance and slower velocity at the points where water is contacting the cable. Soil scientists have utilized TDR to estimate soil water content and it has since become standard technology for measuring soil moisture [12,13]. To optimize use of TDR to measure soil water content, soil scientists designed and built probes connected to coaxial cables, which contained stainless steel rods encased in epoxy resin, with rods then physically inserted into soil. This design provided durability given their construction, since coaxial cables are relatively fragile, and the material differences provided a means to separate the cable signal from the probe signal, since impedance of the coaxial cable is different from that of the stainless steel probe rods [12]. The time required to travel along the length of the rods is measured, and then compared to actual rod length via:
where tdr is the TDR signal, AL is apparent length determined by TDR, and ML is actual measured rod length; note that TDR devices convert velocity and time to distance. As moisture content increases, time required to travel along the rods increases and thus apparent length increases. Because electrical conductivity increases with moisture content, sensitivity of TDR makes it usable for estimating moisture content in porous materials [13,14,15] because the dielectric constant of water is much higher than soil or wood (εwater = 80 vs. εwood = 2) [16,17]. Beyond the research we have conducted on wood moisture content using TDR, other researchers have conducted work estimating standing tree moisture content [14,15,18,19,20,21,22], and to estimate moisture content of wood in decaying forest logs [18] and check dams [23].
Initial research in developing TDR for wet-deck applications [7] involved drying 39 saturated loblolly pine (Pinus taeda L.) bolts and monitoring changes in apparent length using TDR probes inserted into the bolts. The length of the probe rods was varied (rod lengths of 75, 100 and 125 mm were used) to investigate if longer rods improved the accuracy of TDR measurements. During the drying phase, bolt weight was recorded each time a TDR reading was collected and at the completion of the study, an oven-dry weight was determined, allowing calculation of moisture content of each bolt at each measurement point. The TDR data was strongly related to moisture content over the period of drying, with the longest probe rods (125 mm) providing the best relationship (R2 = 0.94). Longer rods measure more wood, and measurement accuracy issues affect signal accuracy in probes built with shorter rods more so than longer rods. Because the TDR readings were accurate at predicting wood moisture content, it was concluded that the technique could be applied to monitor moisture in logs stored in wet-decks.
Subsequent research sought to understand moisture variability within a southern pine (Pinus spp.) wet-deck and examined probe performance over a period of 11 weeks [8]. The position within the deck relative to sprinkler location and the height within the deck was investigated, as was the position within individual logs (probes were located at distances of 3, 4.5 and 7.5 m from the butt of each log). Analysis indicated the variability of moisture content due to probe position within logs, along with height within the deck. Based on these findings, later studies of operational wet-decks used two probes per log (one near the center of mass of the log, the other near the butt) and examined logs in upper and lower tiers within the deck. A critical finding was the consistent performance of probes over the duration of the study. Roundwood in wet storage typically remains for a period of six to nine months but longer storage times (12–18 months) are not uncommon, hence probe durability was critical.
Initiation of pilot-scale studies within operational wet-decks followed that sought to determine if water application rates could be reduced without negatively impacting log moisture or quality. The first of these studies examined logs in two southern pine wet-decks [24] over a period of 15 months. Time to full saturation (moisture content not increasing) was different for the two sites (approximately 100 and 150 days, respectively) but once saturation was reached, moisture content remained relatively stable for the study’s duration. In addition, a 30% reduction in water application rate (down from 100 mm/day) was operationally feasible. Furthermore, pulping of logs from one study site at 9 and 15 months showed that pulp yield was unaffected by a lower water application rate [25].
The second study examined two hardwood wet-decks [26]. Hardwood wet-decks store a variety of species with those most commonly encountered at the sites examined including sweetgum (Liquidambar styraciflua L.), red and white oak (Quercus spp.), and yellow poplar (Liriodendron tulipifera L.). Models for predicting moisture content based on TDR measures of apparent length were developed for these species. Despite similar model forms, each species had a different maximum moisture content, and hence species-specific models were required. Study duration was 15 months, and again, a 30% reduction in the rate of water application had minimal impact on log moisture and pulp yield (assessed at 9, 12, and 15 months). Few probes failed once installed, despite the extended duration of both studies, however care was required when building a wet-deck that included logs with installed probes to avoid damage.
Work on the operational wet-decks used a TDR system that relied on manual operation whereby an operator connected probes to the TDR system and measured apparent length using an oscilloscope by manually inspecting waveforms. Other methods for finding apparent length include signal processing via two common methods; using derivatives to find the inflection point of the signal, and using tangent lines [27,28]. Figure 1 shows a typical TDR waveform in wet wood (>75% moisture content). The point at which impedance changes indicate when the signal enters the probe head (Xp), the signal leaves the probe head and travels along the length of the rods within wood (Xr), and the two points that usually represent the end of the rod, with Xt being the tangent line, and Xi being the inflection point. Technique differences also result in different models. For example, Dahlen et al. [10] developed an algorithm to automatically analyze TDR traces, with the model being significantly different than models developed by Schimleck et al. [8] (both models were for southern pine). It is clear from examining Figure 1 that distance between the inflection point and tangent line approach results in different TDR values, and this would affect the models. Additionally, probe design affects TDR readings and model results. While probes can be of a number of designs, the most commonly used probes are 2-rod or 3-rod probes. For 2-rod probes, the positive and ground signals of the coaxial cable are connected to one of the rods. It is sometimes recommended that a balancing transformer (balun) be connected to a 2-rod probe [29]. For 3-rod probes, the design mimics the unbalanced nature of coaxial cables, which have a positive signal surround by ground; the positive signal is connected to the inner rod, and the ground is connected to the outer rods [30]. Methodology changes influence model development and thus standardization of equipment and probe design is needed for the technique’s operational adoption if the moisture content is to be reliably estimated.
The TDR and automated signal analysis methodology used by Dahlen et al. [10] would make operational adoption more feasible than the manual waveform analysis employed by Schimleck et al. [8]; however, the system used would still require an experienced user, which is likely not feasible for an operational wet-deck. Commercially available TDR systems for soil have been designed such that analysis of the waveform occurs at the time of measurement, thus simplifying their use. Additionally, some of these systems have multiplexers available such that many probes can be connected to one TDR unit, and dataloggers can control measurement frequency, thus reducing the labor required to measure the TDR signal over time. Operationally, these systems could periodically measure wood moisture content within a deck, with moisture results informing a programmable logic control system that would vary rates of water applied depending on measured log moisture and other environmental variables (i.e., rainfall, solar radiation, air temperature, wind speed and direction, etc.). If moisture content is able to be estimated in wet-decks, consideration of what level should be targeted to prevent wood decay is important. Generally, wood decay is limited when the volume of air within the cell lumen is less than 20% [4]. Assuming the cell wall is saturated with water, the actual amount of moisture content needed to maintain 20% or less air volume is dependent on the specific gravity of the wood and the fiber saturation point [31]. Assuming the fiber saturation point is reached at 30% moisture content, the wood is above the fiber saturation point, and the density of the cell wall is 1.54 g cm−1 [32]. The equation to calculate air volume is:
where Vair is the volume of air within the cell lumen, SG is the specific gravity of the wood, and MC% is the moisture content of the wood [31,32]. Thus, species with a higher specific gravity have less internal air volume at a given moisture content, and thus they require a lower moisture content to prevent deterioration. It is clear from Equation (2) that managing logs to a single moisture content would result in significant decay in some species, and other species would have no decay. For example, a sample with a SG of 0.5 would require a moisture content greater than 95% to maintain air volume in the cell lumen to be less than 20% to minimize wood decay. Given this information, a safer strategy would be to manage a wet-deck to a saturation moisture content for a particular log, and not try to maintain any particular moisture content.
As noted above, equipment or methodology changes require updating the models used to predict moisture content from the TDR signal. Prior models were developed where a TDR probe was installed on the tangential face. Installing on the tangential face likely captures more variability within the wood, but it makes installation of probes much more difficult in industrial wet-decks because probes need to be installed on logs before they are placed in piles. Installing probes on the transverse face allows logs already installed in a wet-deck to be monitored, thus simplifying the operation. Models that are developed should be representative of logs stored in wet-decks, and thus capturing data from many logs is preferable over multiple samples from single logs. Our objective here was to develop calibration models that predict moisture content with the TDR signal for species important to pulp mills in the southeastern US. Species that were included in this study are southern pine, sweetgum, yellow poplar, hickory and pecan (Carya spp.), red oak, and white oak. Given the structure of the data used for developing calibration models, where multiple measurements are conducted over time on an individual bolt, and that bolts are randomly sampled from a population, the modeling framework can be treated as a nonlinear mixed effects model. In this modeling structure, fixed effect model prediction would indicate for the average bolt the accuracy of the TDR reading. We have observed bolt-to-bolt variation in moisture content prediction; however, we have generally found that at the individual bolt level, changes in TDR readings directly track with changes in moisture content. Thus, a high fixed and random effects fit statistic (high R2) would indicate that TDR is tracking closely with changes in moisture content for a particular bolt, even if overall accuracy of moisture content prediction is not high. This would mean that models are not necessarily needed for the application of TDR, since a change in the TDR reading means a change in moisture content. Secondary objectives included using a datalogger controlled TDR connected to many probes through multiplexers in two settings: 1) an operational wet-deck to determine the amount of time it takes for different species to reach a saturated moisture content, and 2) a laboratory simulated drying event followed by rewetting to determine the time to re-saturate bolts.
2. Materials and Methods
2.1. Wood Samples
Wood bolts were collected from our industrial partners who provided individual tree-length logs for sampling. A fresh surface was cut at the butt using a chainsaw, and a bolt approximately 380 mm in length was collected. Bolts were obtained from southern pine (Pinus spp.) (N = 39), sweetgum (Liquidambar styraciflua L.) (N = 39), yellow poplar (Liriodendron tulipifera L.) (N = 40), hickory (Carya spp.) (N = 38), red oak (Quercus spp.) (N = 37), and white oak (Quercus spp.) (N = 45). Southern pine is the only softwood species group in the southeastern US that is frequently pulped. Southern pine stems were most likely loblolly pine given the procurement location (near Augusta GA). Sweetgum and yellow poplar are individual species and commonly referred to as soft hardwoods. Hickory is a species group and includes pecan, red oak is a species group, and white oak is a species group and they are referred to as hard hardwoods. Yellow poplar stems were procured near Madison GA, all other hardwood stems were procured near Augusta GA.
A 20 mm disk was cut from the upper part of each bolt using a Wood-Mizer sawmill (Indianapolis, IN) and used to measure specific gravity [33] and initial moisture content gravimetrically, which was determined after drying at 103 °C until a constant weight was achieved. Each bolt was trimmed to 250 mm length using the sawmill, and then debarked. Bolts were then submerged in water to saturate for a minimum of 3 months, with the water periodically changed.
2.2. Time Domain Reflectometry and Probes
A Campbell Scientific, Inc. (Logan, UT, USA) TDR100 was used throughout the project. This TDR has built-in software that will automatically determine apparent length of probe rods using the tangent line approach. When developing the calibrations, the TDR100 was connected to a single 8-channel multiplexer (SDM8X50) and switched between a grounded channel and a live channel to prevent electrostatic discharge to the TDR unit. When changing probes, the grounded channel was used, and when a reading was to take place, the multiplexer was changed to the probe channel and the measurement conducted. Following measurement, the multiplexer was changed to the grounded channel and the probe changed.
Probes were designed and built following the 3-rod probe shown in Dahlen et al. [10], which followed advice from Robinson et al. [12] (Figure 2). Probes were constructed using 3.2 mm stainless steel rods soldered to a 50 Ω RG58 coaxial cable. Outside rods are connected to the ground wire of the 50 Ω coaxial cable, and the middle rod connected to the signal wire. The length of the rods outside the probe head was 152 mm and the length of the rods within probes was 25 mm. Rods were spaced 25 mm apart, center on center. The cable was soldered to each rod, and then parts were encapsulated in epoxy resin. The length of cable attached to the probe was 1.5 m, and when reading the TDR signal, each probe was connected to an extension cable with length 13.7 m. The total length of the signal path was 15.2 m, which was selected because TDR signal strength changes with cable length, such that a longer cable length results in slightly higher apparent lengths [12]. The maximum length recommended for RG58 cables is approximately 15 m, and it is the cable length that would be typically used in wet-decks.
2.3. Calibration Data Development
Guide holes for probe rods were drilled in saturated bolts prior to probe insertion using a custom-made drilling jig designed to keep the hole spacing consistent and the drill bit at a constant angle. Probes were weighed, and one probe installed per bolt on the transverse face. Drying occurred at ambient conditions within a covered laboratory. Drying time depended on the individual bolt, with readings continuing until bolt weight was consistent over an approximately four-day period. For each sample measurement point, determination of bolt weight and TDR reading took place within a minute of each other, with the probe weight subtracted from the bolt during each reading. For each species, the number of readings collected were: southern pine (1168 readings over 32 days), sweetgum (1169 readings over 32 days), yellow poplar (1298 readings over 63 days), hickory (1194 readings over 63 days), red oak (1207 readings over 63 days), and white oak (1307 readings over 95 days). When a constant weight was reached, the probes were removed from the bolts, which were then oven dried at 103 °C until reaching constant weight. The oven-dry weight of a bolt was then used to calculate moisture content of each bolt for each reading. The oven-dry reading was not measured using TDR because oven drying at 103 °C will result in cable deterioration, which impacts the TDR signal.
2.4. Data Analysis
Statistical analyses and associated graphics were done using the R statistical software environment [34] with RStudio interface [35], nlme package [36], and tidyverse series of packages [37]. The nlme package was used for nonlinear mixed effects modeling, and tidyverse library was used for data wrangling and graphics. Models were compared using fit indices (R2) of the fixed (tdr reading) and random (bolt) effects, and root mean square error (RMSE) values. For plots of predicted moisture content over time in the wet-deck trial and benchtop trial, smoothed lines were drawn on the plots.
2.5. Model Development
Due to the data structure, where multiple measurements are conducted over time on different bolts, nonlinear mixed effects models were constructed to predict moisture content using TDR readings. After visual examination of plots, the model form selected for southern pine, sweetgum, and yellow poplar was the 3-parameter logistic function, which has been used for past TDR models [8,10]:
where tdr is the TDR reading, Asym is the maximum moisture content (asymptote), xmid is the inflection point of the curve, and the scal parameter is the scale parameter, which is related to how steep the curve is. The asymptote term (Asym) was allowed to vary by bolt. For hard hardwoods, the 3-parameter logistic model form did not visually fit the data as there was no asymptotic trend, and fitting the model form to the data did not result in model convergence, so alternative model forms were evaluated. The best option was an exponential model with the form:
where tdr is the TDR reading, and α and β are model parameters. The α term was allowed to vary by bolt. In an effort to improve the TDR models, we also added SG to the models as a linear term after the model parameters were found.
2.6. Application of TDR—Monitoring within A Wet-Deck to Determine Time to Saturation
This application used the automated datalogging capabilities of the Campbell Scientific (Logan UT, USA) TDR100 system to monitor the moisture content of wood stems in an industrial wet-deck near Augusta, GA. The TDR100 was connected to 17 SDM8X50 multiplexers and controlled by a CR800 datalogger powered by a battery and solar panel. The length of cable attached to the TDR probes was a continuous 15.2 m with no connections. To determine climate differences of the actual wet-deck and normal ambient conditions, the temperature and relative humidity were monitored within and nearby the wet-deck using two HMP60-L sensors (Vaisala, Helsinki, Finland).
TDR probes were installed in the transverse face at the butt of tree-length stems from southern pine (N = 12), sweetgum (N = 20), hickory (N = 16), red oak (N = 21), and white oak (N = 6). From a subset of the tree-length logs, TDR probes were also installed 1.3 m from the butt (referred to as breast height probe) on the tangential face, with the breakdown by species as: southern pine (N = 2), sweetgum (N = 11), hickory (N = 7), red oak (N = 4), and white oak (N = 1). The number of stems instrumented varied based on availability, for example, not many white oak logs were on the log trucks and thus were not available, hence the smaller sample size. Prior to installing a transverse face probe, a 25 mm disk was cut from the butt using a chainsaw, which was used to determine initial SG and to prepare a fresh surface for probe installation. For the breast height probe, bark was removed and a flat surface machined on the log surface. Guide holes were then drilled and probes inserted using the same methodology described above. Silicone caulk was applied around the probe to prevent water from penetrating under the probe head, which could contact probe rods, overinflating the prediction of moisture content. Logs were spaced approximately 15 m apart between two sprinkler heads and were located on the top of the pile (the worst-case scenario) or in the middle to represent average conditions. Logs were placed in approximately equal distribution by species in these locations, except for the southern pine logs, which were all placed on top. This was done because southern pine and hardwoods are not stored together, and thus the southern pine logs were placed on top so they could be removed first when the pile was dismantled.
Installation of probes occurred in December 2016, at which point the wet-deck had been built up to about 75% of its final height. In January 2017 after the wet-deck was completely built, the datalogger system was turned on along with the sprinklers. The datalogger system was programmed to collect TDR readings every day at approximately 2 pm, and temperature and relative humidity were measured every 15 minutes both within and outside the wet-deck.
The system ran until December 2017, at which point the datalogger system was turned off and probes removed. Time required to reach what appeared to be saturated conditions where moisture content was not increasing was estimated for each species, along with differences between location within the pile (top or in the middle), and differences between butt and breast height readings. A disk was cut from each log to determine post storage SG. A comparison was made between pre- and post- SG to estimate if any wood decay may have occurred. In cases where SG was higher after wet-deck storage, which likely occurred due to within-log variability, post storage SG was set equal to pre storage SG. Analysis of variance and Tukey’s significant differences at the 0.05 significance level were used to determine significant differences in SG changes by species and by location of log within the pile (top vs. middle).
2.7. Application of TDR—Monitoring Bolts During Drying and Re-Wetting
This application used the same automated datalogging capabilities of the TDR100 system described above. Our purpose was to determine the time necessary to saturate bolts following drying, as industry was interested in knowing if stems will re-saturate in the event that water was not able to be applied to a wet-deck for an extended period of time, for example, in the event of an unexpected equipment failure. Fresh bolts (six per species) were acquired from the butt of tree-length stems from southern pine, sweetgum, hickory, red oak, and white oak. A 25 mm disk was cut from each bolt using a Wood-Mizer sawmill to determine initial SG, and bolts were cut to 203 mm in length. Bolts were soaked underwater for at least 3 months and water was changed periodically (approximately once per month) and the tank level was periodically topped up to account for evaporation. Following soaking, the tank was drained and bolts were placed upright and then air-dried. A TDR probe was installed on the upper transverse face using the methodology described in Section 2.6. The length of cable attached to the TDR probes was a continuous 15.2 m with no connections. TDR readings occurred every day at approximately 2 pm. Following the drying phase, the tank was refilled with water, taking care to not have the water go over the top of the bolt. This methodology was employed because we observed in an earlier trial run that after drying, bolts were sufficiently cracked so that when water was applied, initial TDR readings showed very high moisture contents. This is because water penetrates the cracks and can make direct contact with the TDR probes, thus overinflating predictions of moisture content. Following this wetting phase, a second drying / wetting cycle was performed. At the end of the study (approximately 400 days), another disk was cut from each bolt and final SG was determined. A comparison was made between SG at the start and conclusion of the study to assess any wood decay that may have occurred. As noted in Section 2.6, when SG was higher after soaking, it was treated as set equal to the SG at the start of the trial.
3. Results
3.1. Summary Information on Calibration Samples
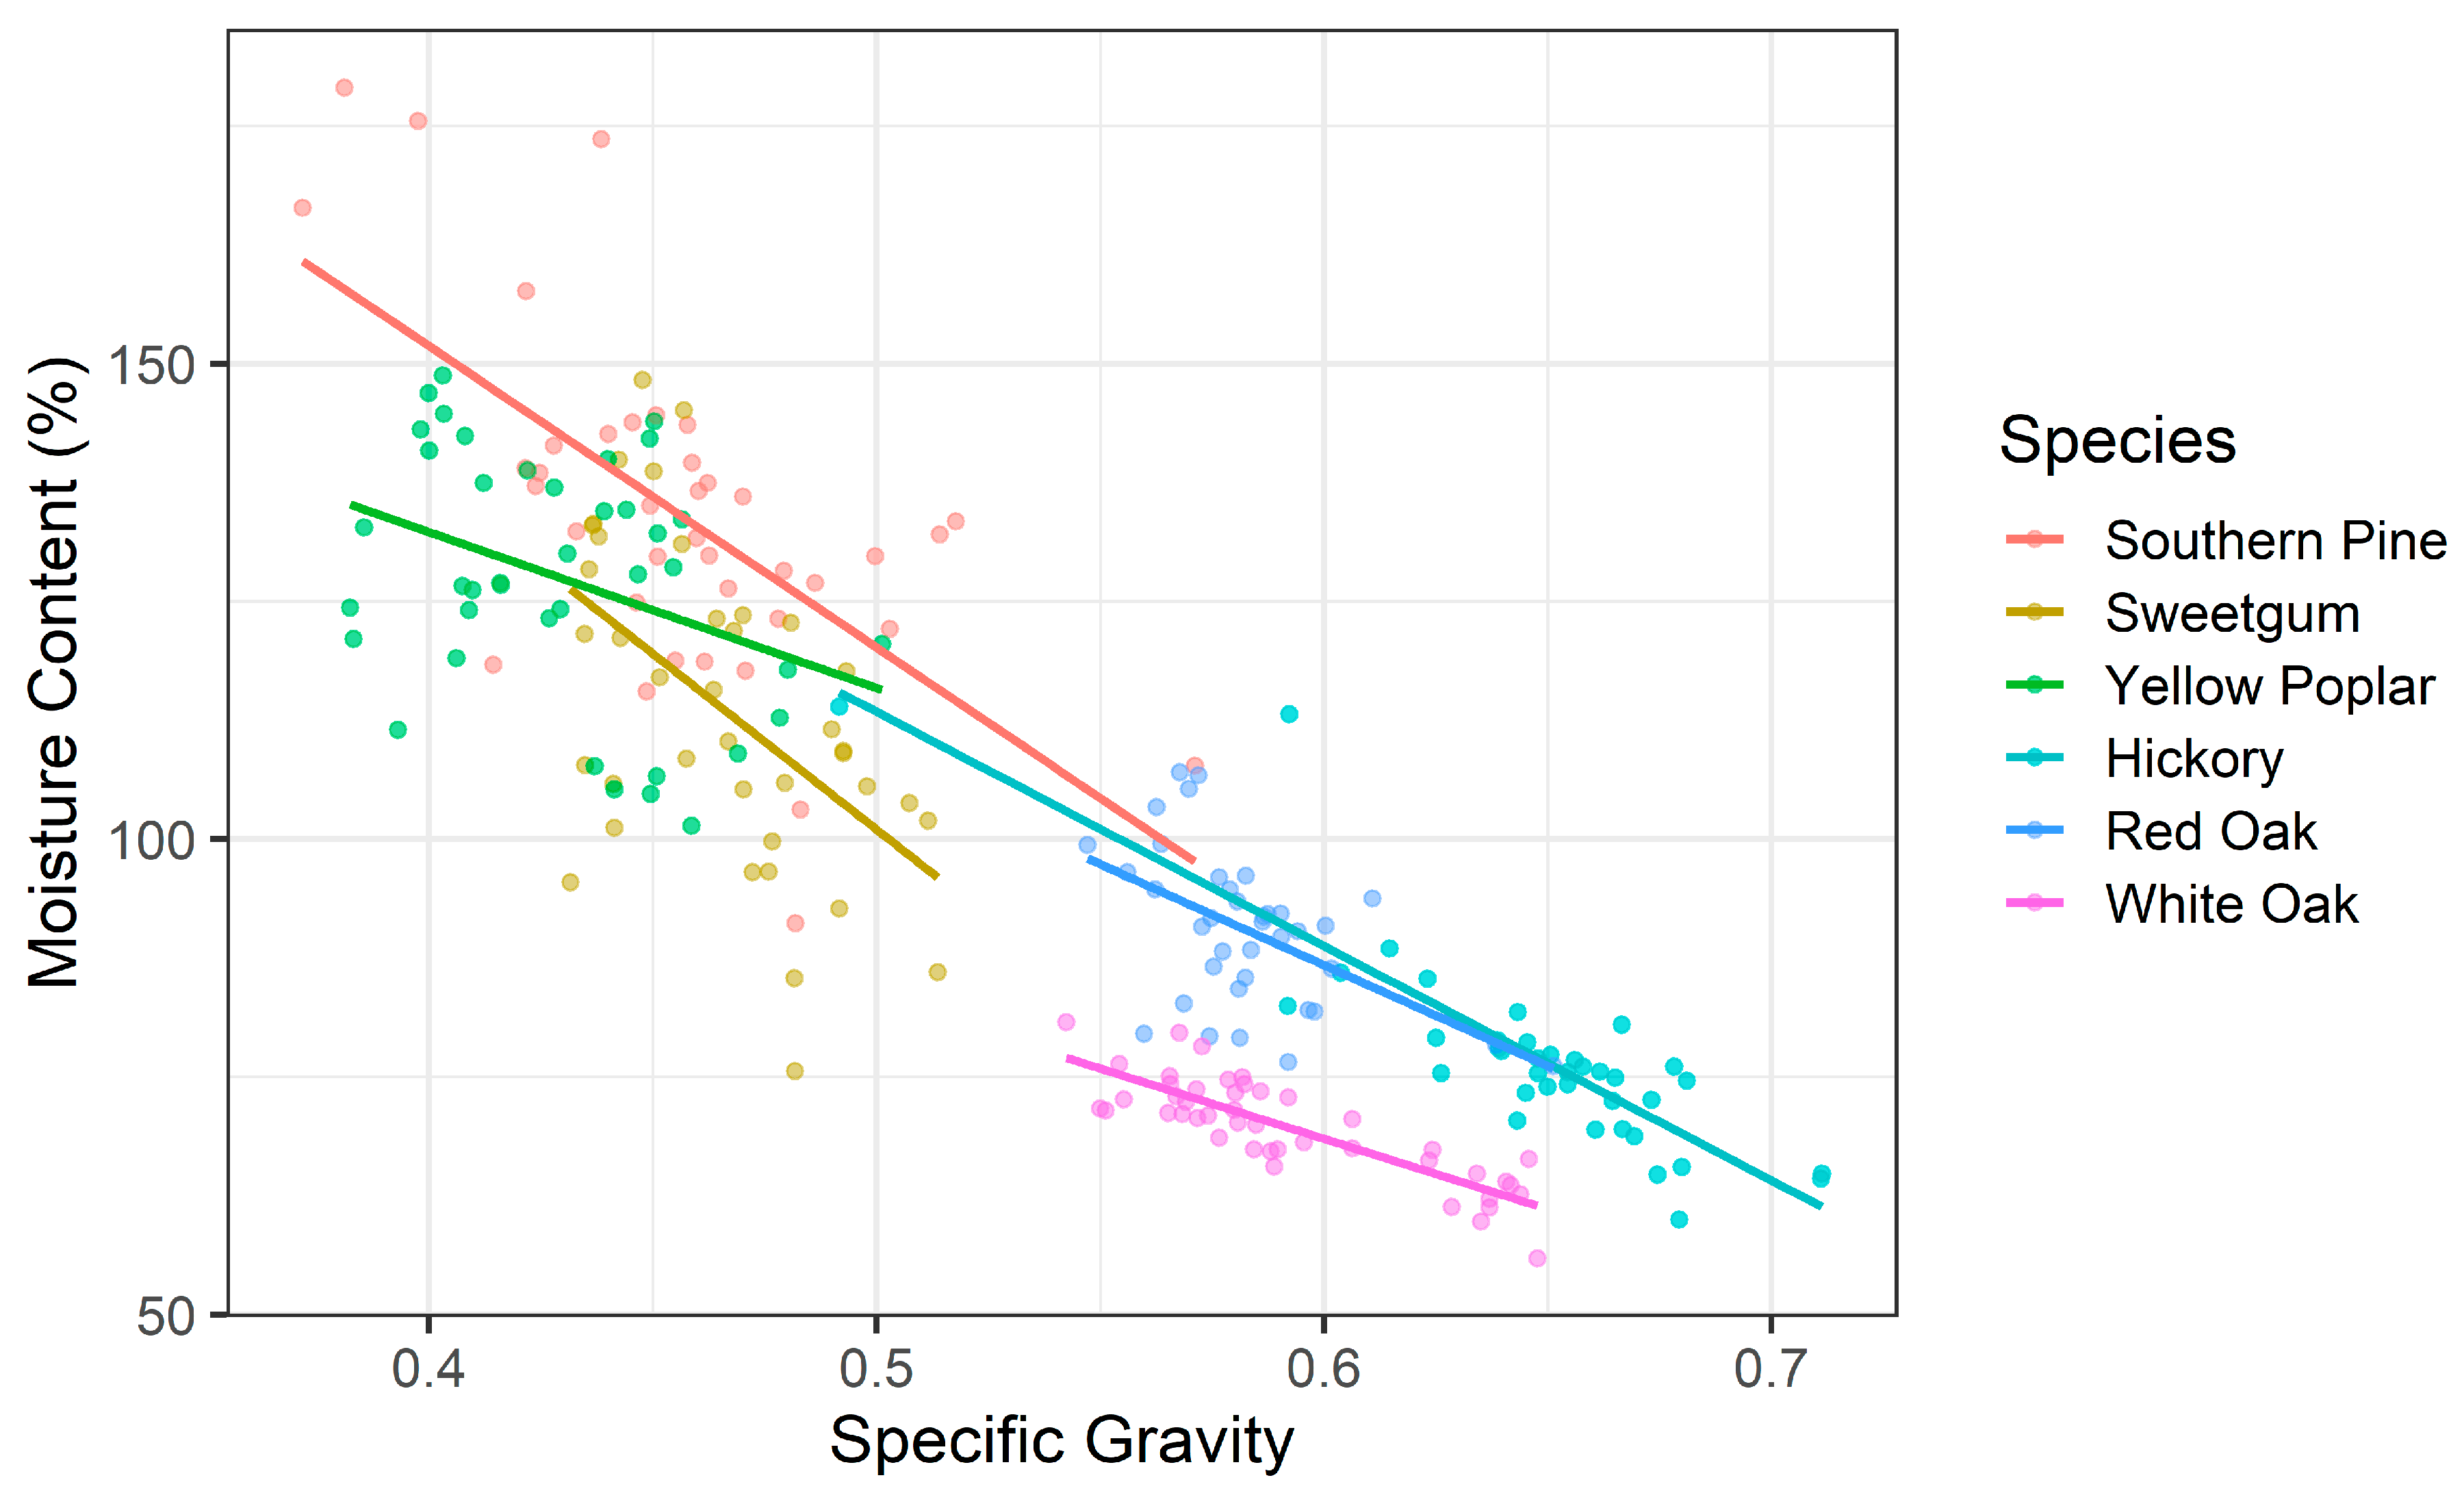
Table 1 shows the variation in diameter, SG, and MC following soaking for the samples used to develop the calibration models. The samples showed significant variability in their diameters. The MC obtained after soaking tracked well with SG, with all species having a lower MC for a higher SG, although slope and intercept of lines varied by species. Figure 3 shows relationships between MC and SG.
3.2. Models That Predict Moisture Content Using Time-Domain Reflectometry
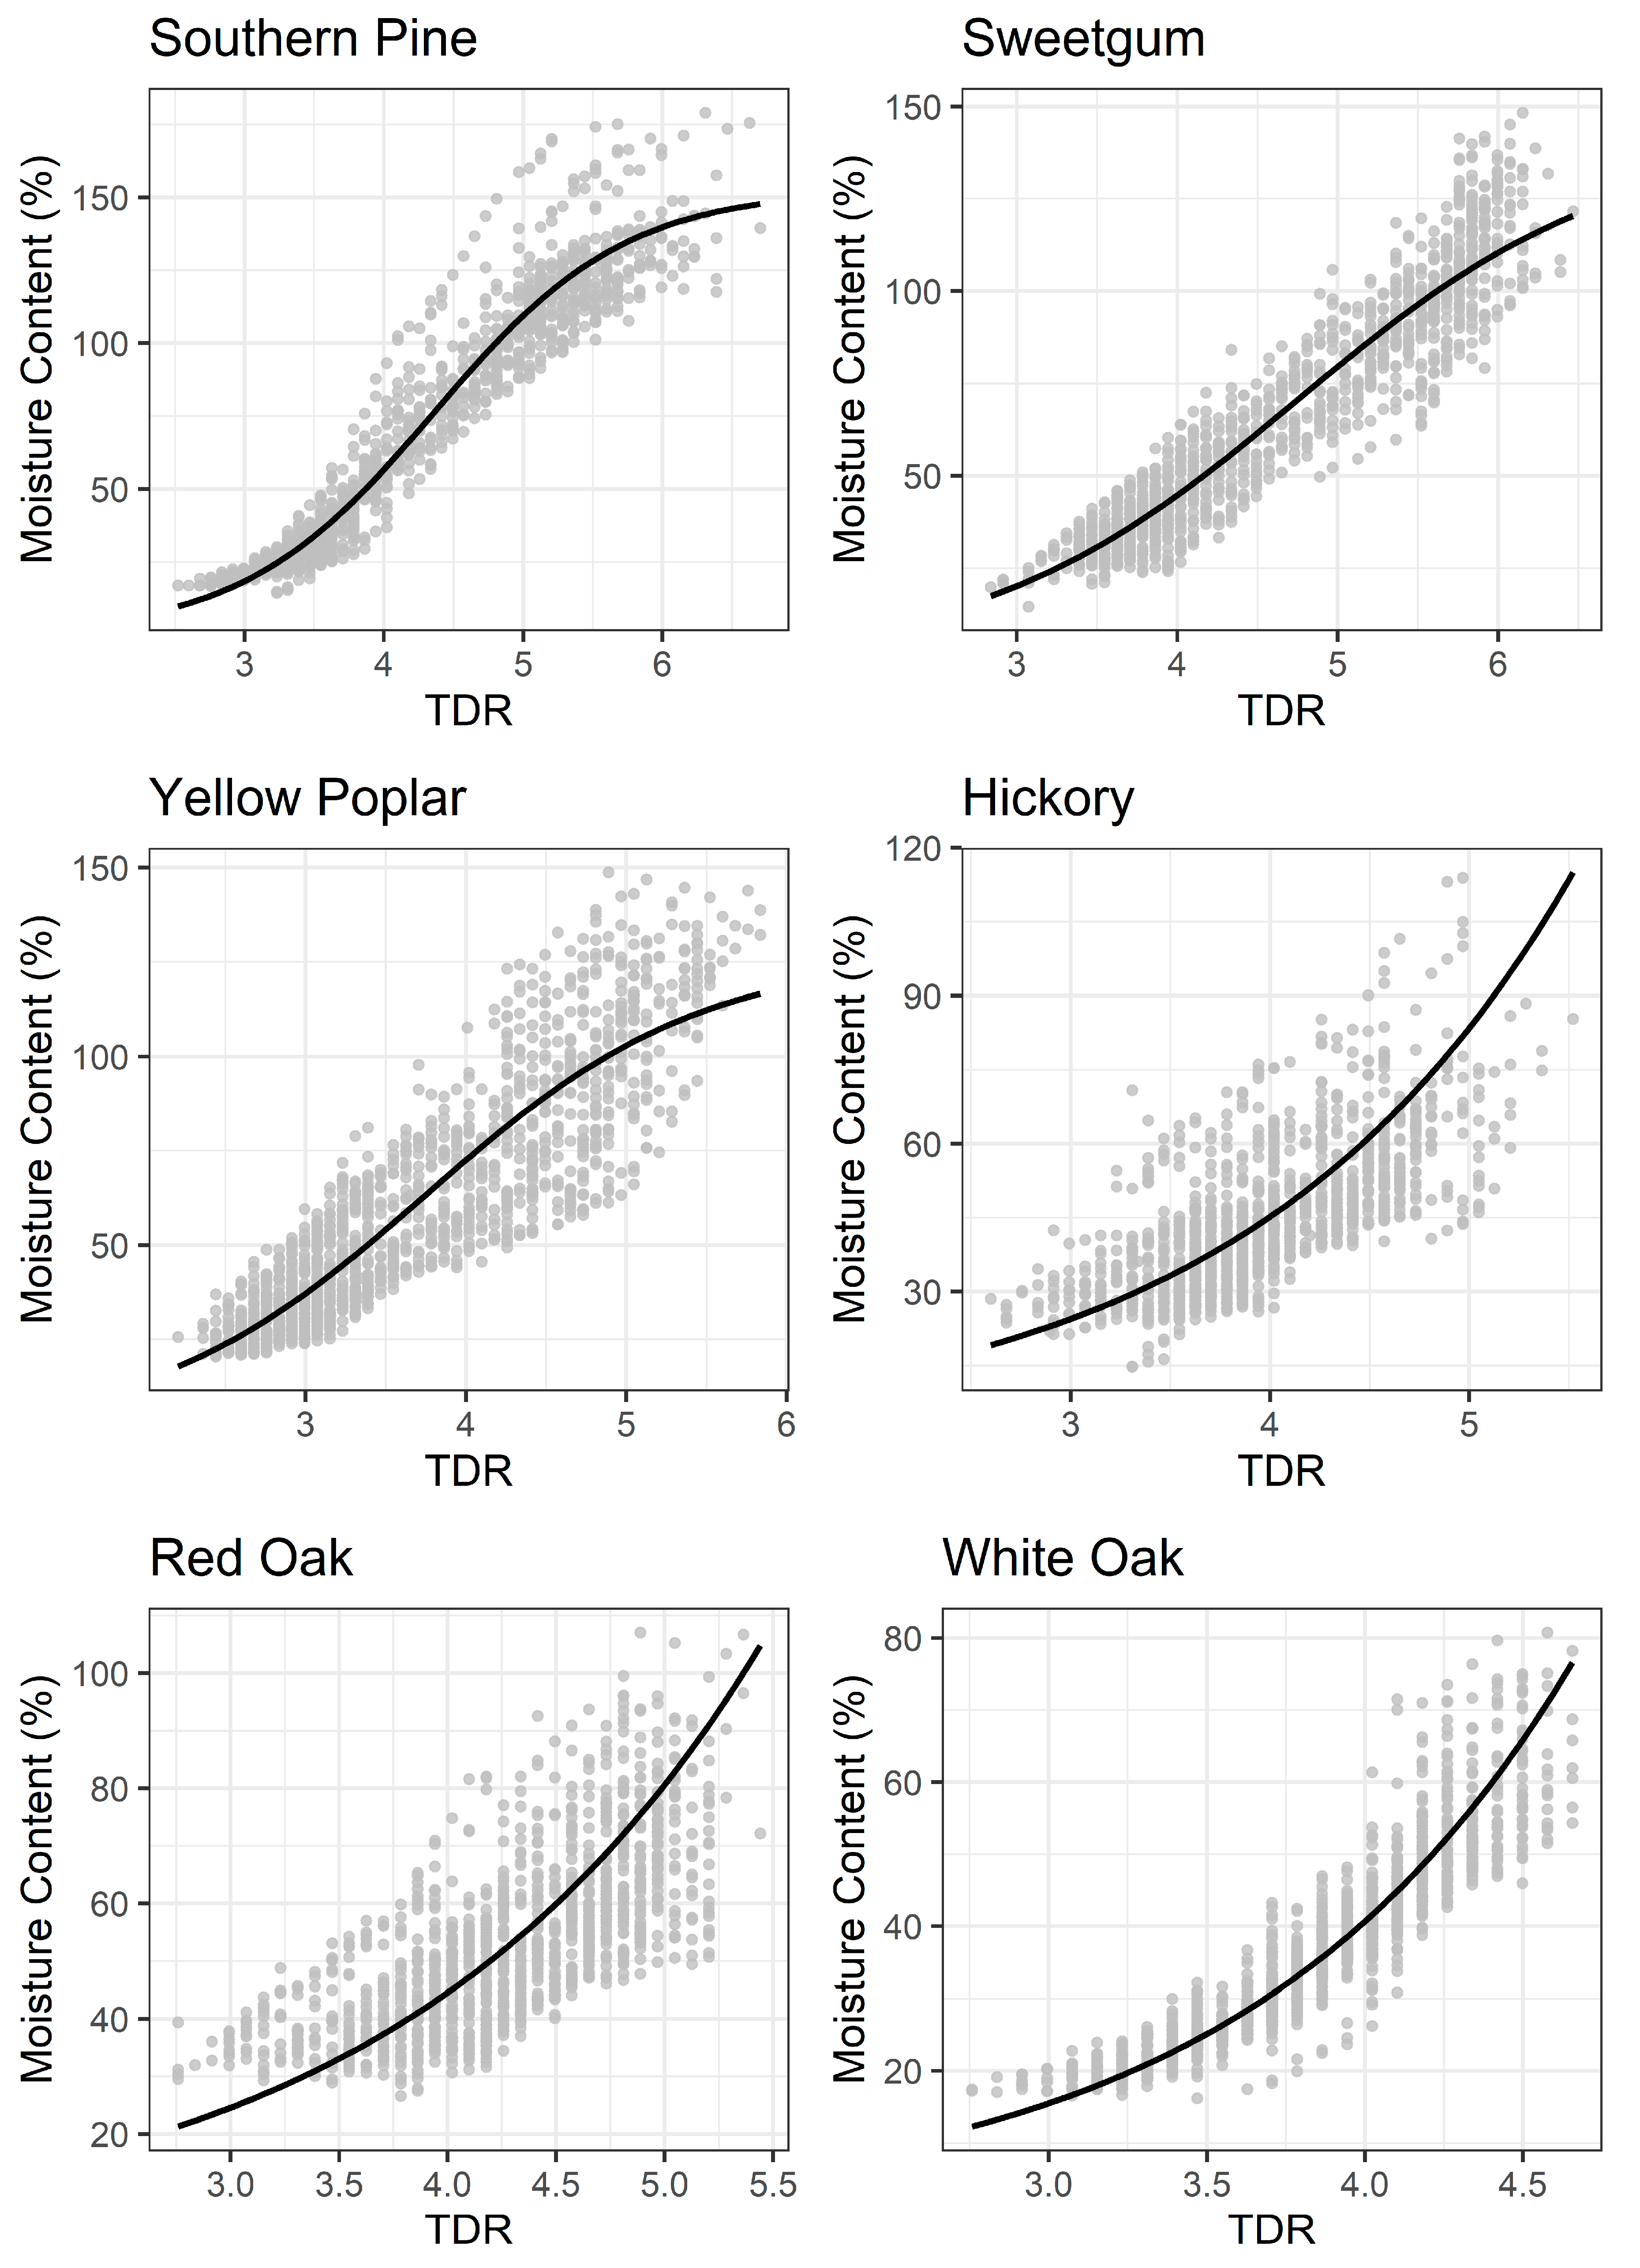
The model parameters and fit statistics are shown in Table 2. Coefficient of determination (R2) values for fixed effects ranged from 0.36 for red oak to 0.93 for southern pine. Soft hardwood models had similar performance to southern pine with R2 ranging from 0.78 (yellow poplar) to 0.88 (sweetgum). Hard hardwoods had more variable performance, with hickory and red oak having low R2 values (0.38 and 0.36, respectively), while white oak performed well (R2 = 0.83). Examining R2 values with random effects included improved model performance with a low R2 of 0.81 for red oak to a high R2 for 0.99 for southern pine. These very strong values provide quantitative data to show that within an individual sample there is little error in the TDR measurement, i.e., as moisture content decreases, TDR readings decrease, and as moisture content increases, TDR readings increase. Figure 4 shows a plot of MC vs. TDR readings for each species. Adding SG as a linear term was not significant for southern pine, sweetgum, yellow poplar, or white oak. The SG term was significant for hickory and red oak, but the improvement in the fixed effects was small for both species (R2 = 0.01); however, the linear parameter was similar for hickory (−2.69) and red oak (−2.58).
3.3. Monitoring Moisture Content in a Wet-Deck
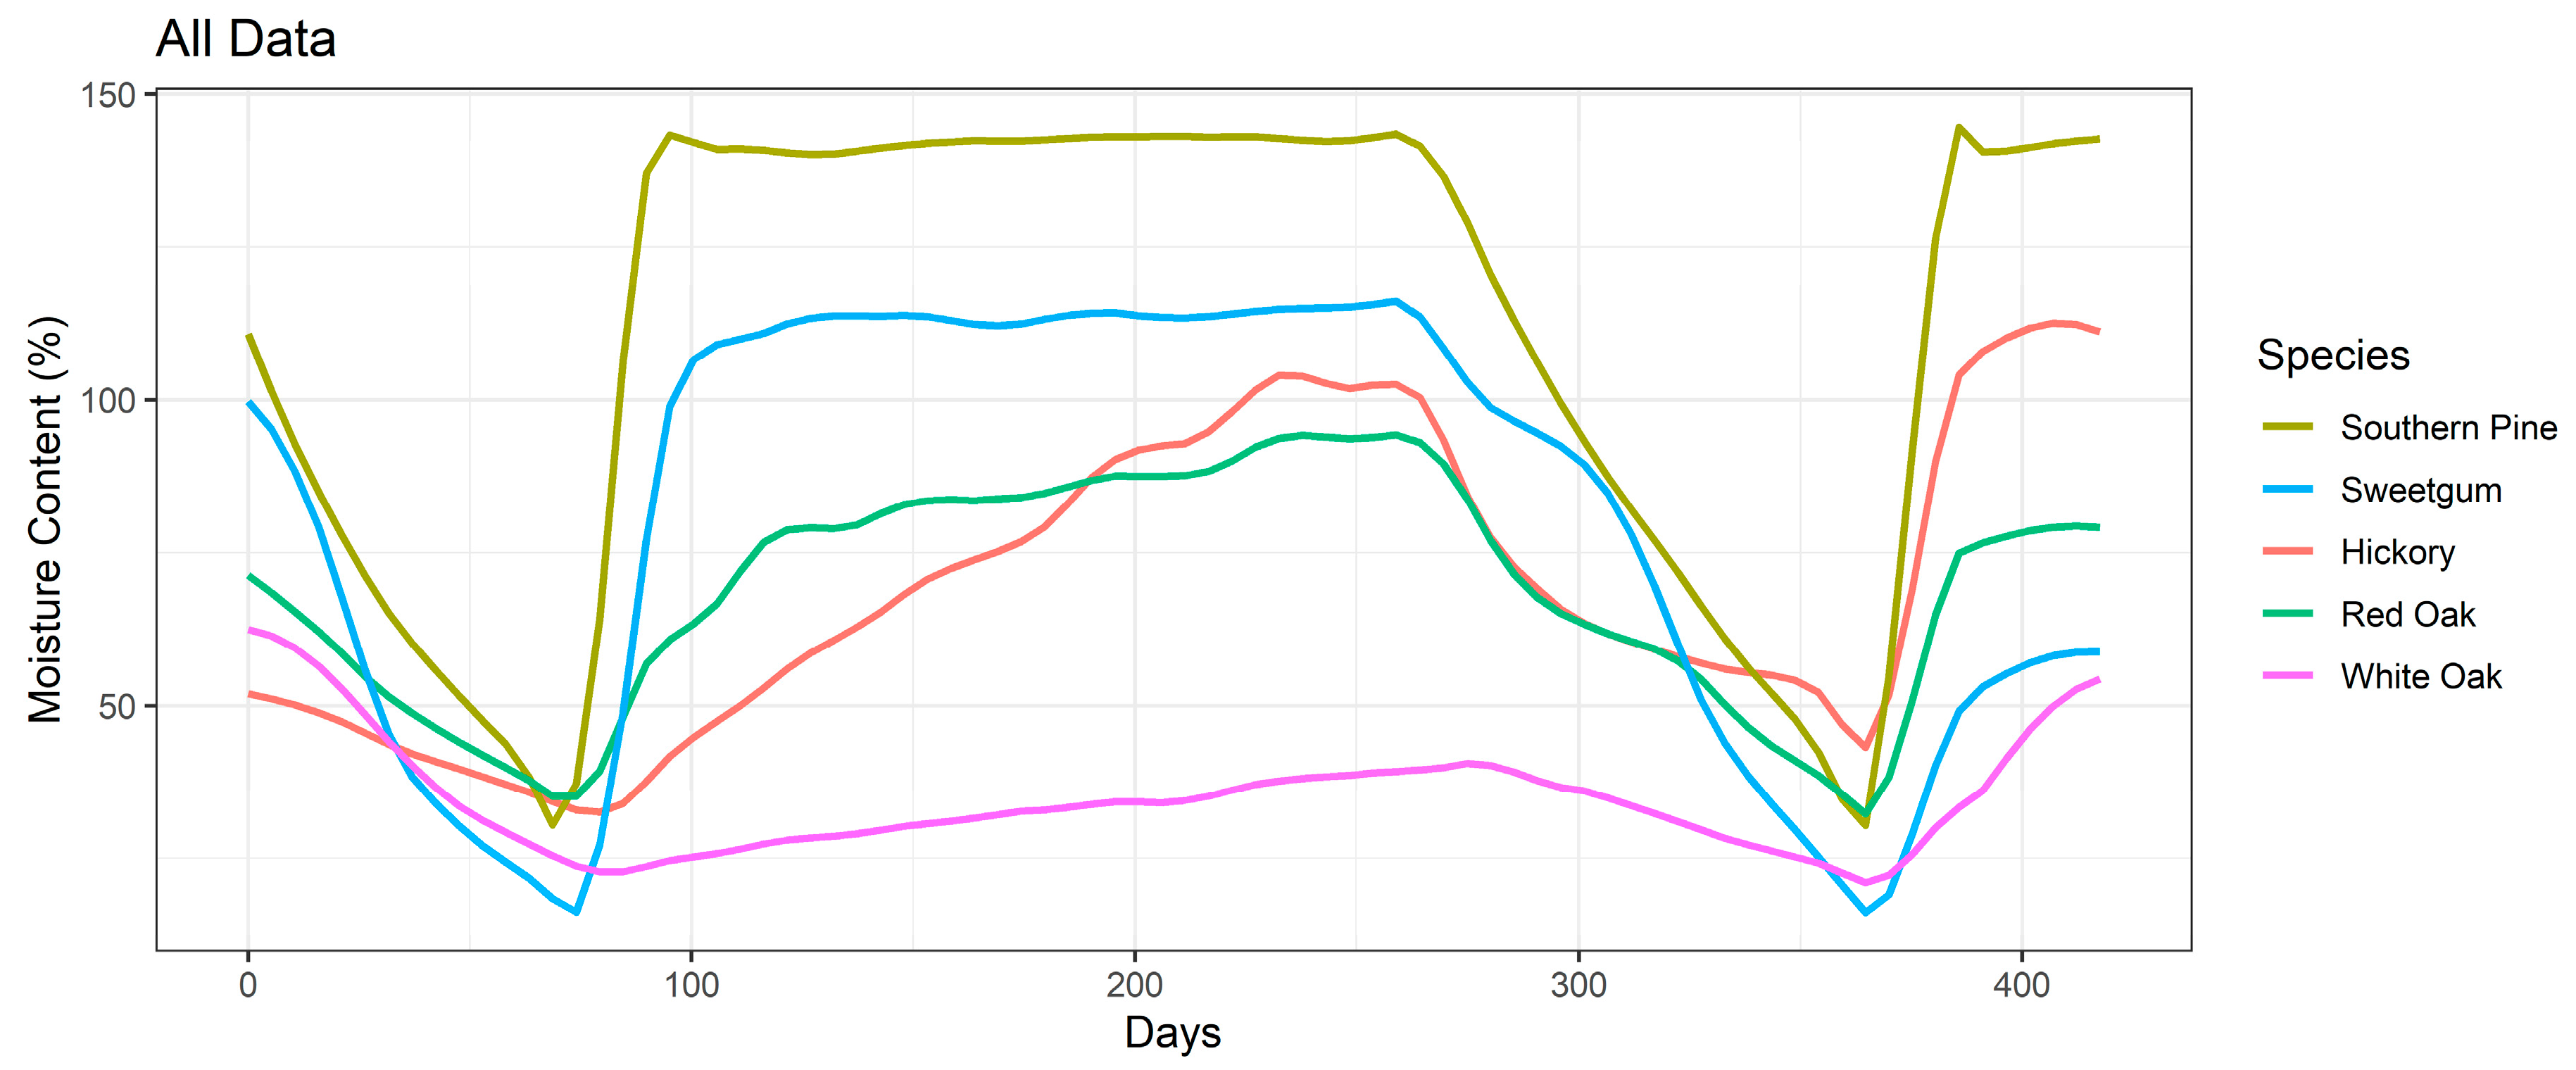
Predicted moisture content of logs over time in the wet-deck is shown in Figure 5. Most species achieved what appeared to be a saturation in moisture content around day 100 and then moisture stabilized until day 225. After 225 days, moisture content began to increase until the study concluded. Hickory was the exception, as around day 90, log moisture dropped from 90% to 60%, and around day 200, moisture began to increase sharply until completion of the study. Probes installed at DBH had approximately 10% higher moisture content than butt probes. These differences were consistent throughout the trial, which likely means that rather than the butt being less wet, differences were due to within-log variability in moisture content. Location in the pile had a large impact on log moisture, with the top of the pile having lower moisture contents than stems mid-pile. The difference between the two locations was approximately 10% or more throughout the study duration. Note that moisture content was slightly higher for stems on top of the pile at the beginning of the trial, so unlike probe location moisture content is actually higher for the middle of the pile, rather than stems on top. This is logical given log exposure on the top versus log exposure within the pile. Temperature and relative humidity within a wet-deck was different from the surrounding area, and mean temperature was slightly lower within the wet-deck (19.4 °C vs. 23.5 °C), but relative humidity much higher (81% vs. 47%).
There were significant differences in SG pre- and post-trial by species (p-value = 0.005); however, SG differences with location (top or mid-pile) were not significant (p-value = 0.983) (Table 3). Most bolts had very little change in SG over the course of the study; however, a few samples lost over 10% of their dry mass. Southern pine and white oak were the species least affected, having significantly lower SG change than sweetgum, but were not different from hickory or red oak. Measurement of SG only occurred at the butt, a likely area within the stem where any decay could happen given the exposure. The area most likely to be susceptible to decay would be at the top of the logs, as sprinkler spray can be limited at the edge of the deck. However, the volume in the top is relatively small compared to the butt.
3.4. Monitoring Moisture Content in Successive Wet-Dry Cycles
Bolt moisture content following successive wetting and drying cycles is shown in Figure 6. Initial moisture content differed by species, but generally moisture converged to around 30% after 80 days of air-drying. With resoaking, southern pine and sweetgum adsorbed water rapidly, while red oak, hickory, and white oak had slow water uptake. White oak in particular was particularly slow, only gaining 15% in moisture content over 200 days. Except for white oak, all species obtained a greater moisture content upon rewetting than at the beginning of the trial, likely due to water penetrating into bolts from cracks generated during drying. After 280 days, hickory and red oak readings stabilized (white oak still showed little change), and a second drying phase began. Drying again took approximately 80 days, followed by the final soak. During this phase, we observed fungal fruiting bodies on sweetgum bolts, leading to conclusion of the study. Regarding change in SG over the study (Table 4), there was no significant differences by species; however, the p-value (0.07) was close to 0.05. SG ranged from 84% of the starting value to no change (100%).
4. Discussion
4.1. Calibration Models
The fixed effects performance for the calibration models that predict moisture content from TDR readings differed significantly by species. Southern pine had the strongest model performance (R2 = 0.93) followed by sweetgum (R2 = 0.88), white oak (R2 = 0.83), and yellow poplar (R2 = 0.78). Hickory (R2 = 0.38) and red oak (R2 = 0.36) had poor results. Raybon et al. [20] found similar results between yellow poplar and sweetgum, where sweetgum had stronger predictions than yellow poplar. Including the random effect of bolt, the model results all have R2 values greater than 0.80. Thus, while TDR may not be able to accurately predict the moisture content of an individual bolt for all species, it can be used to detect changes in moisture content. This suggests that managing wet-decks to water saturation, rather than specific moisture content, is probably the best option given sample to sample and species differences. If the decision is made to monitor each log to a saturated condition this would allow for the use of TDR without calibration models as once the TDR signal stabilizes it would indicate saturation has been achieved.
We observed two different model forms in this study; exponential for hard hardwoods and logistic for southern pine and soft hardwoods. The exponential form is a departure from past work on hard hardwoods, with Raybon et al. [26] finding that red oak and white oak could be modeled using a four parameter logistic model. Raybon et al. [26] data shows moisture content reaching an asymptote, which we did not observe. The hard hardwoods used here were soaked for approximately six months, so in absence of vacuum treatment the bolts were at saturated levels. A possible explanation for the absence of an asymptote could be large sample variability within species or species groups as shown in Figure 2. With such variability present, the identification of an asymptote may be impossible.
For their models, Raybon et al. [26] utilized a total of 12 bolts from 4 trees per species. For this study, we collected samples from our industrial partners with bolts obtained from the butt of an individual log (approximately 40 per species or species group). While the greater variability presents the need for a different model form, considering our sampling strategy, our models more accurately represent what would be operationally utilized in a wet-deck because they were obtained from more logs. Raybon et al. [26] also determined the apparent length using the inflection point (the Campbell Scientific TDR100 used the tangent line approach) and used actual apparent length, rather than in this study where apparent length is divided by actual rod length, which may partially explain the different model forms.
There are other sources of the variation observed here including differentiation between heartwood and sapwood ratios, variation in earlywood and latewood within a bolt, and variation within species groups. Variation within the species groups occurs as hardwoods were harvested from naturally regenerated forests. It is therefore very likely that more than one species of red oak and hickory is represented in the data. For the white oak group it is probable that all trees were Quercus alba, and the TDR data for the white oak group (Figure 2) was considerably less variable than either red oak or hickory. Sweetgum and yellow poplar are individual species and not species groups, and the southern pine was most likely loblolly pine, which likely improved the consistency of the modeling results.
Differences in heartwood-sapwood ratio within a species group can greatly influence moisture variability [32]. The southern pine and sweetgum bolts samples had little to no heartwood, and thus amongst the different species examined were likely the most consistent. Southern pine was sourced from plantations and likely had the narrowest age range. Whereas the hardwood species were all naturally regenerated and thus likely had more variation in the range of ages. White oak bolts were nearly all heartwood, with each bolt having a band of sapwood approximately 20 mm wide. In contrast, yellow poplar, hickory, and red oak were less consistent, with varying proportions of heartwood and sapwood (observed but not measured). Summary moisture content data available in the literature for yellow poplar and several hickory species [32] indicates a marked difference between heartwood and sapwood. For yellow poplar, average heartwood and sapwood moisture contents are 83% and 106%, respectively, while for hickory species likely harvested in the Augusta area, average moisture content ranges from approximately 70% (heartwood) to approximately 50% (sapwood) [32].
We did not quantify the earlywood to latewood ratios in the samples, but this may have significantly impacted the model results for the ring porous hardwoods, specifically hickory and red oak. Hickory had a very large range in specific gravity (Table 1, Figure 1), indicating a relatively high variability in earlywood to latewood ratio. At a given diameter, more earlywood would indicate slower growth and a lower SG and higher MC. Within a sample bolt, TDR is not measuring the entire bolt but instead a portion of the sample. The actual volume of the TDR signal is difficult to measure and varies with moisture content [12,30]. With this in mind, we did measure SG of a disk from the sample, and including SG in the hickory and red oak models led to a 1% improvement in the fixed effects, with the linear parameter for hickory (−2.69) and red oak (−2.58) being similar to each other. The relative lack of improvement in the models indicates that there are other factors that we are not considering, perhaps related to chemical differences between different species groups, which would be influenced by heartwood to sapwood percent as noted above.
4.2. Monitoring Moisture Content within A Wet-Deck
Monitoring of moisture content within a wet-deck shows an automated application of TDR for the forest products industry. The data is important as it provides guidance on how long a variety of species take to approach water saturation. Recognition of the time required to reach this point could be utilized to identify when to reduce the volume of water applied with the level used sufficient to maintain saturation. What volume is required is particularly interesting because of the slight drop in predicted moisture content that occurred in the summer, followed by a steady increase beginning in the fall and continuing through winter when the study concluded. We could not periodically destructively sample the pile, so the exact reasons for these changes are unknown. However, we speculate that higher summer temperatures resulted in the pile becoming slightly drier, and thus it did not achieve full saturation. As moisture content was still increasing after 12 months, it is possible that the logs never reached saturation and thus water application was insufficient for this specific trial. We noted that during summer, stems appeared a little drier than expected, whereas in fall and winter, stems were covered in slime, indicative of excessive moisture.
Another possible reason for changes in predicted moisture content by season is the influence of temperature on TDR readings. There is no information available in the literature on this topic for wood; however, there is an abundance of literature available for soil [38,39,40]. The impact of temperature on a TDR reading of soil is dependent on the soil and its properties, with some soil types having little to no change in TDR reading by temperature, whereas others have a strong effect. In fact, changes with temperature appear to be dependent on the material itself. For example, Wraith et al. [40] found that with a silt loam soil, increasing temperature increased the TDR reading, whereas with a sandy loam soil, and deonized water, increasing temperature decreased the TDR reading. Wraith et al. [40] also found, for a different silt loam soil, the change in TDR reading depended on water content, where at lower water contents, increased temperature resulted in a decrease in the TDR reading, while the opposite was true for higher water content. The results for soil do not add clarity to wood, other than that TDR readings can change with temperature and water content. We observed the largest changes in predicted moisture content in the hickory samples. While it is not known yet whether the variability in hickory was due to temperature differences impacting the TDR reading, or whether hickory is more susceptible to drying out at increased temperatures. Further research into the temperature effect on TDR readings in wood would add clarity for its operational use.
It was not feasible using the datalogger we employed (CR800) to save the individual waveform data because of the lack of available onboard memory, and thus we were not able to analyze the trace data over time to examine if temperature was impacting the signal shape. Newer dataloggers have micro USB drives for saving data, this expanded storage capacity would have allowed us to save the data from individual waveforms and to determine if temperature was influencing the shape of the traces. This may have resulted in a better understanding of what occurred within the wet-deck over time, particularly for hickory.
Probes installed in the butt were likely more sensitive at picking up changes in moisture content that occur due to inadequate water application, since they are more exposed to environmental fluctuations. However, we note that the DBH probes and the butt probes tracked very closely throughout the study. The responses for the DBH and butt probes suggest that wood sampled by the two sets of probes behaved similarly in summer, since drying in summer and wetting again in fall impacted both butt and DBH probes.
As expected, moisture content at the top of the pile was lower than within the pile. The interesting point here is that SG did not vary by location within the pile. Thus, while moisture content may be lower at the top of the pile, it did not necessarily result in a reduction in SG due to minor wood decay. Overall, there was an average decrease in SG of 5% in 12 months, this could be due to wood decay, or it could be due to the loss of water-soluble extractives, or a combination between the two.
4.3. Monitoring Moisture Content during Successive Wet-Dry Cycles
The 400-day tank trial that involved successive wet-dry cycles showed that bolts are able to adsorb water over time after drying, which suggests that facilities that experience an unplanned water outage for an extended period of time can re-saturate logs in a wet-deck. We did notice that during the second wetting cycle some bolts were decaying and had fungal fruiting bodies. This may indicate that if a wet-deck experienced two major unplanned water outages, that it would be wise for the wood to be utilized rather than attempt re-saturation. During the 400-day trial, there was an average decrease in SG of 6%, with no differences between species. Given the fruiting bodies growing from some bolts, there was some reduction in SG due to wood decay; however, there could also be a loss of water-soluble extractives.
4.4. Other Considerations
This study installed TDR probes on the transverse face, rather than prior studies that installed probes on the tangential face. There are advantages and disadvantages to both approaches. We used the transverse face to make installation at wet-decks significantly easier. For example, industry can build a wet-deck, and then later, instrument the wet-deck with TDR probes if they are installed on the transverse face of the butt. Whereas for the tangential face installation, probes need to be installed before stems are located within the wet-deck, and this adds complexity to the process of building wet-decks, and extreme care must be taken to protect the coaxial cable, which is ultimately the weak point of the signal. Because probes are encased in epoxy resin, probes are ultimately fairly durable and resistant to damage, unlike coaxial cables, which can be crushed or severed by setting a log on it while the wet-deck is being built. These advantages are clearly in favor of installing probes on the transverse face. However, installing probes on the tangential face offers an advantage with regards to obtaining more representative moisture contents within a section because the rods are sampling more growth rings and can be positioned in a location that best represents the whole log.
Use of TDR for measuring moisture content in wood could likely be significantly optimized for wood. Current techniques are largely borrowed from soil, given the ample literature available. For example, the design of the probe constructed here mimics those used by soil scientists [12,30]. Rothe et al. [41] explain that decreasing the distance between the rods results in more energy being sampled away from the surface of the rods, which would be beneficial in obtaining representative moisture information in a wood sample. In soil, TDR probes are inserted into soil, which requires the spacing between the rods to be far enough apart to limit the impact each rod has on each other due to soil displacement. For wood, insertion without drilling is not possible, and thus, given this information, it would be feasible to construct and use very narrow spaced rods for probes with the goal of improving moisture content models by measuring more material away from the rods. The rod length used in this study was 152 mm, and increasing rod length would likely improve accuracy [7,42], however drilling holes longer than 152 mm is challenging.
5. Conclusions
TDR was used here to develop calibration models that predict the moisture content of wood. Fixed effects of calibration models ranged from excellent for southern pine, sweetgum, and white-oak, to generally poor for red oak and hickory. Including random effects in the model’s improved model performance to R2 > 0.8 for all species. Improvement in the models by including the random effect of the sample suggests that, at the individual sample level, TDR performs well at monitoring changes in wood moisture content. As the TDR signal increases or decreases, it indicates a change in bolt moisture content. Including SG in red oak and hickory models did not appreciably improve accuracy, suggesting that there are other differences, perhaps related to individual species within species groups, that are causing this variability.
The use of TDR and automated datalogging capabilities was used in two applications, first to monitor moisture content in an industrial wet-deck. The second application was to monitor moisture content of wood bolts in successive wet-dry cycles, as industry is interested in learning about whether or not they are able to re-saturate stems after a period of water not being applied to a wet-deck. Both applications show the utility of TDR to collect moisture information over time at moisture contents well above the fiber saturation point of wood.
Author Contributions
Design and analysis, J.D., L.S. and E.S.; writing first draft and subsequent drafts, J.D. and L.S.; editing of drafts, E.S. All authors have read and agreed to the published version of the manuscript.
Funding
This research was funded by the National Council for Air and Stream Improvement, Inc. and its member companies.
Acknowledgments
The authors are grateful to the National Council for Air and Stream Improvement, Inc. and its members companies for their financial support for this research. The authors thank International Paper for their cooperation in allowing us access to a wet storage yard, and for material used to develop the calibration models here (southern pine, sweetgum, hickory, red oak, white oak). The authors thank Georgia-Pacific for the yellow poplar material donated which was also used to develop the calibration models.
Conflicts of Interest
The authors declare no conflict of interest.
References
- National Council for Air and Stream Improvement (NCASI). Compendium of Forestry Best Management Practices for Controlling Nonpoint Source Pollution in North America; Technical Bulletin No. 966; National Council for Air and Stream Improvement: Cary, NC, USA, 2009; pp. 1–230. [Google Scholar]
- Malan, F. Some notes on the effect of wet-storage on timber. S. Afr. For. J. 2004, 202, 77–82. [Google Scholar] [CrossRef]
- Koch, P. Utilization of the Southern Pines—Volume 1 (Handbook SFES-AH-420); USDA-USFS Southern Forest Experiment Station Agriculture: Asheville, NC, USA, 1972; pp. 1–734.
- Zabel, R.A.; Morrell, J.J. Wood Microbiology: Decay and Its Prevention; Academic Press: London, UK, 1992; pp. 1–476. [Google Scholar]
- Bentley, J.W.; Cooper, J.A. Southern Pulpwood Production 2012 (e-Resources Bulletin SRS-206); USDA USFS Southern Research Station: Asheville, NC, USA, 2015; pp. 1–46.
- Bergman, R. Drying and control of moisture content and dimensional changes. In Wood Handbook (General Technical Report FPL-GTR-190); Ross, R.J., Ed.; USDA Forest Service Forest Products Laboratory: Madison, WI, USA, 2010; pp. 13-1–13-20. [Google Scholar]
- Schimleck, L.; Love-Myers, K.; Sanders, J.; Raybon, H.; Daniels, R.; Mahon, J.; Andrews, E.; Schilling, E. Measuring the moisture content of green wood using time domain reflectometry. For. Prod. J. 2011, 61, 428–434. [Google Scholar] [CrossRef]
- Schimleck, L.R.; Love-Myers, K.; Sanders, J.; Raybon, H.; Daniels, R.; Andrews, E.; Schilling, E. Examination of moisture content variation within an operational wetdeck. TAPPI J. 2013, 12, 45–50. [Google Scholar] [CrossRef]
- White, R.B.; Schimleck, L.R.; Antony, F.; Daniels, R.F. Exploration of seasonal variation in standing loblolly and slash pine using time domain reflectometry. Eur. J. Wood Wood Prod. 2019, 77, 1045–1052. [Google Scholar] [CrossRef]
- Dahlen, J.; Antony, F.; Li, A.; Love-Myers, K.; Schimleck, L.R.; Schilling, E. Automated time-domain reflectometry signal analysis for prediction of loblolly pine and sweetgum moisture content. Bioresources 2015, 10, 4947–4960. [Google Scholar] [CrossRef]
- Cassel, D.K.; Kachanoski, R.G.; Topp, G.C. Practical considerations for using a TDR cable tester. Soil Technol. 1994, 7, 113–126. [Google Scholar] [CrossRef]
- Robinson, D.A.; Jones, S.B.; Wraith, J.M.; Or, D.; Friedman, S.P. A review of the advances in dielectric and electrical conductivity measurement in soils using time domain reflectometry. Vadose Zone J. 2003, 2, 444–475. [Google Scholar] [CrossRef]
- Topp, G.C.; Davies, J.L.; Annan, A.P. Electromagnetic determination of soil water content: Measurements in coaxial transmission line. Water Resour. Res. 1980, 16, 574–582. [Google Scholar] [CrossRef] [Green Version]
- Constantz, J.; Murphy, F. Monitoring storage moisture in tree using time domain reflectometry. J. Hydrol. 1990, 119, 31–42. [Google Scholar] [CrossRef]
- Nadler, A.; Raveh, E.; Yermiyahu, U.; Green, S.R. Evaluation of TDR use to monitor water content in stem of lemon trees and soil and their response to water stress. Soil Sci. Soc. Am. J. 2003, 67, 437–488. [Google Scholar] [CrossRef]
- Torgovnikov, G.I. Dielectric Properties of Wood and Wood-Based Materials; Springer Series in Wood Science: Berlin, Germany, 1993; pp. 1–196. [Google Scholar]
- Cerný, R. Time-domain reflectometry method and its application for measuring moisture content in porous materials: A review. Measurement 2009, 42, 329–336. [Google Scholar] [CrossRef]
- Gray, A.N.; Spies, T.A. Water content measurement in forest soils and decayed wood using time domain reflectometry. Can. J. For. Res. 1995, 25, 376–385. [Google Scholar] [CrossRef]
- Wullschleger, S.D.; Hanson, P.J.; Todd, D.E. Measuring stem water content in four deciduous hardwoods with a time-domain reflectometer. Tree Physiol. 1996, 16, 809–815. [Google Scholar] [CrossRef] [PubMed]
- Irvine, J.; Grace, J. Non-destructive measurement on stem water content by time domain reflectometry using short probes. J. Exp. Bot. 1997, 48, 813–818. [Google Scholar] [CrossRef]
- Sparks, J.P.; Campbell, G.S.; Black, R.A. Water content, hydraulic conductivity, and ice formation in winter stems of Pinus contorta: A TDR case study. Oecologia 2001, 127, 468–475. [Google Scholar] [CrossRef]
- Hernández-Santana, V.; Martínez-Fernández, J.; Morán, C. Estimation of tree water stress from stem and soil water monitoring with time-domain refloctometry in two small forested basins in Spain. Hydrol. Process. 2008, 22, 2493–2501. [Google Scholar] [CrossRef]
- Previati, M.; Canone, D.; Bevilacqua, I.; Boetto, G.; Pognant, D.; Ferraris, S. Evaluation of wood degradation for timber check dams using time domain reflectometry water content measurements. Ecol. Eng. 2012, 44, 259–268. [Google Scholar] [CrossRef]
- Raybon, H.; Schimleck, L.R.; Love-Myers, K.; Antony, F.; Sanders, J.; Daniels, R.; Andrews, E.; Schilling, E. Examination of the potential to reduce water application rates in pine wetdecks. TAPPI J. 2015, 14, 675–682. [Google Scholar] [CrossRef]
- Twaddle, A. Personal Communication; International Paper: Memphis, TN, USA, 2015. [Google Scholar]
- Raybon, H.; Schimleck, L.R.; Love-Myers, K.; Antony, F.; Sanders, J.; Daniels, R.; Andrews, E.; Schilling, E. Examination of the potential to reduce water application rates for hardwood pulplogs stored in wet decks. TAPPI J. 2016, 15, 515–522. [Google Scholar] [CrossRef]
- Evett, S.R. The TACQ computer program for automatic time domain reflectometry measurements: I. Design and operating characteristics. Trans. ASAE 2000, 43, 1939–1946. [Google Scholar] [CrossRef]
- Fatas, E.; Vicente, J.; Latorre, B.; Lera, F.; Vinals, V.; Lopez, M.V.; Blanco, N.; Pena, C.; Gonzalez-Cebollada, C.; Moret-Fernandez, D. TDR-Lab 2.0 improvement TDR software for soil water content and electrical conductivity measurements. Procedia Environ. Sci. 2013, 19, 474–483. [Google Scholar] [CrossRef] [Green Version]
- ASTM International. ASTM D6565-00: Standard Test. Method for Determination of Water (Moisture) Content of Soil by Time-Domain Reflectometry (TDR) Method; ASTM International: West Conshohocken, PA, USA, 2005. [Google Scholar]
- Zegelin, S.J.; White, I.; Jenkins, D.R. Improved field probes for soil water content and electrical conductivity measurement using time domain reflectometry. Water Resour. Res. 1989, 25, 2367–2376. [Google Scholar] [CrossRef]
- Stamm, A. Wood and Cellulose Science; The Ronald Press Company: New York, NY, USA, 1964; pp. 1–549. [Google Scholar]
- Glass, S.V.; Zelinka, S.L. Moisture relations and physical properties of wood. In Wood Handbook (General Technical Report FPL-GTR-190); Ross, R.J., Ed.; USDA Forest Service Forest Products Laboratory: Madison, WI, USA, 2010; pp. 4-1–4-19. [Google Scholar]
- ASTM International. ASTM D2395-17: Standard Test. Methods for Density and Specific Gravity (Relative Density) of Wood and Wood-Based Materials; ASTM International: West Conshohocken, PA, USA, 2017. [Google Scholar]
- R Core Team. R: A Language and Environment for Statistical Computing; R Foundation for Statistical Computing: Vienna, Austria, 2020; Available online: http://www.R-project.org (accessed on 27 March 2020).
- RStudio. RStudio: Integrated Development Environment for R; RStudio: Boston, MA, USA, 2020; Available online: https//www.rstudio.com (accessed on 27 March 2020).
- Pinheiro, J.; Bates, D.; DebRoy, S.; Sarkar, D.; R Core Team. nlme: Linear and Nonlinear Mixed Effects Models. R Package Version 2.5-8. 2016. Available online: https://CRAN.R-project.org/package=nlme (accessed on 18 April 2018).
- Wickham, H.; RStudio. tidyverse: Easily Install and Load the “tidyverse”. 2020. R Package Version 1.3.0. Available online: https://CRAN.R-project.org/package=tidyverse (accessed on 27 March 2020).
- Pepin, S.; Livingston, N.J.; Hook, W.R. Temperature dependent measurement errors in time domain reflectometry determinations of soil water. Soil Sci. Soc. Am. J. 1995, 59, 38–43. [Google Scholar] [CrossRef]
- Wraith, J.M.; Baker, J.M.; Blake, T.K. Water uptake resumption following soil drought: A comparison among four barley genotypes. J. Exp. Bot. 1995, 46, 873–880. [Google Scholar] [CrossRef]
- Wraith, J.M.; Or, D. Temperature effects on soil bulk dielectric permittivity measured by time domain reflectometry: Experimental evidence and hypothesis development. Water Resour. Res. 1999, 35, 361–369. [Google Scholar] [CrossRef]
- Rothe, A.; Weis, W.; Kreutzer, K.; Matthies, D.; Hess, U.; Ansorge, B. Changes in soil structure caused by the installation of time domain reflectometry probes and their influence on the measurement of soil moisture. Water Resour. Res. 1997, 33, 1585–1593. [Google Scholar] [CrossRef]
- Noroio, K. Measurement of soil water content and electrical conductivity by time domain reflectometry: A review. Comput. Electron. Agric. 2001, 31, 213–237. [Google Scholar]
Figure 1.
Typical time-domain reflectometry waveform in wet wood (>75% moisture content), showing the two main methods for determining apparent length. Xp is the signal entering the probe head from the coaxial cable, Xr is the signal leaving the probe head and the starting point for measurement of the waveform, Xt is the signal at the end of the rods using the tangent line approach, and Xi is the inflection point of the rising curve method.

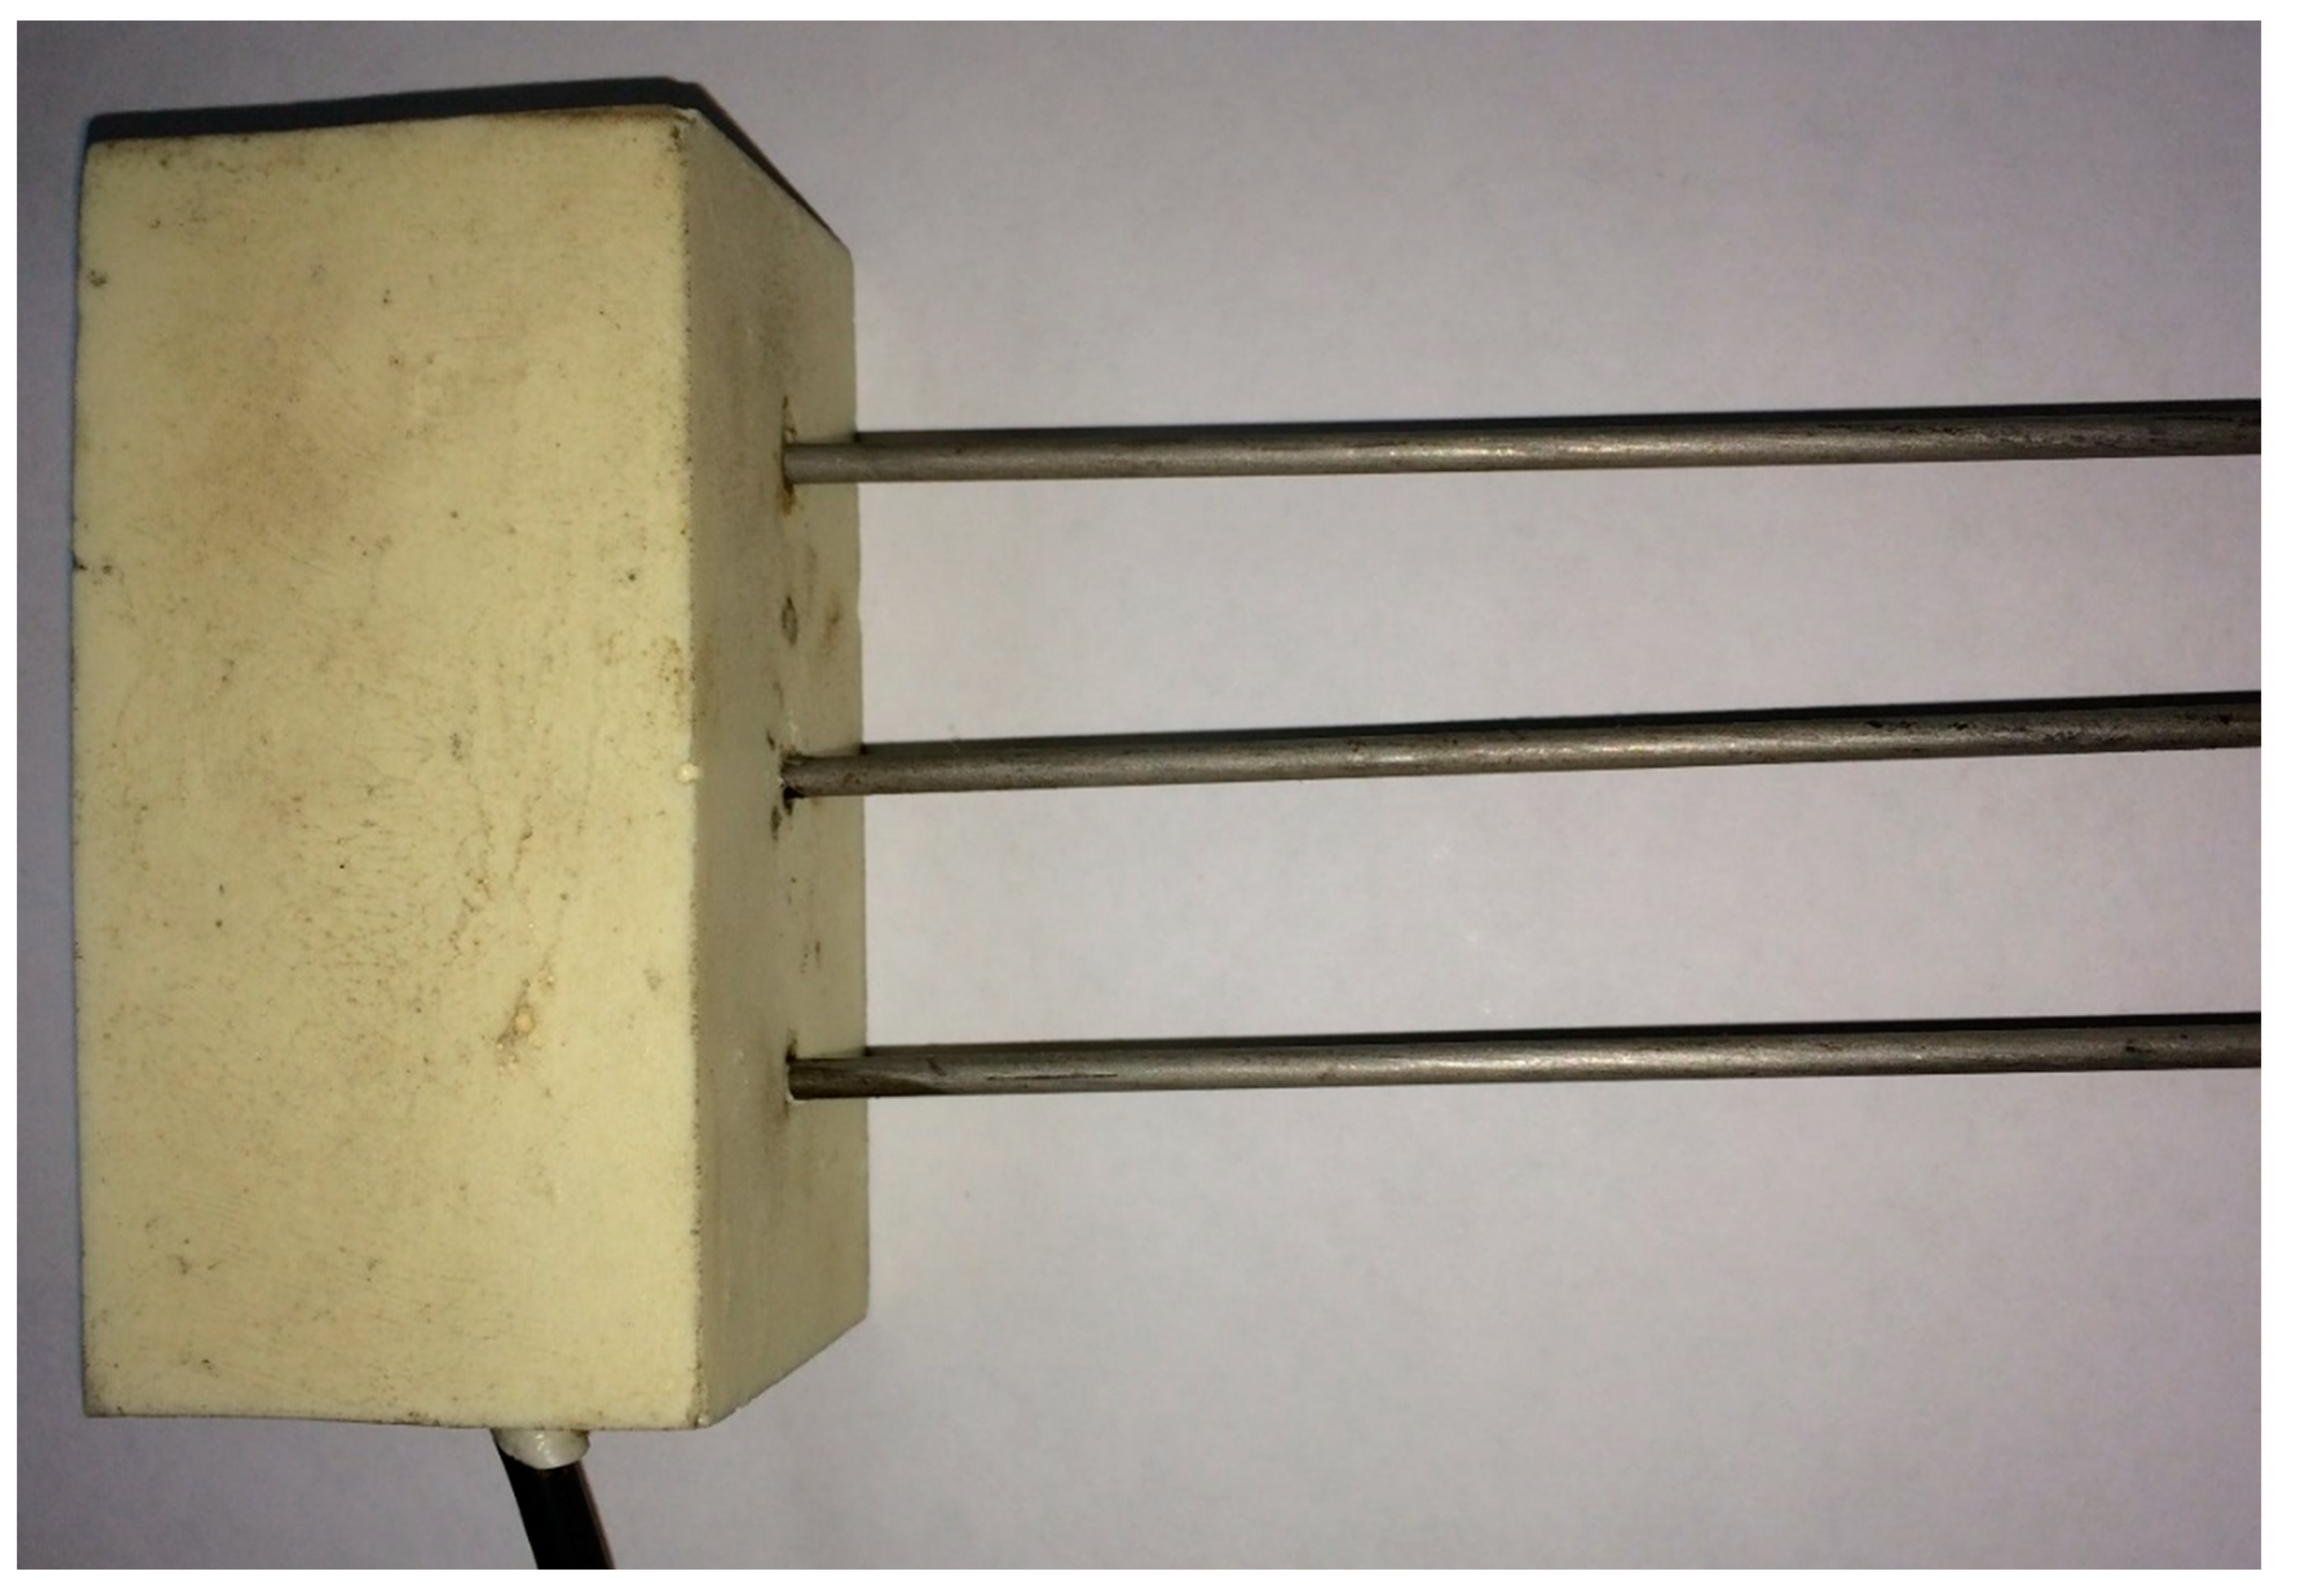
Figure 2.
Time-domain reflectometry probe used in this study, the middle rod is connected to the positive wire of the coaxial cable, and the outer rods are connected to the ground wire of the coaxial cable.
Figure 2.
Time-domain reflectometry probe used in this study, the middle rod is connected to the positive wire of the coaxial cable, and the outer rods are connected to the ground wire of the coaxial cable.

Figure 3.
Moisture content after soaking versus specific gravity for the different species.

Figure 4.
Moisture content vs. time-domain reflectometry (TDR) readings for each species.

Figure 5.
Moisture content vs time-domain reflectometry (TDR) reading for each species (top), probe location with the log (middle), and location of log in the pile (bottom).
Figure 5.
Moisture content vs time-domain reflectometry (TDR) reading for each species (top), probe location with the log (middle), and location of log in the pile (bottom).

Figure 6.
Predicted moisture content following successive wet-dry cycles.


Table 1.
Diameter, specific gravity, and initial moisture content for the calibration models.
| Species | Diameter Inside Bark (mm) | Specific Gravity | Moisture Content (%) | |||
|---|---|---|---|---|---|---|
| Mean | Range | Mean | Range | Mean | Range | |
| Southern pine | 206 | 160–287 | 0.456 | 0.372–0.571 | 134 | 91–179 |
| Sweetgum | 215 | 155–277 | 0.466 | 0.432–0.514 | 114 | 76–148 |
| Yellow-poplar | 332 | 290–414 | 0.429 | 0.382–0.501 | 128 | 101–149 |
| Hickory | 241 | 155–366 | 0.648 | 0.492–0.711 | 77 | 60–114 |
| Red Oak | 251 | 160–422 | 0.583 | 0.547–0.651 | 90 | 76–107 |
| White Oak | 247 | 180–361 | 0.592 | 0.542–0.648 | 70 | 56–81 |
Table 2.
Model parameters and fit statistics for the six species.
| Species | R2 | Parameters | |||
|---|---|---|---|---|---|
| Fixed Effects | Random Effects | Asym | xmid | scal | |
| Southern pine | 0.93 | 0.99 | 153 | 4.36 | 0.69 |
| Sweetgum | 0.88 | 0.97 | 141 | 4.75 | 0.98 |
| Yellow poplar | 0.78 | 0.85 | 126 | 3.75 | 0.85 |
| α | β | ||||
| Hickory | 0.38 | 0.86 | 3.88 | 1.85 | |
| Red oak | 0.36 | 0.81 | 4.14 | 1.81 | |
| White oak | 0.83 | 0.92 | 0.86 | 2.62 | |
Table 3.
Beginning and end specific gravity for the five species for the wet-deck run.
| Specific Gravity | ||||||
|---|---|---|---|---|---|---|
| Pre-Run | Post-Run | % Change 1 | ||||
| Species | Mean | Range | Mean | Range | Mean | Range |
| Southern pine | 0.49 | 0.43–0.57 | 0.48 | 0.43–0.55 | 97a | 89–100 |
| Sweetgum | 0.5 | 0.47–0.54 | 0.47 | 0.41–0.51 | 92b | 82–100 |
| Hickory | 0.67 | 0.63–0.74 | 0.64 | 0.6–0.7 | 96ab | 94–98 |
| Red Oak | 0.6 | 0.55–0.64 | 0.57 | 0.52–0.6 | 95ab | 83–100 |
| White Oak | 0.67 | 0.64–0.69 | 0.66 | 0.64–0.68 | 98a | 96–100 |
1 Letters denote significant differences.
Table 4.
Beginning and end specific gravity for the five species for successive wet-dry cycles.
| Specific Gravity | ||||||
|---|---|---|---|---|---|---|
| Pre-Trial | Post-Trial | % Change 1 | ||||
| Species | Mean | Range | Mean | Range | Mean | Range |
| Southern pine | 0.50 | 0.44–0.53 | 0.48 | 0.42–0.51 | 96 | 89–100 |
| Sweetgum | 0.44 | 0.40–0.48 | 0.40 | 0.37–0.44 | 90 | 84–94 |
| Hickory | 0.65 | 0.62–0.67 | 0.60 | 0.58–0.62 | 92 | 86–97 |
| Red Oak | 0.56 | 0.52–0.59 | 0.53 | 0.47–0.57 | 95 | 87–100 |
| White Oak | 0.60 | 0.54–0.64 | 0.57 | 0.49–0.63 | 96 | 91–99 |
1 No significant differences were found between species.
© 2020 by the authors. Licensee MDPI, Basel, Switzerland. This article is an open access article distributed under the terms and conditions of the Creative Commons Attribution (CC BY) license (http://creativecommons.org/licenses/by/4.0/).
Share and Cite
MDPI and ACS Style
Dahlen, J.; Schimleck, L.; Schilling, E. Modeling and Monitoring of Wood Moisture Content Using Time-Domain Reflectometry. Forests 2020, 11, 479. https://0-doi-org.brum.beds.ac.uk/10.3390/f11040479
AMA Style
Dahlen J, Schimleck L, Schilling E. Modeling and Monitoring of Wood Moisture Content Using Time-Domain Reflectometry. Forests. 2020; 11(4):479. https://0-doi-org.brum.beds.ac.uk/10.3390/f11040479
Chicago/Turabian StyleDahlen, Joseph, Laurence Schimleck, and Erik Schilling. 2020. "Modeling and Monitoring of Wood Moisture Content Using Time-Domain Reflectometry" Forests 11, no. 4: 479. https://0-doi-org.brum.beds.ac.uk/10.3390/f11040479
Note that from the first issue of 2016, this journal uses article numbers instead of page numbers. See further details here.