Estimating Wind Damage in Forested Areas Due to Tornadoes
by
 , and
, and
Mohamed A. Mansour
1,2, 
Daniel M. Rhee
3,
Timothy Newson
1,*,
Chris Peterson
4 and
and
Franklin T. Lombardo
3 1
Department of Civil and Environmental Engineering, Western University, London, ON N6A 5B9, Canada
2
Public Works Engineering Department, Cairo University, Giza 12613, Egypt
3
Department of Civil and Environmental Engineering, University of Illinois at Urbana-Champaign, Champaign, IL 61801, USA
4
Department of Plant Biology, University of Georgia, Athens, GA 30602, USA
*
Author to whom correspondence should be addressed.
Forests 2021, 12(1), 17; https://0-doi-org.brum.beds.ac.uk/10.3390/f12010017
Submission received: 15 November 2020
/
Revised: 14 December 2020
/
Accepted: 22 December 2020
/
Published: 25 December 2020
(This article belongs to the Special Issue Wind Impacts on Forests and Trees in a Changing Climate—A Special Issue in Collaboration with the IUFRO Working Party 8.03.06)
Abstract
:Research Highlights: Simulations of treefall patterns during tornado events have been conducted, enabling the coupled effects of tornado characteristics, tree properties and soil conditions to be assessed for the first time. Background and Objectives: Treefall patterns and forest damage assessed in post-storm surveys are dependent on the interaction between topography, biology and meteorology, which makes identification of characteristic behavior challenging. Much of our knowledge of tree damage during extreme winds is based on synoptic storms. Better characterization of tree damage will provide more knowledge of tornado impacts on forests, as well as their ecological significance. Materials and Methods: a numerical method based on a Rankine vortex model coupled with two mechanistic tree models for critical wind velocity for stem break and windthrow was used to simulate tornadic tree damage. To calibrate the models, a treefall analysis of the Alonsa tornado was used. Parametric study was conducted to assess induced tornadic tree failure patterns for uprooting on saturated and unsaturated soils and stem break with different knot factors. Results: A power law relationship between failure bending moments and diameter at breast height (DBH) for the hardwood species provided the best correlation. Observed failure distributions of stem break and windthrow along the tornado track were fitted to lognormal distributions and the mean of the critical wind speeds for windthrow were found to be higher than that for stem break. Relationships between critical wind speed and tree size were negatively correlated for windthrow and positively correlated for stem break. Higher soil moisture contents and lower knot factors reduced the critical wind speeds. The simulations show varying tree fall patterns displaying forward and backward convergence, different tornado damage widths and asymmetry of the tracks. These variations were controlled by the relative magnitudes of radial and tangential tornado velocities, the ratio between translational speed and maximum rotational wind speed and the mode of failure of the trees. Conclusions: The results show the complexity of predicting tornadic damage in forests, and it is anticipated that this type of simulation will aid risk assessments for insurance companies, emergency managers and forest authorities.
1. Introduction
Large, infrequent windstorms can have lasting effects on the natural landscape. The resulting damage to forested regions can be severe enough to be easily identified from the ground or from satellite images [1,2]. The damage can be geographically widespread (1.65 million ha of forest is annually destroyed in the US [3]) and is a source of major economic losses for many countries [4]. This is a recurrent natural hazard causing considerable damage to global forests leading to higher harvest costs, unharvested damaged and uprooted trees, and harmful insect attacks on the remaining stands due to increases in breeding material [5,6,7].
Detrimental wind effects can range from minor damage of leaves, branches and stems through to catastrophic failure (i.e., windthrow or stem break). The impacts of wind disturbance can affect the forest regeneration patterns, carbon cycling, diversity and soil health and can have influences that are both spatial and temporal. The effects of windthrow in forests that have been investigated include wind effects on trees, factors contributing to stand level damage and recovery, the mechanics of wind throw and stem break, windthrow modelling and ecological impacts of windthrow [8,9,10,11].
Some of the most damaging wind loads in North America are due to tornadoes. Tornadoes are violently rotating columns of air, in contact with the ground surface, either pendant from or beneath cumuliform clouds, with winds that spiral inward at the ground surface, which then rotate upwards [12]. Tornadoes have windspeeds between 90 and 315 km/h (25 and 87 m/s) and can occur with many storm types, but supercell thunderstorms tend to produce the most violent and long-lasting tornadoes due to the sustained, intense updrafts. Damage path lengths are approximately 10 km on average (although they range considerably between 50 m and 100+ km) and tend to be longer for higher intensity tornadoes [13]. Tornadoes have average damage swaths of approximately 250 m width, but again, the track cross-sections can vary significantly between 2 m and 2+ km [14].
The interaction between trees and tornadic wind fields has been investigated previously using post-storm field investigations [15,16,17,18,19,20,21]. Tornado damage in forested areas is often identified by characteristic treefall patterns displaying convergence, divergence and rotation, rather than uniformly orientated tree damage [22]. Letzmann was the first to construct hypothetical treefall patterns [22], using a translating tornadic wind field created by superposing translational velocity and a rotating vortex. Influenced by the work of Letzmann, many other researchers have adopted this form of vortex model to predict treefall patterns and have compared these to surveyed post-tornado treefall data to estimate the near-surface wind speeds of the tornadoes [23,24,25,26,27,28].
The type of damage and recovery in forests is highly contingent on the characteristics of the original tornado, in terms of size, frequency and intensity [21]. Treefall patterns and damage are highly dependent on the interaction between the topography, biology and meteorology [2,26], which makes comparison between events difficult, since larger, less frequent storms often affect sites and forests with very different characteristics. Although there have been some studies conducted on the same forests subjected to different storms, and studies of the same storm affecting different forests, identifying general features and characteristic behaviors has been challenging [21]. However, one of the most important factors determining wind damage patterns is tree size; large trees are more likely to be damaged and will often display the most damage [8,10,18]. The tree species is also important, and the damage patterns are related to crown shape, rooting pattern and wood properties, and the interaction with the wind field.
Natural disturbances (e.g., fires, drought, wind, insect outbreaks, etc.) are sensitive to climate, and climate change is expected to have a profound impact on disturbance changes. An increase in disturbance frequency and severity has been documented over large parts of the globe and is expected to increase in the coming decades [29]. Typical gap sizes and spacings have been well characterized for other natural disturbances, but little is currently known about landscapes formed by tornadoes. Better characterization of tornadoes will provide more knowledge of the variability of tornado impacts on forests, as well as their ecological significance [30].
In Canada, there has been a move to more refined silvicultural practice recently, and this has prompted questions related to the increased risks of significant wind damage [5,31]. Since the frequency and severity of tornadoes will probably increase in the coming decades [32], it is vital to accurately determine what storm intensities (i.e., critical near-surface wind speeds) will cause the majority of damage [33,34]. Tornado hazard analysis in Ontario suggests that the annual probability of exceedance of tornadic gust wind speeds for point objects is relatively low compared to that of synoptic winds [35]. However, for long objects such as a forest, tornadic wind speeds dominate the extreme non-tornadic wind speeds with longer return period events.
Windthrow vulnerability assessment for synoptic weather systems is commonly conducted through hybrid-mechanistic and empirical models using both deterministic and stochastic approaches [36,37,38]. The basis of a number of these methods are mechanistic models of tree stability based on static tree-pulling field tests, and these ultimately provide critical wind speeds for windthrow and stem break failures. This work has identified correlations between tree form and stand characteristics and the different types of tree failure, and this has led to the identification of many relevant variables to explain the occurrence of wind related forest damage [38,39]. Further work has developed these methods to provide long-term forest damage simulations, for the optimal management of these resources, to maximize revenue and minimize risks [40]. However, most of the previous work has been done on single-species, uniform stands [36], and none of the work relates to the mechanistic response to tornadic wind-fields [18], which may have significant uplift loads and very different gust structures.
The work described in this paper forms part of the Northern Tornadoes Project (NTP), which is a collaboration between the University of Western Ontario’s Faculty of Engineering and the Meteorological Research Division of Environment and Climate Change Canada (ECCC). The project is focused on the detection of tornadoes across Canada, particularly in forested areas. It is known that intense thunderstorms occur in many sparsely populated areas of Canada, but tornadoes associated with such storms are rarely reported [41]. This has resulted in large gaps in our tornado climatology. A previous study to determine Canada’s tornado-prone regions attempted to fill in these gaps using statistical modelling [41]. The results suggest that only ~30% of the tornadoes that occur in Canada are being positively verified. A similar but more conservative method was used by Cheng et al. [42] and estimated that only ~50% of tornadoes were identified. The main goals of the NTP are to (a) enhance our understanding of actual tornado occurrence and risk in Canada, (b) validate the statistical modelling and (c) improve methods for the detection of tornado damage paths, particularly in rural/remote locations. Currently, there is considerable uncertainty with regard to the influence of climate change on tornado size, frequency and intensity in Canada. Preliminary data suggest that tornado frequency has not changed significantly, but this is based on a small and regionally disparate sample [43]. In the United States, research suggests that whilst the number of tornadoes has not changed significantly, they are occurring in families more often [44]. There have also been changes in the annual timing of the events, and the regional maximum appears to be shifting eastwards. Knowledge of the climatology of tornadoes in Canada is still in flux, and it is hoped that projects such as the NTP will help to provide better predictions of future tornado activity.
In this paper, a method that has been successfully used previously to predict the characteristics of tornadic wind fields from treefall patterns is employed [27,28]. However, the emphasis of the work is different for the earlier studies; the model is now primarily used for estimating windthrow and stem breakage susceptibility of trees due to different tornadic wind fields. This paper describes the tornado and tree damage models used, the calibration and validation of the models with forest damage from a Manitoban tornado event, the results of a parametric study investigating the effects of tornado and tree and soil characteristics and discusses the implications of the findings for forest ecology and management. The benefits of this type of wind damage reconstruction are in aiding risk assessments for insurance, emergency managers and forest authorities [45,46]. Simulations of possible tornadoes passing through forested areas can be used to calculate the risk of windthrow or stem breakage of trees.
2. Methods
2.1. Model Description
In this study, the Rhee and Lombardo model [28] has been modified to include more accurate windthrow and stem breakage models and has been used to assess the uprooting and/or stem breakage susceptibility of trees during tornadoes. The new windthrow model included addresses the tree failure from a geotechnical engineering perspective that enables the effects of soil properties and state to be assessed. In this model, the tree root structure has been approximated as a circular footing with radius (R) and thickness (d) that represents the root volume spread and depth, respectively. Analogous to shallow structural foundations subjected to general loading conditions, the uprooting resistance of the equivalent root-plate footing can then be predicted.
The stem breakage model is based on a more standard approach. When the applied wind load during a tornado induces stress in the outer fibers of the tree stem that exceed the modulus of rupture (MOR) for green timber, the stem is assumed to break [47].
2.1.1. Tornado Vortex Model and Treefall Patterns
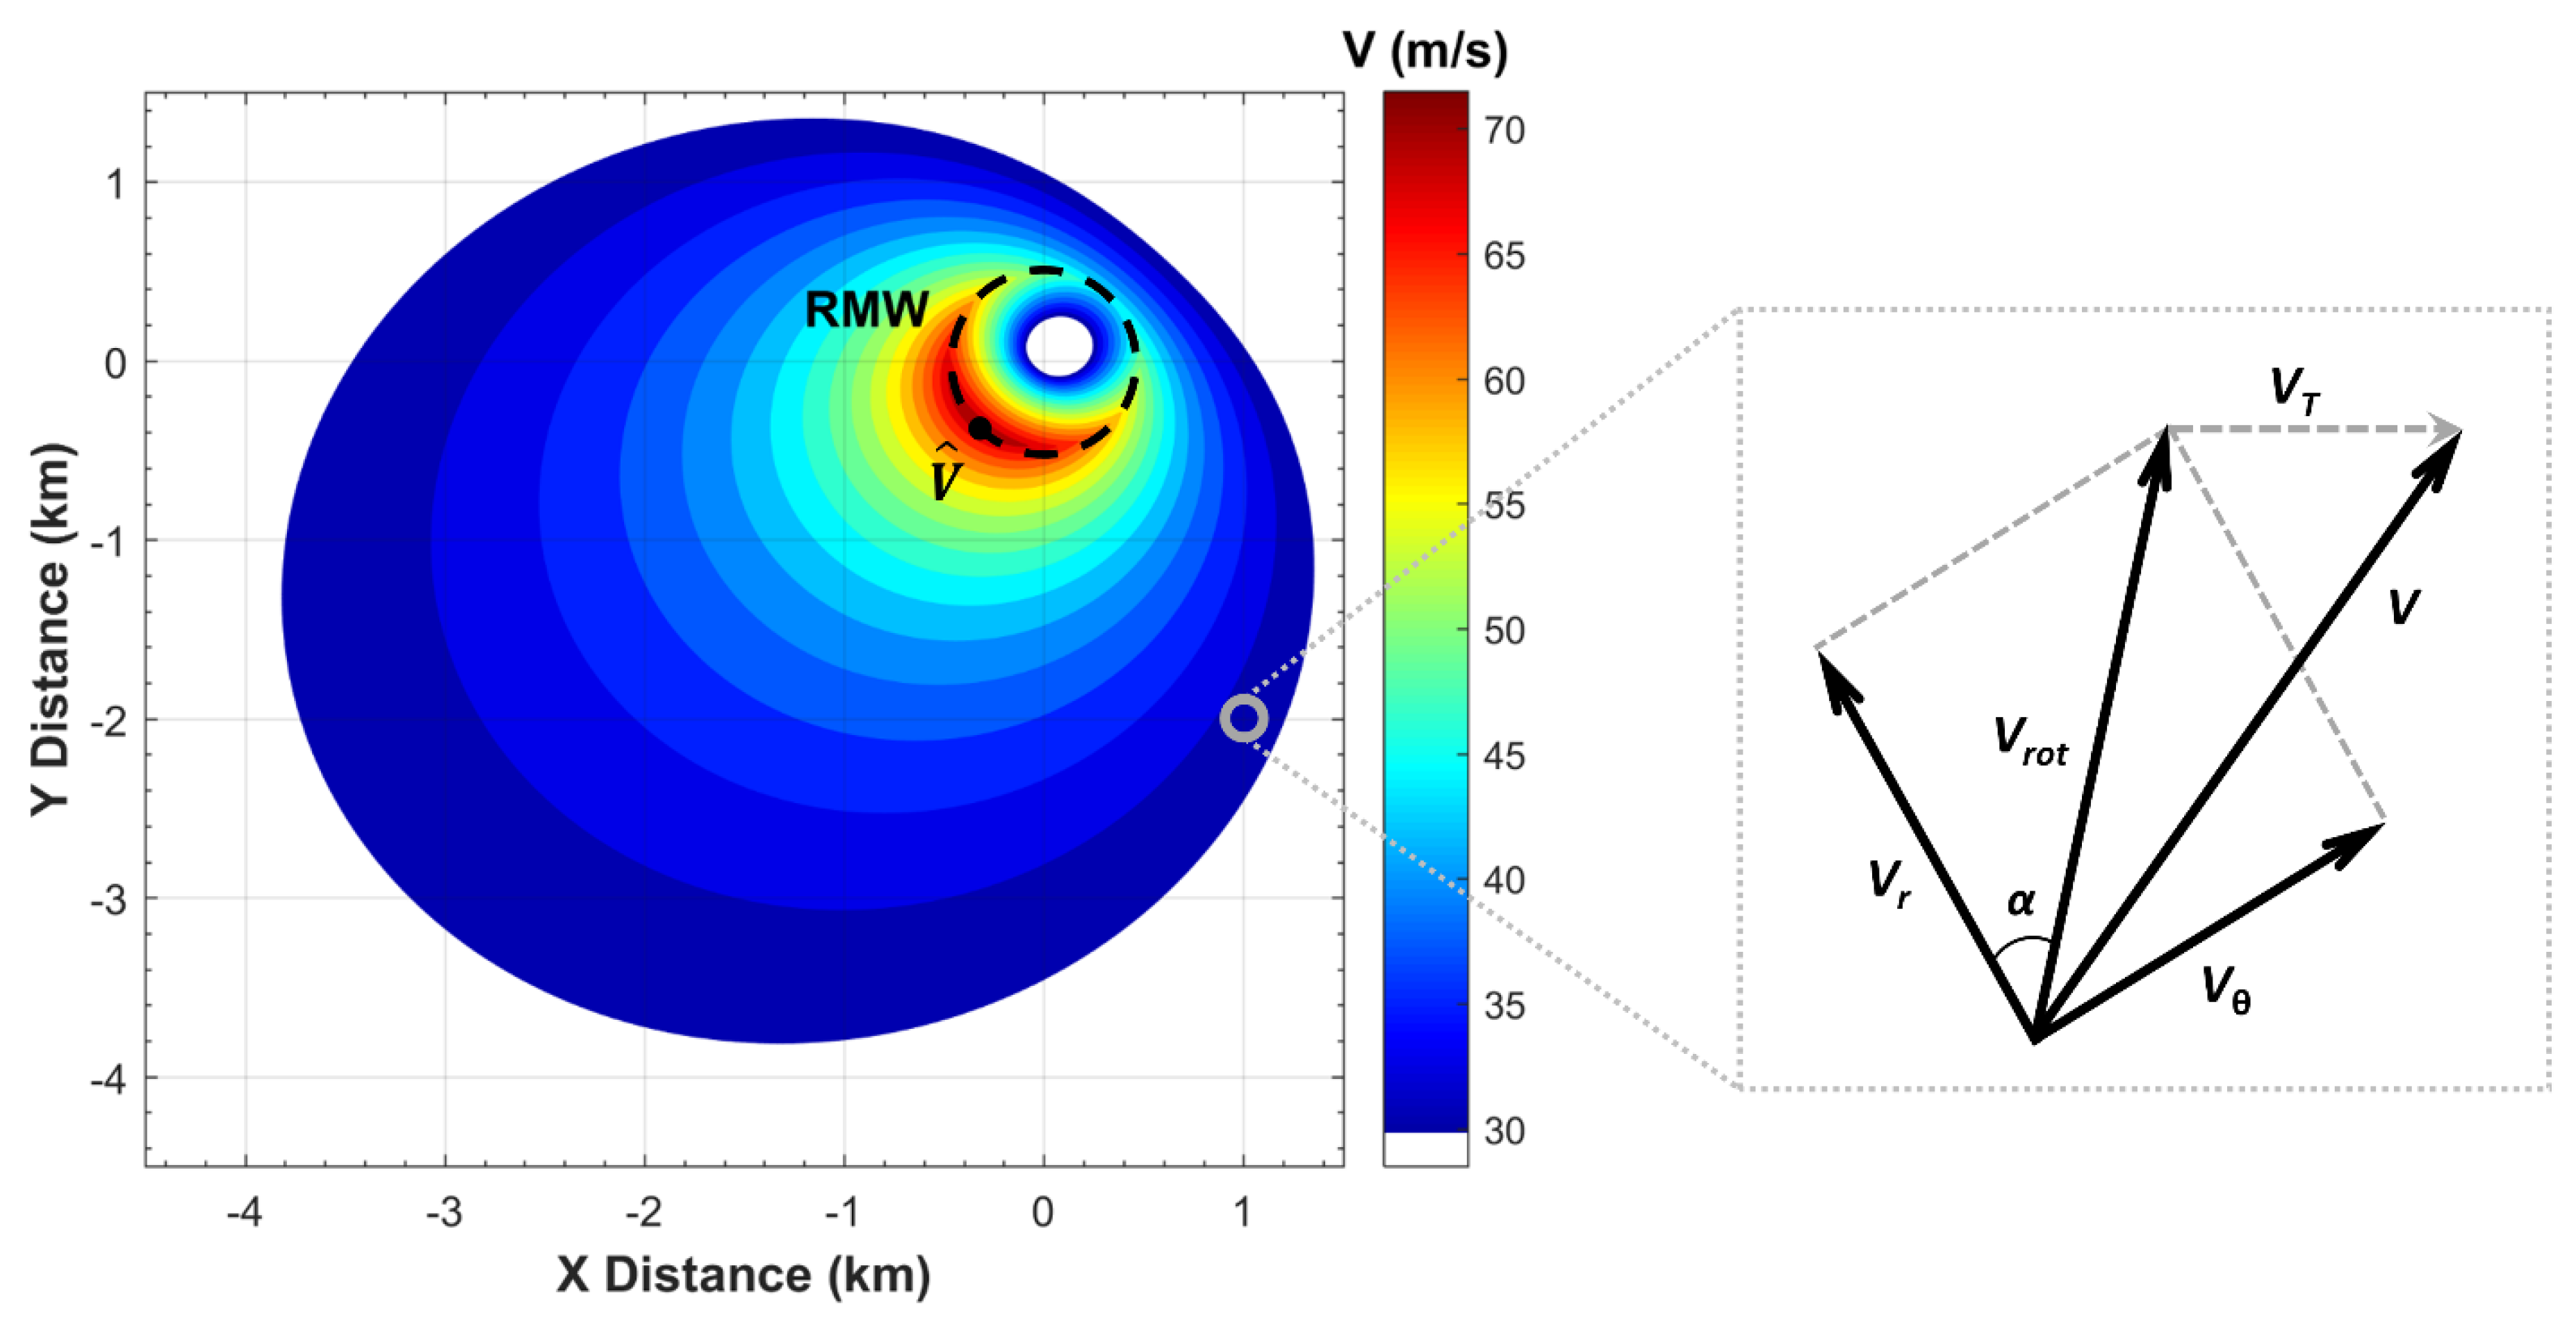
Rankine vortex (RV) model is an idealized vortex model commonly used to describe the rotational wind field of a tornado [48]. The internal rotation wind speed (Vrot) increases until the wind speed reaches a maximum wind speed (Vmax), where the radius is called the radius of maximum wind speed (RMW). The wind speed then starts to decay at greater distances from the vortex center. The rotational wind speed is a function of radius (r), RMW, and a decay exponent (φ) as shown in Equation (1):
Although a decay exponent value of one was suggested by [25], field radar data have shown variations of the decay exponent from 0.5–0.8 [49,50,51]. The rotational wind speed can be decomposed into radial and tangential components (Vr and Vθ), as shown in Figure 1. The magnitudes of Vr and Vθ are determined by the angle (α) between Vrot and V. Adding the translational wind speed of the tornado (VT) to Vrot yields the resultant wind speed V at any specific radius. Finally, Gmax is the ratio between the translational speed (VT) and the maximum rotational wind speed (Vmax). Hence the Rankine vortex model can be completely defined by five parameters: VT, Gmax, RMW, φ and α. The reader is referred to [28] for more detailed information on each parameter. Figure 1 also shows the wind field of a translating vortex with arbitrary value of parameters. The RMW of the translating tornado is shown in dashed line and location of the total maximum resultant wind speed () is represented by the black dot.
By introducing the critical wind speed (Vc), which is the speed at which a tree falls (due to windthrow or stem break), the treefall pattern of a tornado can be generated. The tree falls in the direction of the wind blowing at the instant when V exceeds Vc, and these have been determined using the mechanistic tree models described in the next sections.
2.1.2. Windthrow Model
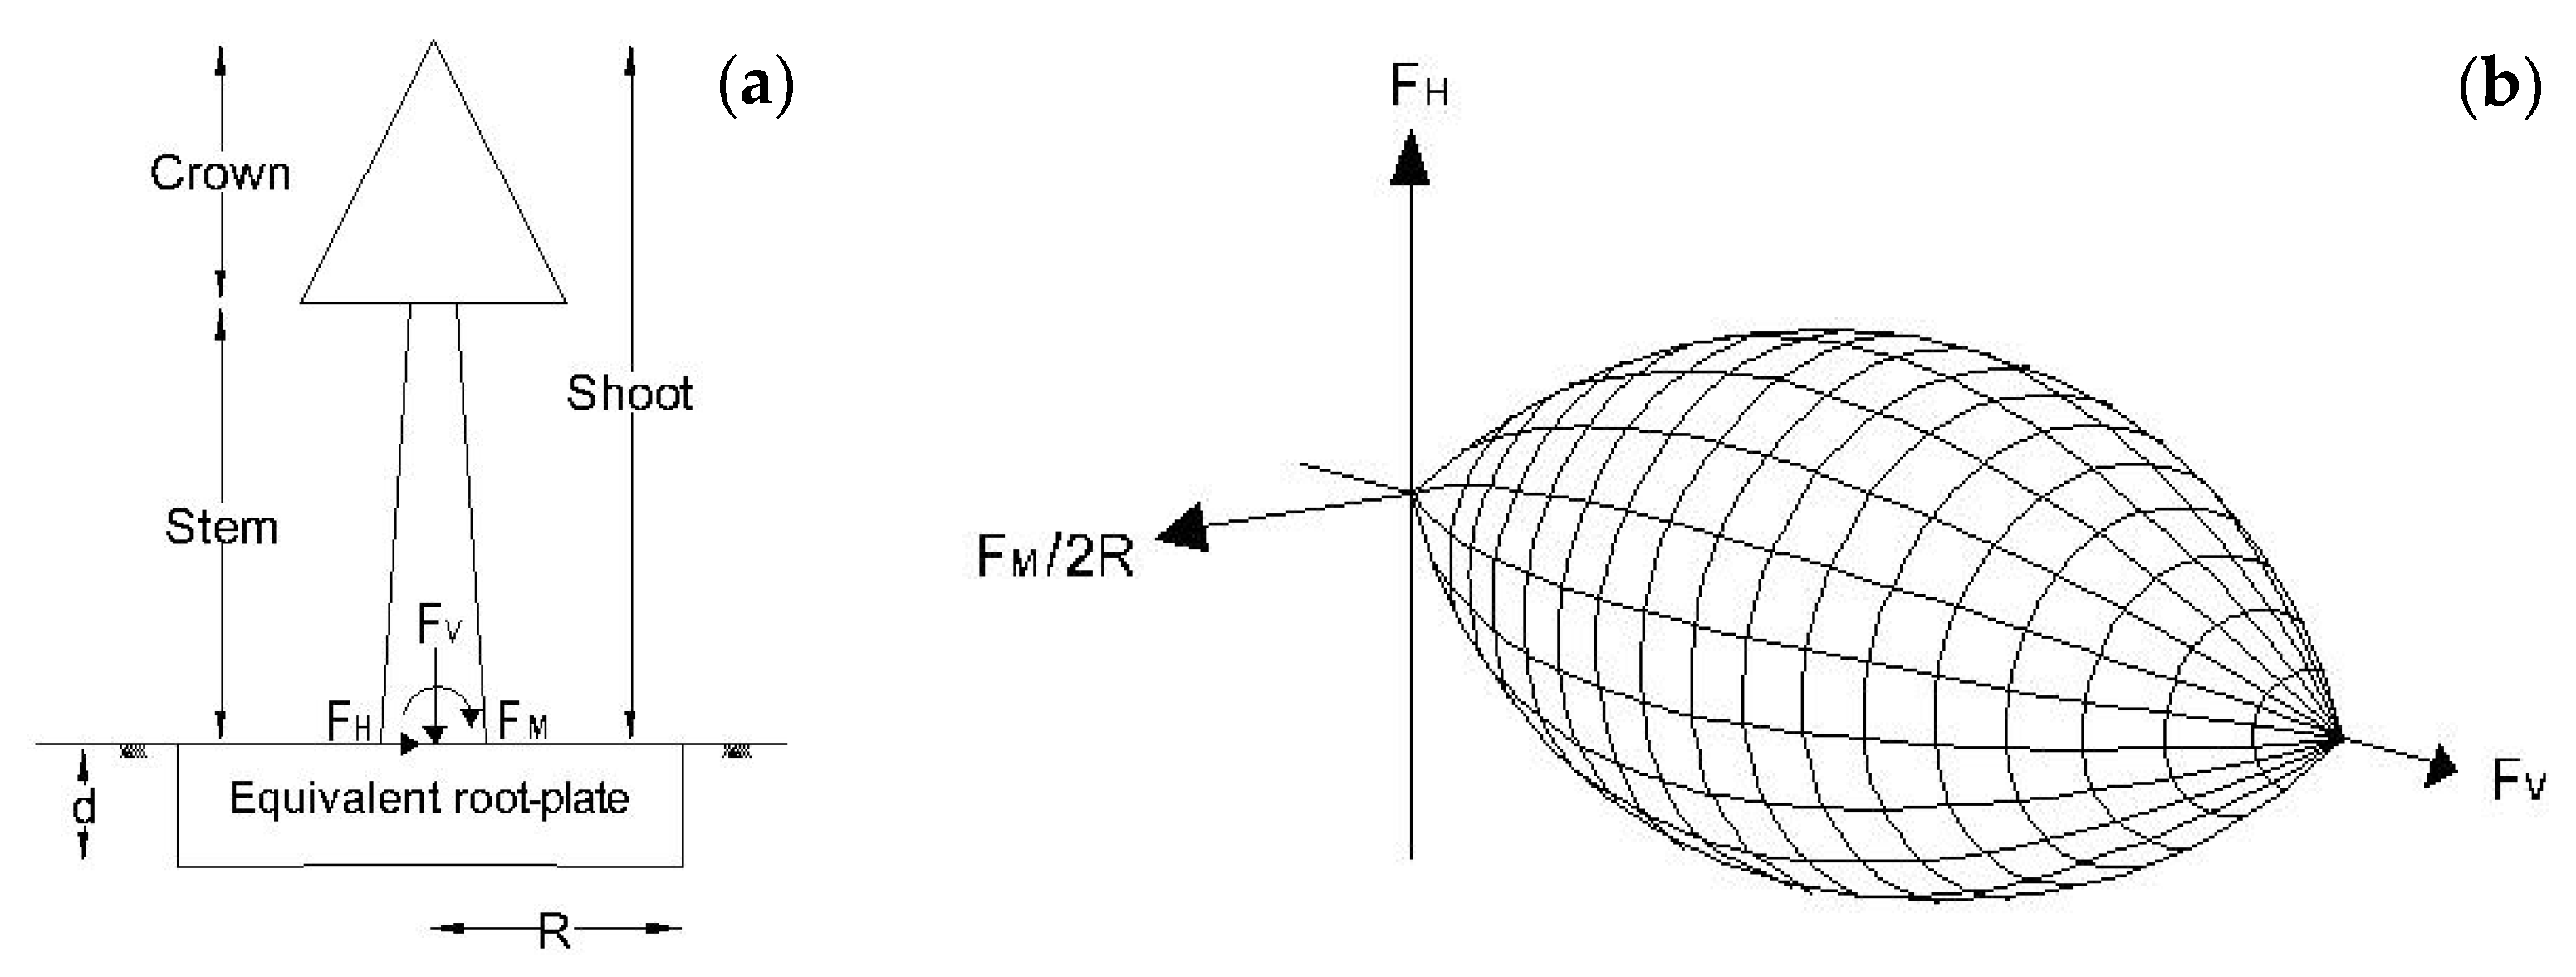
The mechanistic windthrow model assumes that a homogenized tree root structure is enclosed within a cylindrical root-plate volume with radius (R) and thickness (d) that represents the root spread and depth, respectively, as shown in Figure 2a. The root-plate “footing” is subjected to vertical load (FV) due to the above ground and below ground system weight (including the soil), horizontal force (FH) due to the wind load and bending moment (FM) at the stem base.
Similar to shallow structural foundations subjected to a general loading condition in (FV-FH-FM/2R) space, the uprooting resistance of the equivalent root-plate footing can be predicted using a 3D load failure envelope shown in Figure 2b that can be characterized using Equation (2). The 3D failure envelope is a rotated parabolic ellipsoid. Sections perpendicular to the FV-axis can be represented by a rotated ellipse, whilst sections along the FV-axis can be approximated by a parabola. It should be noted that the applied bending moment is normalized by the root-plate diameter (2R) to preserve dimensional homogeneity. Load combinations that lie within the surface are stable; whereas those that exceed the dimensions of the surface will lead to windthrow of the tree.
where Vo is the vertical uniaxial failure capacity, ho is the maximum non-dimensional horizontal failure capacity (FH/Vo) for zero moment over the full range of FV, mo is the maximum non-dimensional bending moment failure capacity (FM/2RVo) for zero horizontal load over the full range of FV, e is a parameter that describes the ellipse eccentricity/rotation in the FH-FM/2R plan (i.e., e = 0 corresponds to a circular failure surface), R is the footing radius, β1, β2, β12 are the failure surface shape parameters and to is the non-dimensional tension parameter, which is the ratio between the maximum pure vertical pullout load (Pu) and Vo.
| Y = (FH/hoVo)2 + (FM/2RmoVo)2 − 2e (FH/hoVo) (FM/2RmoVo) − β122 (FV/Vo + to)2β1 (1 − FV/Vo)2β2 = 0 |
| β12 = (β1 + β2)β1+β2/[β1β1 β2β2 (to +1)β1+β2] |
The vertical uniaxial failure capacity (Vo) is calculated by multiplying the soil bearing capacity (Qult) by the root-plate area. The soil bearing resistance can be estimated using the general bearing capacity formula [53]:
where c′ is the soil cohesion, q′ is the effective vertical stress at the root-plate base, D is the root-plate diameter (i.e., 2R), γ′ is the effective soil unit weight (γ − γw), γ is the total soil unit weight, γw is the unit weight of water and Nc, Nq and Nγ are the general bearing capacity factors [54,55,56].
Qult = c′Nc + q′Nq + 0.5Dγ′Nγ
For a pure vertical pullout loading condition, the upward movement of the tree is expected to be accompanied by a separation of a percentage of the outer root length from the surrounding soil. This separation can be attributed to frictional loss at the soil-root interface and the decrease in the number of roots involved in resisting the loads at the outer boundaries of the equivalent root-plate [57,58]. Thus, the maximum pure pullout load (Pu) of the tree can be estimated using Equation (4):
where Wsh is the shoot weight (stem + crown), Wrp is the root-plate weight and Qs is the pullout contribution of the exposed root length (i.e., which represents approximately 10% of the total pullout resistance).
Pu = Wsh + Wrp + Qs
Several studies have previously been conducted to determine suitable values for the parameters (ho, mo, e, β1 and β2) of the failure surface presented in Figure 2b for foundations [52,59,60,61,62,63]. According to these studies, β1 and β2 can be taken as 0.85 and 0.92, respectively. Strong relationships were also observed between ho, mo and e and the depth to diameter ratio (d/2R) in these studies. Therefore, these three parameters are estimated using Equations (5)–(7).
ho = 0.1236 + 0.1088 (d/2R)
mo = 0.0771 + 0.042 (d/2R)
| e = −2.143 (d/2R) for 0 < d/2R < 0.42 |
| e = −0.9 for d/2R > 0.42 |
Further details of this mechanistic windthrow model are provided elsewhere [64].
2.1.3. Stem Breakage Models
The tree resistance to stem breakage is based on the assumption that the wind induced stress in the fibers of the tree stem is constant at all points between the canopy and the butt, as well as at the stem base [65]. Thus, the applied stress, e.g., at breast height or at any other height can be calculated, and when it exceeds the MOR for green timber, the stem will break [47,66]. Therefore, the maximum bending moment (Msb) that a tree stem can withstand without breakage can be calculated using Equation (8).
where Msb is the critical bending moment for stem breakage, MOR is the modulus of rupture, B is the stem diameter and Knot is the knot factor to account for reductions in the capacity due to knots and other wood defects.
3. Results
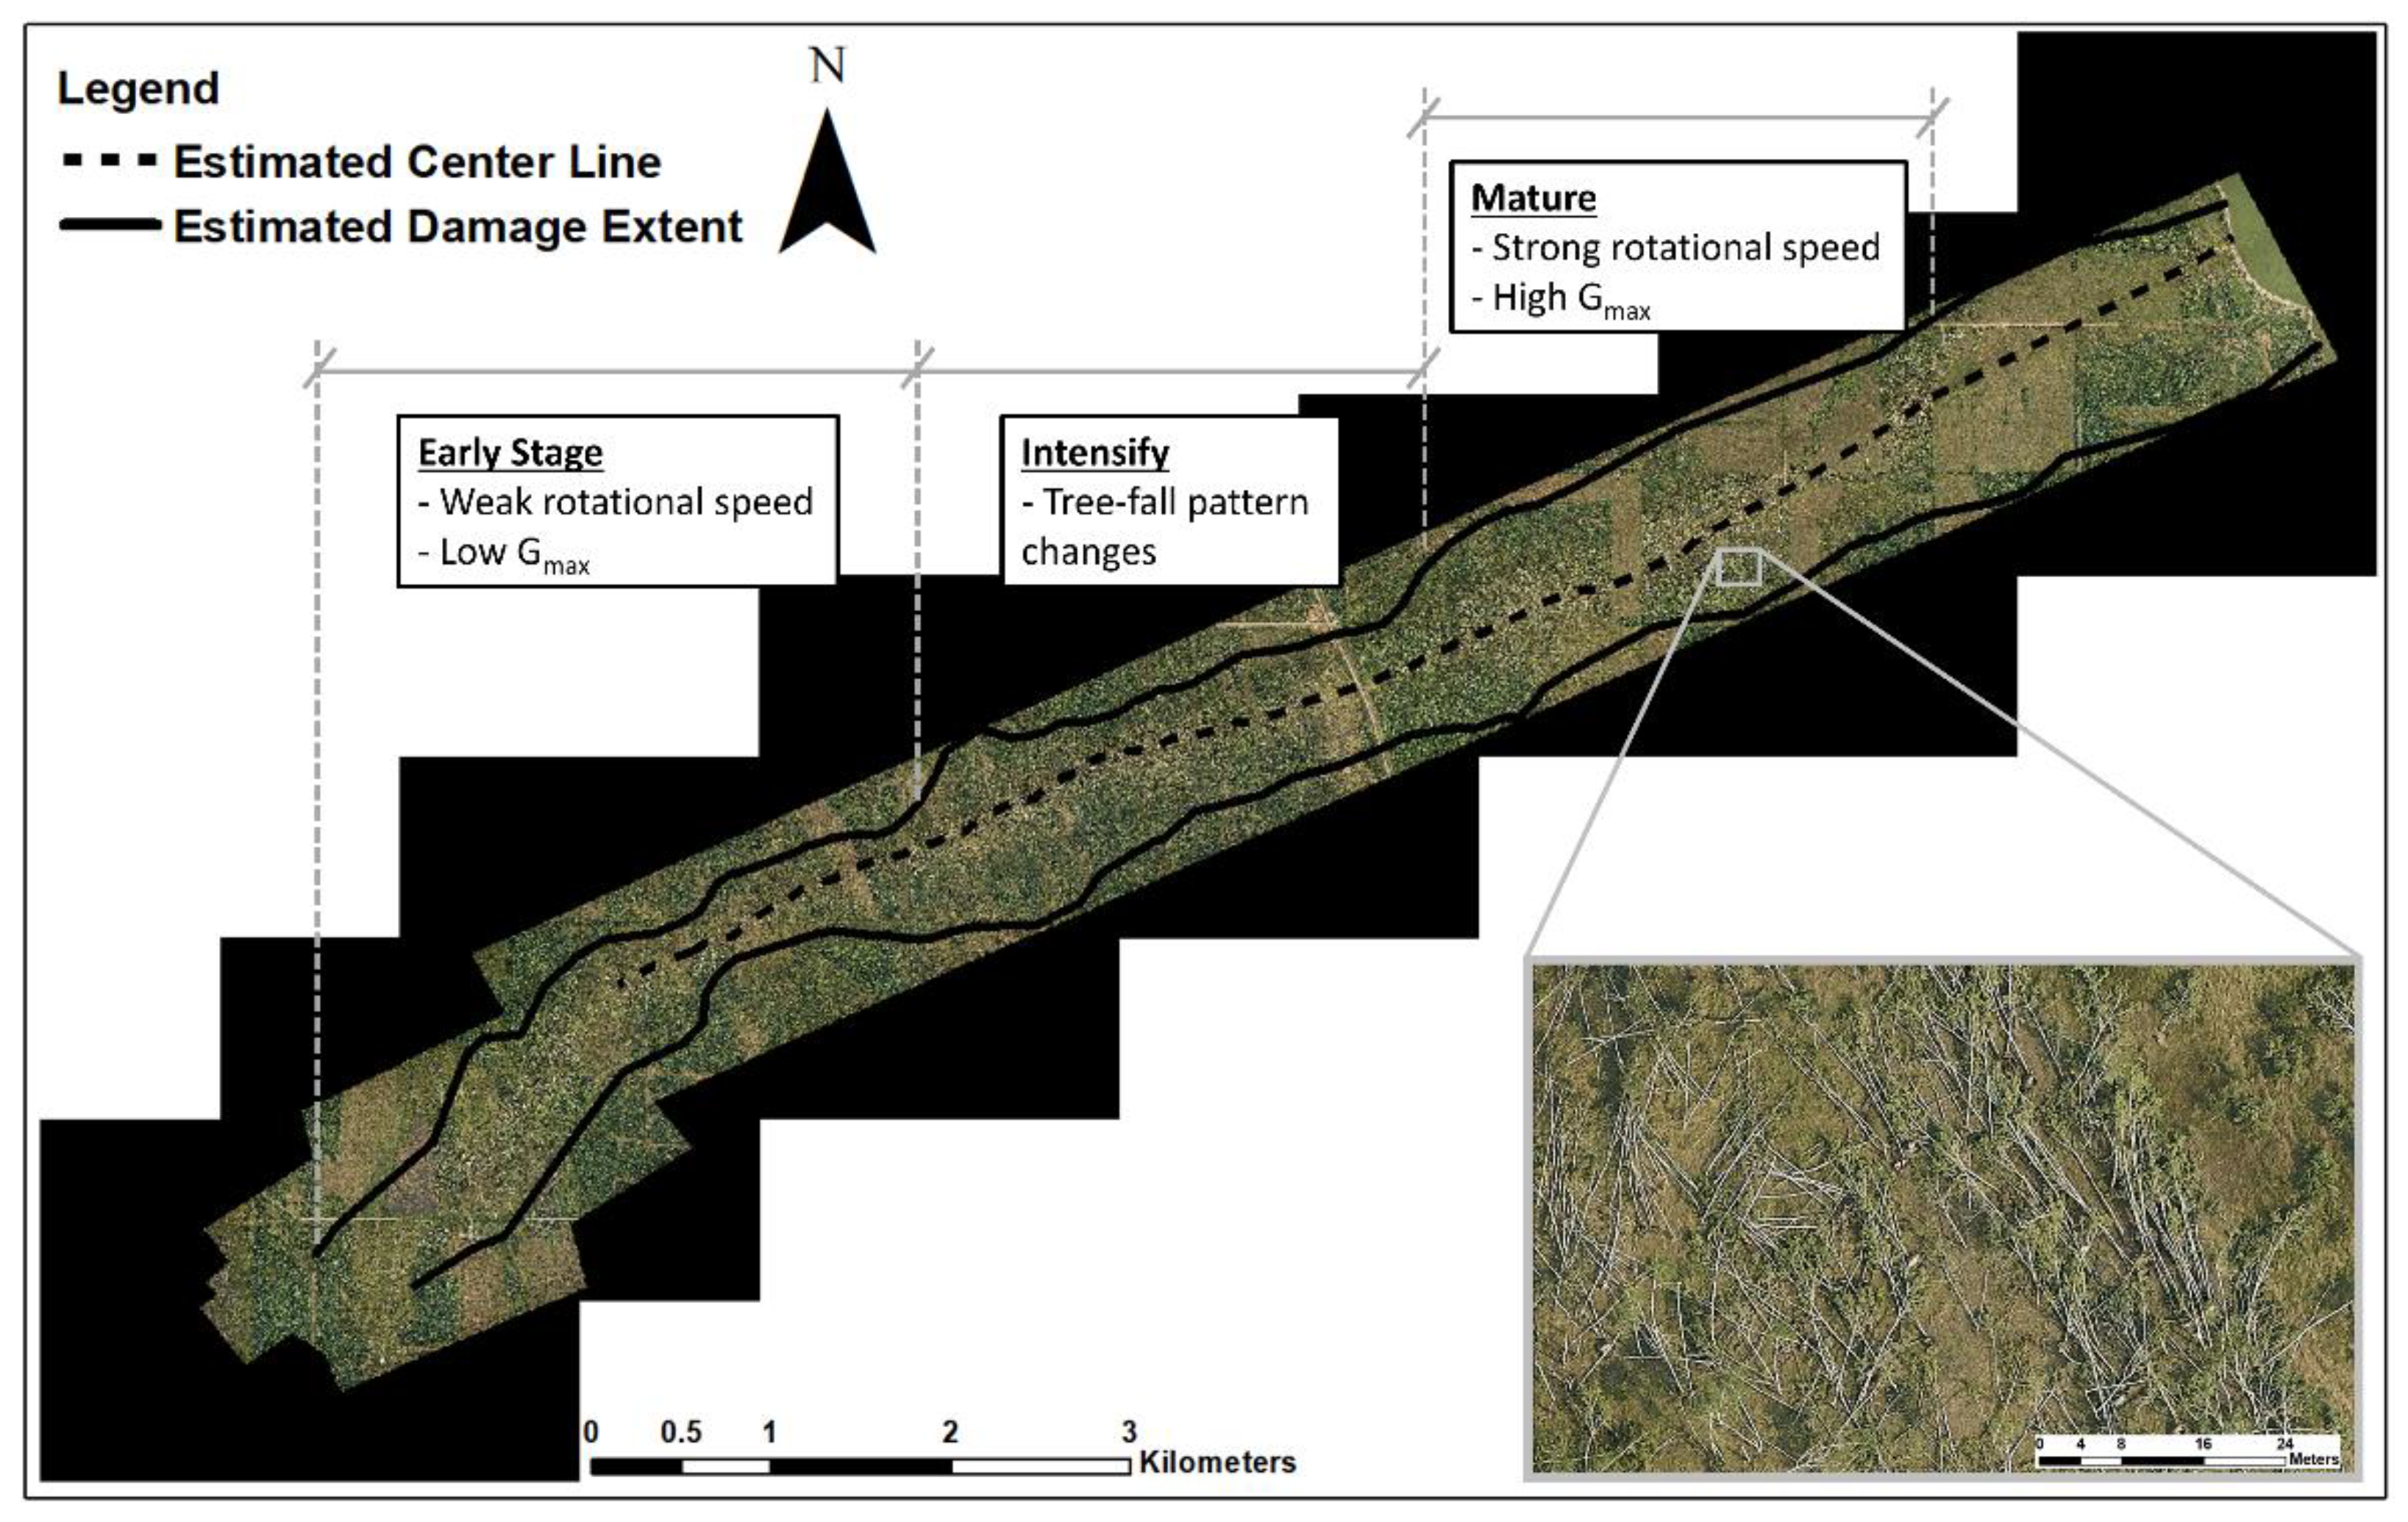
To evaluate and calibrate the windthrow and stem breakage models, a treefall analysis has been conducted in a Manitoba forest following the Alonsa tornado. This tornado occurred west of Lake Manitoba on 5 August 2018, producing an estimated wind speed between 74 and 89.2 m/s (classified as an EF4 tornado) according to Environment Canada. The Alonsa tornado track (shown in Figure 3) is approximately 12.5 km long with a maximum damage width of 800 m. As can be observed from the figure, the damage distribution within the tornado track is very complex, likely resulting from the continuously varying structure of the tornado [67], with evidence that the tornado varied in Gmax, and rotational wind speed along its length, in turn causing variation in tree damage. Most tornadic wind fields vary spatially and temporally, and thus tornado wind field models should be capable of capturing these variations in the wind components [35].
A series of aerial photos were acquired ten days after the tornado from the Northern Tornadoes Project [68] by a plane flying at approximately 300 m above the track. Orthomosaic images at a pixel resolution of 5 cm were produced, and the tornado centerline and damage extent were estimated as shown in Figure 3. The tornado centerline was estimated based on the location where the most extensive damage happened [28], while the damage extent was estimated according to the location of the furthest damaged tree on both sides (north and south) of the tornado center.
The damage track width eventually extended to 800 m at the mature stage, but some of this damage may possibly have been non-tornadic, such as an inflow band [26]. A non-random convenience sample of 114 damaged trees (i.e., 61 uprooted and 53 stem broken) along the first 6.5 km of the tornado track were extracted and their dimensions (height, DBH, etc.) were measured using ArcGIS software [69]. Trees were selected based on the availability of clear images to determine their dimensions; fallen trees with significant overlap with their neighbors were rejected. Although this is not a truly random sample, the expectations for major bias from this process was believed to be low. Because the imagery had a resolution of 5 cm pixel−1, tree dimension measurements are constrained to an accuracy of not better than 5 cm. These 114 trees were not obscured beneath other trees; therefore, dimensions can be determined from the aerial imagery. Ground observations show that most of the damaged trees along the tornado track belong to trembling aspen (Populus tremuloides Michx) and other hardwood species (e.g., balsalm poplar (Populus balsamifera L.)).
3.1. Windthrow Model
3.1.1. Model Calibration
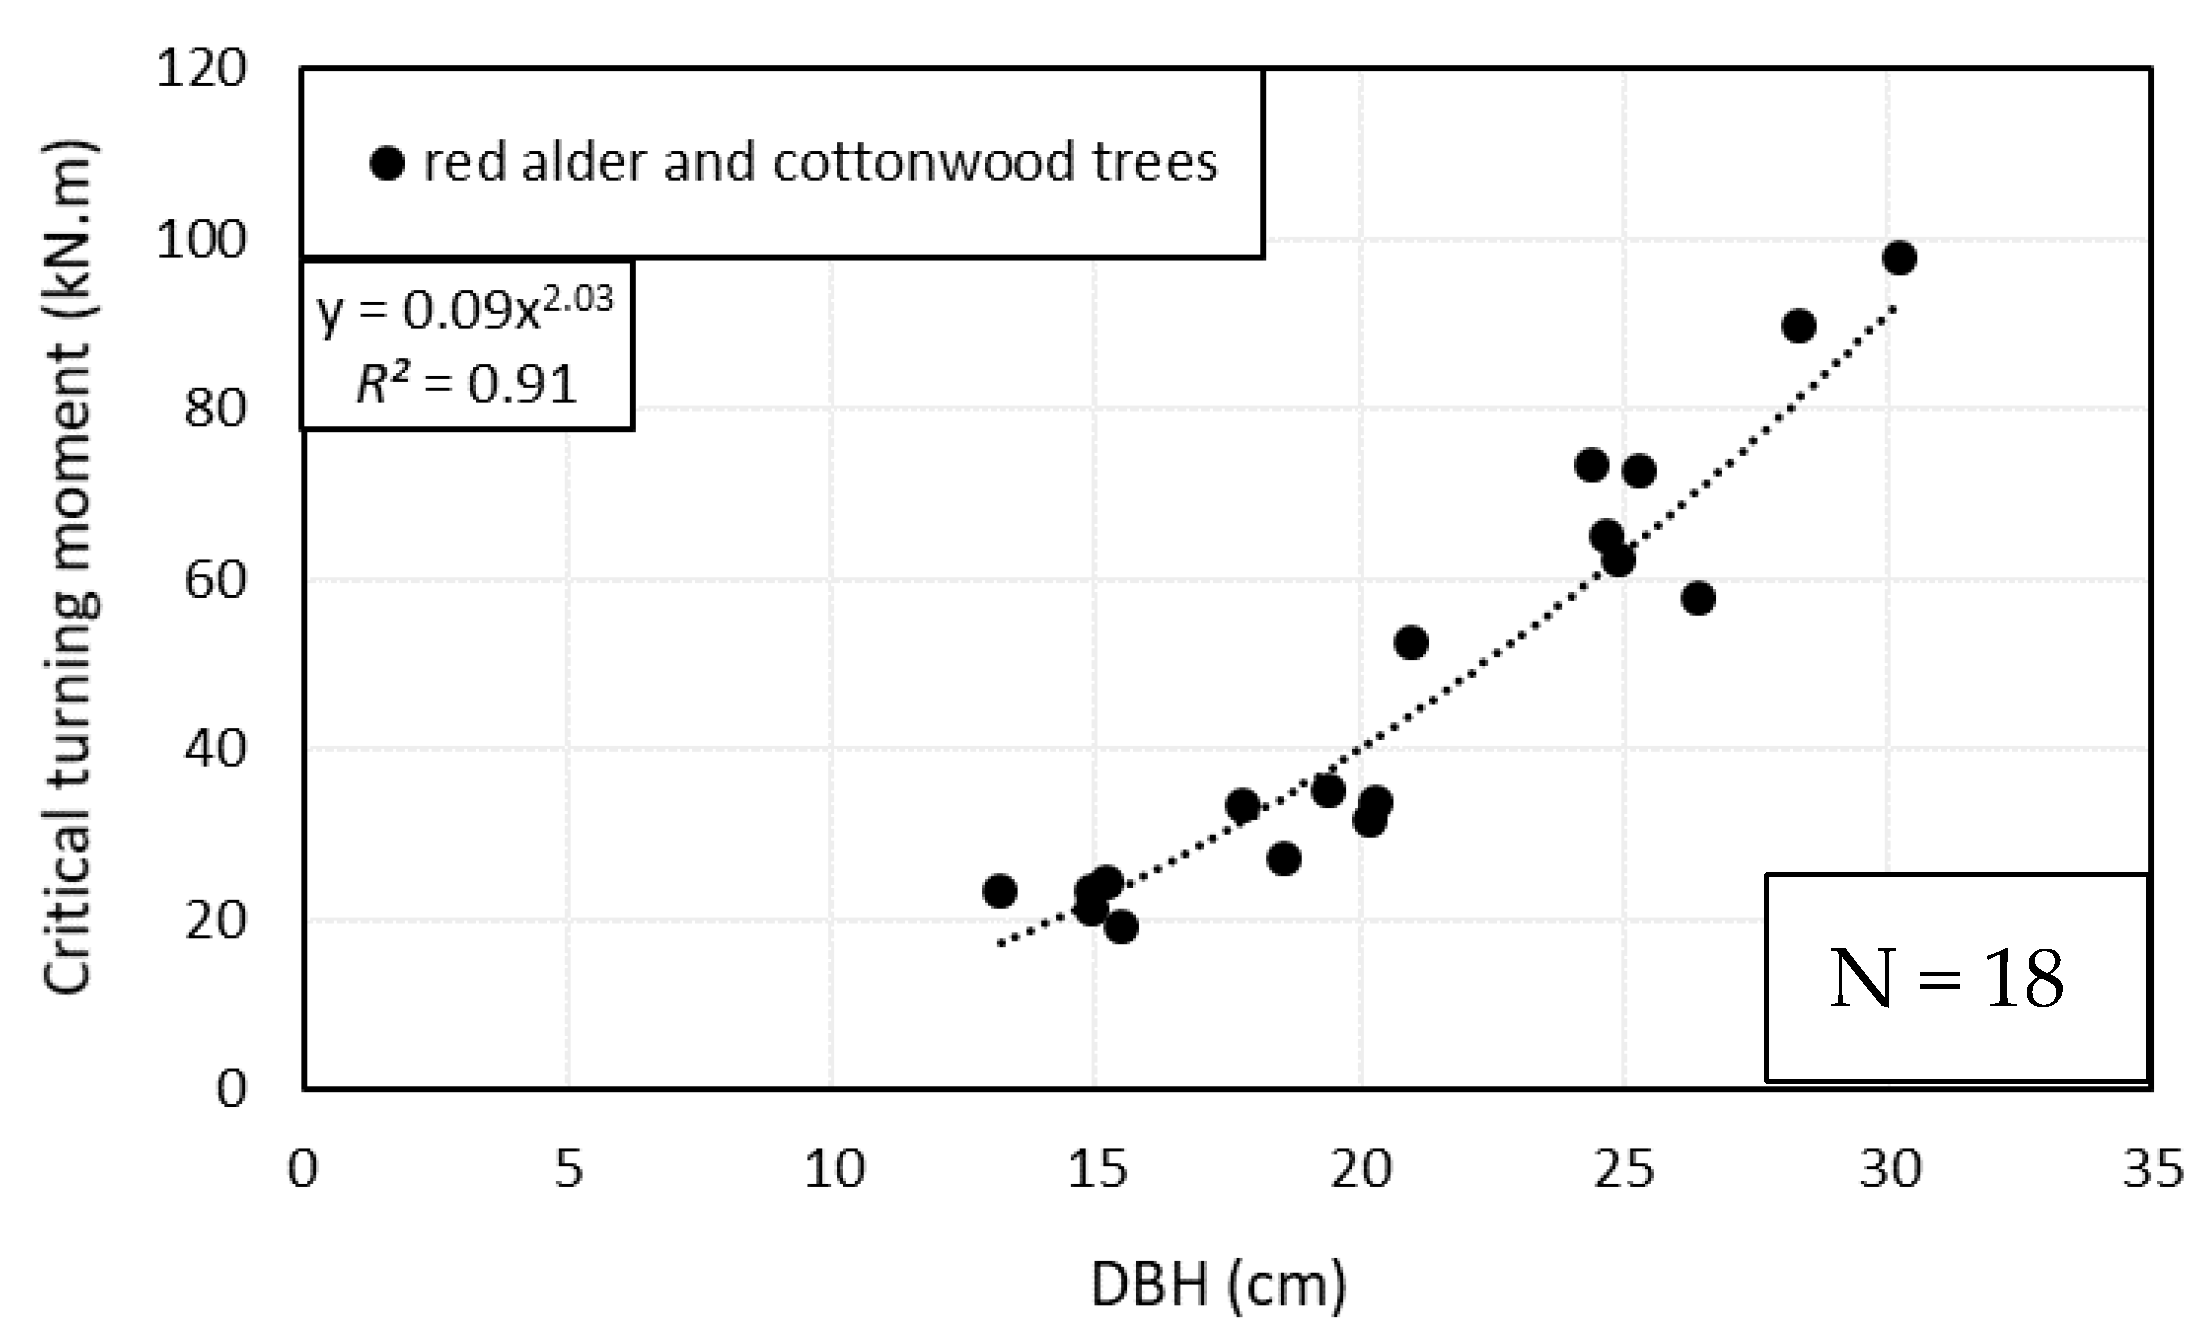
Due to the scarcity of information on the uprooting resistance of trembling aspen in the literature, the winching test results of similar hardwood species such as red alder (Alnus rubra Bong) trees [70] and Fremont cottonwood (Populus fremontii Wats) trees [71] were used for the model calibration. These two datasets have been combined, and the strongest correlation was observed between the critical overturning moment (FM) and the diameter at breast height (DBH) as presented in Figure 4. Thus, for these hardwood species (e.g., red alder, cottonwood, trembling aspen, etc.), the critical overturning moment can be calculated using Equation (9).
where FM is the critical overturning moment in (kN·m), and DBH is the diameter at breast height in (cm).
FM = 0.09 (DBH)2.03
The ArcGIS software was used to analyze the aerial photos and obtain information about the sample of 61 uprooted trees (i.e., tree height, DBH, and crown and root-plate dimensions) described in Table S1. The critical applied load (FH) responsible for tree uprooting can be estimated by dividing FM from Equation (9) over the height of the wind load (i.e., weighted average of the wind loads acting on both crown and stem). The corresponding critical wind speed (Vc) was then back calculated using the drag equation as follows:
where FH is the critical wind load, ρ is the air density (1.2 kg/m3), A is the tree area (stem + crown) from ArcGIS image analysis, Vc is the critical wind speed and Cd is the drag coefficient. For trembling aspen species, Cd at Vc > 20 m/s is equal to 0.28 [72].
FH = 0.5 × ρ × Cd × A × Vc2
Figure S1 presents histograms showing the frequency of uprooted trees over the observed height, DBH and root-plate diameter ranges. The results show that 79% (i.e., 48 trees) of the sample of uprooted trees have DBH between 16 and 26 cm, while 87% of them have a height less than 15.0 m. Similar probability distributions depending on tree size (i.e., DBH) have been observed previously for windthrow [73] for southern boreal tree species. The figure also shows that 62% of the uprooted trees have a root-plate diameter between 1.4 and 2.15 m as illustrated in Figure S1c.
The histogram in Figure S3a shows the number of uprooted trees at different wind speeds. It is observed that the sample of uprooted trees has a lognormal distribution over the observed Vc range with a mean value of 62.3 m/s and a standard deviation of 17.9 m/s, which is illustrated by the probability density function (PDF) in Figure S4a. The percentage of windthrow trees at each Vc value can be obtained from the cumulative density function (CDF) shown in Figure S5a.
The soil textures along the tornado track were obtained from the Manitoba soil observatory and found to vary between sandy loam and silty loam. The soil properties (i.e., unit weight, soil cohesion and friction angle between soil particles) required to estimate the vertical bearing capacity (Vo) and the non-dimensional tension parameter (to) used in Equation (2) were then estimated based on available data in [58,74,75,76].
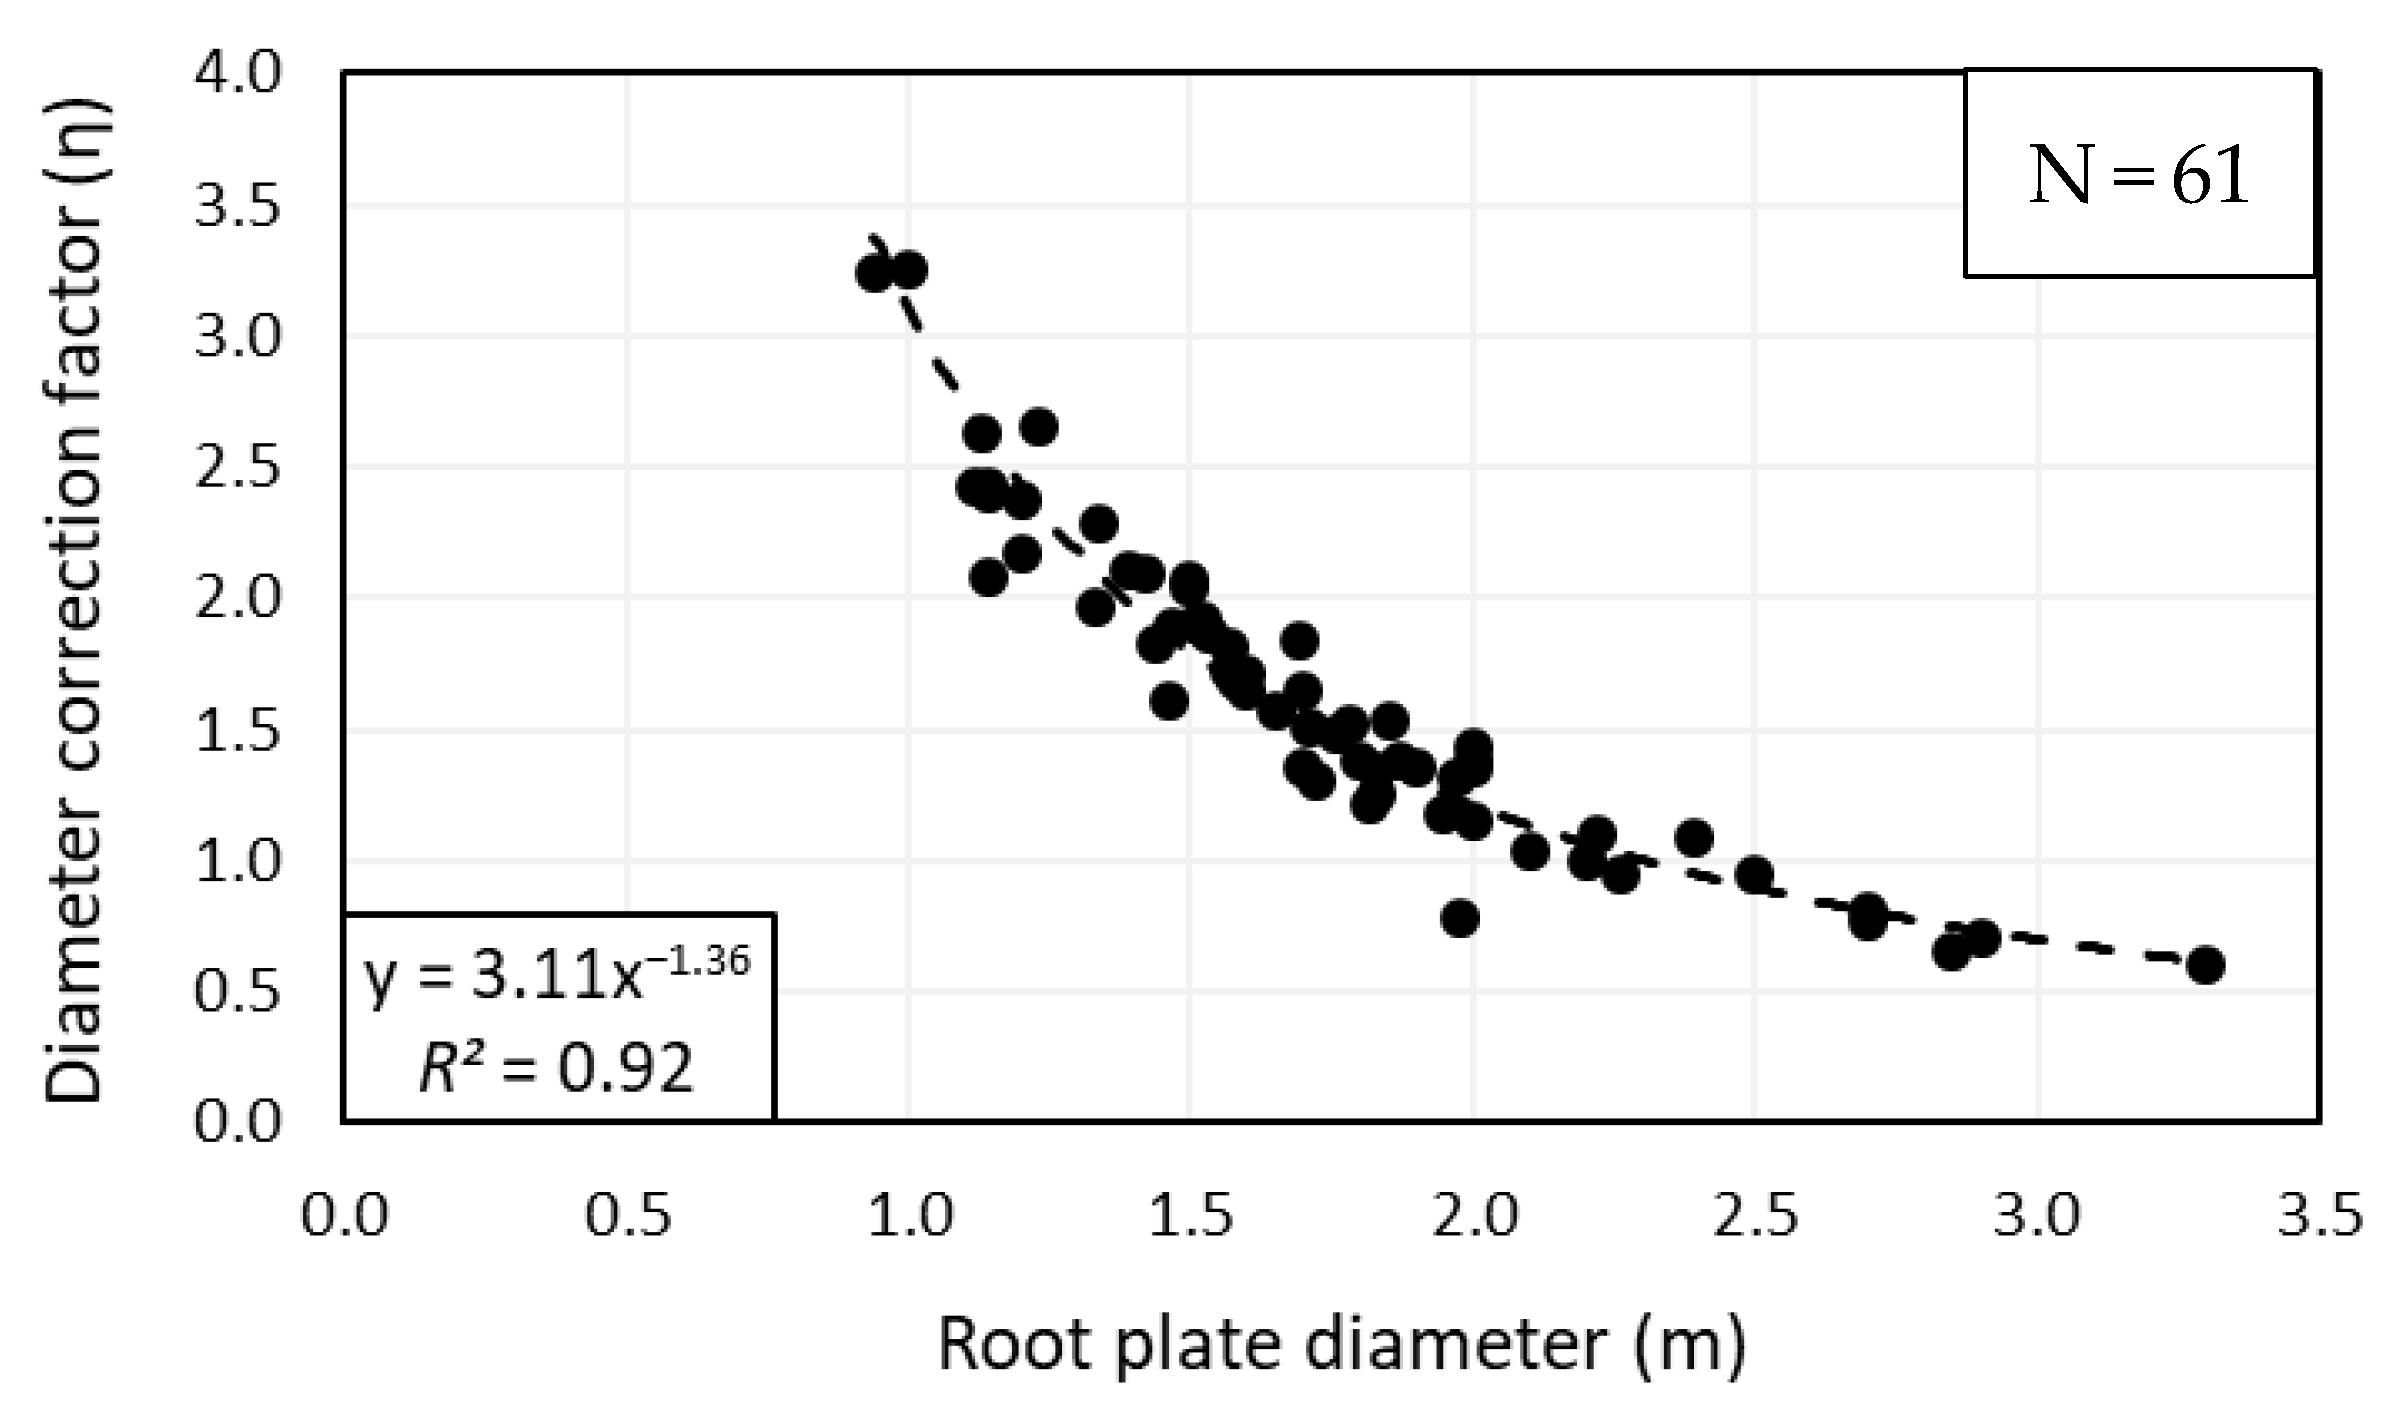
The windthrow analysis of the sample of 61 uprooted trees indicated that a correction factor needs to be applied to the root plate diameter to correctly fit the failure envelope in FV-FH-FM/2R space. This correction factor (η) is found to be a function of the root plate diameter as shown in Figure 5, and it can be estimated using the power function in Equation (11). This has been found for other species of trees and is thought to be due to allometric changes in the crown, trunk and roots as trees mature [64].
where η is the diameter correction factor, and D is the root plate diameter (2R).
η = 3.11 × D−1.36
3.1.2. Model Validation
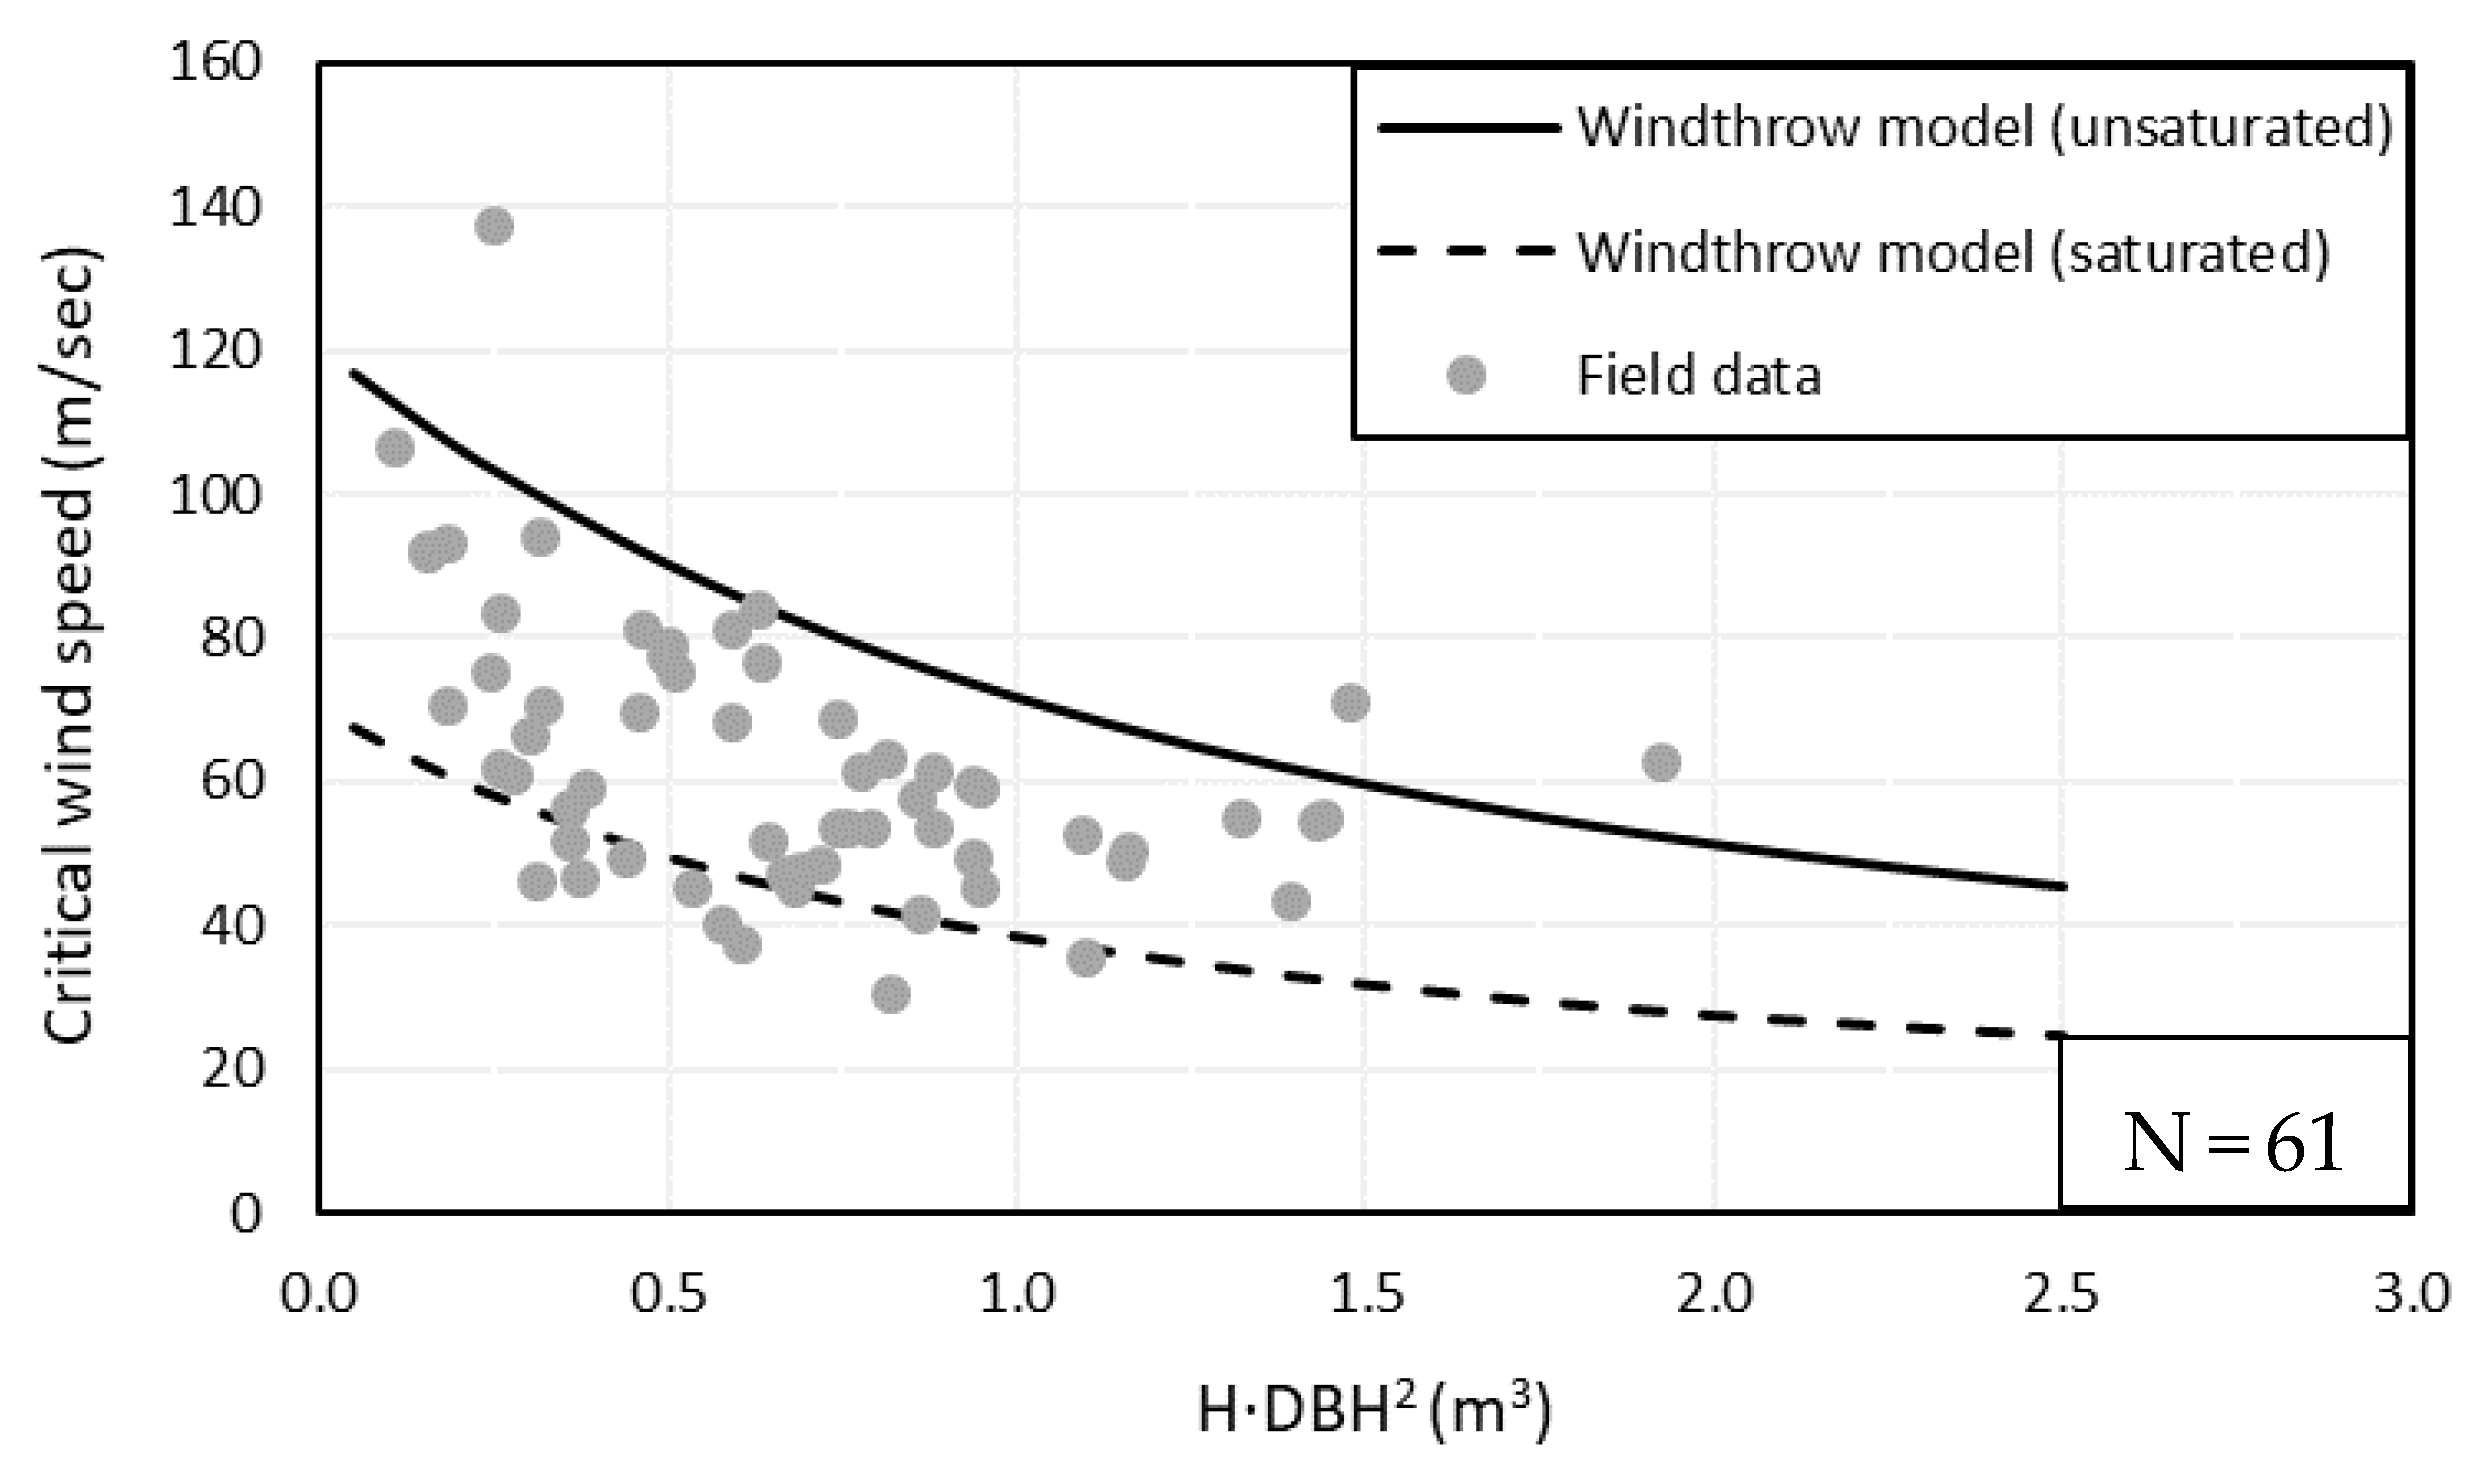
The windthrow model was validated using a different set of 12 trembling aspen trees with a tree volume (H·DBH2) varying between 0.05 and 2.5 m3 (described in Table S2). The wind load responsible for tree uprooting (FH) was calculated using Equation (2) considering the corrected root-plate diameter (i.e., 2Rc = η × 2R). The critical wind speed (Vc) was then back calculated from Equation (10).
The windthrow analysis also shows that the soil moisture condition (i.e., effective soil density, γˋ) is vital in determining the uprooting resistance of trees during tornadoes due to its effect on both Vo and to. Thus, the windthrow model was used to account for unsaturated (i.e., high soil density, γˋ = 17.0 kN/m3) and saturated (i.e., low soil density, γˋ = 3.0 kN/m3) soil conditions. Figure 6 shows the relationship between the critical wind speed (Vc) and tree volume (H·DBH2) for these two conditions. As can be observed from the figure, the developed windthrow model provides a good representation of the uprooted tree response along the tornado track, and the unsaturated and saturated soil conditions appear to represent the upper and lower bounds of more than 82% of the field data, respectively. The figure also shows a decrease in the Vc values with increasing tree size/volume. This behavior can be attributed to the increase in the tree area (stem + crown) and the height of wind load application and has been observed previously by Peterson [21] and others. Consequently, higher wind loads (FH) and overturning moments (FM) can be obtained at lower critical wind speeds.
3.2. Stem Breakage Model
To estimate the maximum bending moment a tree stem can withstand without breakage (Msb), the ArcGIS software was used to obtain information about the crown size and the length (L) and diameter (B) of the broken stem segments of the damaged trees. The analysis of the aerial photos shows that the differences in the stem diameter is generally negligible. Thus, the diameter of the broken stem segment (B) can reasonably be approximated to the diameter at breast height (DBH). Hence, Equation (8) can be re-written as follows:
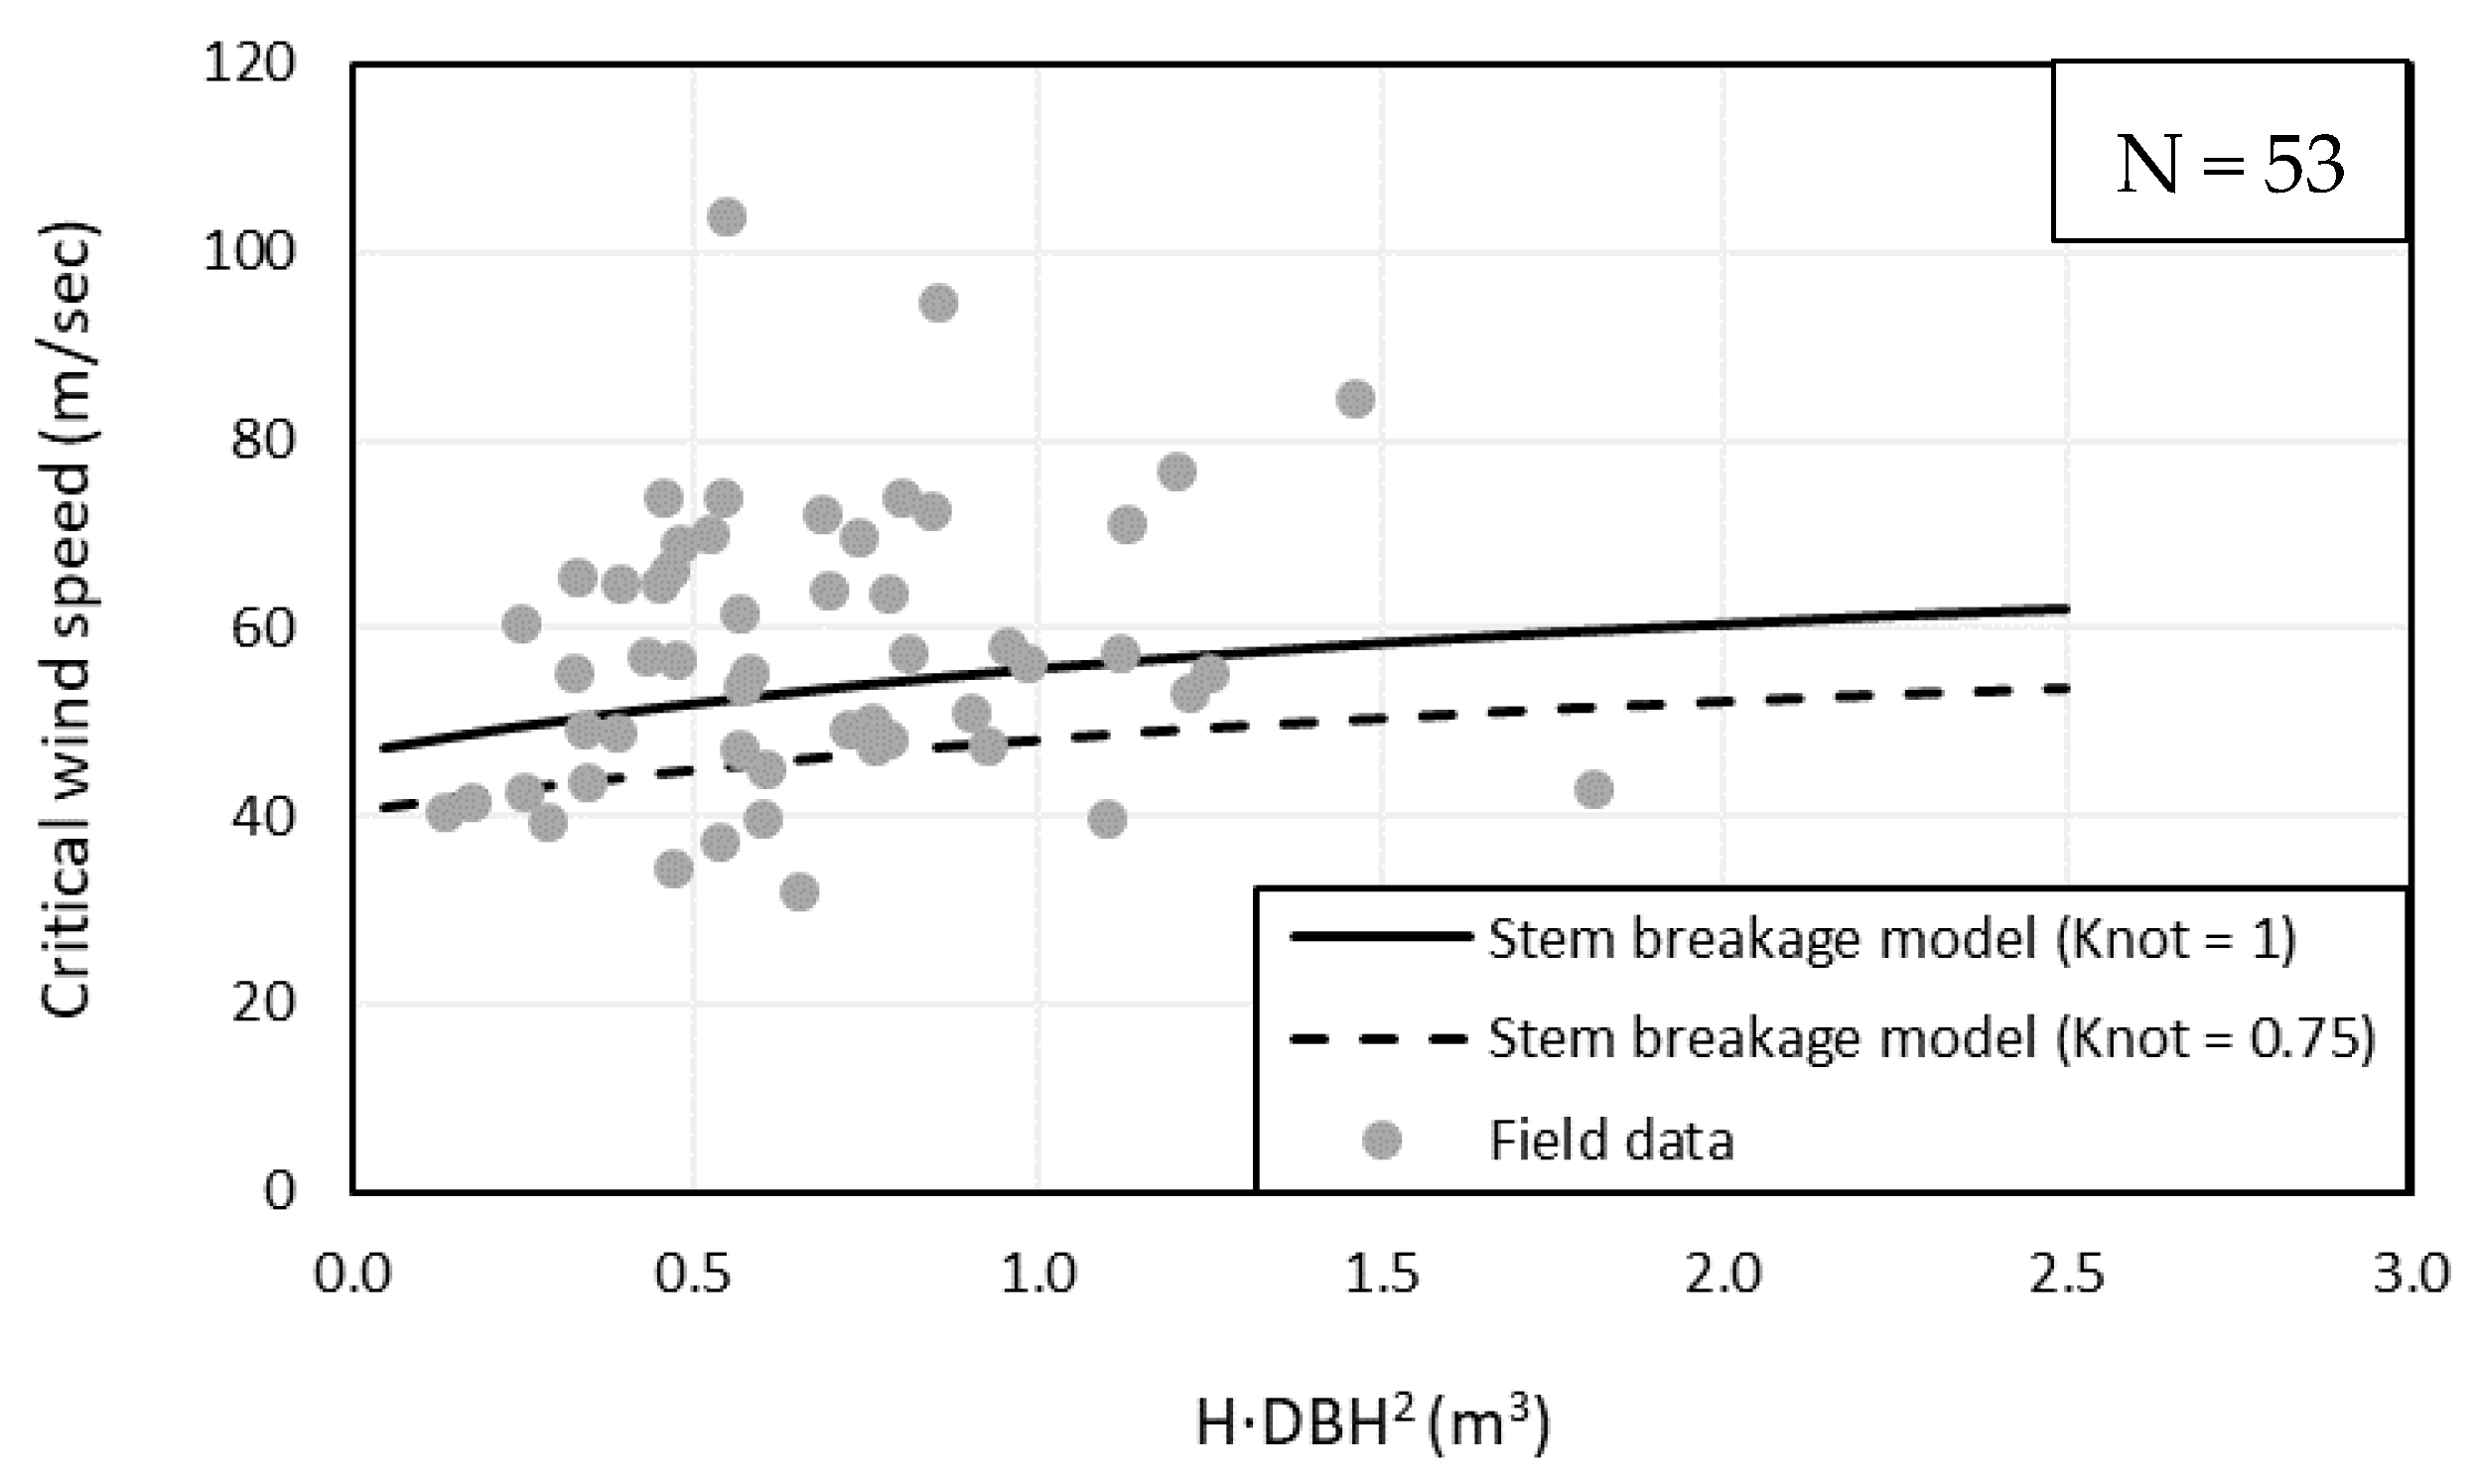
According to Forest Products Laboratory [77], the MOR for trembling aspen in a green condition is equal to 35 MPa. It should be noted that Knot values of 1.0 and 0.75 [71] were considered in the analysis to bound the quality and condition of the broken stems during the tornado event. Similar to the windthrow model, the critical applied wind load (FH) responsible for stem breakage can be estimated by dividing Msb over the weighted average height of the wind loads acting on both crown and the broken stem segment. The corresponding critical wind speed (Vc) can then be calculated using Equation (10).
The frequency distribution of the random sample (Table S3) of stem broken trees over the observed DBH range is presented in Figure S2a. The figure shows that trees with DBH < 18.0 cm have lower stem breakage susceptibility due to their high flexibility. The histogram in Figure S2b shows the number of stem broken trees with respect to their heights. It should be noted that for most of the trees sampled, the stem breakage observed via the ArcGIS software was at a distance between 1.5 and 2.0 m from the base/ground. Therefore, the total tree height was found by adding 1.75 m to the length of the broken stem segment.
The stem broken trees frequency over the calculated critical wind speeds range is shown in Figure S3b. Similar to the windthrow condition, the critical wind speed for the sample of stem broken trees can be represented by a lognormal distribution with a mean value of 57.4 m/s and a standard deviation of 14.7 m/s as shown in Figure S4b. The cumulative percentage of the stem broken trees over the observed Vc range can be obtained from the cumulative density function (CDF) shown in Figure S5b.
The stem breakage model (i.e., Equation (12)) was applied on a different set of 12 trembling aspen trees (Table S4) with a tree volume (H·DBH2) between 0.05 and 2.5 m3, and these results are presented in Figure 7. As can be observed from the figure, trees with Knot = 0.75 have lower stem breakage resistance than those with Knot = 1.0 due to the presence of knots/burls within their stems.
3.3. Windthrow and Stem Breakage Model Outputs
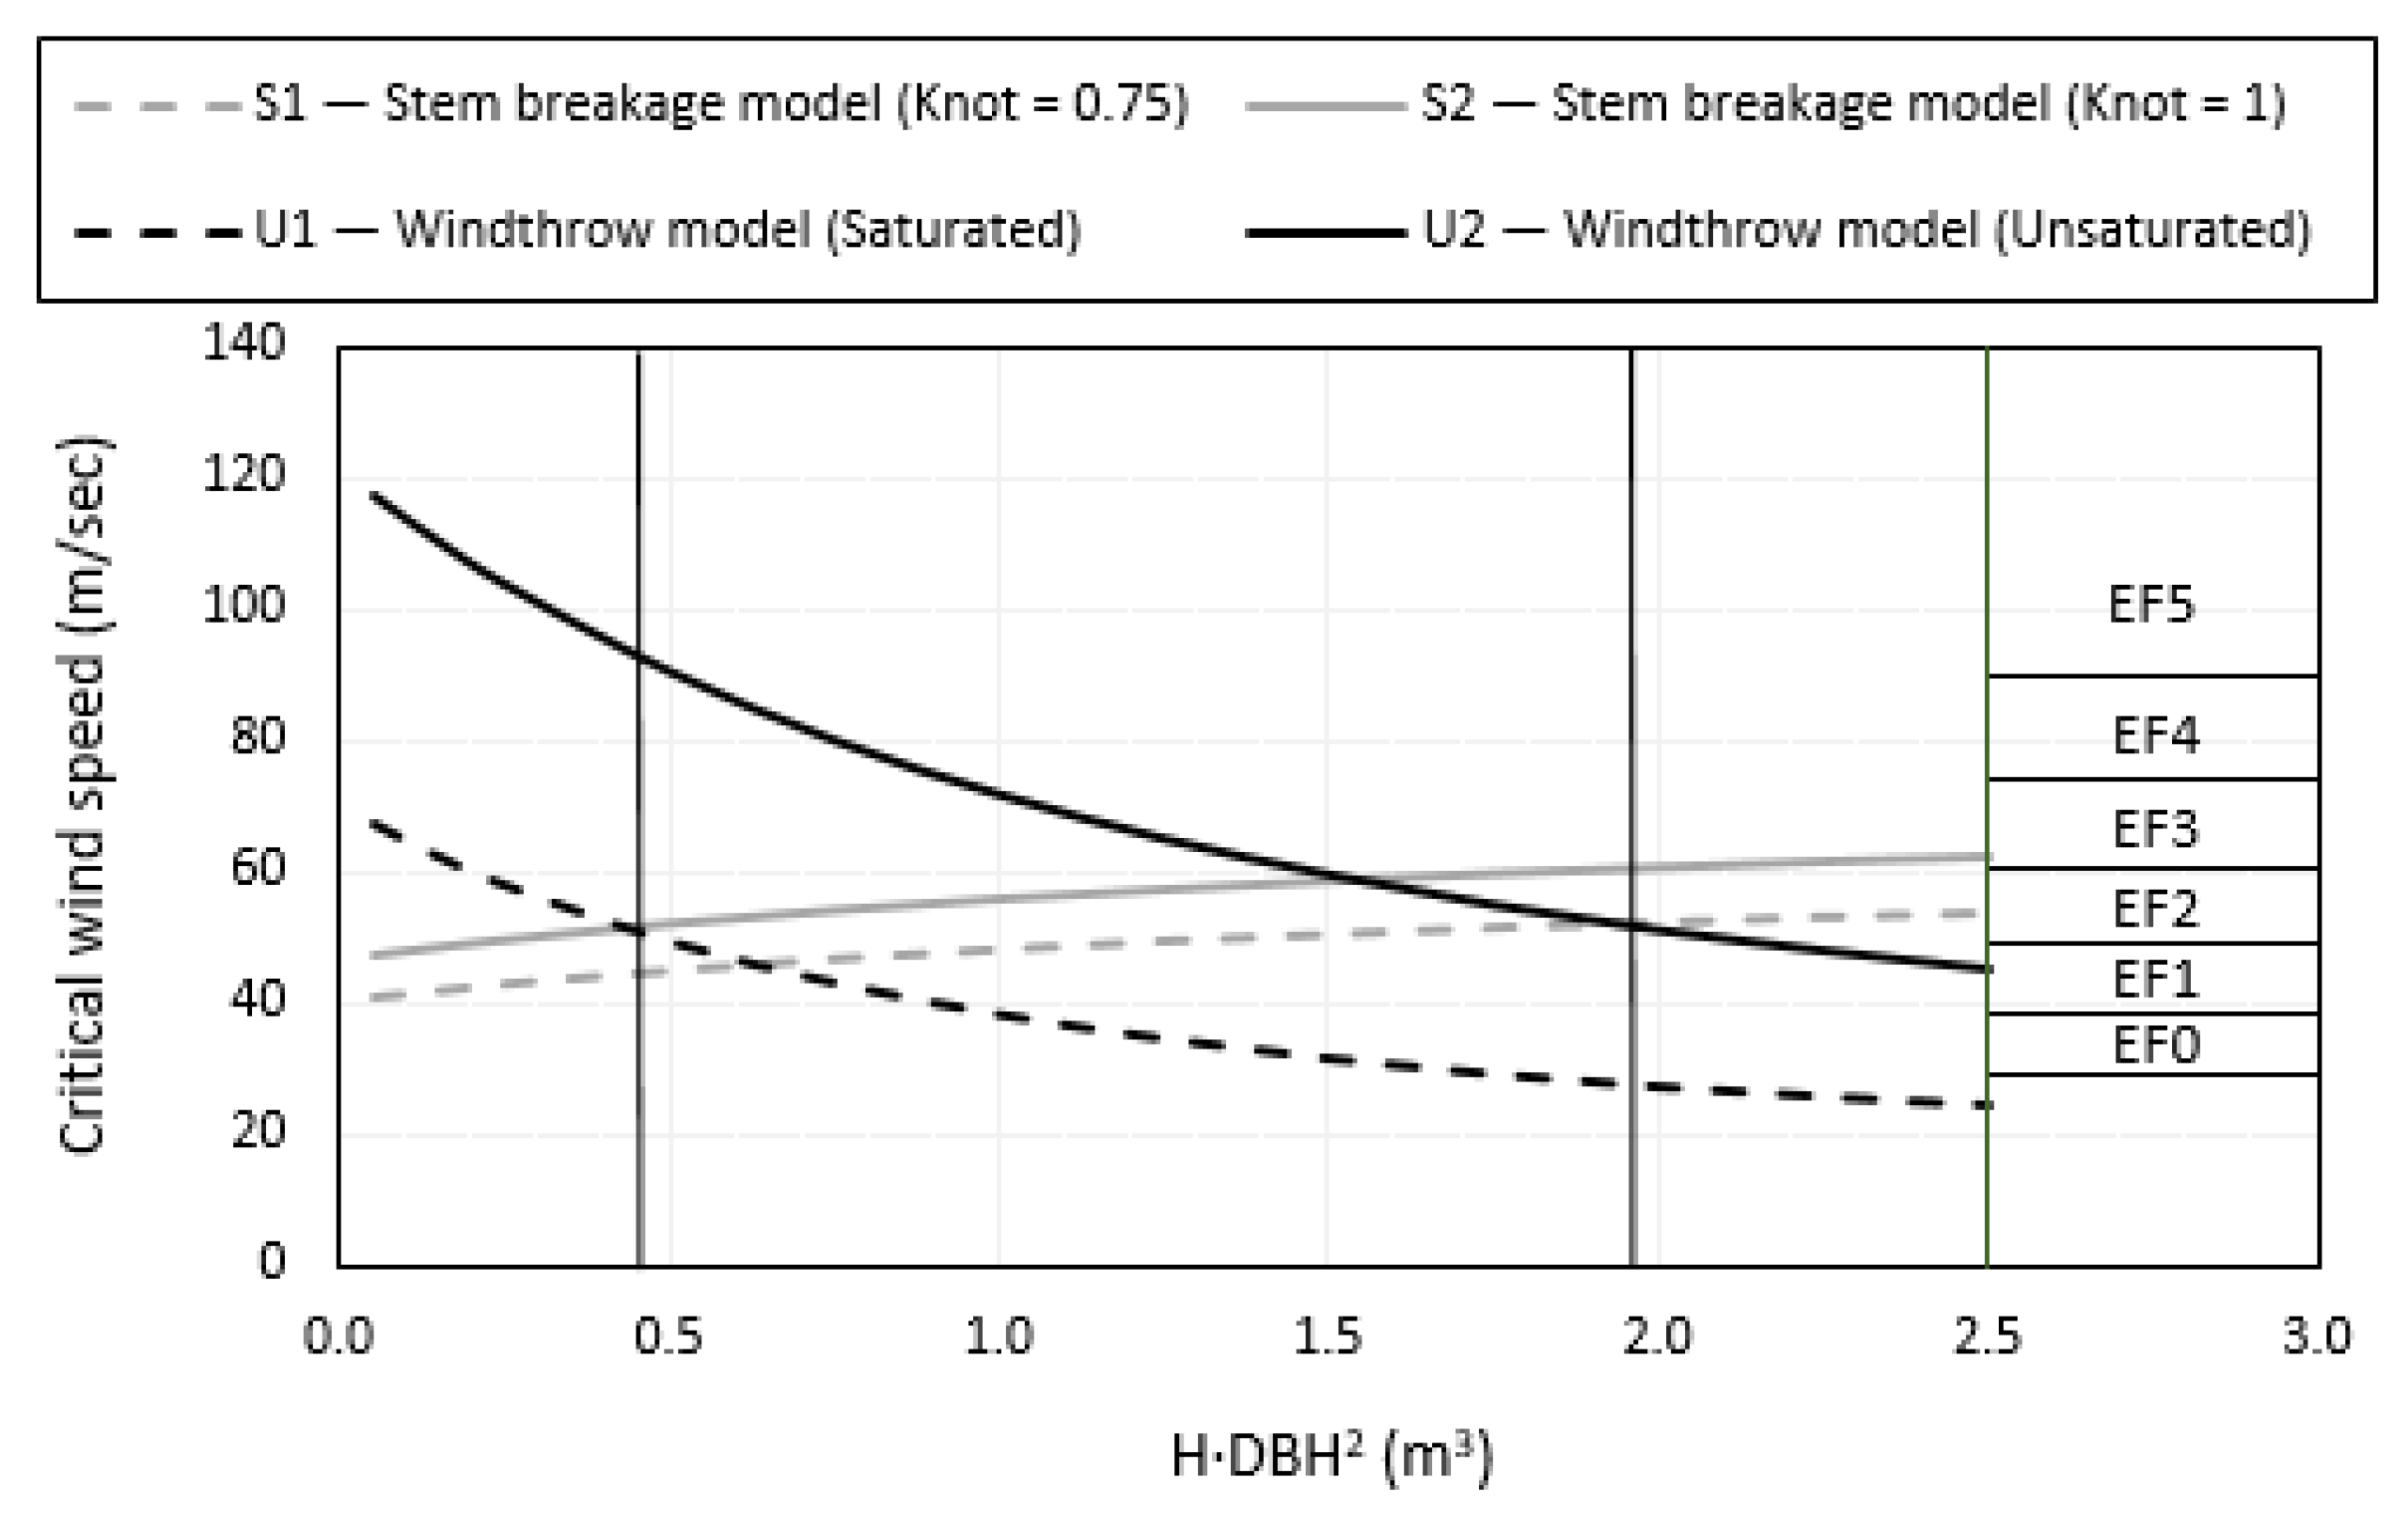
By combining Figure 6 and Figure 7 together, we can produce a composite chart (i.e., Figure 8) showing the relative differences in the critical wind speed (Vc) between the various tree failure scenarios: (a) uprooted trees on saturated soil (U1), (b) uprooted trees on unsaturated soil (U2), (c) stem broken trees with a knot factor of 0.75 (S1) and (d) stem broken trees with a knot factor of 1.0 (S2). From this figure, it is apparent that the critical wind speed relationships with tree size for both windthrow and stem break are non-linear. Those for windthrow are negatively correlated with tree size and those for stem break are positively correlated with tree size. Higher soil moisture contents and lower knot factors reduce the critical wind speeds in all cases. It can be observed that trees with volumes less than 0.41 m3 appear to be more susceptible to stem breakage. While those with H·DBH2 greater than 1.95 m3 appear to be more susceptible to uprooting. For trees with H·DBH2 between 0.41 and 1.95 m3, the failure mode depends more on the soil density/moisture condition and stem quality, as illustrated in Figure 8.
An additional comparison between the critical wind speeds and the ratings of the enhanced Fujita (EF) scale [78] is also made in the figure. This shows that the different cases span the entire EF scale depending on the size of tree and the soil conditions. The equations of the developed windthrow and stem breakage models are also presented in Figure S6, and these relationships are used in the next section for the parametric study.
3.4. Parametric Study
3.4.1. Generic Treefall Patterns
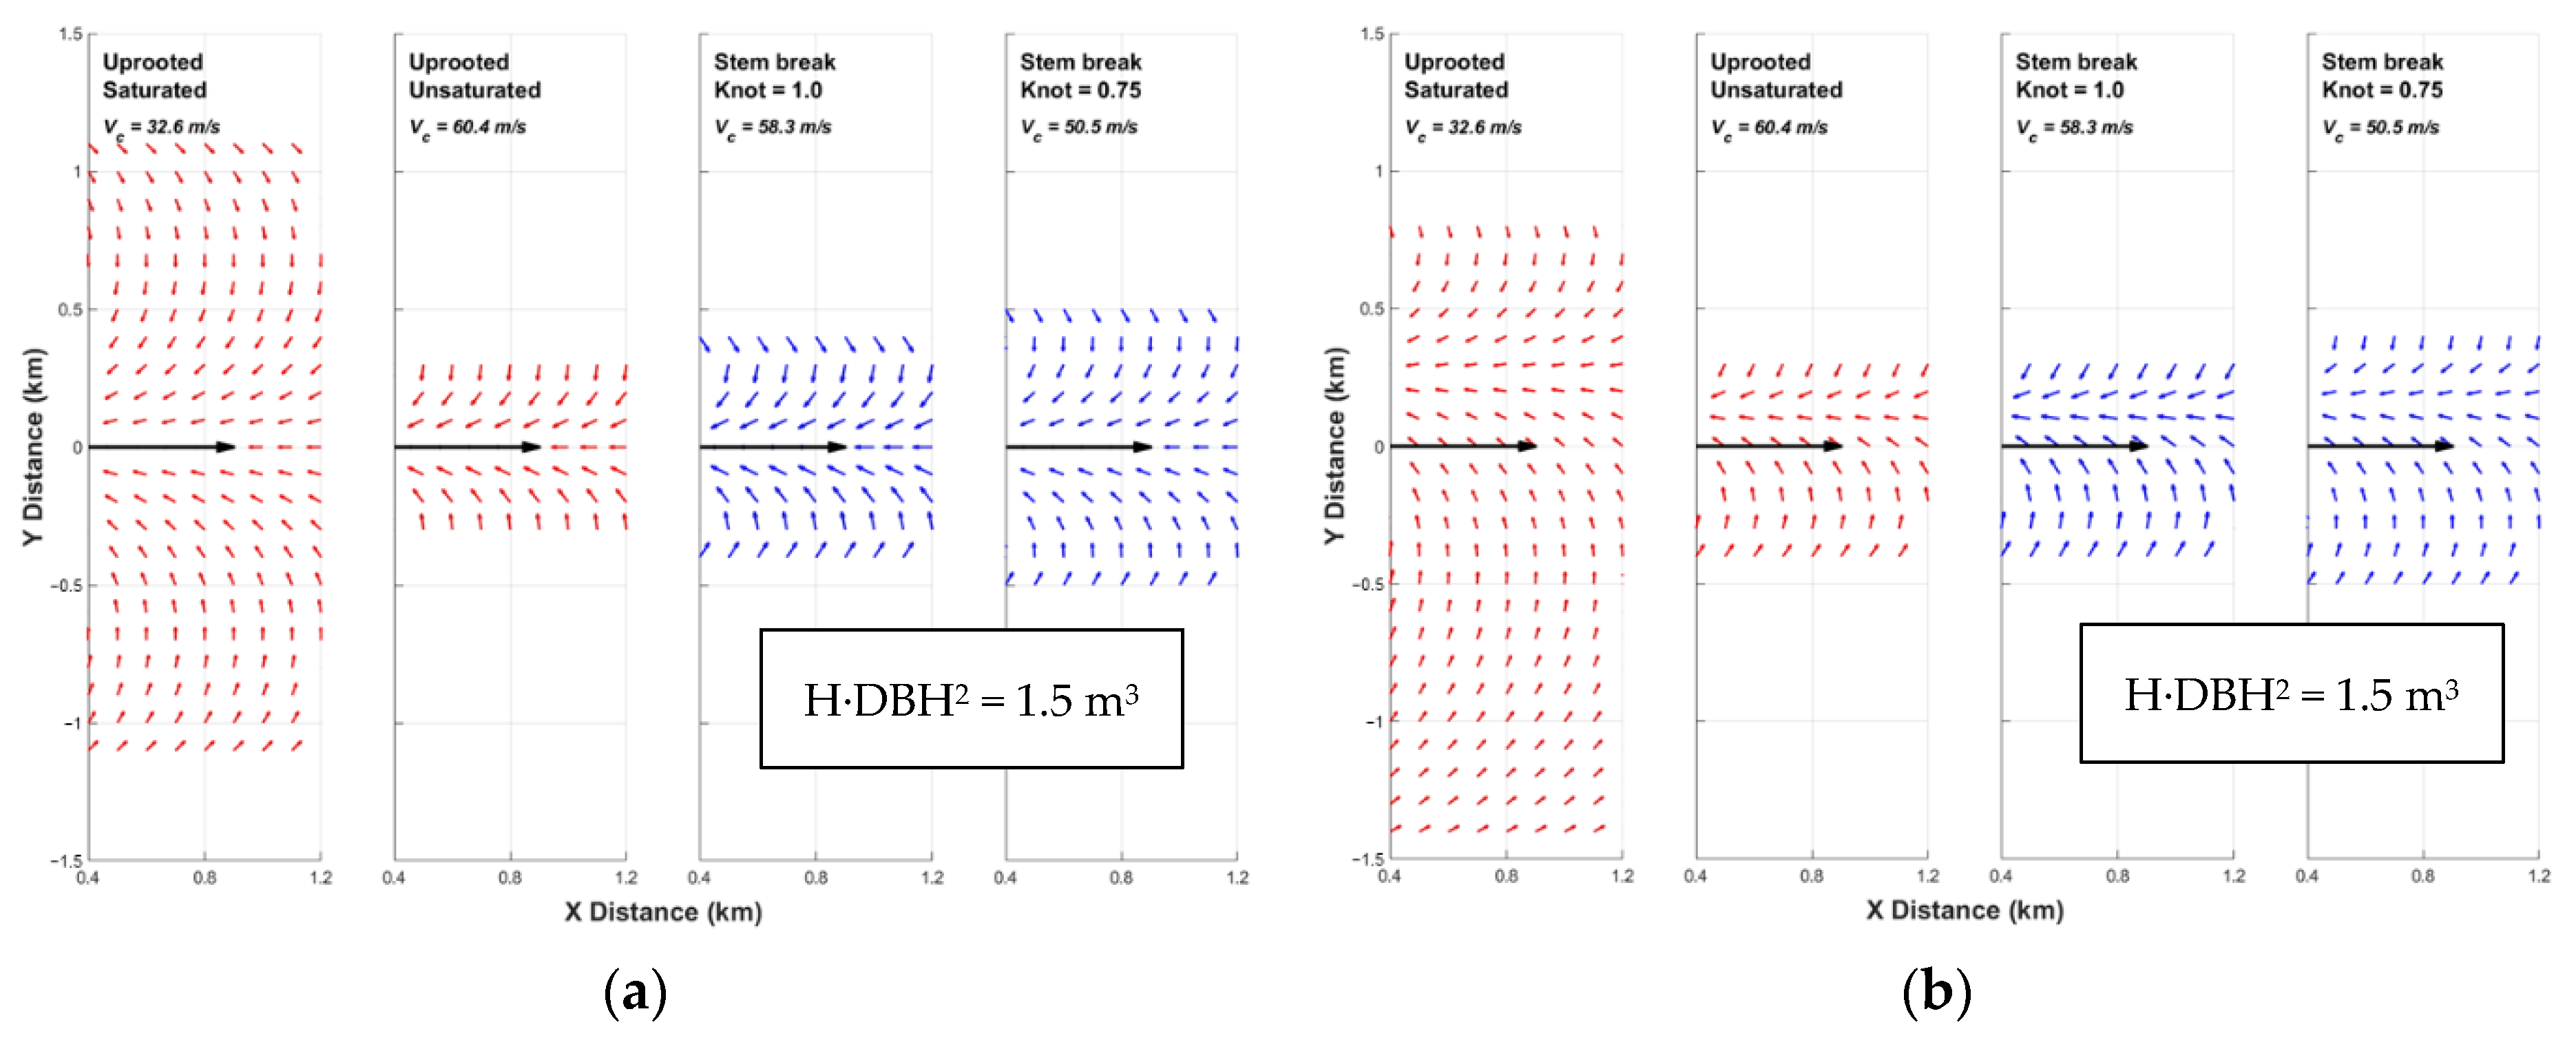
A parametric study was conducted using the treefall analysis and the critical wind speed to H·DBH2 relationships, to investigate the effect of tree size, soil condition and stem quality on the treefall patterns. A tornado with the same vortex parameters was simulated, and a series of treefall patterns were generated for the different hypothetical scenarios: U1, U2, S1 and S2. The simulation of a tornado with a maximum wind speed (Vmax) of 52 m/s approximating a weak EF2 tornado (vortex parameters: VT = 13 m/s, Gmax = 3, α = 0°, RMW = 240 m, φ = 0.7) is shown in Figure 9a (the black arrow indicates the tornado’s translational direction). At each grid point, a tree with H·DBH2 of 0.5 m3 is hypothetically standing, and a treefall direction is recorded if the wind speed at the grid point exceeds the critical wind speed of treefall (Vc). The critical wind speeds for H·DBH2 of 0.5 m3, obtained from Figure 8, are 45.8 m/s (U1), 82.4 m/s (U2), 46.5 m/s (S1) and 53.7 m/s (S2) for each scenario as shown in the figure. For scenarios U2 and S2, no treefall pattern is generated because Vmax does not exceed Vc and treefall does not occur. For U1 and S1, Vc is less than Vmax, and a treefall pattern is generated with a convergence line pointing along the tornado’s translation direction (known as forward convergence). A convergence line is a line parallel to the translating motion of the tornado where the tree fall pattern converges. This pattern is typical for a low Gmax tornado (between 1 and 3). A tornado with a low Gmax would have a relatively stronger translational speed and weaker rotational wind speed by definition. Thus, trees would fall in the direction of the tornado translation, as has generally been found in tornadoes with weaker intensities in the range of EF0 to EF3 [79]. Note that the early stages of the Alonsa, MB tornado exhibited this form of treefall pattern. Furthermore, the treefall pattern and the width of the tree damage (damage width) are approximately the same, as the Vc is very similar for U1 and S1. In Figure 9b, the H·DBH2 is increased to 1.5 m3, but the tornado parameters are kept the same. The Vc for U2 and S2 is still larger than the Vmax, and thus, no treefall pattern is produced. For U1, the damage width is increased because the Vc decreases as the H·DBH2 is increased. On the other hand, the damage width is decreased because the Vc increases as the H·DBH2 is increased for S1. In Figure 9c, alpha (α), which captures the relationship between the radial and tangential velocities, is increased to 30° with the same tree H·DBH2 of 1.5 m3. The alpha value does not influence the Vmax of the tornado nor the damage width as shown (the damage width may change slightly depending on the gird point size). However, it has an important influence on the observed treefall pattern. With the increase in alpha, there is a significant tangential wind speed component in the tornado, causing individual treefall directions to rotate clockwise. As a result, the treefall pattern converges slightly south of the tornado center, as opposed to Figure 9a,b where the treefall patterns converge in the middle of the damage width.
For Figure 10, the Gmax is increased to 6 with all the other parameters kept the same. Consequently, the Vmax is increased to 91 m/s approximating a strong EF4 tornado. As the wind speed of the simulated tornado is increased, the treefall pattern is produced for all scenarios with a significant increase in damage width. For H·DBH2 of 1.5 m3, the critical wind speed is the greatest for U2 and thus the damage width is the smallest. Furthermore, in contrast to Figure 9, the treefall pattern is changed considerably where the treefall direction points towards the center of the vortex, because a tornado with a high Gmax would now have a relatively stronger rotational speed and weaker translational wind speed. The trees along the convergence line now point in the opposite direction to the translation of the tornado (backwards convergence). This type of treefall pattern is usually found in tornadoes EF4 or greater [79]. This treefall pattern was observed in the mature (later) stages of the Alonsa, MB tornado suggesting to some extent that the tornado was in fact a violent tornado, although a more detailed treefall analysis is necessary to estimate the actual wind speed. As opposed to Figure 9, the treefall pattern converges on the north side of the tornado center for Figure 10, because the treefall directions point in the opposite direction of translation for Gmax of 6 and rotate clockwise as alpha is increased to 30°. Figure S7a–c shows the same plots for smaller volume trees and captures very similar results.
3.4.2. Treefall Patterns with Random H·DBH2 Distributions
In this section, to model a more realistic forest, a treefall pattern is generated where a random H·DBH2 is assigned to each grid point using a Gaussian distribution. The mean (0.68 m3) and standard deviation (0.36 m3) were those obtained from the 114 sample trees. Two different soil conditions are assumed, in which both uprooting and stem breakage can occur: (1) unsaturated soil with a knot factor of 0.75, (2) saturated soil with a knot factor of 0.75. Figure 11a,b and Figure 11c,d show the treefall pattern with the random H·DBH2 distribution simulated with the same tornado as Figure 9 and Figure 10, respectively. Due to the tangential wind component (α = 30°), the same effects shown in Figure 9c and Figure 10b can be observed where the treefall pattern converges on the south side and the north side of the tornado center for Figure 11a,b and Figure 11c,d, respectively. For the unsaturated soil, only stem breakage failure occurs in Figure 11a,c, because the critical wind speed value of uprooting is much higher than that of stem breakage. The critical wind speed of stem breakage is higher than that of uprooting when H·DBH2 reaches 1.95 m3 (Figure 8), but the chance of a tree with an H·DBH2 of 1.95 m3 occurring is very low, since 1.95 m3 is more than 3 standard deviation above the mean H·DBH2. For the saturated soil case, the critical wind speed value of uprooting is much lower, but still higher than that of stem breakage for trees with H·DBH2 less than 0.62. Thus, a mixture of uprooting and stem breakage occurs, but with more uprooting as shown in Figure 11b,d. It is evident that the proportion of uprooting to stem breakage failure is, therefore, greatly influenced by the soil conditions and the tree size. Furthermore, the damage width with the saturated soil is slightly greater than the damage width of the unsaturated soil, as the critical wind speed of stem breakage is higher for trees with H·DBH2 greater than 0.62. As illustrated in Section 3.4.1, the damage width decreases as the critical wind speed increases. Supplementary plots for simulations for a knot factor of unity are shown in Figures S8 and S9.
4. Discussion
4.1. Overview
The proposed new model has been used successfully for back-analyzing field data from a post-tornado survey and for prediction of damage of simulated tornadoes in forested areas. Improvements in the assessment of the critical wind speeds for windthrow for different soil conditions and textures should reduce some of the uncertainty associated with the modelling results. Once combined with tornado probability distributions, this model could also be used to support adaptive forest management concepts to minimize financial burdens [25]. This information could also aid monitoring of longer-term recovery [1] and assessment of fire or disease hazard following storms. This section discusses some of the issues associated with the use of this approach for these purposes and some areas where further work will need to be conducted to improve the technique for application in practice.
4.2. Observations from the Study Findings
The risk of wind damage in forested areas is affected by the tree, stand and site characteristics, e.g., species, height, stem diameter, crown shape and area, rooting geometry, soil type and texture, water table location and stand density. Many of these aspects are influenced by forest management strategies and silviculture [80,81,82,83]. The most significant susceptibility to damage is found in stands when sudden changes in wind loading or resistance occur (i.e., where acclimatization has not occurred yet). Some typical examples are trees adjacent to recently clear-felled areas, recently thinned stands or immediately after heavy rain events [37,72,80,84,85]. Although there are geographic and topographic variations, the literature reports that the most significant damage to forested areas occurs when peak wind gusts exceed 40 m/s [86].
The majority of current windthrow risk assessments [87,88] are based on synoptic straight line wind fields, where the turbulence is assumed to be stationery and Gaussian. However, the wind velocity fields and turbulence structures of other common extreme windstorms, e.g., thunderstorms, squall lines, microbursts and tornadoes are significantly different from more classical atmospheric boundary-layer events. Tornadoes in particular have wind fields that have large components of vertical and tangential velocity. Field and wind tunnel studies have found that tornado-induced loading is non-stationary [89], and turbulence and gust statistics are poorly understood for tornadoes. Indeed, the gust factor (ratio of peak wind gust to mean wind speed) is assumed by a number of structural design codes [90] to be unity and the wind loading act more like a short duration impulse loading event (e.g., a blast wave). In a number of regions across the globe, a large proportion of the maximum wind gusts may actually occur in thunderstorms [91]. Such events occur very rapidly, are very short-lived (only lasting up to 5 to 10 min) and then recede equally as rapidly. During the storm, strong wind gusts are created by the severe convective turbulence. The extreme wind speed statistics for Canada predict 50-year return period hourly wind speeds of 30.5–33.2 m/s and 3 second gusts of 46–51 m/s for Manitoba [92], which are considerably less than those observed during the Alonsa tornado. However, it should be noted that these statistics are for mixed storm populations and include both thunderstorm and synoptic events. Therefore, it is probable that extreme wind velocities for longer return period events (those that exceed 10–20 years) are primarily due to thunderstorms. Therefore, the determination of the probability distributions of maximum annual velocities due to thunderstorms and associated wind phenomena (independent of synoptic winds) is necessary to apply the current approach to forest management.
It is worth noting that there is currently strong debate over whether forthcoming anthropogenic climate change will alter tornado size, frequency or intensity. Recently, Elsner et al. [93,94] have observed an increase in the power of tornadoes, as well as a trend for strong tornadoes to stay on the ground longer and have wider damage tracks. Whether these trends are maintained into the future is currently unknown, but Diffenbaugh et al. [95] project future increases in the severe thunderstorm environments that spawn tornadoes, suggesting at least the potential for increased tornado activity as a result of greenhouse gas forcing. In the U.S., tornadoes are less important as an agent of wind disturbance to forests, compared to hurricanes and derechos [96], although hurricanes are rare and concentrated in the Maritime provinces of Canada. Thus, increased tornado activity may be of relatively greater importance in Canada compared to the U.S. If realized, greater wind disturbance is likely to selectively reduce dominance by wind-vulnerable species, such as balsam fir (Abies balsamea (L.) Mill) and jack pine (Pinus banksiana Lamb.), and increase dominance by relatively more windfirm species, such as paper birch (Betula papyrifera Marshall) [97]. In managed forests, silvicultural decisions will need to increasingly balance wind vulnerability against other criteria; one potential choice might be shortened rotation periods to reduce the duration that trees are large and therefore more vulnerable.
The probability of a tornado striking a point object is at least an order of magnitude lower than for other windstorms. However, recent work by Banik et al. [35] indicates that as an object becomes wider (i.e., of the order of 10–100 km), then the probabilities of exceedance of the 30 and 50-year return tornado wind speeds can actually be higher than those of non-tornadic winds. For example, in southern Ontario, the maximum factored 30-year extreme wind speed (three second gust) is 54 m/s [92], and this has an annual probability of exceedance of 5.16 × 10⁻⁴. In comparison, for 10 and 100 km long objects, the annual probabilities of exceedance are 2.1 × 10⁻³ and 2.1 × 10⁻². For tornadoes striking 10 and 100 km objects, the 500-year return period gust wind speeds are 52.6 and 91.4 m/s, respectively. For non-tornadic distributions in this region, the corresponding wind speeds range from 30.5 to 48.5 m/s. This suggests that the extreme wind loadings and associated tree damage for boreal forests in Canada are likely to be dominated by tornadoes and thunderstorms.
More intense tornadoes (EF3-5) with wind speeds exceeding 70 m/s create uniform and widespread windthrow [98]. However, the majority of tornadoes (90%) are in the range of EF2-0, with wind speeds less than 50 m/s. Although these tornadoes have significant variability in terms of tree damage, they have sufficient wind velocities to create catastrophic windthrow damage. Reasonable correlations have been found between tornado vortex core radius (damage) and Vmax [99] for less intense events. Hence, the probabilities annual of tornado damage to Canadian boreal forests may be relatively high but are the area affected will be quite localized. Thus, the secondary damages from fire hazard and disease/pest outbreaks becomes particularly important. In addition, due to the size and remoteness of many of these forests, actually identifying the location and extent of this damage can be quite challenging and requires intensive remote imaging methods.
The modelling shown in the last section emphasizes the balance between the tree and site characteristics and those of the tornado. The size of the tree and the mode of failure (stem break or windthrow) are also shown to be important. The current analysis implies that very large trees should always uproot and never break, and the opposite occurs for very small trees. Data from many tornado blowdowns show that uprooting is most prevalent in the medium-to-large size range, but the proportion uprooted often is somewhat lower in the largest size classes [18]. Some representative data from four U.S. tornado-damaged forests are shown in Figure S10, which shows the proportions of trees windthrown and stem broken. The colored portions of each bar indicate trunk-broken trees; white portions of each bar indicate uprooted trees. In each site, only trees > 10 cm DBH are included. Field surveys were conducted in which individual trees were classified by type of treefall and manually measured for DBH and height. These have been partitioning into the same three size classes used in the predictions from this paper. Data for the Gum Road and Blooming Grove in this figure were derived from [18]; data for Boggs Creek and Martin Branch are unpublished data. The data show that the proportion of the two types of damage varies for different events, although there are certainly trends in the data. Trees with communal root systems (such as trembling aspen [100]) would likely behave differently with regard to windthrow mechanisms and critical wind speeds, and the implications of these findings should be investigated further.
The effect of an antecedent rainstorm is also clear from the predictions, which would reduce the resistance of trees to windthrow and is supported by field observations during tree pulling [101] and post-storm surveys [86]. Although this is also dependent on the rate of percolation of the rain into the underlying soil. The tornado track damage width and tree fall patterns are strongly linked to the critical wind speed for tree failure and to the relative translation velocity. Whilst not shown in these analyses, varying the Rankine vortex model decay constant (φ) will also change the relative width of the tornado track [28]. The orography is also known to play a significant role in the risks of damage in forests and can actually be more important than surface roughness in mountainous areas. Talkkari et al. [102] found that stands located on hill tops tend to experience more damage than those in more sheltered areas. Similar observations have been made for tornadoes traversing sloping ground [2]. These researchers documented more severe damage as tornadoes descended ridges and saw less damage as tornadoes ascended ridges. The results were found to be more consistent for shallow slopes compared to steeper slopes. There may also be an effect on the failure mode, with stem break more likely on sloping surfaces, which may relate to changes in the tornado vortex and applied wind loads.
It is interesting to note that the current (rather coarse) enhanced Fujita scale damage indicators for hardwood and softwood trees provide a range of observable phenomena ranging from broken branches to windthrow/stem break [103], associated with different wind speeds. For these general species groupings, windthrow is assumed to happen before stem break, and for the hardwood group, this occurs at approximately 40.7 m/s (windthrow) and 49 m/s (stem break). Figure 8 shows that the potential critical wind speeds for these failure modes are rather more complex, and the soil depth and state in particular (due to precipitation and drainage condition and soil texture) are extremely important. As noted by Godfrey and Peterson [103], the enhanced Fujita scale is currently limited to tornadoes of EF3 rating and lower, and the same authors have provided a method to extend this range up to EF5 events.
4.3. Limitations and Recommendations for Future Studies
Clear-cutting and thinning is known to affect wind speed and direction of local airflow and the subsequent susceptibility of tree stands to synoptic winds [37,80,104]. Our current modelling approach ignores any coupling between the tornado vortex and the forest or topography of the site. Certainly, for larger more intense tornadoes, this assumption is likely to be sufficient. However, for smaller tornadoes (EF3 and below), a heavily forested area can create substantial surface roughness. Surface drag included in the simulations of tornadoes has been found to alter the dynamics of tornado genesis due to generation of vertical vorticity near the ground surface [105]. Drag-induced effects will also occur if a tornado transitions a sharp boundary such as a low roughness surface into a fully mature forest (or vice versa). Further developments of the Rankine vortex model used in this paper will try to address this coupling behavior.
Other improvements to the modelling could include time varying tornado properties and the inclusion of other types of non-stationary wind field, such as downburst and squall line models. Field studies have also shown that closely spaced trees subjected to extreme wind loads and bending significantly can provide substantial mutual support [106,107], thus requiring additional force for windthrow and stem break failures to occur. Further field work is necessary to quantify this extra component of resistance prior to its inclusion in the model. Likewise, the efficacy of static winching studies to produce realistic estimates for windthrow resistance to tornadic wind fields [23,25] still needs to be fully validated.
Finally, this paper has addressed parametric studies of a prototypical forest consisting of trembling aspen and other hardwood species. Further calibrations based on a larger number of field tests and post-storm surveys would provide greater applicability of this technique and could include analysis of a wider range of softwood and hardwood tree species, more soil types and greater assessment of seasonal changes in the tree geometry and mechanical properties.
5. Conclusions
In this paper, a method based on a Rankine vortex model coupled with two mechanistic tree models describing critical wind velocities for stem break and windthrow was used to simulate tree damage during tornadoes. To calibrate the models, a treefall analysis of a Manitoba forest during the Alonsa tornado was used. A power law relationship between failure bending moments and DBH for the hardwood species on the site was found to provide the best correlation. Observed stem break and windthrow of a sample of trees along the tornado track was fitted to lognormal distributions; the mean of the critical wind speed for windthrow (62.3 m/s) was found to be higher than that for stem break (57.4 m/s). Relationships between critical wind speed and tree size for both windthrow and stem break were found to be non-linear. Those for windthrow were negatively correlated with tree size and those for stem break were positively correlated with tree size. Higher soil moisture contents and lower knot factors reduced the critical wind speeds in all cases. Trees with volumes less than 0.41 m3 appeared to be more susceptible to stem breakage, while those with H·DBH2 greater than 1.95 m3 appeared to be more susceptible to uprooting. For trees with H·DBH2 between 0.41 and 1.95 m3, the failure mode depended more on the soil density/moisture condition and stem quality. Parametric study was conducted to assess the induced tree failure patterns for uprooting on saturated and unsaturated soils and stem break with different knot factors for the same simulated tornadoes. The results show forward and backward convergence of the tree fall patterns, increased tornado damage widths and asymmetry of the tracks dependent on the relative magnitudes of the radial and tangential tornado velocities, ratio between the translational speed and the maximum rotational wind speed and the mode of failure of the trees. Further parametric study of random tree sizes showed differing ratios of windthrown and stem broken trees for various tornado characteristics.
Supplementary Materials
The following are available online at https://0-www-mdpi-com.brum.beds.ac.uk/1999-4907/12/1/17/s1, Figure S1: Frequency of uprooted trees over the observed DBH, tree height, and root-plate diameter ranges. Figure S2: Frequency of stem broken trees over the observed DBH and tree height ranges. Figure S3: Frequency of damaged trees over the observed Vc range. Figure S4: Distribution of damaged trees over the observed Vc range. Figure S5: Cumulative density function of damaged trees over the observed Vc range. Figure S6: Equations of the developed windthrow and stem breakage models. Figure S7: Tree fall patterns of trees with H·DBH2 = 0.5 m3 under different vortex parameters. Figure S8: Tree fall patterns of trees with knot factor = 1.0 and random H·DBH2 under a translating vortex with Vmax = 52 m/s, Gmax = 3, Rmax = 240 m, φ = 0.7, α = 30°. Figure S9: Tree fall patterns of trees with knot factor = 1.0 and random H·DBH2 under a translating vortex with Vmax = 91 m/s, Gmax = 6, Rmax = 240 m, φ = 0.7, α = 30°. Figure S10 (Proportion of windthrown and stem broken trees in four US tornado events). Table S1 (Uprooted trees data). Table S2: Uprooted trees used for windthrow model validation. Table S3: Stem broken trees data. Table S4: Stem broken trees used for stem breakage model validation.
Author Contributions
Conceptualization, T.N.; methodology, M.A.M., T.N., D.M.R., F.T.L., C.P.; formal analysis, T.N., M.A.M., C.P., D.M.R.; visualization, M.A.M., D.M.R.; writing—original draft preparation, M.A.M., D.M.R., T.N.; writing—review and editing, T.N., F.T.L., C.P.; supervision, T.N. All authors have read and agreed to the published version of the manuscript.
Funding
The authors would like to acknowledge the financial support of the Natural Sciences and Engineering Research Council (Grant No.: RGPIN-2015-06062), Western University and ImpactWX.
Conflicts of Interest
The authors declare no conflict of interest.
References
- Burrow, D.; Herrero, H.V.; Ellis, K.N. Damage analysis of three long-track tornadoes using high-resolution satellite imagery. Atmosphere 2020, 11, 613. [Google Scholar] [CrossRef]
- Cannon, J.B.; Hepinstall-Cymerman, J.; Godfrey, C.M.; Peterson, C.J. Landscape-scale characteristics of forest tornado damage in mountainous terrain. Landsc. Ecol. 2016, 31, 2097–2114. [Google Scholar] [CrossRef]
- Dale, V.H.; Joyce, L.A.; McNulty, S.; Neilson, R.P.; Ayres, M.P.; Flannigan, M.D.; Hanson, P.J.; Irland, L.C.; Lugo, A.E.; Peterson, C.J.; et al. Climate change and forest disturbances: Climate change can affect forests by altering the frequency, intensity, duration, and timing of fire, drought, introduced species, insect and pathogen outbreaks, hurricanes, windstorms, ice storms, or landslides. BioScience 2001, 51, 723–734. [Google Scholar] [CrossRef] [Green Version]
- Laiho, O. Susceptibility of forest stands to windthrow in southern Finland. Folia For. 1987, 706, 1–24, (In Finnish with English Summary). [Google Scholar]
- Achim, A.; Ruel, J.-C.; Gardiner, G.L.; Meunier, S. Modelling the vulnerability of balsam fir forests to wind damage. For. Ecol. Manag. 2005, 204, 35–50. [Google Scholar] [CrossRef]
- Ravn, H.P. Expansion of the populations of Ips typographus (L.) (Coleoptera, Scolytidae) and their local dispersal following gale disaster in Denmark. Z. Angew. Entomol. 1985, 99, 26–33. [Google Scholar] [CrossRef]
- Schroeder, L.M.; Eidmann, H.H. Attacks of bark and wood boring Coleoptera on snow broken conifers over a two-year period. Scand. J. For. Res. 1993, 8, 257–265. [Google Scholar] [CrossRef]
- Mitchell, S.J. Wind as a natural disturbance agent in forests: A synthesis. Forestry 2013, 86, 147–157. [Google Scholar] [CrossRef] [Green Version]
- Quine, C.P.; Gardiner, B.A. Understanding how the interaction of wind and trees results in windthrow, stem breakage, and canopy gap formation. In Plant Disturbance Ecology—The Process and the Response; Johnston, E.A., Miyanishi, K., Eds.; Academic Press: Burlington, MA, USA, 2007; pp. 103–156. [Google Scholar]
- Everham, E.M.; Brokaw, N.V.L. Forest damage and recovery from catastrophic wind. Bot. Rev. 1996, 62, 113–185. [Google Scholar] [CrossRef]
- Montoro Girona, M.; Morin, H.; Lussier, J.-M.; Ruel, J.-C. Post-cutting mortality following experimental silvicultural treatments in unmanaged boreal forest stands. Front. For. Glob. Chang. 2019, 2:4, 1–16. [Google Scholar] [CrossRef] [Green Version]
- Agee, E.M. A revised tornado definition and changes in tornado taxonomy. Weather Forecast 2014, 29, 1256–1258. [Google Scholar] [CrossRef]
- Malamud, B.D.; Turcotte, D.L. Statistics of severe tornadoes and severe tornado outbreaks. Atmos. Chem. Phys. 2012, 12, 8459–8473. [Google Scholar] [CrossRef] [Green Version]
- Zenoble, M.D.; Peterson, C.J. Remotely visible width and discontinuity of 50 tornado damage paths through forested landscapes. Electron. J. Sev. Storms Meteorol. 2017, 12, 1–21. [Google Scholar]
- Hall, F.; Brewer, R.D. A sequence of tornado damage patterns. Mon. Weather Rev. 1959, 87, 207–216. [Google Scholar] [CrossRef] [Green Version]
- Budney, L.J. Unique damage patterns caused by a tornado in dense woodlands. Weatherwise 1965, 18, 74–86. [Google Scholar] [CrossRef]
- Fujita, T.T. The Teton-Yellowstone tornado of 21 July 1987. Mon. Weather Rev. 1989, 117, 1913–1940. [Google Scholar] [CrossRef] [Green Version]
- Peterson, C.J. Consistent influence of tree diameter and species on damage in nine eastern North America tornado blowdowns. For. Ecol. Manag. 2007, 250, 96–108. [Google Scholar] [CrossRef]
- Blanchard, D.O. A comparison of wind speed and forest damage associated with tornadoes in northern Arizona. Weather Forecast. 2013, 28, 408–417. [Google Scholar] [CrossRef] [Green Version]
- Peterson, C.J.; Pickett, S.T.A. Treefall and resprouting following catastrophic windthrow in an old-growth hemlock-hardwoods forest. For. Ecol. Manag. 1991, 42, 205–217. [Google Scholar] [CrossRef]
- Peterson, C.J. Damage and recovery of tree species after two different tornadoes in the same old growth forest: A comparison of infrequent wind disturbances. For. Ecol. Manag. 2000, 135, 237–252. [Google Scholar] [CrossRef]
- Peterson, R.E. Johannes Letzman: A pioneer in the study of tornadoes. Weather Forecast. 1992, 7, 166–184. [Google Scholar] [CrossRef] [Green Version]
- Holland, A.P.; Riordan, A.J.; Franklin, E.C. A simple model for simulating tornado damage in forests. J. Appl. Meteorol. Climatol. 2006, 45, 1597–1611. [Google Scholar] [CrossRef]
- Bech, J.; Gayà, M.; Aran, M.; Figuerola, F.; Amaro, J.; Arús, J. Tornado damage analysis of a forest area using site survey observations, radar data and a simple analytical vortex model. Atmos. Res. 2009, 93, 118–130. [Google Scholar] [CrossRef]
- Beck, V.; Dotzek, N. Reconstruction of near-surface tornado wind fields from forest damage. J. Appl. Meteorol. Climatol. 2010, 49, 1517–1537. [Google Scholar] [CrossRef] [Green Version]
- Karstens, C.D.; Gallus, W.A.; Lee, B.D.; Finley, C.A. Analysis of tornado-induced tree fall using aerial photography from the Joplin, Missouri, and Tuscaloosa–Birmingham, Alabama, Tornadoes of 2011. J. Appl. Meteorol. Climatol. 2013, 52, 1049–1068. [Google Scholar] [CrossRef] [Green Version]
- Lombardo, F.T.; Roueche, D.B.; Prevatt, D.O. Comparison of two methods of near surface wind speed estimation in the 22 May, 2011 Joplin, Missouri Tornado. J. Wind Eng. Ind. Aerodyn. 2015, 138, 87–97. [Google Scholar] [CrossRef]
- Rhee, D.M.; Lombardo, F.T. Improved near-surface wind speed characterization using damage patterns. J. Wind Eng. Ind. Aerodyn. 2018, 180, 288–297. [Google Scholar] [CrossRef]
- Seidl, R.; Thom, D.; Kautz, M.; Martin-Benito, D.; Peltoniemi, M.; Vacchiano, G.; Wild, J.; Ascoli, D.; Petr, M.; Honkaniemi, J.; et al. Forest disturbances under climate change. Nat. Clim. Chang. 2017, 7, 395–402. [Google Scholar] [CrossRef] [Green Version]
- Vaillancourt, M.-A.; De Grandpré, L.; Gauthier, S.; Kneeshaw, D.; Drapeau, P.; Bergeron, Y. How can natural disturbance be a guide for forest ecosystem management? In Ecosystem Management in the Boreal Forest; Gauthier, S., Vaillancourt, M.-A., Leduc, A., De Grandpré, L., Kneeshaw, D., Morin, H., Drapeau, P., Bergeron, Y., Eds.; Presses de l’Université du Québec: Montreal, QC, Canada, 2009; pp. 39–55. [Google Scholar]
- Moussaoui, L.; Leduc, A.; Girona, M.M.; Bélisle, A.C.; Lafleur, B.; Fenton, N.J.; Bergeron, Y. Success factors for experimental partial harvesting in unmanaged boreal forest: 10-Year stand yield results. Forests 2020, 11, 1199. [Google Scholar] [CrossRef]
- Bender, M.A.; Knutson, T.R.; Tuleya, R.E.; Sirutis, J.J.; Vecchi, G.A.; Garner, S.T.; Held, I.M. Modeled impact of anthropogenic warming on the frequency of intense Atlantic hurricanes. Science 2010, 327, 454–458. [Google Scholar] [CrossRef] [Green Version]
- Johnson, E.; Miyanishi, K. Introduction. In Plant Disturbance Ecology: The Process and the Response; Johnson, E., Miuanishi, K., Eds.; Academic Press: Burlington, MA, USA, 2007; pp. 15–25. [Google Scholar]
- Peterson, C.J.; Ribeiro, G.H.P.M.; Negrón-Juárez, R.; Magnabosco Marra, D.; Chambers, J.Q.; Higuchi, N.; Lima, A.; Cannon, J.B. Critical wind speeds suggest wind could be an important disturbance agent in Amazonian forests. Forestry 2019, 92, 444–459. [Google Scholar] [CrossRef]
- Banik, S.S.; Hong, H.P.; Kopp, G.A. Tornado hazard assessment for southern Ontario. Can. J. Civ. Eng. 2007, 34, 830–842. [Google Scholar] [CrossRef]
- Hale, S.E.; Gardiner, B.; Peace, A.; Nicoll, B.; Taylor, P.; Pizzirani, S. Comparison and validation of three versions of a forest wind risk model. Environ. Model. Softw. 2015, 68, 27–41. [Google Scholar] [CrossRef] [Green Version]
- Peltola, H.; Kellomäki, S.; Väisänen, H.; Ikonen, V.-P. A mechanistic model for assessing the risk of wind and snow damage to single trees and stands of Scots pine, Norway spruce, and birch. Can. J. For. Res. 1999, 29, 647–661. [Google Scholar] [CrossRef]
- Díaz-Yáñez, O.; Mola-Yudego, B.; González-Olabarria, J.R. Modelling damage occurrence by snow and wind in forest ecosystems. Ecol. Model. 2019, 408, 108741. [Google Scholar] [CrossRef]
- Díaz-Yáñez, O.; Mola-Yudego, B.; González-Olabarria, J.R.; Pukkala, T. How does forest composition and structure affect the stability against wind and snow. For. Ecol. Manag. 2017, 401, 215–222. [Google Scholar] [CrossRef]
- Díaz-Yáñez, O.; Arias-Rodil, M.; Mola-Yudego, B.; González-Olabarria, J.R.; Pukkala, T. Simulating the effect of wind and snow damage on the optimal management of Norwegian Spruce forests. Forestry 2019, 92, 406–416. [Google Scholar] [CrossRef]
- Sills, D.; Cheng, V.; McCarthy, P.; Rousseau, B.; Waller, J.; Elliott, L.; Klaassen, J.; Auld, H. Using tornado, lightning and population data to identify tornado prone areas in Canada. In Proceedings of the 26th Conference on Severe Local Storms, Nashville, TN, USA, 5–8 November 2012; American Meteorological Society: Boston, MA, USA, 2012; p. 59. [Google Scholar]
- Cheng, V.Y.S.; Arhonditsis, G.B.; Sills, D.M.L.; Auld, H.; Shephard, M.W.; Gough, W.A.; Klaassen, J. Probability of tornado occurrence across Canada. J. Clim. 2013, 26, 9415–9428. [Google Scholar] [CrossRef]
- Sills, D.; (Western University, London, ON, Canada). Personal communication, 2020.
- Gensini, V.A.; Brooks, H.E. Spatial trends in United States tornado frequency. Clim. Atmos. Sci. 2018, 1, 38. [Google Scholar] [CrossRef] [Green Version]
- Gardiner, B.; Hale, S.; Wellpott, A.; Nicoll, B. The development of a wind risk model for irregular stands. In Proceedings of the 2nd International Conference on Wind Effects on Trees, Albert-Ludwigs-University of Freiburg, Freiburg, Germany, 13–16 October 2009; Mayer, H., Ed.; Meteorological Insitute: Freiburg, Germany, 2009; pp. 127–133. [Google Scholar]
- Peltola, H.; Dupont, S.; Ikonen, V.-P.; Väisänen, H.; Venäläinen, A.; Kellomäki, S. Integrated use of two dimensional airflow model Aquilon and mechanistic model HWIND for risk assessment of tree stands to wind damage. In Proceedings of the 2nd International Conference on Wind Effects on Trees, Albert-Ludwigs-University of Freiburg, Freiburg, Germany, 13–16 October 2009; Mayer, H., Ed.; Meteorological Insitute: Freiburg, Germany, 2009; pp. 189–194. [Google Scholar]
- Peltola, H.; Kellomäki, S.; Hassinen, A.; Granander, M. Mechanical stability of Scots Pine, Norway spruce and birch: Analysis of tree pulling experiments in Finland. For. Ecol. Manag. 2000, 135, 143–153. [Google Scholar] [CrossRef]
- Gillmeier, S.; Sterling, M.; Hemida, H.; Baker, C.J. A reflection on analytical tornado-like vortex flow field models. J. Wind Eng. Ind. Aerodyn. 2018, 174, 10–27. [Google Scholar] [CrossRef] [Green Version]
- Bluestein, H.B. Mobile Doppler radar observations of tornadoes. In Proceedings of the 4th European Conference on Severe Storms, Trieste, Italy, 10–14 September 2007. [Google Scholar]
- Kosiba, K.; Wurman, J. The three-dimensional axisymmetric wind field structure of the Spencer, South Dakota, 1998 tornado. J. Atmos. Sci. 2010, 67, 3074–3083. [Google Scholar] [CrossRef]
- Wurman, J.; Alexander, C.R. The 30 May 1998 Spencer, South Dakota, Storm. Part II: Comparison of observed damage and radar-derived winds in the tornadoes. Mon. Weather Rev. 2005, 133, 97–119. [Google Scholar] [CrossRef]
- Villalobos, F.A.; Byrne, B.W.; Houlsby, G.T. An experimental study of the drained capacity of suction caisson foundations under monotonic loading for offshore applications. Soils Found. 2009, 49, 477–488. [Google Scholar] [CrossRef] [Green Version]
- Meyerhof, G.G. The ultimate bearing capacity of foundations. Geotechnique 1951, 2, 301–332. [Google Scholar] [CrossRef]
- De Beer, E.E. Experimental determination of the shape factors and the bearing capacity factors of sand. Geotechnique 1970, 20, 387–411. [Google Scholar] [CrossRef]
- Hansen, J.B. A Revised and Extended Formula for Bearing Capacity; Danish Geotechnical Institute: Copenhagen, Danmark, 1970; Volume 28, pp. 5–11. ISBN 8774510282/978-8774510284. [Google Scholar]
- Vesic, A.S. Analysis of ultimate loads of shallow foundations. J. Soil Mech. Found. Div. 1973, 99, 45–73. [Google Scholar] [CrossRef]
- Wu, T.H.; Beal, B.E.; Lan, C. In situ shear test of soil-root systems. J. Geotech. Eng. 1988, 114, 1376–1394. [Google Scholar] [CrossRef]
- Wu, T.H. Root reinforcement of soil: Review of analytical models, test results, and applications to design. Can. Geotech. J. 2013, 50, 259–274. [Google Scholar] [CrossRef]
- Zhuang, J. Numerical investigation of caisson foundations in sand under combined monotonic loadings for offshore wind turbines. Ph.D. Thesis, École centrale de Nantes, Nantes, France, 2019. [Google Scholar]
- Cheng, N.; Cassidy, M.J. Combined loading capacity of spudcan footings on loose sand. Int. J. Phys. Model. Geotech. 2016, 16, 31–44. [Google Scholar] [CrossRef]
- Bienen, B.; Byrne, B.W.; Houlsby, G.T.; Cassidy, M.J. Investigating six-degree-of-freedom loading of shallow foundations on sand. Geotechnique 2006, 56, 367–379. [Google Scholar] [CrossRef] [Green Version]
- Houlsby, G.T.; Cassidy, M.J. A plasticity model for the behavior of footings on sand under combined loading. Geotechnique 2002, 52, 117–129. [Google Scholar] [CrossRef]
- Byrne, B.W.; Houlsby, G.T. Observations of footing behavior on loose carbonate sands. Geotechnique 2001, 51, 463–466. [Google Scholar] [CrossRef]
- Mansour, M.A.; Newson, T.; Peterson, C. A mechanistic model for windthrow of trees based on a shallow foundation approximation. Forests 2021. Manuscript in Preparation. [Google Scholar]
- Morgan, J.; Cannell, M.G.R. Shape of tree stems: A re-examination of the uniform stress hypothesis. Tree Physiol. 1994, 14, 49–62. [Google Scholar] [CrossRef]
- Petty, J.A.; Swain, C. Factors influencing stem breakage of conifers in high winds. Forestry 1985, 58, 75–84. [Google Scholar] [CrossRef]
- Grazulis, T.P. The Tornado Nature’s Ultimate Windstorm; University of Oklahoma Press: Oklahoma, OK, USA, 2001; ISBN 0806135387. [Google Scholar]
- Sills, D.M.L.; Kopp, G.A.; Elliott, L.; Jaffe, A.; Sutherland, E.; Miller, C.; Kunkel, J.; Hong, E.; Stevenson, S.; Wang, W. The Northern Tornadoes Project—Uncovering Canada’s true tornado climatology. Bull. Am. Meteorol. Soc. 2020, 1–54. [Google Scholar] [CrossRef]
- ESRI. ArcGIS Desktop: Release 10; ESRI: Redlands, AB, Canada, 2011. [Google Scholar]
- Nicoll, B.C.; Gardiner, B.A.; Rayner, B.; Peace, A.J. Anchorage of coniferous trees in relation to species, soil type and rooting depth. Can. J. For. Res. 2006, 36, 1871–1883. [Google Scholar] [CrossRef]
- Peterson, C.J.; Claassen, V. An evaluation of the stability of Quercus lobata and Populus fremontii on river levees assessed using static winching tests. Forestry 2013, 86, 201–209. [Google Scholar] [CrossRef] [Green Version]
- Vollsinger, S.; Mitchell, S.J.; Byrne, K.E.; Novak, M.D.; Rudnicki, M. Wind tunnel measurements of crown streamlining and drag relationships for several hardwood species. Can. J. For. Res. 2005, 35, 1238–1249. [Google Scholar] [CrossRef]
- Rich, R.L.; Frelich, L.E.; Reich, P.B. Wind-throw mortality in the southern boreal forest: Effects of species, diameter and stand age. J. Ecol. 2007, 95, 1261–1273. [Google Scholar] [CrossRef]
- Bowles, J.E. Foundation Analysis and Design, 5th ed.; The McGraw-Hill Companies: New York, NY, USA, 1996. [Google Scholar]
- Kaniraj, S.R. Design Aids in Soil Mechanics and Foundation Engineering; Tata, McGraw-Hill: New Delhi, India, 1988. [Google Scholar]
- NAVFAC. Soil Mechanics Design Manual 7.01; Naval Facilities Engineering Command: Alexandria, VA, USA, 1986. [Google Scholar]
- Forest Products Laboratory. Wood Handbook—Wood as an Engineering Material; General Technical Report FPL-GTR-113; Department of Agriculture Forest Service, Forest Products Laboratory: Madison, WI, USA, 1999.
- Marshall, T.P. The enhanced Fujita (EF) scale. In Proceedings of the 22nd Conference on Severe Local Storms, Hyannis, MA, USA, 4–8 October 2004. American Meteorological Society. [Google Scholar]
- Rhee, D.M.; Lombardo, F.T.; Kadowaki, J. Semi-automated tree-fall pattern identification using image processing technique: Application to Alonsa, MB tornado. J. Wind Eng. Ind. Aerodyn. 2020. [Google Scholar] [CrossRef]
- Gardiner, B.A.; Stacey, G.R.; Belcher, R.E.; Wood, C.J. Field and wind tunnel assessments of the implications of respacing and thinning for tree stability. Forestry 1997, 70, 233–252. [Google Scholar] [CrossRef]
- Kerzenmacher, T.; Gardiner, B. A mathematical model to decribe the dynamic response of a spruce tree to the wind. Trees 1998, 12, 385–394. [Google Scholar] [CrossRef]
- Peltola, H.; Kellomäki, S.; Väisänen, H. Model computations of the impact of climatic change on the windthrow risk of trees. Clim. Chang. 1999, 41, 17–36. [Google Scholar] [CrossRef]
- Zhu, J.; Matsuzaki, T.; Sakioka, K. Wind speeds within a single crown of Japanese black pine (Pinus thunbergii Parl.). For. Ecol. Manag. 2000, 135, 19–31. [Google Scholar] [CrossRef]
- Neustein, S.A. Windthrow on the margins of various sizes of felling area. In Report on Forest Research for the Year Ended March 1964; Forestry Commission, HMSO: London, UK, 1965; pp. 166–171. [Google Scholar]
- Gardiner, B.; Peltola, H.; Kellomäki, S. Comparison of two models for predicting the critical wind speeds required to damage coniferous trees. Ecol. Model. 2000, 129, 1–23. [Google Scholar] [CrossRef]
- Gardiner, B.; Blennow, K.; Carnus, J.-M.; Fleischer, P.; Ingemarson, F.; Landmann, G.; Lindner, M.; Marzano, M.; Nocoll, B.; Orazio, C.; et al. Destructive Storms in European Forests: Past and Forthcoming Impacts; Final Report to European Commission DG Environment; European Forest Institute: Joensuu, Finland, 2010. [Google Scholar]
- Mitchell, S. A diagnostic framework for windthrow risk estimation. For. Chron. 1998, 74, 100–105. [Google Scholar] [CrossRef] [Green Version]
- Miller, K.F. Windthrow Hazard Classification; Forestry Commission Leaflet 85; HMSO: London, UK, 1985.
- Haan, F.L.; Balaramudu, V.K.; Sarkar, P.P. Tornado-Induced Wind Loads on a Low-Rise Building. J. Struct. Eng. 2010, 136, 106–116. [Google Scholar] [CrossRef] [Green Version]
- Miller, M.D.; Wong, J.C. Guidelines for Electrical Transmission Line Structural Loading, 3rd ed.; American Society of Civil Engineers: Washington, DC, USA, 2010. [Google Scholar]
- Wittingham, H.E. Extreme Wind Gusts in Australia. In Commonwealth Australian Bureau of Meteorology; Bulletin: Sydney, Australia, 1964; Volume 46. [Google Scholar]
- Canadian Commission on Buildings and Fire Codes, National Research Council of Canada. User’s Guide—NBC 2010: Structural Commentaries (Part 4); National Research Council of Canada (NRC): Ottawa, ON, Canada, 2010.
- Elsner, J.B.; Jagger, T.H.; Widen, H.M.; Chavas, D.R. Daily tornado frequency distributions in the United States. Environ. Res. Lett. 2014, 9, 024018. [Google Scholar] [CrossRef] [Green Version]
- Elsner, J.B.; Fricker, T.; Schroder, Z. Increasingly powerful tornadoes in the United States. Geophys. Res. Lett. 2018, 46, 392–398. [Google Scholar] [CrossRef] [Green Version]
- Diffenbaugh, N.S.; Scherer, M.; Trapp, R.J. Robust increases in severe thunderstorm environments in response to greenhouse forcing. Proc. Natl. Acad. Sci. USA 2013, 110, 16361–16366. [Google Scholar] [CrossRef] [PubMed] [Green Version]
- Peterson, C.J.; Cannon, J.B.; Godfrey, C.M. First steps toward defining the wind disturbance regime in central hardwoods forests. In Natural Disturbances and Historic Range of Variation—Part of the Managing Forest Ecosystems Book Series; Greenberg, C.H., Collins, B.S., Eds.; Springer: New York, NY, USA, 2015; Volume 32, pp. 89–122. [Google Scholar]
- Frelich, L.E. Forest Dynamics and Disturbance Regimes: Studies from Temperate Evergreen-Deciduous Forests; Cambridge University Press: New York, NY, USA, 2002. [Google Scholar]
- Canham, C.D.; Papaik, M.J.; Latty, E.F. Interspecific variation in susceptibility to windthrow as a function of tree size and storm severity for northern temperate tree species. Can. J. For. Res. 2001, 31, 1–10. [Google Scholar] [CrossRef]
- Fan, F.; Pang, W. Stochastic track model for tornado risk assessment in the U.S. Front. Built Environ. 2019, 5:37, 1–18. [Google Scholar] [CrossRef]
- Peterson, E.B.; Peterson, N.M. Ecology, Management, and Use of Aspen and Balsam Poplar in the Prairie Provinces; Special Report 1; Forestry Canada, Northwest Region, Northern Forestry Center: Edmonton, AB, Canada, 1992.
- Kamimura, K.; Kitagawa, K.; Saito, S.; Mizunaga, H. Root anchorage of hinoki (Chamaecyparis obtuse (Sieb. Et Zucc.) Endl.) under the combined loading of wind and rapidly supplied water on soil: Analyses based on tree-pulling experiments. Eur. J. For. Res. 2012, 131, 219–227. [Google Scholar] [CrossRef]
- Talkkari, A.; Peltola, H.; Kellomäki, S.; Strandman, H. Integration of component models from tree, stand and regional levels to assess the risk of wind damage at forest margins. For. Ecol. Manag. 2000, 135, 303–313. [Google Scholar] [CrossRef]
- Godfrey, C.M.; Peterson, C.J. Estimating enhanced Fujita scale levels based on forest damage severity. Weather Forecast. 2017, 32, 243–252. [Google Scholar] [CrossRef]
- Coutts, M.P. Components of tree stability in Sitka spruce on peaty gley soil. Forestry 1986, 59, 173–197. [Google Scholar] [CrossRef]
- Schenkman, A.D.; Xue, M.; Hu, M. Tornadogenesis in a high-resolution simulation of the 8 May 2003 Oklahoma City supercell. J. Atmos. Sci. 2014, 71, 130–154. [Google Scholar] [CrossRef]
- Rudnicki, M.; Silins, U.; Lieffers, V.J.; Josi, G. Measure of simultaneous tree sways and estimation of crown interactions among a group of trees. Trees 2001, 15, 83–90. [Google Scholar] [CrossRef]
- Webb, V.A.; Rudnicki, M.; Muppa, S.K. Analysis of tree sway and crown collisions for managed Pinus resinosa in southern Maine. For. Ecol. Manag. 2013, 302, 193–199. [Google Scholar] [CrossRef]
Figure 1.
Wind field of a left to right translating vortex with VT = 13 m/s, Gmax = 4.5, RMW = 483 m, α = 45°, φ = 0.55 (Left) and decomposition of the velocity components of the Rankine vortex model (Right) (after [28]).
Figure 1.
Wind field of a left to right translating vortex with VT = 13 m/s, Gmax = 4.5, RMW = 483 m, α = 45°, φ = 0.55 (Left) and decomposition of the velocity components of the Rankine vortex model (Right) (after [28]).

Figure 2.
Windthrow model development. (a) Schematic tree representation under general loading condition and (b) failure load surface in the FV-FH-FM/2R space (after [52]).
Figure 2.
Windthrow model development. (a) Schematic tree representation under general loading condition and (b) failure load surface in the FV-FH-FM/2R space (after [52]).

Figure 3.
Alonsa tornado track orthomosaic.

Figure 4.
Relationship between FM and diameter at breast height (DBH) for red alder and cottonwood trees.
Figure 4.
Relationship between FM and diameter at breast height (DBH) for red alder and cottonwood trees.

Figure 5.
Diameter correction factor for hardwood trees in the damaged area.

Figure 6.
Relationship between critical wind speed and uprooted tree volume.

Figure 7.
Relationship between critical wind speed and stem broken tree volume.

Figure 8.
Relationships between critical wind speed and H·DBH2 for uprooted and stem broken trees.

Figure 9.
Treefall patterns with a translating vortex with Vmax = 52 m/s, Gmax = 3, Rmax = 240 m and φ = 0.7, (a) α = 0° and H·DBH2 = 0.5 m3, (b) α = 0° and H·DBH2 = 1.5 m3 and (c) α = 30° and H·DBH2 = 1.5 m3.
Figure 9.
Treefall patterns with a translating vortex with Vmax = 52 m/s, Gmax = 3, Rmax = 240 m and φ = 0.7, (a) α = 0° and H·DBH2 = 0.5 m3, (b) α = 0° and H·DBH2 = 1.5 m3 and (c) α = 30° and H·DBH2 = 1.5 m3.

Figure 10.
Treefall patterns with a translating vortex with Vmax = 91 m/s, Gmax = 6, Rmax = 240 m and φ = 0.7, (a) α = 0° and H·DBH2 = 1.5 m3 and (b) α = 30° and H·DBH2 = 1.5 m3.
Figure 10.
Treefall patterns with a translating vortex with Vmax = 91 m/s, Gmax = 6, Rmax = 240 m and φ = 0.7, (a) α = 0° and H·DBH2 = 1.5 m3 and (b) α = 30° and H·DBH2 = 1.5 m3.

Figure 11.
Treefall patterns of trees with random H·DBH2 and knot factor = 0.75: vortex translating with Vmax = 52 m/s, Gmax = 3 on a (a) unsaturated soil and (b) saturated soil, vortex translating with Vmax = 91 m/s, Gmax = 6 on a (c) unsaturated soil and (d) saturated soil. Other vortex parameters are kept constant as Rmax = 240 m, φ = 0.7, α = 30°.

Publisher’s Note: MDPI stays neutral with regard to jurisdictional claims in published maps and institutional affiliations. |
© 2020 by the authors. Licensee MDPI, Basel, Switzerland. This article is an open access article distributed under the terms and conditions of the Creative Commons Attribution (CC BY) license (http://creativecommons.org/licenses/by/4.0/).
Share and Cite
MDPI and ACS Style
Mansour, M.A.; Rhee, D.M.; Newson, T.; Peterson, C.; Lombardo, F.T. Estimating Wind Damage in Forested Areas Due to Tornadoes. Forests 2021, 12, 17. https://0-doi-org.brum.beds.ac.uk/10.3390/f12010017
AMA Style
Mansour MA, Rhee DM, Newson T, Peterson C, Lombardo FT. Estimating Wind Damage in Forested Areas Due to Tornadoes. Forests. 2021; 12(1):17. https://0-doi-org.brum.beds.ac.uk/10.3390/f12010017
Chicago/Turabian StyleMansour, Mohamed A., Daniel M. Rhee, Timothy Newson, Chris Peterson, and Franklin T. Lombardo. 2021. "Estimating Wind Damage in Forested Areas Due to Tornadoes" Forests 12, no. 1: 17. https://0-doi-org.brum.beds.ac.uk/10.3390/f12010017
Note that from the first issue of 2016, this journal uses article numbers instead of page numbers. See further details here.