Norway Spruce Seedlings from an Eastern Baltic Provenance Show Tolerance to Simulated Drought

 ,
, 
 and
and
Abstract
:1. Introduction
2. Materials and Methods
2.1. Experimental Setup
2.2. Measurements
2.3. Data Analysis
3. Results
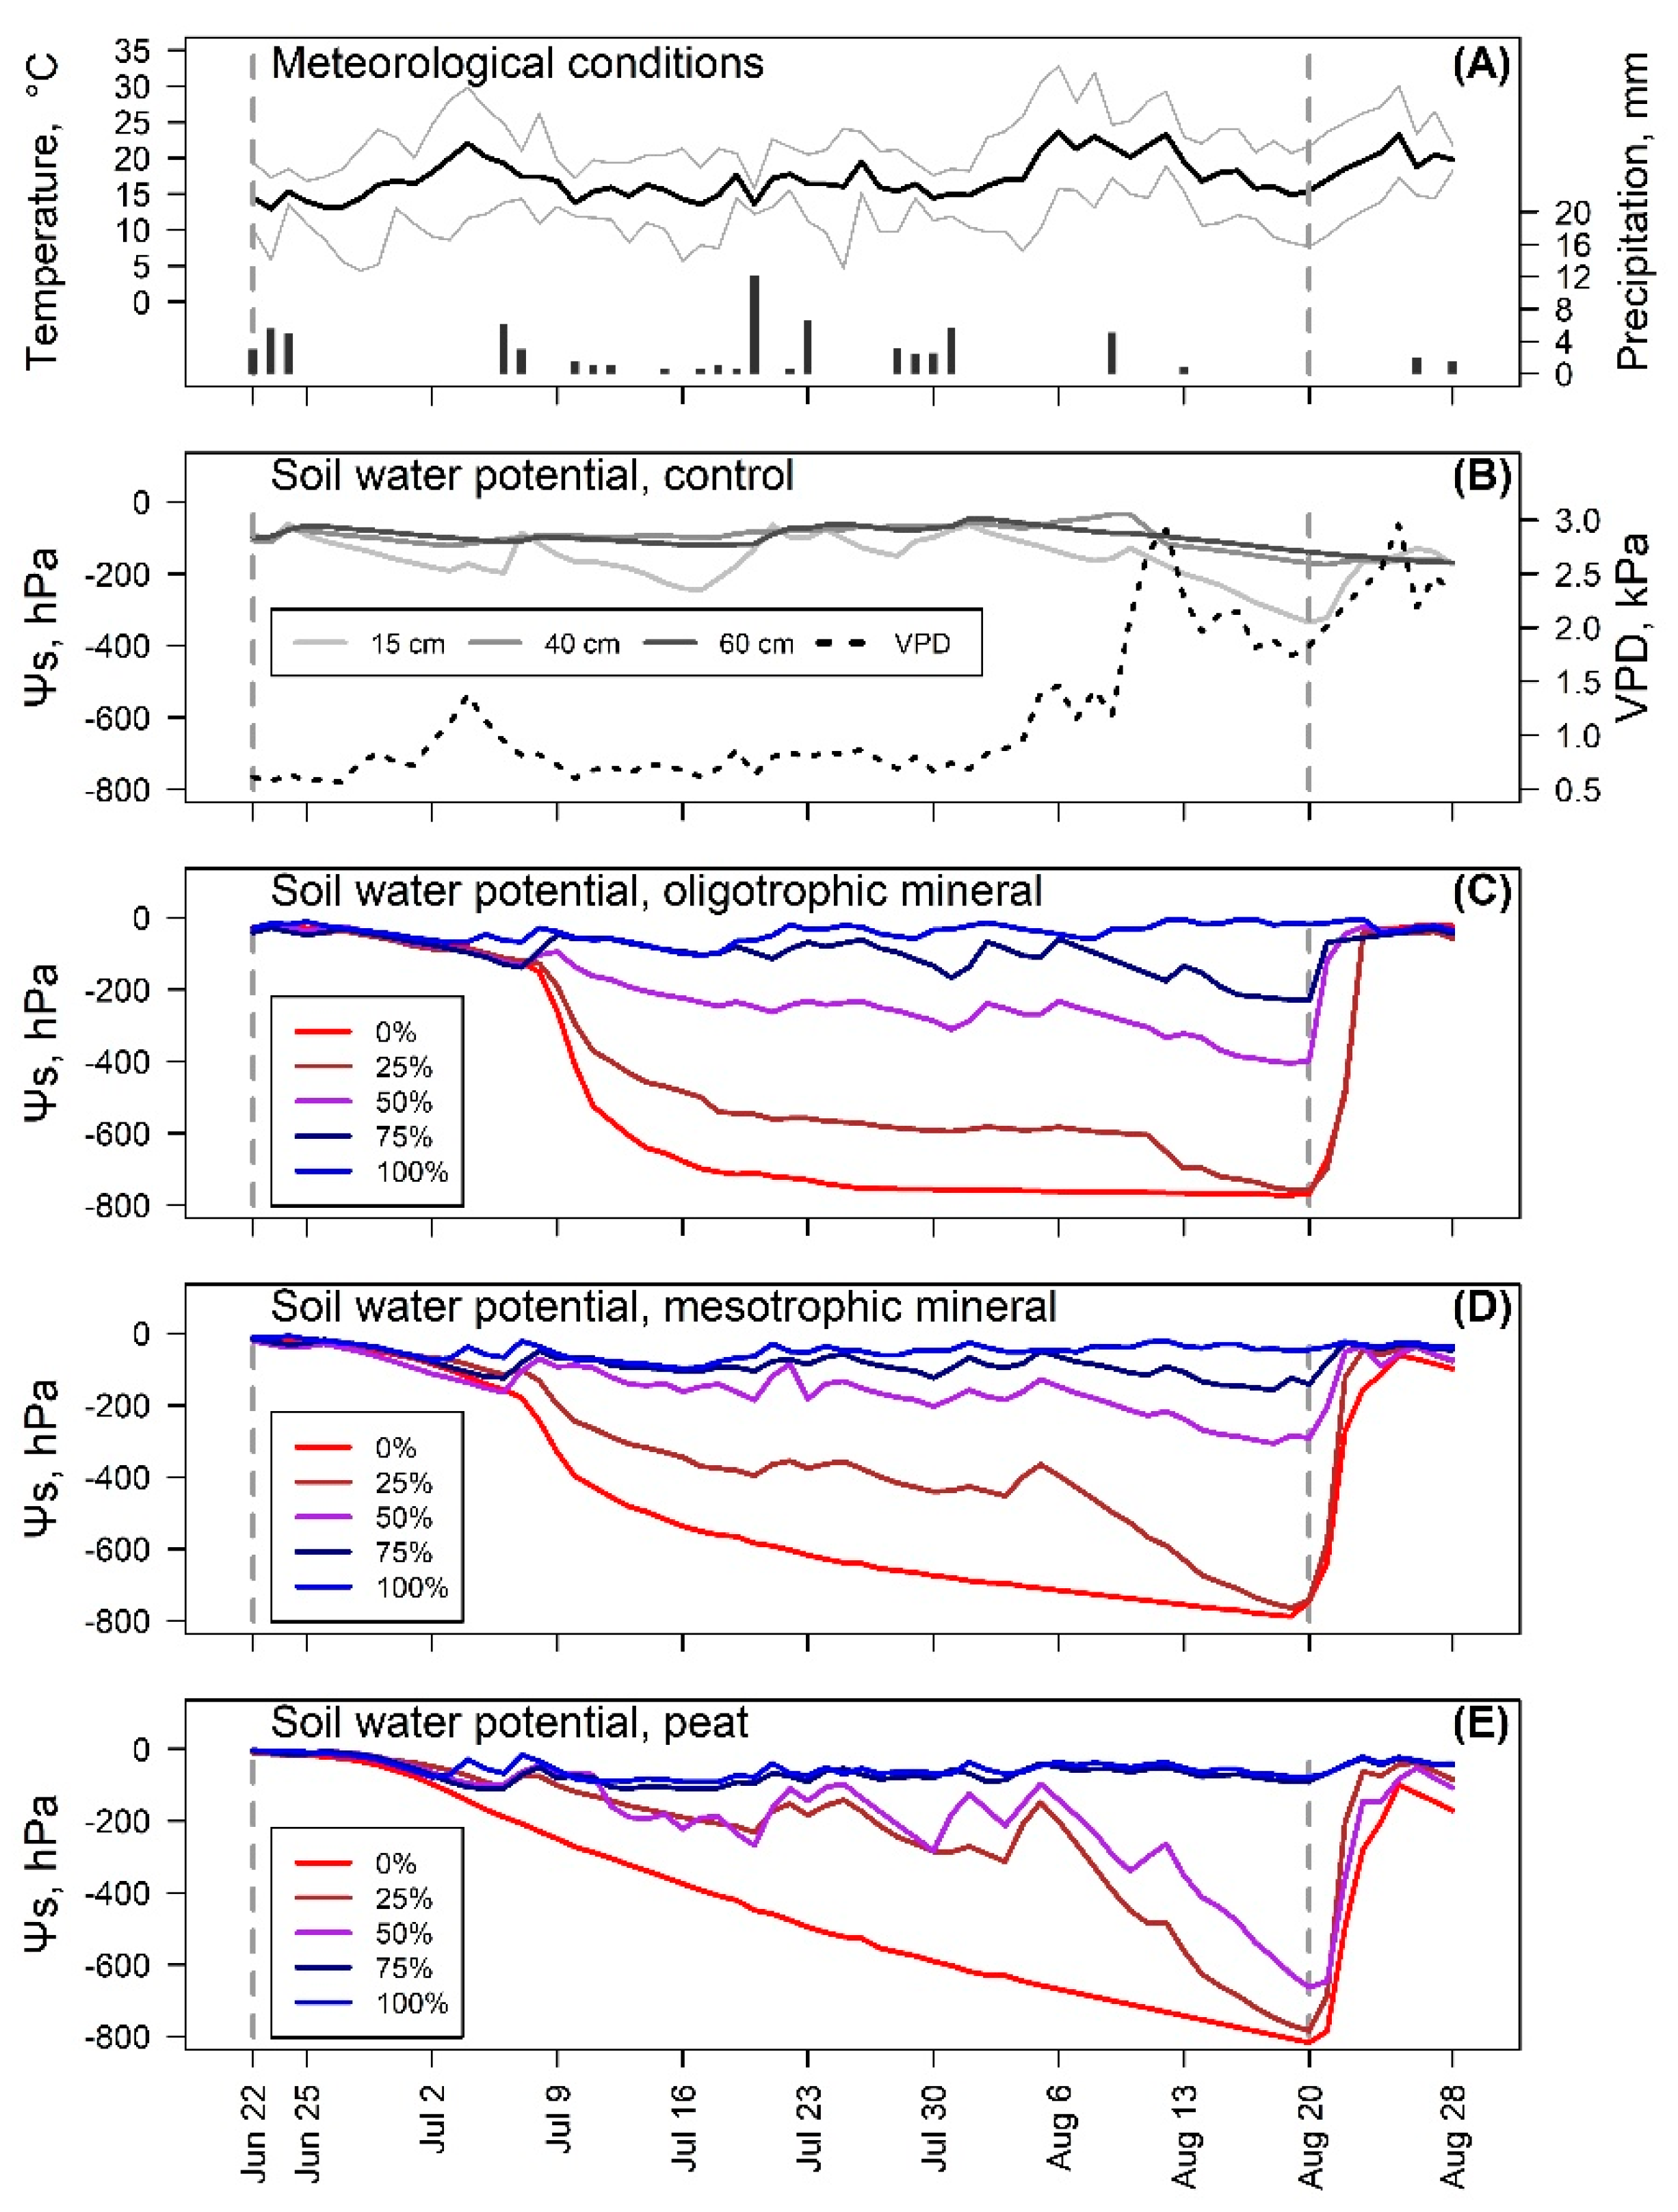
3.1. Soil Moisture
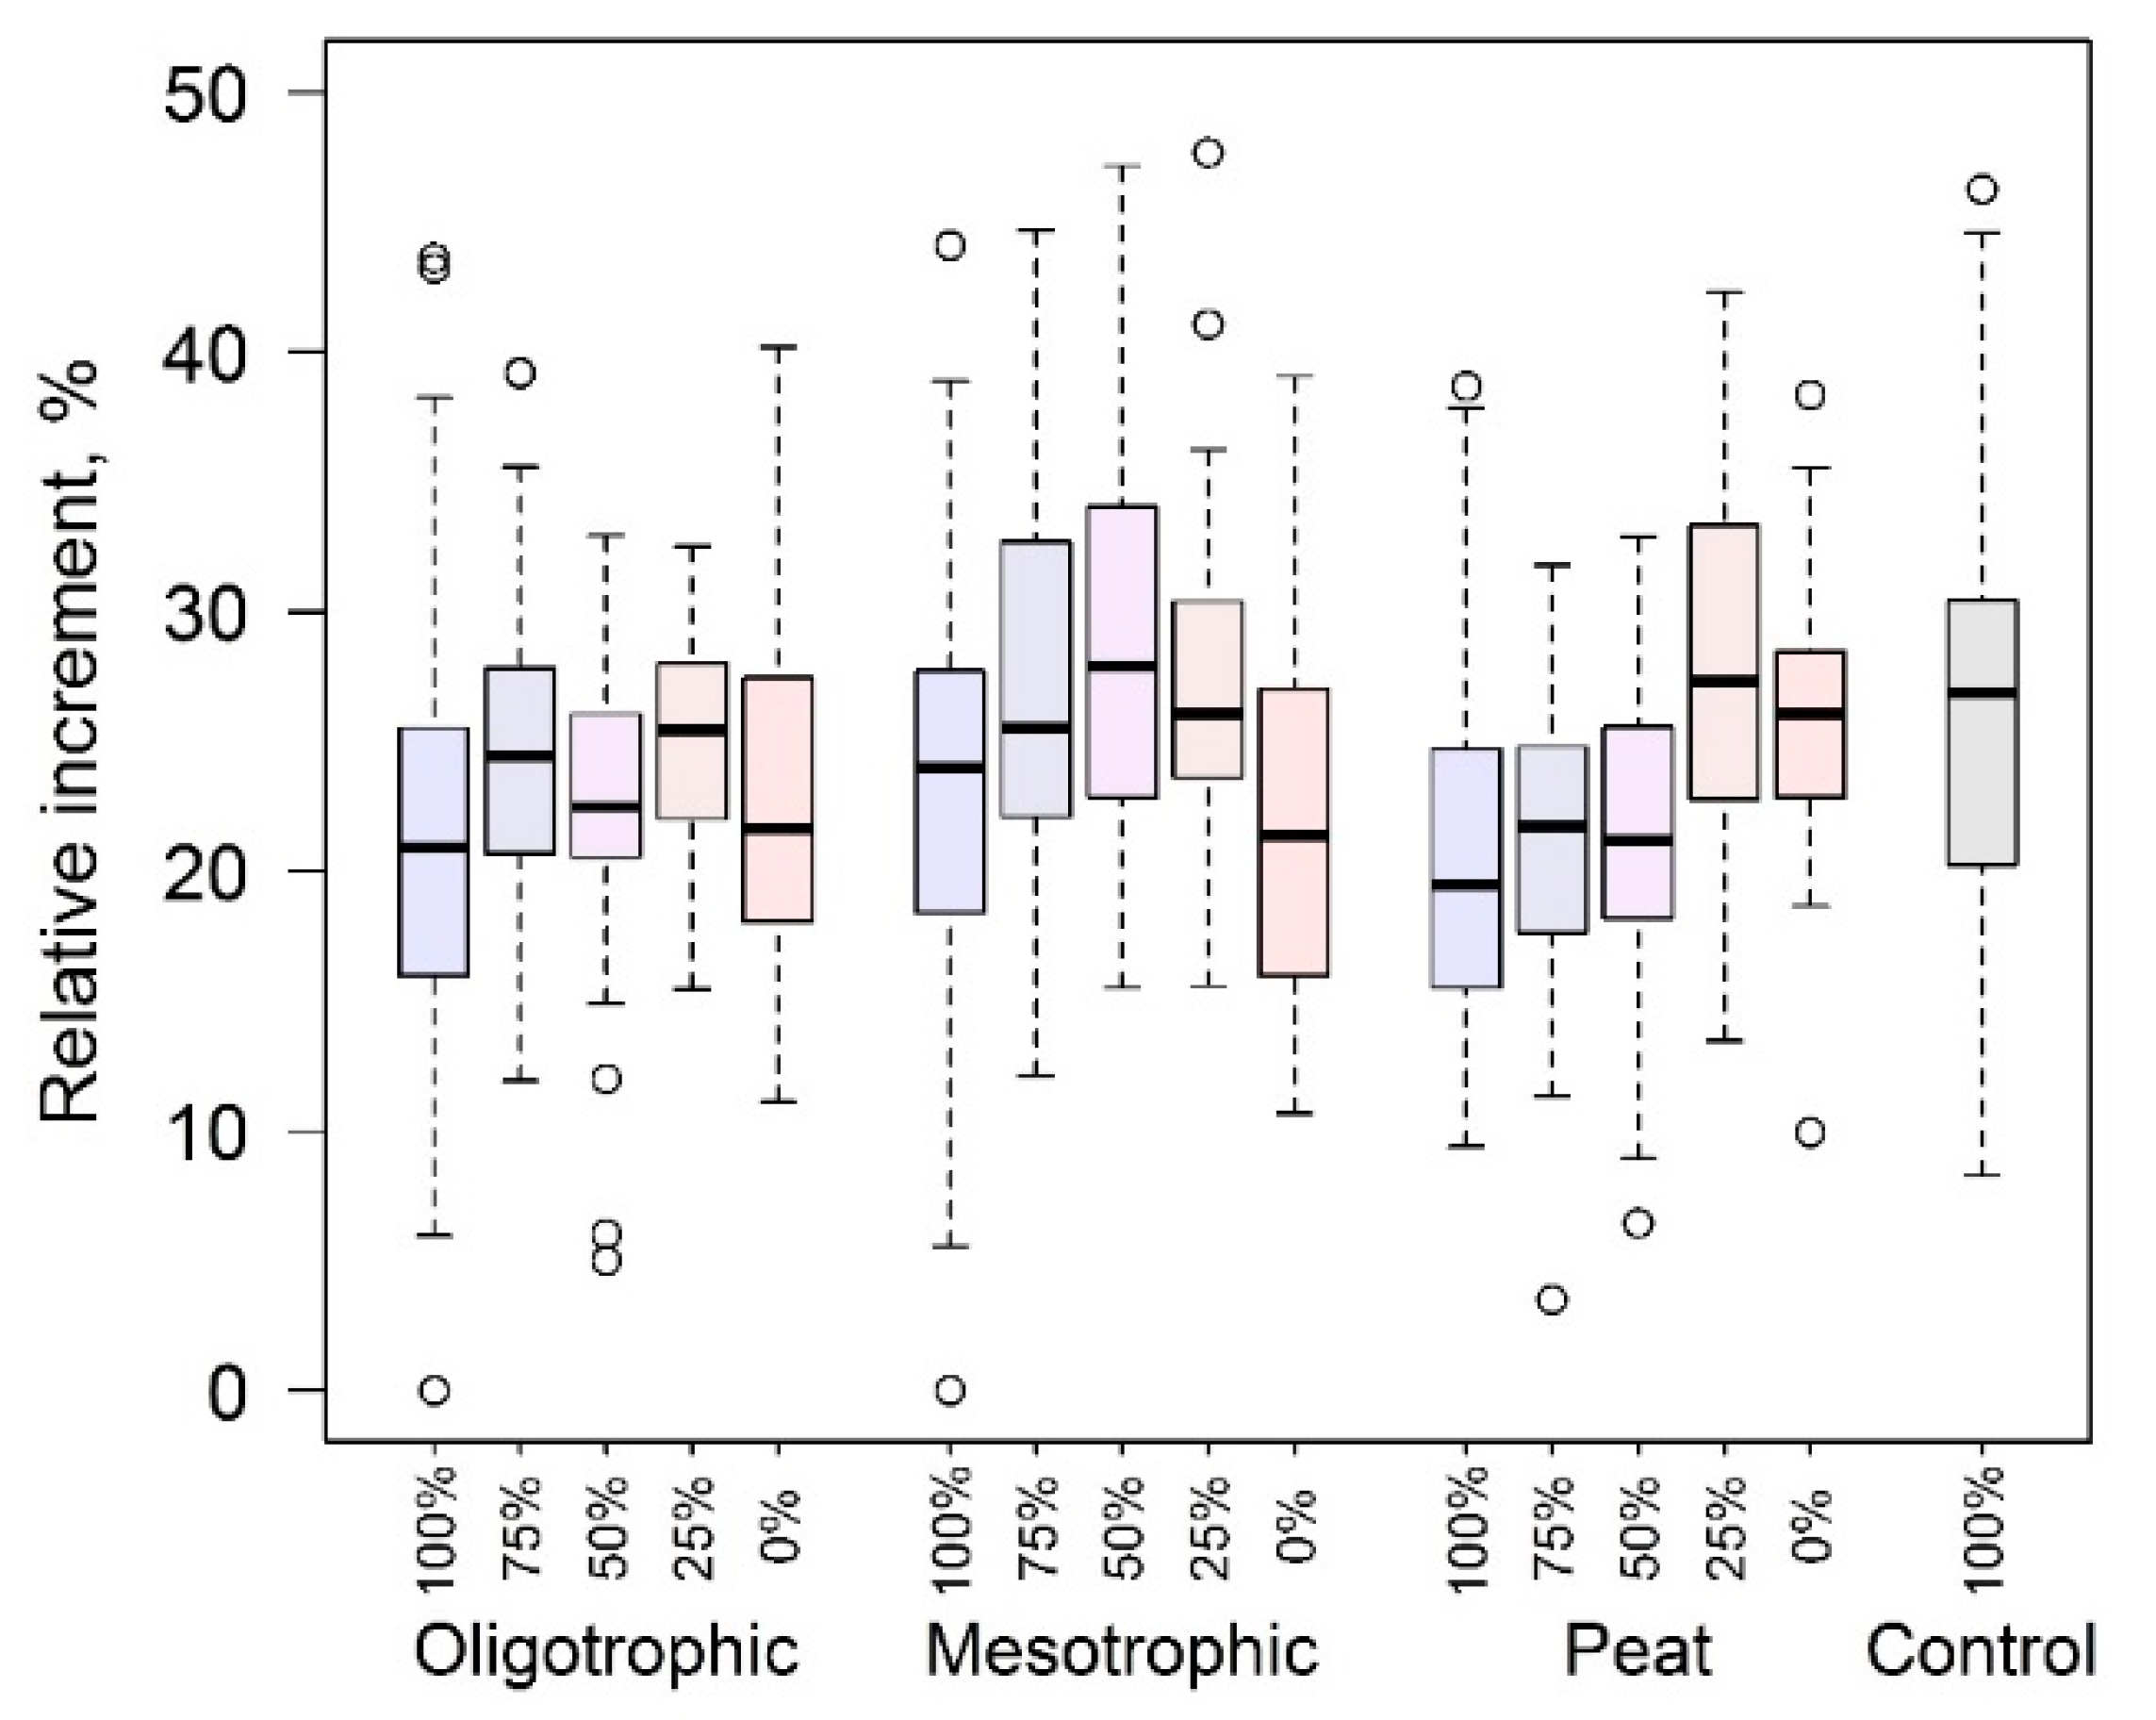
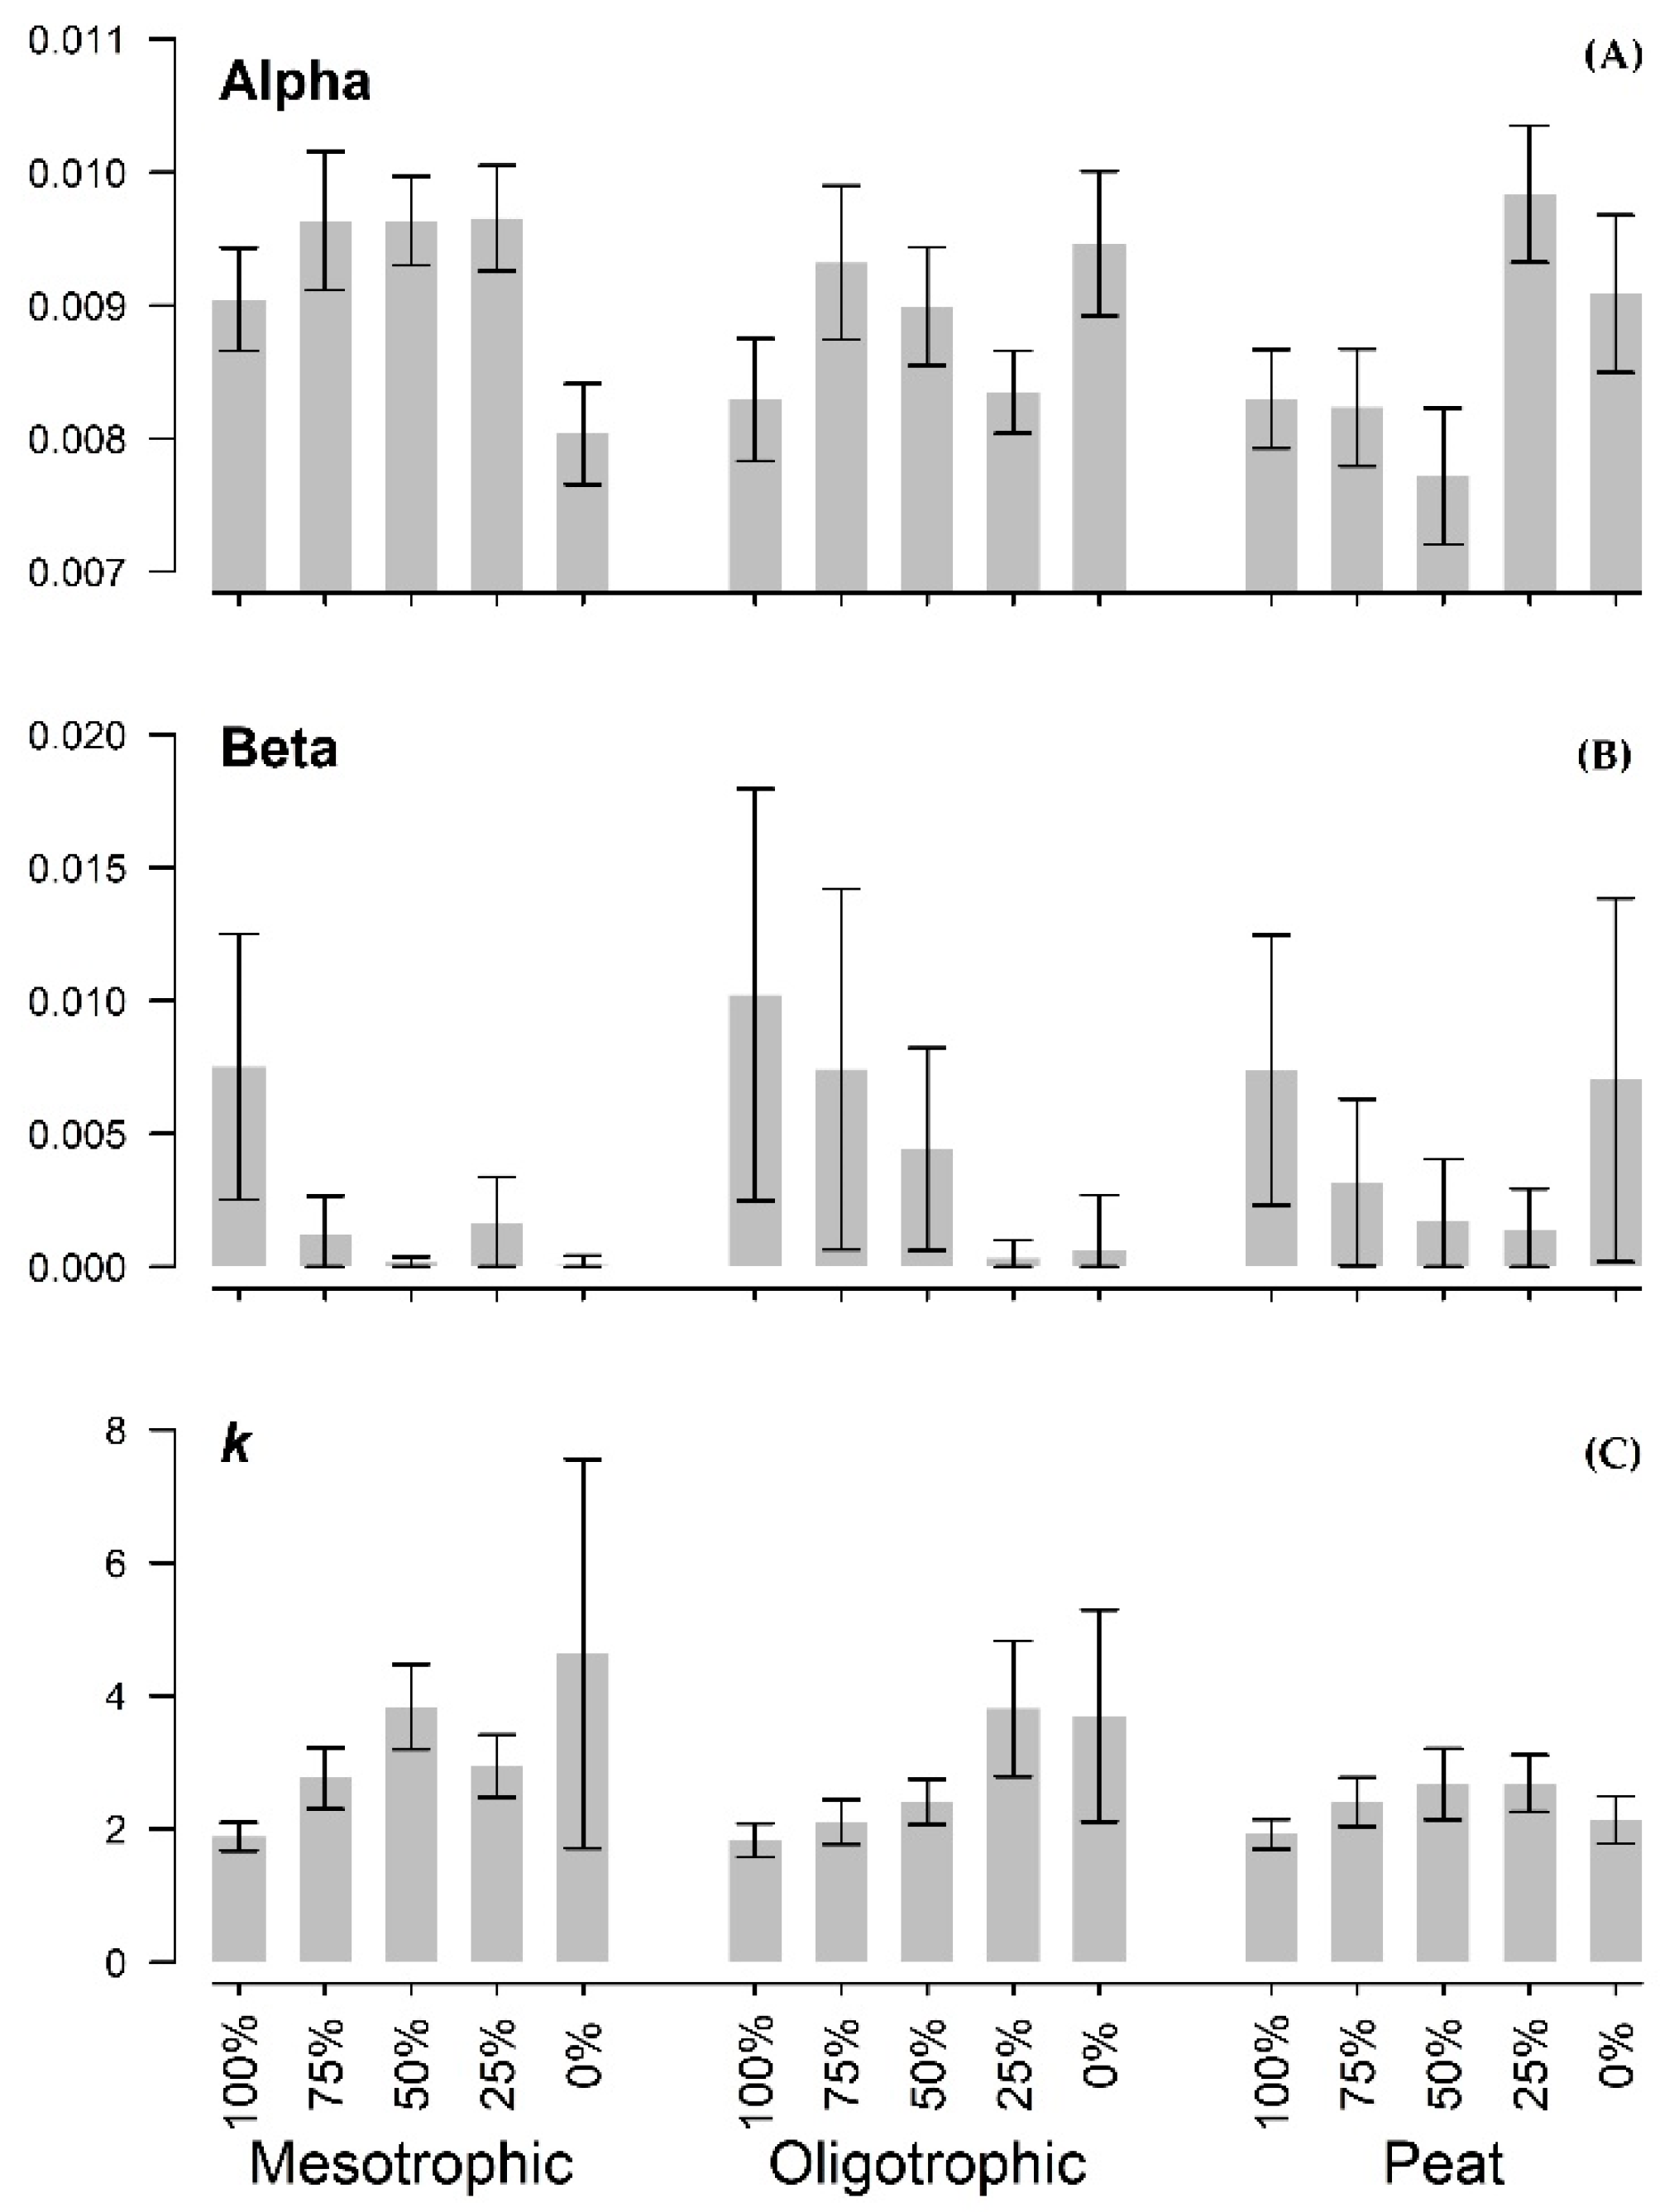
3.2. Seedling Growth
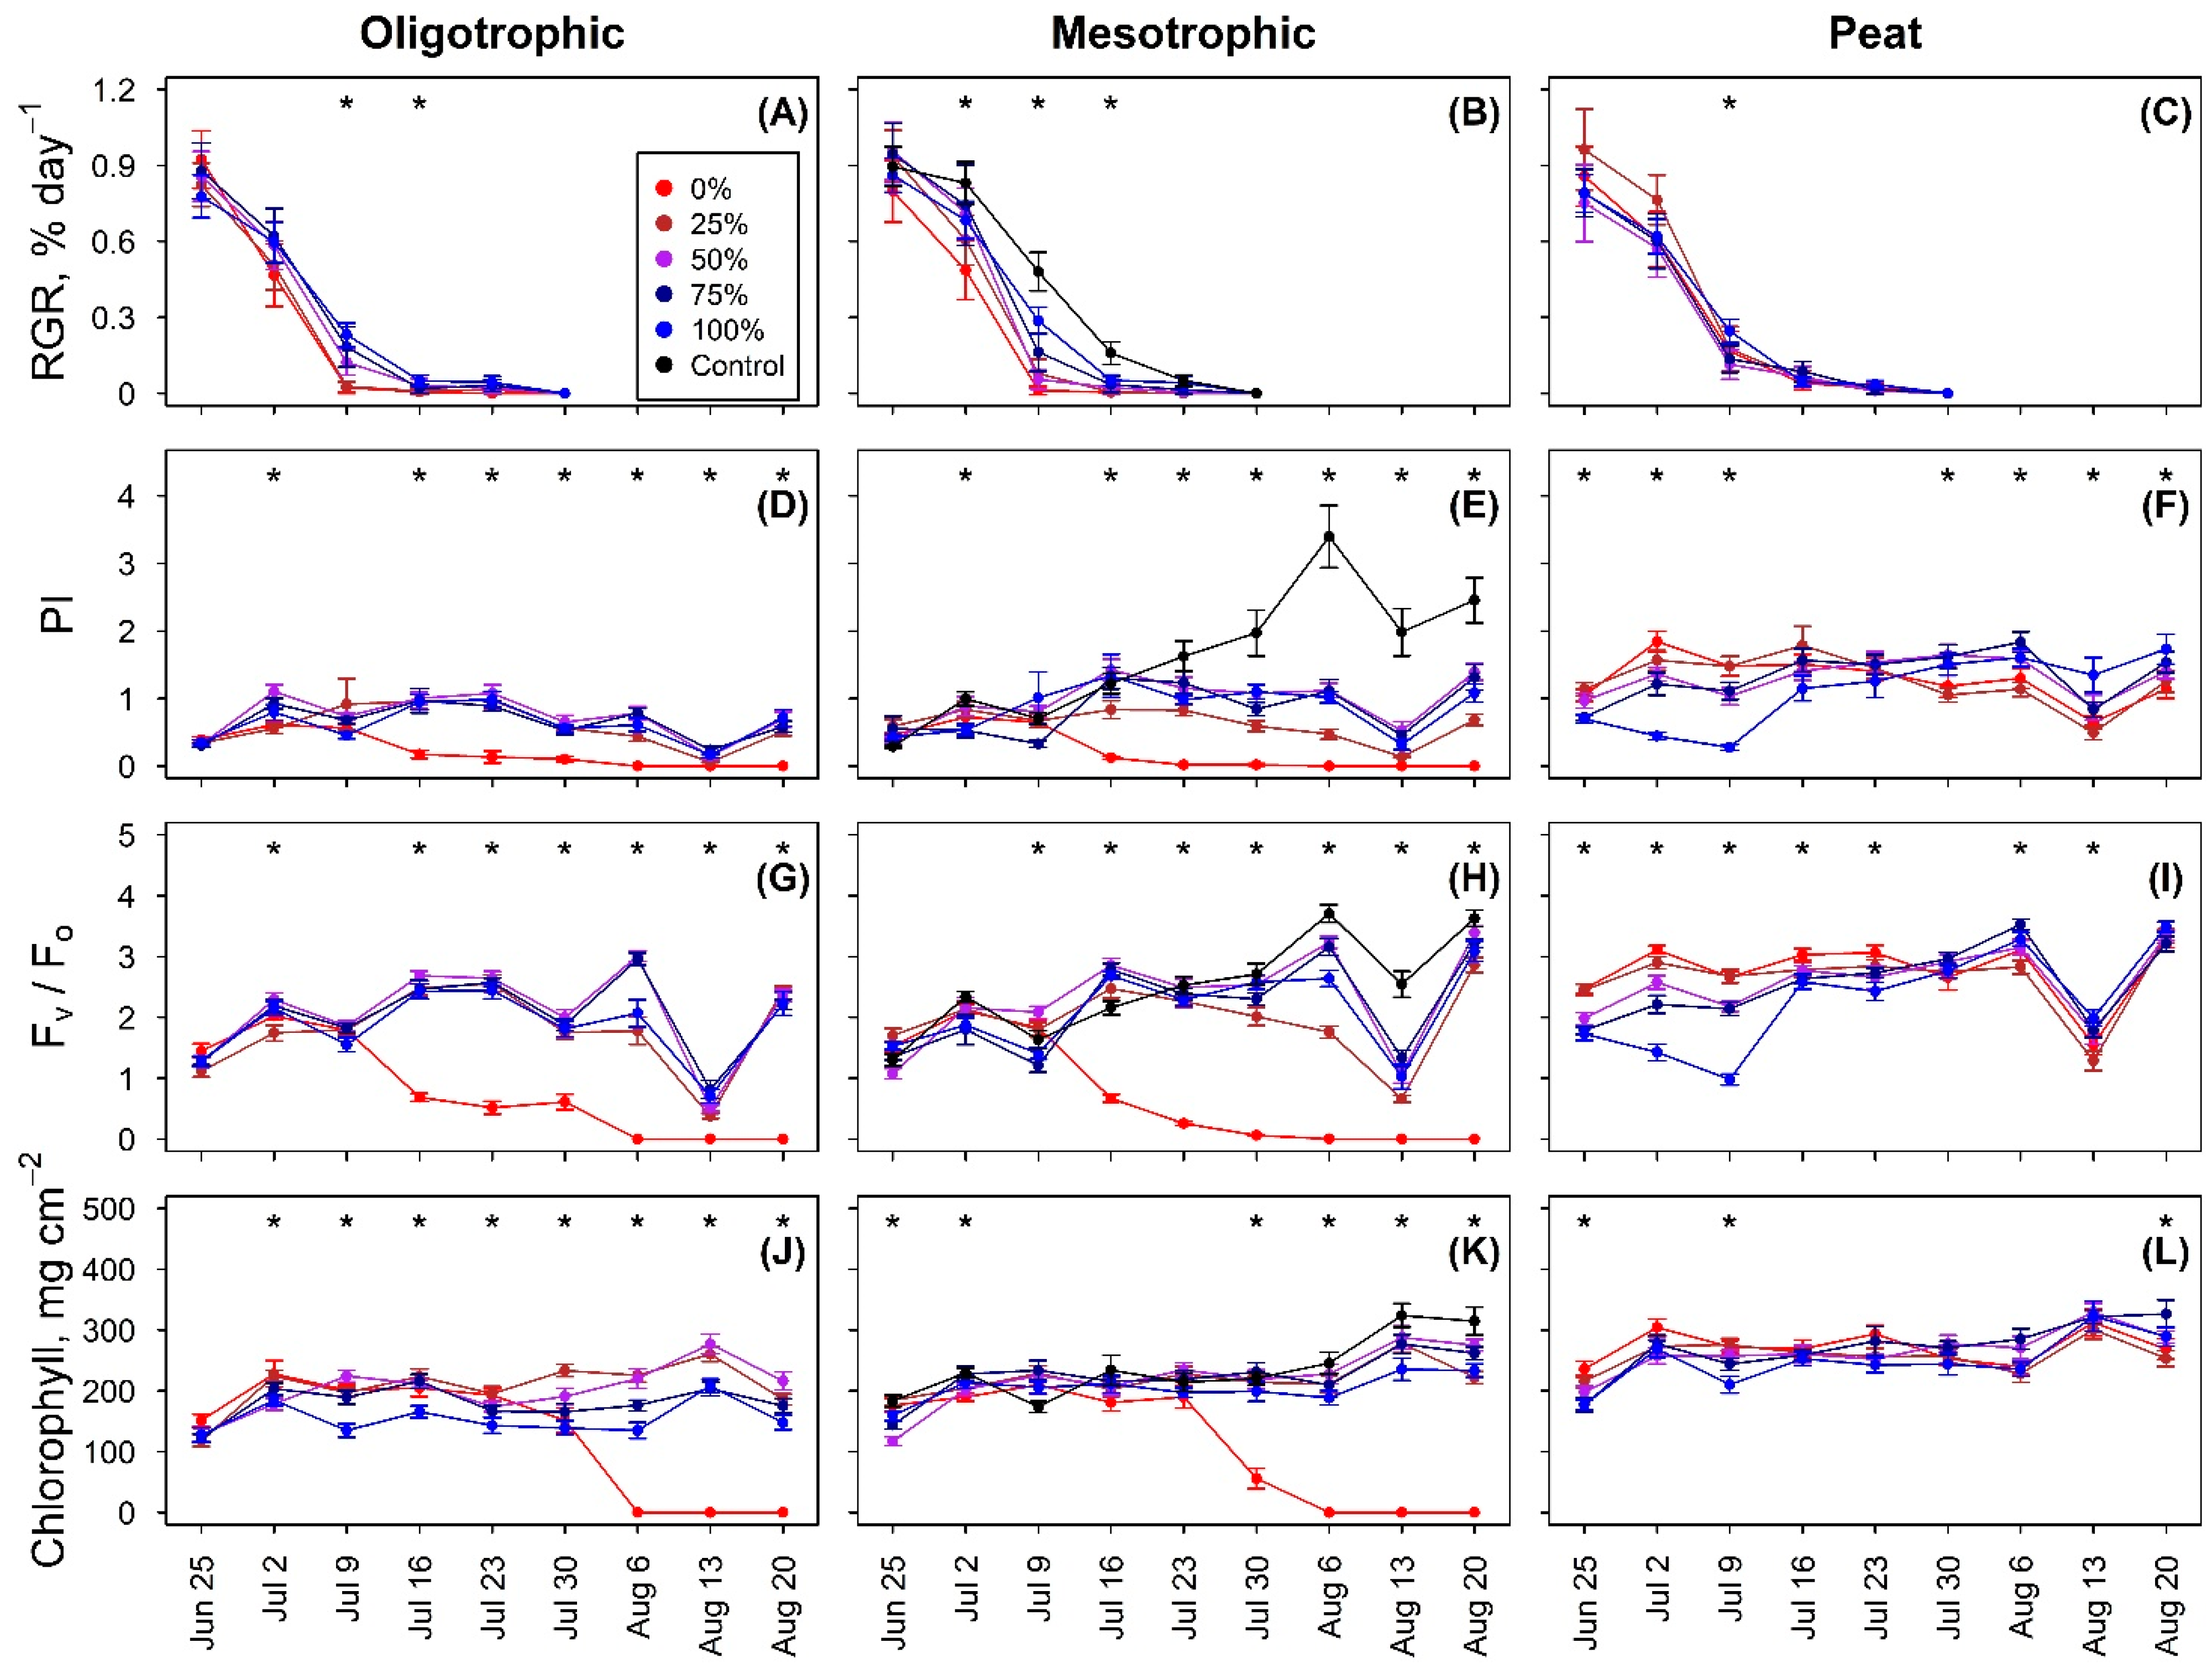
3.3. Photosynthetic Activity
4. Discussion
4.1. Sensitivity of Height Growth
4.2. Photosynthetic Performance
5. Conclusions
Author Contributions
Funding
Institutional Review Board Statement
Informed Consent Statement
Data Availability Statement
Acknowledgments
Conflicts of Interest
References
- Buras, A.; Menzel, A. Projecting tree species composition changes of European forests for 2061–2090 under RCP 4.5 and RCP 8.5 scenarios. Front. Plant. Sci. 2019, 9, N1986. [Google Scholar] [CrossRef] [Green Version]
- Hanewinkel, M.; Cullmann, D.A.; Schelhaas, M.J.; Nabuurs, G.J. Climate change may cause severe loss in the economic value of European forest land. Nat. Clim Chang. 2012, 3, 203–207. [Google Scholar] [CrossRef]
- Nabuurs, G.J.; Verkerk, P.J.; Schelhaas, M.J.; González Olabarria, J.R.; Trasobares, A.; Cienciala, E. Climate-Smart Forestry: Mitigation Impacts in Three European Regions—Science to Policy 6; European Forest Institute: Vienna, Austria, 2018. [Google Scholar]
- Taeger, S.; Zang, C.; Liesebach, M.; Schneck, V.; Menzel, A. Impact of climate and drought events on the growth of Scots pine (Pinus sylvestris L.) provenances. For. Ecol. Manag. 2013, 307, 30–42. [Google Scholar] [CrossRef]
- Ditmarova, L.; Kurjak, D.; Palmroth, S.; Kmet, J.; Střelcová, K. Physiological responses of Norway spruce (Picea abies) seedlings to drought stress. Tree Physiol. 2009, 30, 205–213. [Google Scholar] [CrossRef] [Green Version]
- Thurm, E.A.; Hernandez, L.; Baltensweiler, A.; Ayan, S.; Rasztovits, E.; Hernández, L.; Zlatanov, T.M.; Hladnik, D.; Bielak, K.; Freudenschuss, A.; et al. Alternative tree species under climate warming in managed European forests. For. Ecol. Manag. 2018, 430, 485–497. [Google Scholar] [CrossRef]
- Lindner, M.; Maroschek, M.; Netherer, S.; Kremer, A.; Barbati, A.; García-Gonzalo, J.; Seidl, R.; Delzon, S.; Corona, P.; Kolström, M.; et al. Climate change impacts, adaptive capacity, and vulnerability of European forest ecosystems. For. Ecol. Manag. 2010, 259, 698–709. [Google Scholar] [CrossRef]
- Trajkovic, S. Temperature-based approaches for estimating reference evapotranspiration. J. Irrig. Drain. Eng. 2005, 131, 316–323. [Google Scholar] [CrossRef]
- Intergovernmental Panel on Climate Change. Climate Change 2013–The Physical Science Basis: Working Group I Contribution to the Fifth Assessment Report of the Intergovernmental Panel on Climate Change; Cambridge University Press: Cambridge, UK, 2014. [Google Scholar] [CrossRef] [Green Version]
- Harvey, J.E.; Smiljanić, M.; Scharnweber, T.; Buras, A.; Cedro, A.; Cruz-García, R.; Drobyshev, I.; Janecka, K.; Jansons, Ā.; Kaczka, R.; et al. Tree growth influenced by warming winter climate and summer moisture availability in northern temperate forests. Glob. Chang. Biol. 2020, 26, 2505–2518. [Google Scholar] [CrossRef]
- Allen, C.D.; Macalady, A.K.; Chenchouni, H.; Bachelet, D.; McDowell, N.; Vennetier, M.; Kitzberger, T.; Rigling, A.; Breshears, D.D.; Hogg, E.H.T.; et al. A global overview of drought and heat-induced tree mortality reveals emerging climate change risks for forests. For. Ecol. Manag. 2010, 259, 660–684. [Google Scholar] [CrossRef] [Green Version]
- Brunner, I.; Herzog, C.; Dawes, M.A.; Arend, M.; Sperisen, C. How tree roots respond to drought. Front. Plant. Sci. 2015, 6, N547. [Google Scholar] [CrossRef] [Green Version]
- Schall, P.; Lödige, C.; Beck, M.; Ammer, C. Biomass allocation to roots and shoots is more sensitive to shade and drought in European beech than in Norway spruce seedlings. For. Ecol. Manag. 2012, 266, 246–253. [Google Scholar] [CrossRef]
- Jyske, T.; Holtta, T.; Mäkinen, H.; Nojd, P.; Lumme, I.; Spiecker, H. The effect of artificially induced drought on radial increment and wood properties of Norway spruce. Tree Physiol. 2009, 30, 103–115. [Google Scholar] [CrossRef] [Green Version]
- Cuny, H.E.; Rathgeber, C.B.; Frank, D.; Fonti, P.; Mäkinen, H.; Prislan, P.; Rossi, S.; Del Castillo, E.M.; Campelo, F.; Vavrčík, H.; et al. Woody biomass production lags stem-girth increase by over one month in coniferous forests. Nat. Plants. 2015, 1, 1–6. [Google Scholar] [CrossRef]
- Mäkinen, H.; Nojd, P.; Saranpaa, P. Seasonal changes in stem radius and production of new tracheids in Norway spruce. Tree Physiol. 2003, 23, 959–968. [Google Scholar] [CrossRef] [Green Version]
- Moran, E.; Lauder, J.; Musser, C.; Stathos, A.; Shu, M. The genetics of drought tolerance in conifers. New Phytol. 2017, 216, 1034–1048. [Google Scholar] [CrossRef] [Green Version]
- Possen, B.J.H.M.; Oksanen, E.; Rousi, M.; Ruhanen, H.; Ahonen, V.; Tervahauta, A.I.; Heinonen, J.; Heiskanen, J.; Kärenlampi, S.; Vapaavuori, E. Adaptability of birch (Betula pendula Roth) and aspen (Populus tremula L.) genotypes to different soil moisture conditions. For. Ecol. Manag. 2011, 262, 1387–1399. [Google Scholar] [CrossRef]
- Jansons, Ā.; Matisons, R.; Šēnhofa, S.; Katrevičs, J.; Jansons, J. High-frequency variation of tree-ring width of some native and alien tree species in Latvia during the period 1965–2009. Dendrochronologia 2016, 40, 151–158. [Google Scholar] [CrossRef]
- Schlyter, P.; Stjernquist, I.; Bärring, L.; Jönsson, A.M.; Nilsson, C. Assessment of the impacts of climate change and weather extremes on boreal forests in northern Europe, focusing on Norway spruce. Clim. Res. 2006, 31, 75–84. [Google Scholar] [CrossRef]
- Netherer, S.; Panassiti, B.; Pennerstorfer, J.; Matthews, B. Acute drought is an important driver of bark beetle infestation in Austrian Norway spruce stands. Front. For. Glob. Change 2019, 2, N39. [Google Scholar] [CrossRef] [Green Version]
- Jönsson, A.M.; Appelberg, G.; Harding, S.; Bärring, L. Spatio-temporal impact of climate change on the activity and voltinism of the spruce bark beetle, Ips typographus. Glob. Chang. Biol. 2009, 15, 486–499. [Google Scholar] [CrossRef]
- Breda, N.; Huc, R.; Granier, A.; Dreyer, E. Temperate forest trees and stands under severe drought: A review of ecophysiological responses, adaptation process and long-term consequences. Ann. For. Sci. 2006, 63, 625–644. [Google Scholar] [CrossRef] [Green Version]
- Hartmann, H.; Ziegler, W.; Kolle, O.; Trumbore, S. Thirst beats hunger–declining hydration during drought prevents carbon starvation in Norway spruce saplings. New Phytol. 2013, 200, 340–349. [Google Scholar] [CrossRef] [PubMed]
- Xu, Z.; Zhou, G.; Shimizu, H. Plant responses to drought and rewatering. Plant. Signal. Behav. 2010, 5, 649–654. [Google Scholar] [CrossRef] [PubMed] [Green Version]
- Suvanto, S.; Nöjd, P.; Henttonen, H.M.; Beuker, E.; Mäkinen, H. Geographical patterns in the radial growth response of Norway spruce provenances to climatic variation. Agric For. Meteorol. 2016, 222, 10–20. [Google Scholar] [CrossRef] [Green Version]
- Rehschuh, R.; Mette, T.; Menzel, A.; Buras, A. Soil properties affect the drought susceptibility of Norway spruce. Dendrochronologia 2017, 45, 81–89. [Google Scholar] [CrossRef]
- Trumbore, S.; Brando, P.; Hartmann, H. Forest health and global change. Science 2015, 349, 814–818. [Google Scholar] [CrossRef] [Green Version]
- Prabhakar, M.; Prasad, Y.G.; Rao, M.N. Remote sensing of biotic stress in crop plants and its applications for pest management. In Crop Stress and Its Management: Perspectives and Strategies; Venkateswarlu, B., Shanker, A.K., Shanker, C., Maheswari, M., Eds.; Springer: New York, NY, USA, 2012; pp. 517–549. [Google Scholar]
- Eitel, J.U.H.; Vierling, L.A.; Litvak, M.E.; Long, D.S.; Schulthess, U.; Ager, A.A.; Krofcheck, D.J.; Stoscheck, L. Broadband, red-edge information from satellites improves early stress detection in a New Mexico conifer woodland. Remote Sens. Environ. 2011, 115, 3640–3646. [Google Scholar] [CrossRef]
- Lausch, A.; Borg, E.; Bumberger, J.; Dietrich, P.; Heurich, M.; Huth, A.; Jung, A.; Klenke, R.A.; Knapp, S.; Mollenhauer, H.; et al. Understanding forest health with remote sensing, part III: Requirements for a scalable multi-source forest health monitoring network based on data science approaches. Remote Sens. 2018, 10, 1120. [Google Scholar] [CrossRef] [Green Version]
- Malenovský, Z.; Homolová, L.; Zurita-Milla, R.; Lukeš, P.; Kaplan, V.; Hanuš, J.; Gastellu-Etchegorry, J.-P.; Schaepman, M.E. Retrieval of spruce leaf chlorophyll content from airborne image data using continuum removal and radiative transfer. Remote Sens. Environ. 2013, 131, 85–102. [Google Scholar] [CrossRef] [Green Version]
- Leuzinger, S.; Zotz, G.; Asshoff, R.; Korner, C. Responses of deciduous forest trees to severe drought in Central Europe. Tree Physiol. 2005, 25, 641–650. [Google Scholar] [CrossRef] [Green Version]
- Carter, G.A.; Knapp, A.K. Leaf optical properties in higher plants: Linking spectral characteristics to stress and chlorophyll concentration. Am. J. Bot. 2001, 88, 677–684. [Google Scholar] [CrossRef] [PubMed] [Green Version]
- Bigras, F.J. Photosynthetic response of white spruce families to drought stress. New For. 2005, 29, 135–148. [Google Scholar] [CrossRef]
- Tsimilli-Michael, M. Revisiting JIP-test: An educative review on concepts, assumptions, approximations, definitions and terminology. Photosynthetica 2020, 58, 275–292. [Google Scholar] [CrossRef] [Green Version]
- Kaur, G.; Asthir, B. Molecular responses to drought stress in plants. Biol. Plant. 2017, 61, 201–209. [Google Scholar] [CrossRef]
- Fang, Y.; Xiong, L. General mechanisms of drought response and their application in drought resistance improvement in plants. Cell. Mol. Life Sci. 2015, 72, 673–689. [Google Scholar] [CrossRef]
- Shanker, A.K.; Maheswari, M.; Yadav, S.K.; Desai, S.; Bhanu, D.; Attal, N.B.; Venkateswarlu, B. Drought stress responses in crops. Funct. Integr. Genomics. 2014, 14, 11–22. [Google Scholar] [CrossRef] [PubMed]
- Rao, D.E.; Chaitanya, K.V. Photosynthesis and antioxidative defense mechanisms in deciphering drought stress tolerance of crop plants. Biol. Plant. 2016, 60, 201–218. [Google Scholar] [CrossRef]
- Chaves, M.M.; Flexas, J.; Pinheiro, C. Photosynthesis under drought and salt stress: Regulation mechanisms from whole plant to cell. Ann. Bot. 2009, 103, 551–560. [Google Scholar] [CrossRef] [Green Version]
- Flexas, J.; Gallé, A.; Galmée, J.; Ribas-Carbo, M.; Medrano, H. The response of photosynthesis to soil water stress. In Plant Responses to Drought Stress; Aroca, R., Ed.; Springer: Berlin/Heidelberg, Germany, 2012; pp. 129–144. [Google Scholar]
- Kalaji, H.M.; Carpentier, R.; Allakhverdiev, S.I.; Bosa, K. Fluorescence parameters as early indicators of light stress in barley. J. Photochem. Photobiol. B Biol. 2012, 112, 1–6. [Google Scholar] [CrossRef]
- Badr, A.; Brüggemann, W. Comparative analysis of drought stress response of maize genotypes using chlorophyll fluorescence measurements and leaf relative water content. Photosynthetica 2020, 58, 638–645. [Google Scholar] [CrossRef] [Green Version]
- Harris, I.P.; Jones, P.D.; Osborn, T.J.; Lister, D.H. Updated high-resolution grids of monthly climatic observations—The CRU TS3. 10 Dataset. Int. J. Climatol. 2014, 34, 623–642. [Google Scholar] [CrossRef] [Green Version]
- Bušs, K. Basis of Forest Classification in SSR of Latvia. Latvijas PSR Meža Klasifikācijas Pamati; LRZTIPI: Riga, Latvia, 1976; p. 24. (In Latvian) [Google Scholar]
- Stirbet, A.; Govindjee. On the relation between the Kautsky effect (chlorophyll a fluorescence induction) and Photosystem II: Basics and applications of the OJIP fluorescence transient. J. Photochem. Photobiol. B Biol. 2011, 104, 236–257. [Google Scholar] [CrossRef] [PubMed]
- Pommerening, A.; Muszta, A. Methods of modelling relative growth rate. For. Ecosyst. 2015, 2, N5. [Google Scholar] [CrossRef] [Green Version]
- R Core Team R: A Language and Environment for Statistical Computing; R Foundation for Statistical Computing: Vienna, Austria, 2020; Available online: https://www.R-project.org/ (accessed on 20 December 2020).
- Bates, D.; Maechler, M.; Bolker, B.; Walker, S. Fitting Linear Mixed-Effects Models Using lme4. J. Stat. Softw. 2015, 67, 1–48. [Google Scholar] [CrossRef]
- Piedallu, C.; Gégout, J.C.; Bruand, A.; Seynave, I. Mapping soil water holding capacity over large areas to predict potential production of forest stands. Geoderma 2011, 160, 355–366. [Google Scholar] [CrossRef] [Green Version]
- Weemstra, M.; Eilmann, B.; Sass-Klaassen, U.G.; Sterck, F.J. Summer droughts limit tree growth across temperate species on a productive forest site. For. Ecol. Manag. 2013, 306, 142–149. [Google Scholar] [CrossRef]
- Yang, H.; Yuan, Y.; Zhang, Q.; Tang, J.; Liu, Y.; Chen, X. Changes in soil organic carbon, total nitrogen, and abundance of arbuscular mycorrhizal fungi along a large-scale aridity gradient. Catena 2011, 87, 70–77. [Google Scholar] [CrossRef]
- Oehl, F.; Laczko, E.; Bogenrieder, A.; Stahr, K.; Bösch, R.; van der Heijden, M.; Sieverding, E. Soil type and land use intensity determine the composition of arbuscular mycorrhizal fungal communities. Soil Biol. Biochem. 2010, 42, 724–738. [Google Scholar] [CrossRef]
- Tollefsrud, M.M.; Kissling, R.; Gugerli, F.; Johnsen, Ø.; Skrøppa, T.; Cheddadi, R.; Van Der Knaap, W.O.; Latałowa, M.; Terhürne-Berson, R.; Litt, T.; et al. Genetic consequences of glacial survival and postglacial colonization in Norway spruce: Combined analysis of mitochondrial DNA and fossil pollen. Mol. Ecol. 2008, 17, 4134–4150. [Google Scholar] [CrossRef]
- Skrøppa, T.; Tollefsrud, M.M.; Sperisen, C.; Johnsen, Ø. Rapid change in adaptive performance from one generation to the next in Picea abies—Central European trees in a Nordic environment. Tree Genet. Genomes 2010, 6, 93–99. [Google Scholar] [CrossRef]
- Pukacki, P.M.; Kamińska-Rożek, E. Effect of drought stress on chlorophyll a fluorescence and electrical admittance of shoots in Norway spruce seedlings. Trees 2005, 19, 539–544. [Google Scholar] [CrossRef]
- Anderson, J.M.; Chow, W.S.; Park, Y.I. The grand design of photosynthesis: Acclimation of the photosynthetic apparatus to environmental cues. Photosyn. Res. 1995, 46, 129–139. [Google Scholar] [CrossRef] [PubMed]
- Iivonen, S.; Kaakinen, S.; Jolkkonen, A.; Vapaavuori, E.; Linder, S. Influence of long-term nutrient optimization on biomass, carbon, and nitrogen acquisition and allocation in Norway spruce. Can. J. For. Res. 2006, 36, 1563–1571. [Google Scholar] [CrossRef]


| Oligotrophic | Mesotrophic | Peat | |
|---|---|---|---|
| Parent material | Sand | Silty sand | Organic |
| Reaction, pH | 6.64 ± 0.13 | 6.48 ± 0.09 | 2.74 ± 0.05 |
| N total., g kg−1 | 0.07 ± 0.04 | 0.86 ± 0.09 | 18.51 ± 1.24 |
| C total., g kg−1 | 1.16 ± 0.10 | 8.86 ± 1.3 | 499.33 ± 15.95 |
| C/N ratio | - | 8.67 ± 1.36 | 27.08 ± 2.35 |
| S, mg kg−1 | - | 12.32 ± 11.18 | 2510.09 ± 348.31 |
| P, mg kg−1 | 167.41 ± 4.07 | 254.13 ± 11.4 | 4.58 ± 2.65 |
| K, mg kg−1 | 14.33 ± 2.67 | 71.6 ± 3.71 | 71.93 ± 15.83 |
| Mg, g kg−1 | 0.52 ± 0.02 | 0.99 ± 0.32 | 0.55 ± 0.06 |
| Ca, g kg−1 | 4.15 ± 0.25 | 6.3 ± 2.32 | 9.01 ± 0.84 |
| Fe, g kg−1 | 0.13 ± 0.01 | 0.64 ± 0.01 | 0.55 ± 0.04 |
| Mn, mg kg−1 | 32.06 ± 2.41 | 121.42 ± 10.25 | 19.4 ± 3.41 |
| Zn, mg kg−1 | 1.06 ± 0.28 | 3.46 ± 1.02 | 9.06 ± 3.06 |
| Cu, mg kg−1 | 1.00 ± 0.38 | 3.71 ± 0.57 | 4.04 ± 1.11 |
| Sum of Squares | df | F-Value | p-Value | |
|---|---|---|---|---|
| Soil type | 0.177 | 3 | 9.7 | <0.001 |
| Irrigation intensity | 0.109 | 1 | 18.0 | <0.001 |
| Soil type by irrigation intensity interaction | 0.040 | 2 | 3.4 | 0.04 |
| Residuals | 4.174 | 686 |
| Degree of Freedom | Sum of Squares | F-Value | p-Value | |
|---|---|---|---|---|
| Asymptote parameter (α) | ||||
| Soil type | 2 | 1.25·10−6 | 1.88 | 0.21 |
| Irrigation intensity | 4 | 3.05·10−6 | 2.29 | 0.15 |
| Residual | 8 | 2.67·10−6 | ||
| Displacement (lag) parameter (β) | ||||
| Soil type | 2 | 4.73·10−6 | 3.48 | 0.08 |
| Irrigation intensity | 4 | 1.69·10−5 | 6.21 | 0.01 |
| Residual | 8 | 5.43·10−6 | ||
| Growth rate parameter (k) | ||||
| Soil type | 2 | 4.17·10−7 | 4.33 | 0.048 |
| Irrigation intensity | 4 | 1.35·10−6 | 7.01 | <0.01 |
| Residual | 8 | 3.85·10−7 | ||
| Relative Growth Rate | Performance Index | Fv/F0 | Chlorophyll Concentration (Chl) | |
|---|---|---|---|---|
| Fixed Effects (χ2 Values) | ||||
| Soil type (df = 2) | 5.31 | 306.2 *** | 189.9 *** | 299.1 *** |
| Irrigation intensity (df = 4) | 1.71 | 31.6 *** | 63.5 *** | 65.8 *** |
| Temperature (df = 1) | - | 6.02 * | 48.1 *** | 20.9 *** |
| Vapour pressure deficit (df = 1) | 385.4 *** | 0.1 | 11.0 *** | 9.1 ** |
| Soil water potential (df = 1) | 5.7 * | 6.3 * | 6.7 ** | 31.8 *** |
| Soil type by irrigation intensity interaction (df = 8) | 10.9 ** | 50.3 *** | 115.4 *** | 80.7 *** |
| Time (week of growth) (df = 1) | 289.4 *** | 148.6 *** | 289.8 *** | 226.1 *** |
| Random effects (variance) | ||||
| Tree | 0.20 | 14.61 | 0.47 | 27.14 |
| Residual | 5.72 | 18.55 | 0.13 | 15.18 |
| Model performance | ||||
| Conditional pseudo-R2 | 0.63 | 0.59 | 0.86 | 0.77 |
| Marginal pseudo-R2 | 0.62 | 0.34 | 0.53 | 0.47 |
| Model significance (likelihood ratio, p-value) | <0.001 | <0.001 | <0.001 | <0.001 |
Publisher’s Note: MDPI stays neutral with regard to jurisdictional claims in published maps and institutional affiliations. |
© 2021 by the authors. Licensee MDPI, Basel, Switzerland. This article is an open access article distributed under the terms and conditions of the Creative Commons Attribution (CC BY) license (http://creativecommons.org/licenses/by/4.0/).
Share and Cite
Matisons, R.; Krišāns, O.; Jansons, Ā.; Kondratovičs, T.; Elferts, D.; Ievinsh, G. Norway Spruce Seedlings from an Eastern Baltic Provenance Show Tolerance to Simulated Drought. Forests 2021, 12, 82. https://0-doi-org.brum.beds.ac.uk/10.3390/f12010082
Matisons R, Krišāns O, Jansons Ā, Kondratovičs T, Elferts D, Ievinsh G. Norway Spruce Seedlings from an Eastern Baltic Provenance Show Tolerance to Simulated Drought. Forests. 2021; 12(1):82. https://0-doi-org.brum.beds.ac.uk/10.3390/f12010082
Chicago/Turabian StyleMatisons, Roberts, Oskars Krišāns, Āris Jansons, Toms Kondratovičs, Didzis Elferts, and Gederts Ievinsh. 2021. "Norway Spruce Seedlings from an Eastern Baltic Provenance Show Tolerance to Simulated Drought" Forests 12, no. 1: 82. https://0-doi-org.brum.beds.ac.uk/10.3390/f12010082