Functional Ecology of Forest, Heath, and Shrub Savannah Alternate States in Eastern Canada


Department of Biology, Lakehead University, Thunder Bay, ON P7B 5E1, Canada
*
Author to whom correspondence should be addressed.
Forests 2021, 12(1), 93; https://0-doi-org.brum.beds.ac.uk/10.3390/f12010093
Submission received: 3 December 2020
/
Revised: 11 January 2021
/
Accepted: 13 January 2021
/
Published: 16 January 2021
(This article belongs to the Section Forest Ecology and Management)
Abstract
:In eastern Canada, alternation of wildfire regime due to fire suppression creates alternate vegetation states converting black spruce forest to heath and shrub savannah (SS). We compared the taxonomic diversity (TD) and functional diversity (FD) of post-fire forest, heath, and SS alternate states to determine if community FD can explain their persistence. We hypothesized that (i) species diversity (TD and FD) would be the highest in forest followed by SS and heath due to decreased interspecific competition and niche differentiation, (ii) differences between TD and FD indices would be greater in communities with high TD in forest due to high trait differentiation and richness, and (iii) changes in community trait values would indicate niche limitations and resource availability. We conducted this study in Terra Nova National Park, Newfoundland, Canada. We calculated functional dispersion (alpha FD), functional pairwise dissimilarity (beta FD), Shannon’s diversity (alpha TD), and Bray–Curtis dissimilarity (beta TD) from species cover. We used five functional traits (specific root length, specific leaf area, leaf dry matter content, height, and seed mass) related to nutrient acquisition, productivity, and growth. We found lower beta diversity in forest than heath and SS; forest also had higher species diversity and greater breadth in niche space utilization. SS was functionally similar to heath but lower than forest in functional dispersion and functional divergence. It had the highest functional richness and evenness. There was no difference in functional evenness between forest and heath. Functional beta diversity was the highest in forest, and did not differ between heath and SS. Resource acquisition and availability was the greatest in forest and the lowest in heath. We suspect that this might be due to forest having the highest functional trait turnover and niche utilization. We conclude that alternate vegetation states originating from alterations to the natural fire regime negatively impact ecosystem function.
1. Introduction
Alterations to the natural disturbance regime of a region can compromise ecosystem resilience and create alternate vegetation sates [1,2]. Post-fire alternate vegetation states may have distinct vegetation structures and functions that differ from the pre-fire community [3]. The severity and frequency of forest fires have powerful effects on the colonizing species and alter ecosystem dynamics [4]. Persistence of these effects may result in communities that support less species diversity, with negative implications for community stability and productivity [5]. Persistence of alternate vegetation states is often facilitated by environmental filters that interact with the species present and influence their establishment [6]. Strong abiotic filters in a system may select for specific “response traits” that flourish in a narrow range of conditions [7], or strong biotic filters may prevent the establishment of competing species in a community, creating what is often called “effect traits” [8]. Biotic and abiotic filters produce stabilizing effects and reinforce the alternate state [9].
Taxonomic diversity has been shown to predict resource availability to plants [10]. However, measuring taxonomic diversity alone ignores the differences in niche utilization. Niche utilization refers to the traits such as specific root length for nutrient acquisition, height for light acquisition, and seed mass for the dispersal and longevity of the plant’s seed. It has been argued that taxonomic diversity inaccurately represents changes in system productivity [11]. Consequently, while taxonomic diversity can predict system productivity to a degree, it may misrepresent the community’s niche space utilization.
Functional diversity is another measure of diversity that utilizes functional traits of individuals to accurately capture the similarity of species in a community by quantifying niche utilization. The quantification of niche utilization is a product of plant trait distribution in the multidimensional functional space of a community signifying differences in trait values. By measuring the distribution of plant traits into niches, one can determine whether or not communities are composed of generalists (from trait convergence) or specialists (from trait divergence); the latter produces more productive plant communities than the former [12]. Thus, functional diversity captures system health and productivity more accurately than taxonomic diversity. Functional diversity can measure differences in the dominant trait values of plants associated with communities and explains changes in system function via the mass ratio hypothesis; the traits of dominant species have a greater impact on ecosystem processes than sub-dominant species [13]. Hence, when a disturbance alters a community to select specific traits (response traits) that confer species with the ability to dominate in the changed environmental conditions, then the ecosystems processes are altered [14].
In eastern Canada, three distinct plant communities (forest, heath, and shrub savannah) may persist as alternate states. Residual organic matter (ROM) following fire has been shown to be the primary filter to convert forest to heath; thin ROM (<2 cm) selects for forest, while thick ROM (>2 cm) selects for heath [15] vegetation. High-severity fires kill belowground plant propagules by consuming rhizomes and vegetative buds [16] and favor seed regenerating species, primarily black spruce (Picea mariana (Mill.) B.S.P). Low-severity fires retain thick ROM, which protects the regenerating organs of the dominant ericaceous understory shrub, Kalmia angustifolia (henceforth referred to as Kalmia). shrub savannah originates from high- and low-severity fires [15], or compound disturbances, such as insect defoliation followed by fire [17]. The shrub savannah community is spatially discontinuous with, primarily vegetatively regenerating, black spruce islands surrounded by Kalmia-dominated open heath. The taxonomic and functional consequences of forest converting to heath following fire have been described [18], but that of the shrub savannah state of vegetation remains unexplored. Repeated canopy-removing disturbances, such as fire and insect defoliation, can convert closed-canopy boreal forest into shrub savannah (also called lichen woodland) [19]. It has been suggested that future climate change-related increases in wildfires may convert large tracts of closed-canopy boreal forests into lichen woodland, so much so that within 550 years the entire boreal forest may be replaced by lichen woodland or shrub savannah [19]. Hence, the study of the functional ecology of shrub savannah as an alternate vegetation state is critical, and determining the changes in community taxonomic and functional diversity associated with the alterations of natural disturbance regime (wildfire) is a first step.
The objectives of this study were to compare (i) the taxonomic diversity (TD) and functional diversity (FD) of post-fire forest, heath, and shrub savannah alternate states and (ii) determine if community FD can explain their long-term persistence. We hypothesized that (i) species diversity (TD and FD) would be highest in forest followed by shrub savannah and heath due to decreased interspecific competition, requiring differing degrees of niche differentiation, (ii) differences between the taxonomic and functional diversity indices would be greater in post-fire communities with high taxonomic diversity (i.e., forest) due to the asymptotic relationship of trait differentiation and species richness, and (iii) changes in community level mean trait values would indicate current niche limitations and resource availability.
2. Methods
2.1. Study Site
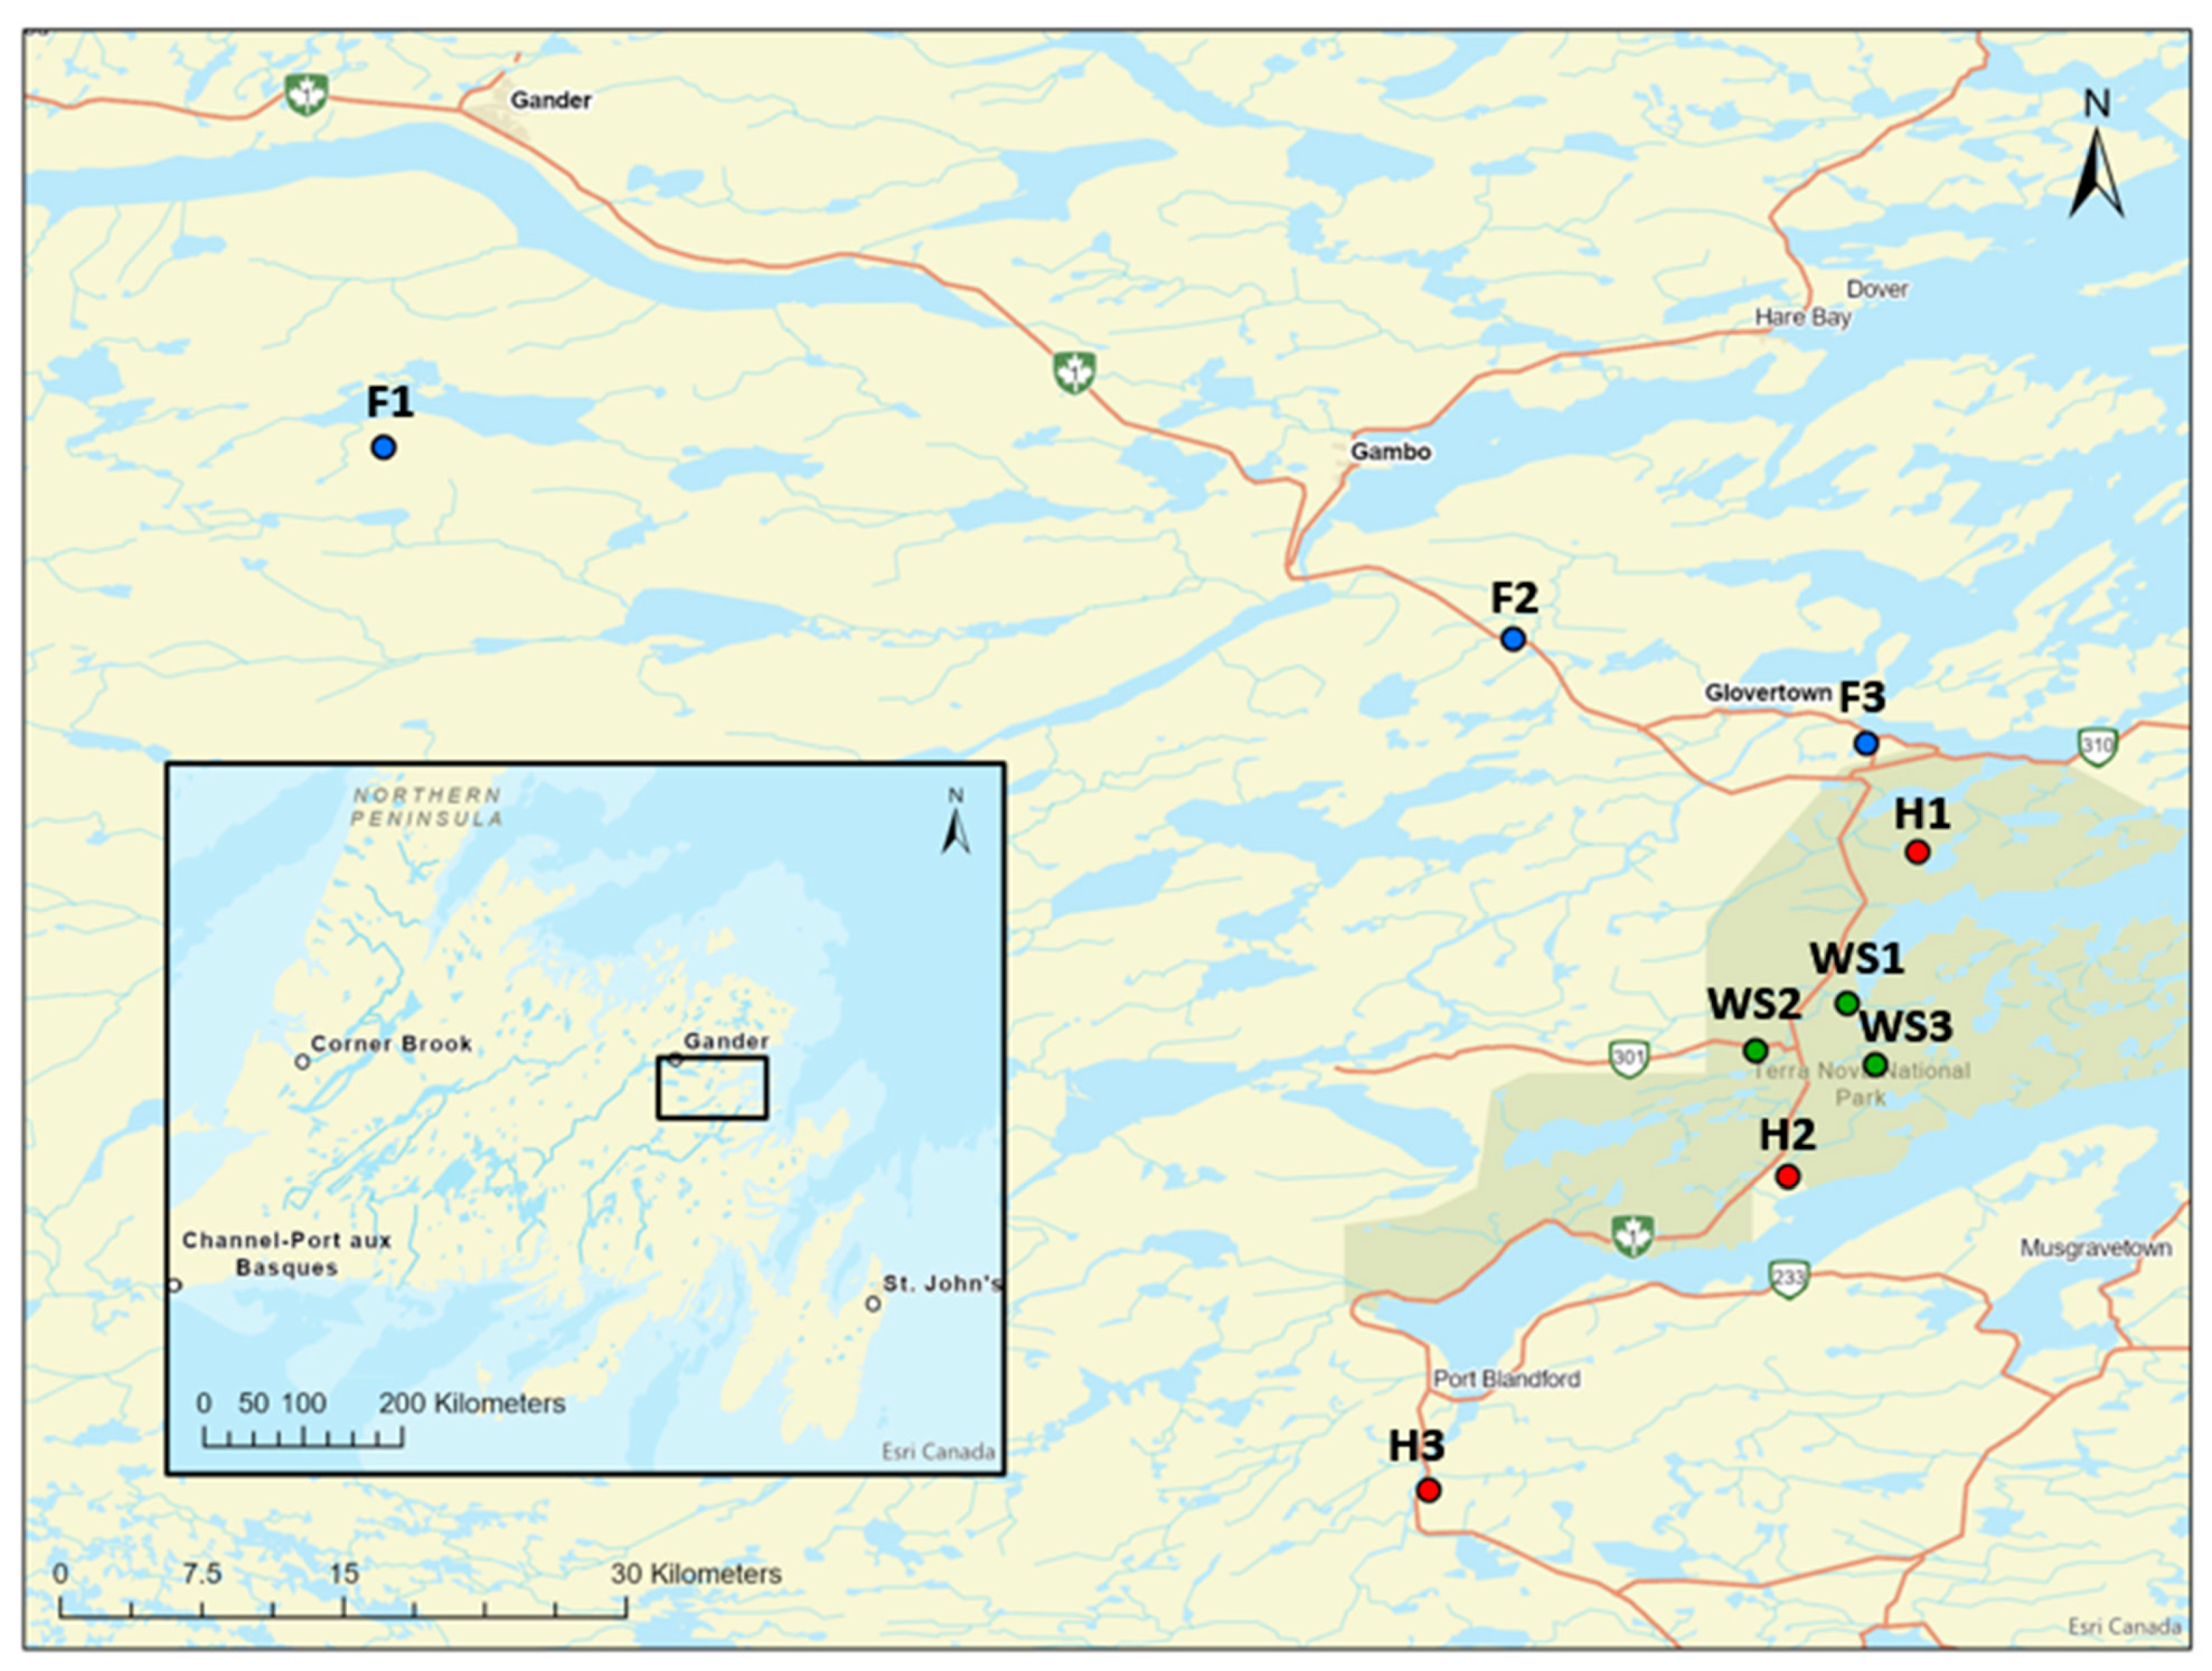
The study was conducted in Terra Nova National Park, Newfoundland, Canada (48°31′33″ N, 53°57′58.4″ W). Although this region is in the boreal ecozone, the topography and surrounding cold ocean causes irregular patterns of vegetation compared to the boreal region of the adjacent land to the west [20]. The region receives 1801–1200 mm precipitation (~30% as snow) and has mean summer and winter temperatures of 13 and −5 °C, respectively [21]. The region has three distinct terrestrial community states: forest, heath, and shrub savannah. Forest has high stem densities of trees forming a predominantly closed canopy consisting of Abies balsamea, Acer rubrum, Betula papyrifera, Larix laricina, Picea mariana, Sorbus americana, Prunus spp., and Populus tremuloides. This canopy is underlain by a variety of ericaceous shrubs such as Kalmia angustifolia, Rhododendron groenlandicum, Vaccinium angustifolium, V. myrtilloides, V. uliginosum, and Rubus idaeus and herbs such as Maianthemum canadense, Cornus canadensis, Clintonia borealis, and Carex spp., with acrocarpous and pleurocarpous mosses on the ground level. Heath is predominantly open canopy communities dominated by ericaceous species such as Kalmia angustifolia, Rhododendron groenlandicum, Vaccinium angustifolium, and Rhododendron canadense. Other herbs and shrubs, such as Ilex mucronata, Cornus canadensis, Amelanchier interior, Vaccinium vitis-idaea, and Viburnum cassinoides, are common but in low abundances. The ground is sparsely inhabited by lichens (Cladonia uncialis, C. mitis) and Dicranum spp. and Polytrichum spp. mosses. The shrub savannah has two distinct components. The interspersed tree islands consist primarily of Picea mariana with discrete Larix laricina in low abundances. Within these islands, there are pleurocarpous mosses and a few herbs such as Cornus canadensis, Trientalis borealis, and Maianthemum canadense. The second, and more widespread, open canopy component of shrub savannah is dominated by Kalmia angustifolia, Rhododendron canadense, Vaccinium angustifolium, and Cladonia stellaris. Three sites were selected in each post-fire community based on a similar amount of time since the last fire disturbance (heath: 24–30 years since fire; forest: 12–44 years since fire) [22], with the exception of shrub savannah, because the specific time since fire was unknown but presumed to be >100 years based on several tree cores (Figure 1).
2.2. Study Design and Sampling Protocol
Three 50 × 10 m belt transects were placed in each of the sites. The starting positions of the belt transects were determined by randomly selecting coordinates then placing the belt transects along a north–south gradient. Each 50 × 10 m transect consisted of five continuous 10 × 10 m quadrats. Additionally, five 1 × 1 m quadrats were nested within each 10 × 10 m quadrat. Four of the five 1 × 1 m quadrats were placed 0.5 m from the 10 × 10 m quadrat edges, and one 1 × 1 m quadrat was placed in the center of each 10 × 10 m quadrat. Tree abundance was determined within the 10 × 10 m quadrats and represented by basal area percent coverage. The percent coverage of tree basal area for each species was determined by taking a total area occupied by a species basal area divided by the total area of the plot. Herb and shrub percent cover was collected by ocular assessment within the 1 × 1 m quadrats and averaged among the five nested quadrats within the 10 × 10 m quadrats. The sampling method was repeated in three replicates in each site and three sites per plant community of each vegetation state (forest, heath, shrub savannah). One of the forest sites was restricted to two 50 × 10 m belt transects due to the unavailability of a third appropriate study site (Table 1).
2.3. Plant Trait Matrix
The plant trait matrix was based on the 25 most abundant species consisting of >90% of the total cover on the sites. Functional traits were determined for each of these 25 species. The traits considered were specific leaf area (SLA), leaf dry matter content (LDMC), specific root length (SRL), seed size, and height (Appendix A, Table A1). SLA strongly and positively correlates with foliar nutrient concentration, particularly with N and P [24]. LDMC represents aboveground productivity and specifically indicates the conversion rates of CO2 and H2O to dry matter [25]. LDMC also relates to resource availability and growth rate. Belowground, SRL is strongly correlated to soil fertility, meaning that species with higher SLA are adapted to habitats with fertile soils [26]. Height relates to light capture in plants, and it is also strongly positively correlated with seed dispersal [27]. Seed mass is a particularly important plant characteristic. Increasing seed mass relates to an increased germination rate, increased longevity, and less seed production [28].
2.4. Data Analysis
Alpha and beta functional diversity were represented by functional dispersion (FDis) and functional pairwise dissimilarity (Dpw), respectively. Alpha and beta taxonomic diversity were represented by Shannon’s diversity and Bray–Curtis dissimilarity, respectively. Additionally, community-weighted mean trait values were determined in order to quantify the relative dominance of species throughout communities and average trait values favored within communities. Correlations between alpha and beta diversity measures were computed with the ‘cor.test’ function of the R Stats Package [29]. The ‘dbFD’ function of the FD package [30] in R was used to calculate FDis and community-weighted mean. Functional pairwise dissimilarity was calculated using the ‘mpd’ function of the ‘picante’ package [31]. One discrepancy was identified between mathematical reality and ecological reality when calculating the functional space [15]. In situations where the number of species present in the functional trait matrix is less than the number of functional traits, the equations cannot yield a value for the five-dimensional space, despite having one or several species present. To calculate the functional composition of these anomalies, one standard deviation of the mean of the site was added to the non-applicable values in order to avoid representing low diversity values as zero diversity, as per [18]. Meanwhile, sites not containing any of the species in the functional trait matrix were represented as zero to maintain orthogonality in design and represent not only the lack of functional contribution but also the lack of functional diversity within certain communities. Shannon’s diversity was calculated using the ‘diversity’ function of the vegan package [32], and Bray–Curtis dissimilarity was calculated using the ‘vegdist’ function of the vegan package [33]. Comparisons of alpha and beta diversity between sites were conducted using a Dunn test of multiple comparisons with a Bonferroni approach with the ‘dunn.test’ r-package [34]. All statistical analyses were completed in R version 1.1.463 [29].
3. Results
3.1. Correlations between Functional and Taxonomic Diversity
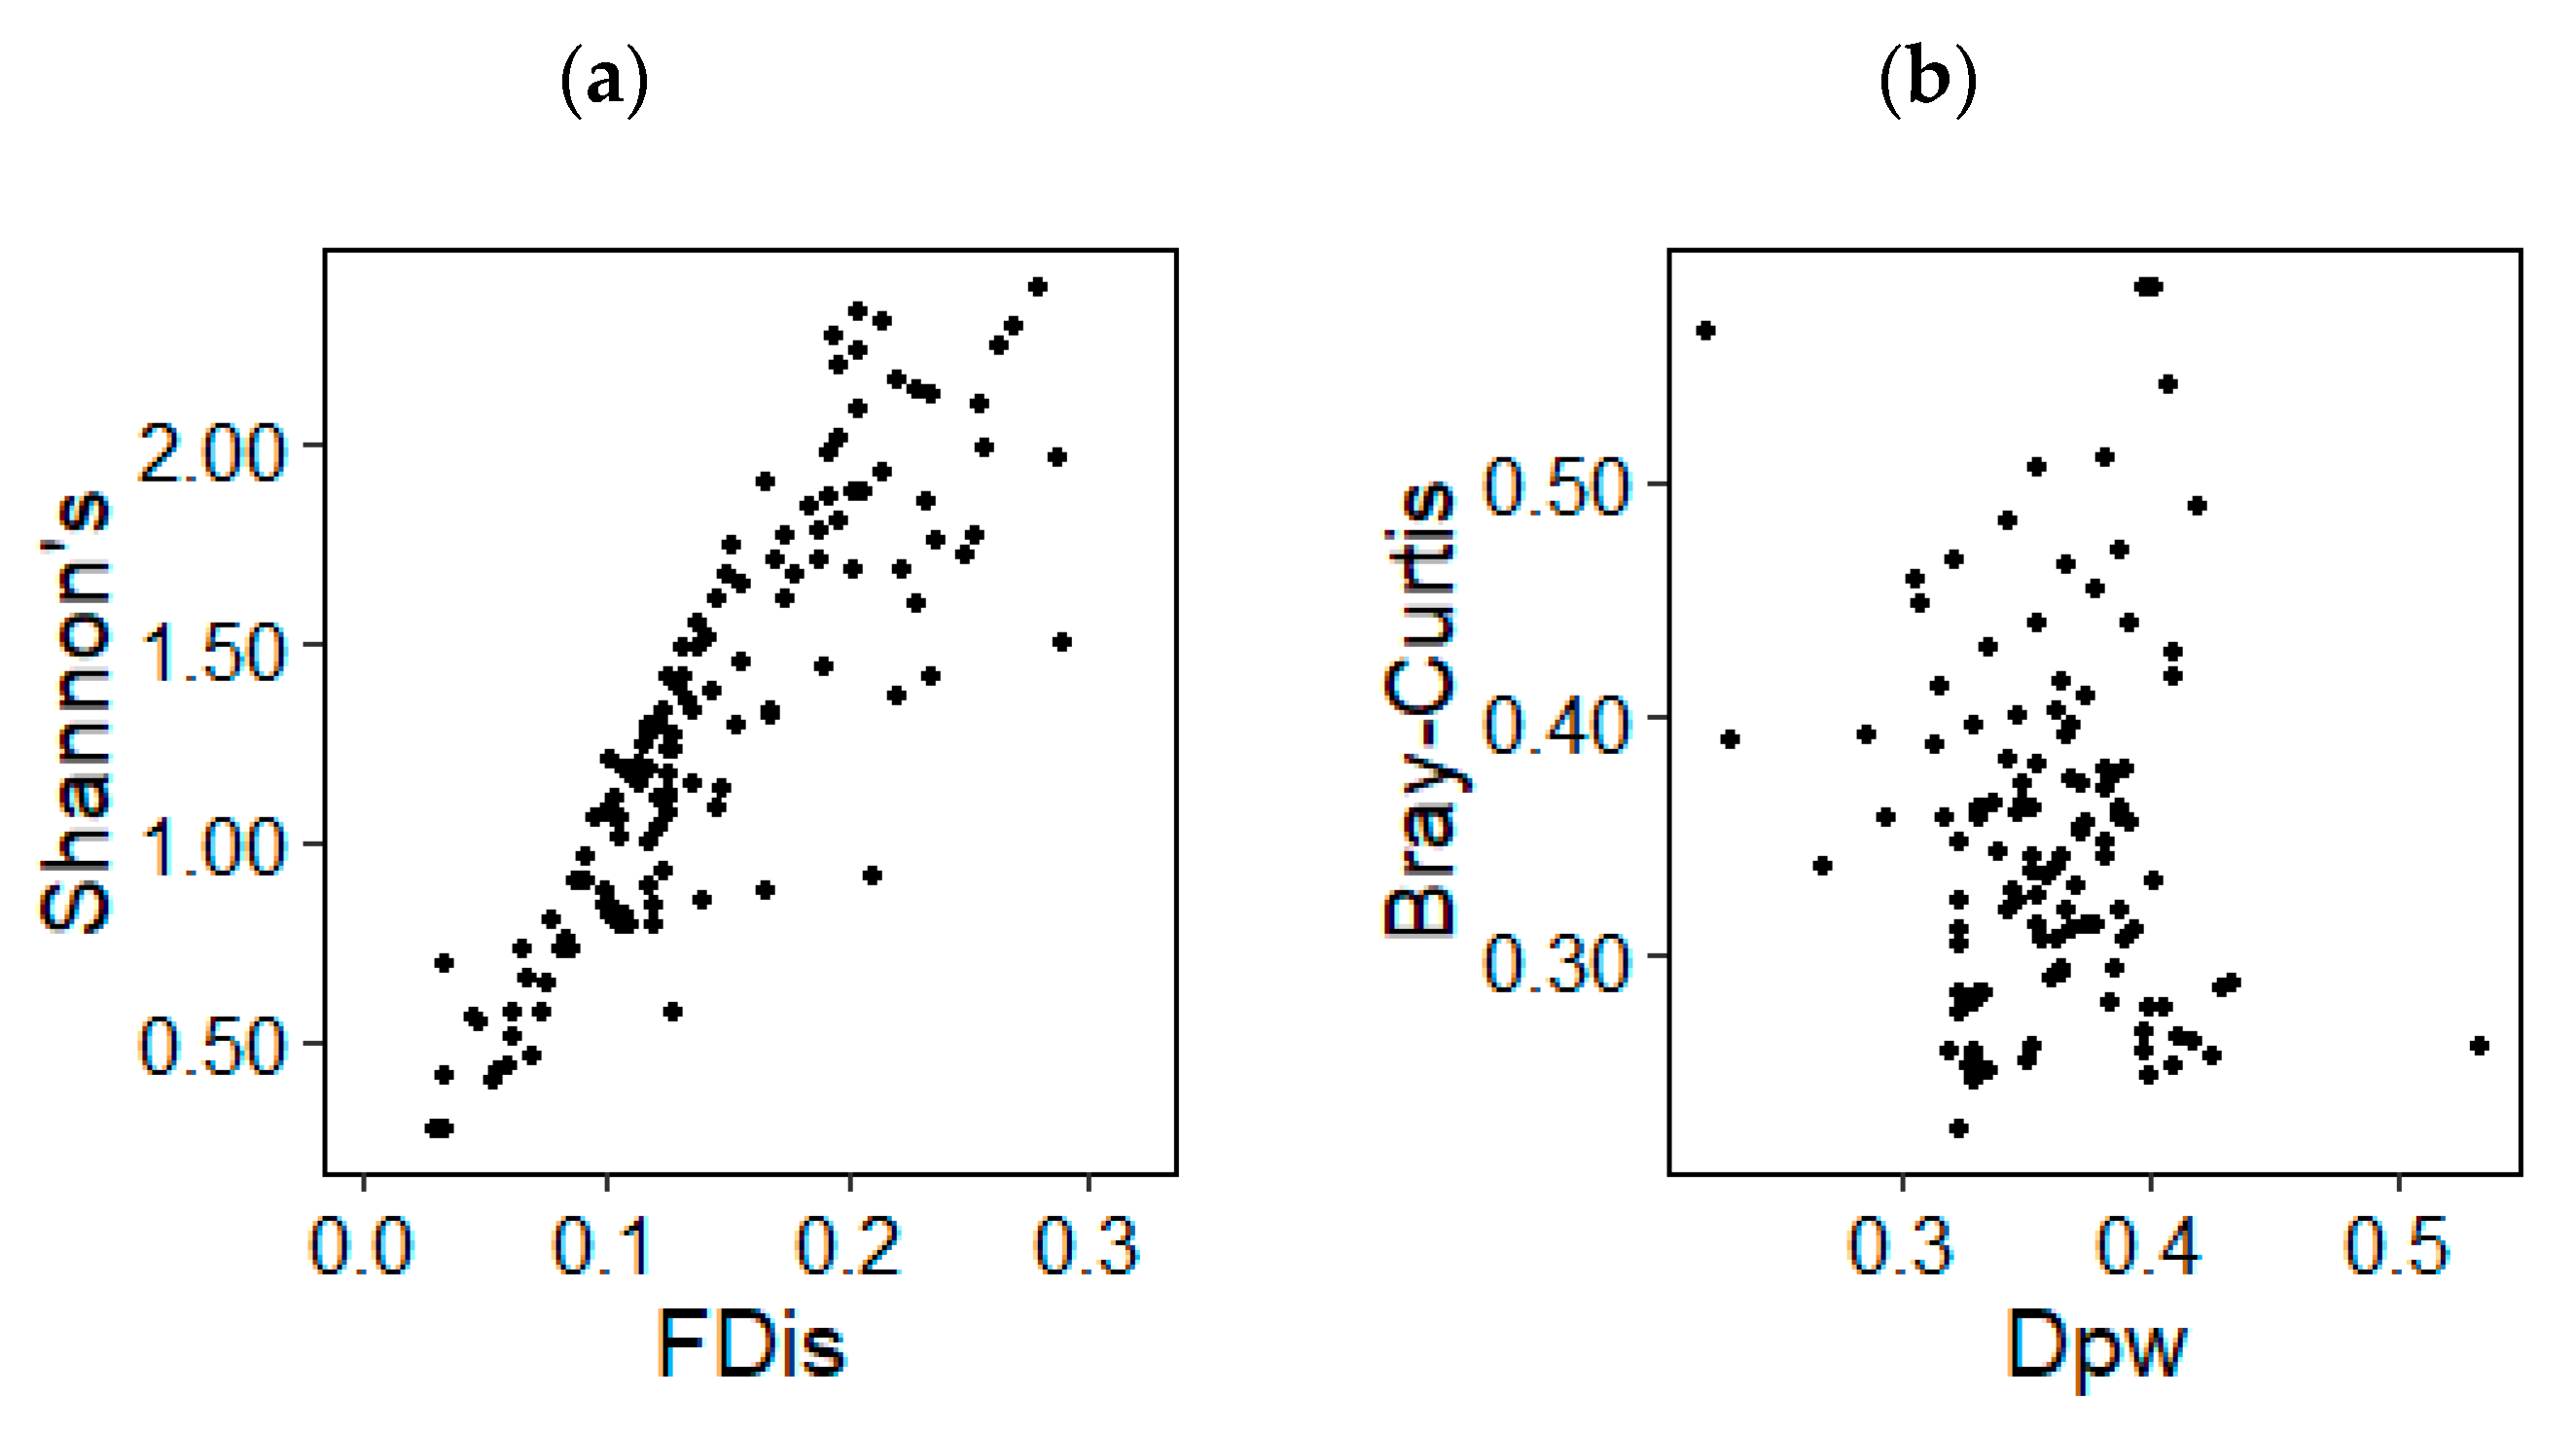
Functional and taxonomic alpha diversity showed a strong correlation between functional dispersion and Shannon’s diversity across all sites and life forms (Pearson’s correlation, r = 0.872, p < 0.001) (Figure 2a). Correlations between functional pairwise dissimilarity and Bray–Curtis taxonomic dissimilarity showed a weak and non-significant relationship between functional and taxonomic beta diversity (Pearson’s correlation, r = −0.117, p = 0.187) (Figure 2b).
3.2. Overall, Tree, Shrub, and Herb Diversity
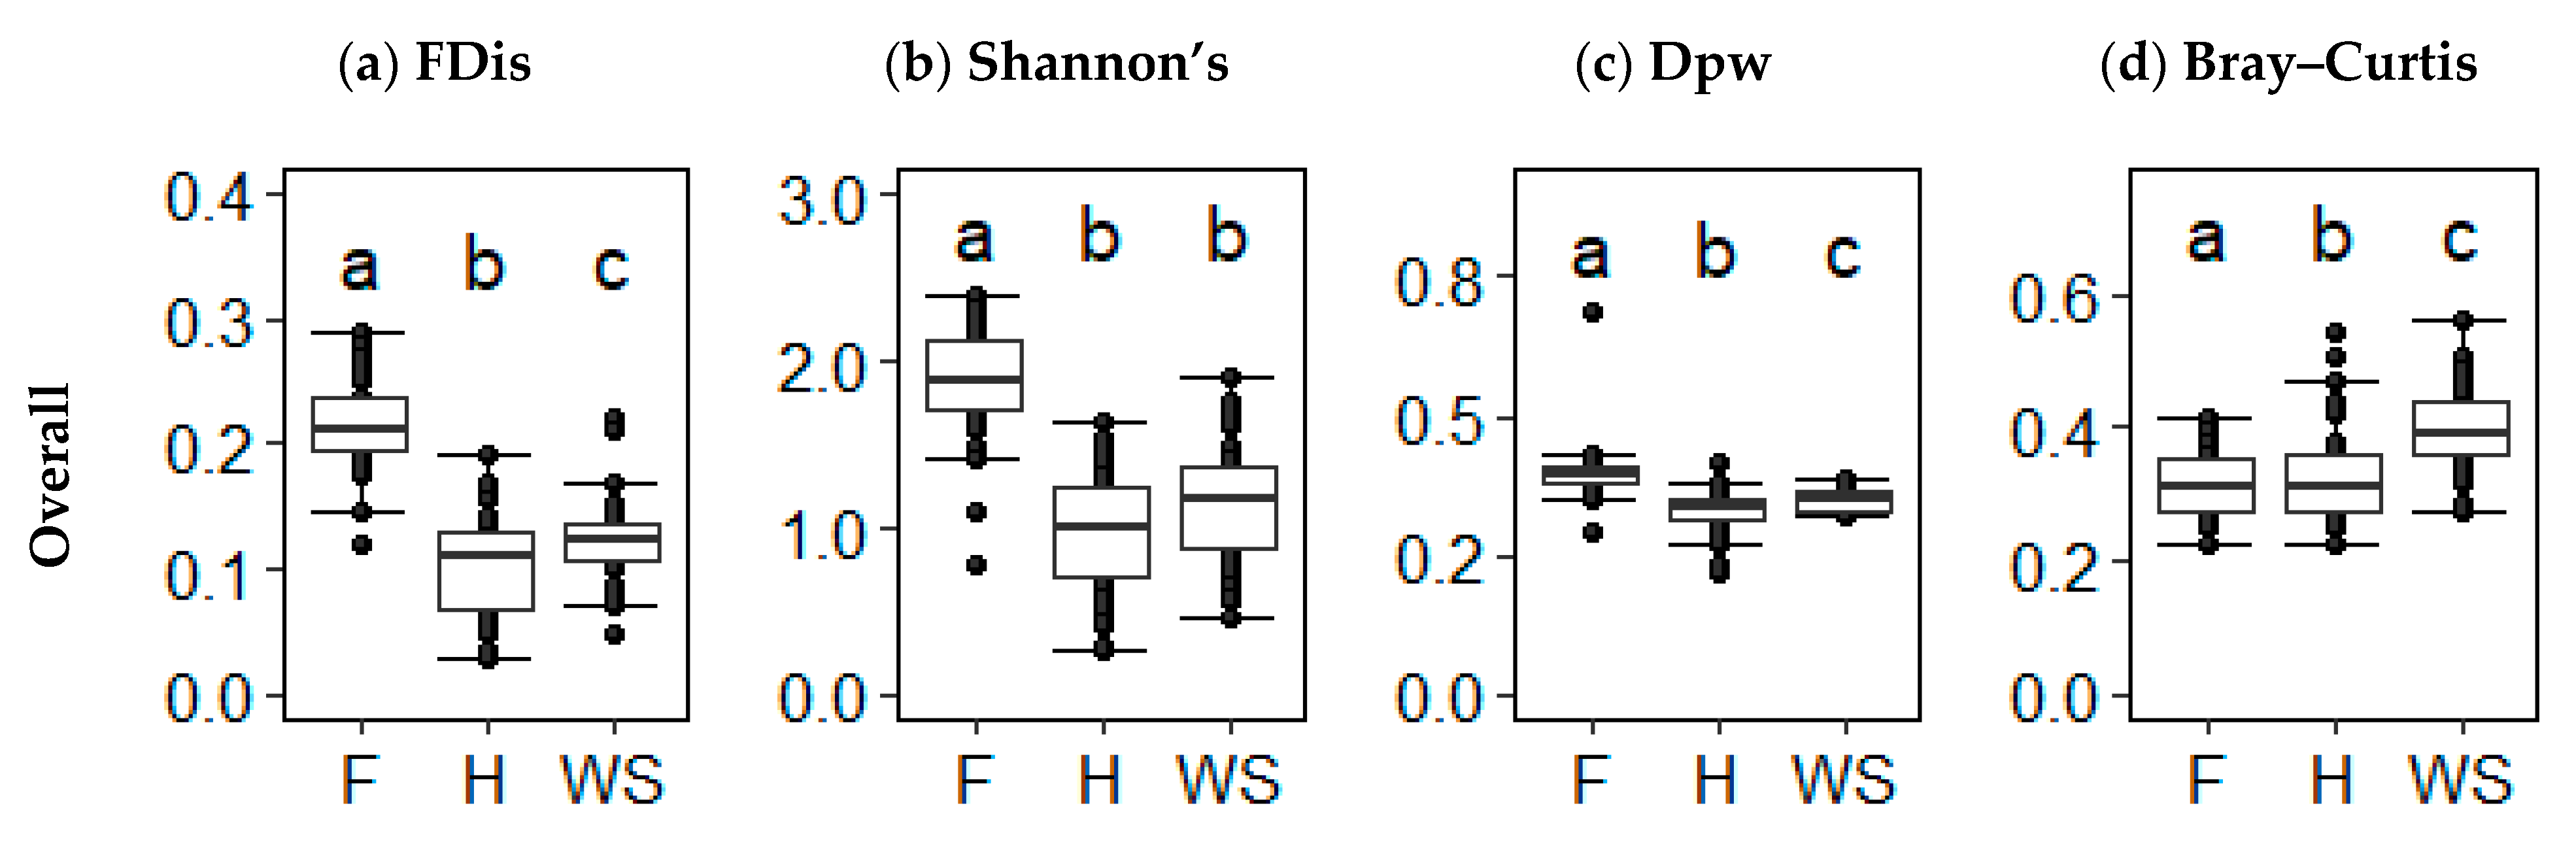
Forest displayed the highest diversity for all indices except beta TD when all life forms were analyzed. Overall alpha FD was significantly greater in forest than heath and shrub savannah (Kruskal–Wallis (KW), x = 8.096, p < 0.001; KW, x = 6.885, p < 0.001, respectively), while heath and shrub savannah did not differ (KW, x = −1.248, p = 0.318) (Figure 3a). A similar trend was observed within alpha TD, with forest surpassing both heath (KW, x = 8.014, p < 0.001) and shrub savannah (KW, x = 6.397, p < 0.001). No differences were observed between heath and shrub savannah (KW, x = −1.666, p = 0.144) (Figure 3b). Overall beta FD and beta TD showed different hierarchical trends among the three vegetation states and differed from each of the alpha diversity analogues. Similar to overall alpha FD, forest had higher overall beta FD than heath (KW, x = 7.931, p < 0.001) and shrub savannah (KW, x = 5.727, p < 0.001). However, unlike alpha FD, shrub savannah had significantly higher beta FD than heath (KW, x = −2.272, p = 0.035) (Figure 3c). Heath had greater overall beta TD than forest (KW, x = −3.581, p < 0.001) and shrub savannah (KW, x = 2.204, p = 0.041), followed by forest, which had higher overall beta TD than shrub savannah (KW, x = 5.963, p < 0.001) (Figure 3d).
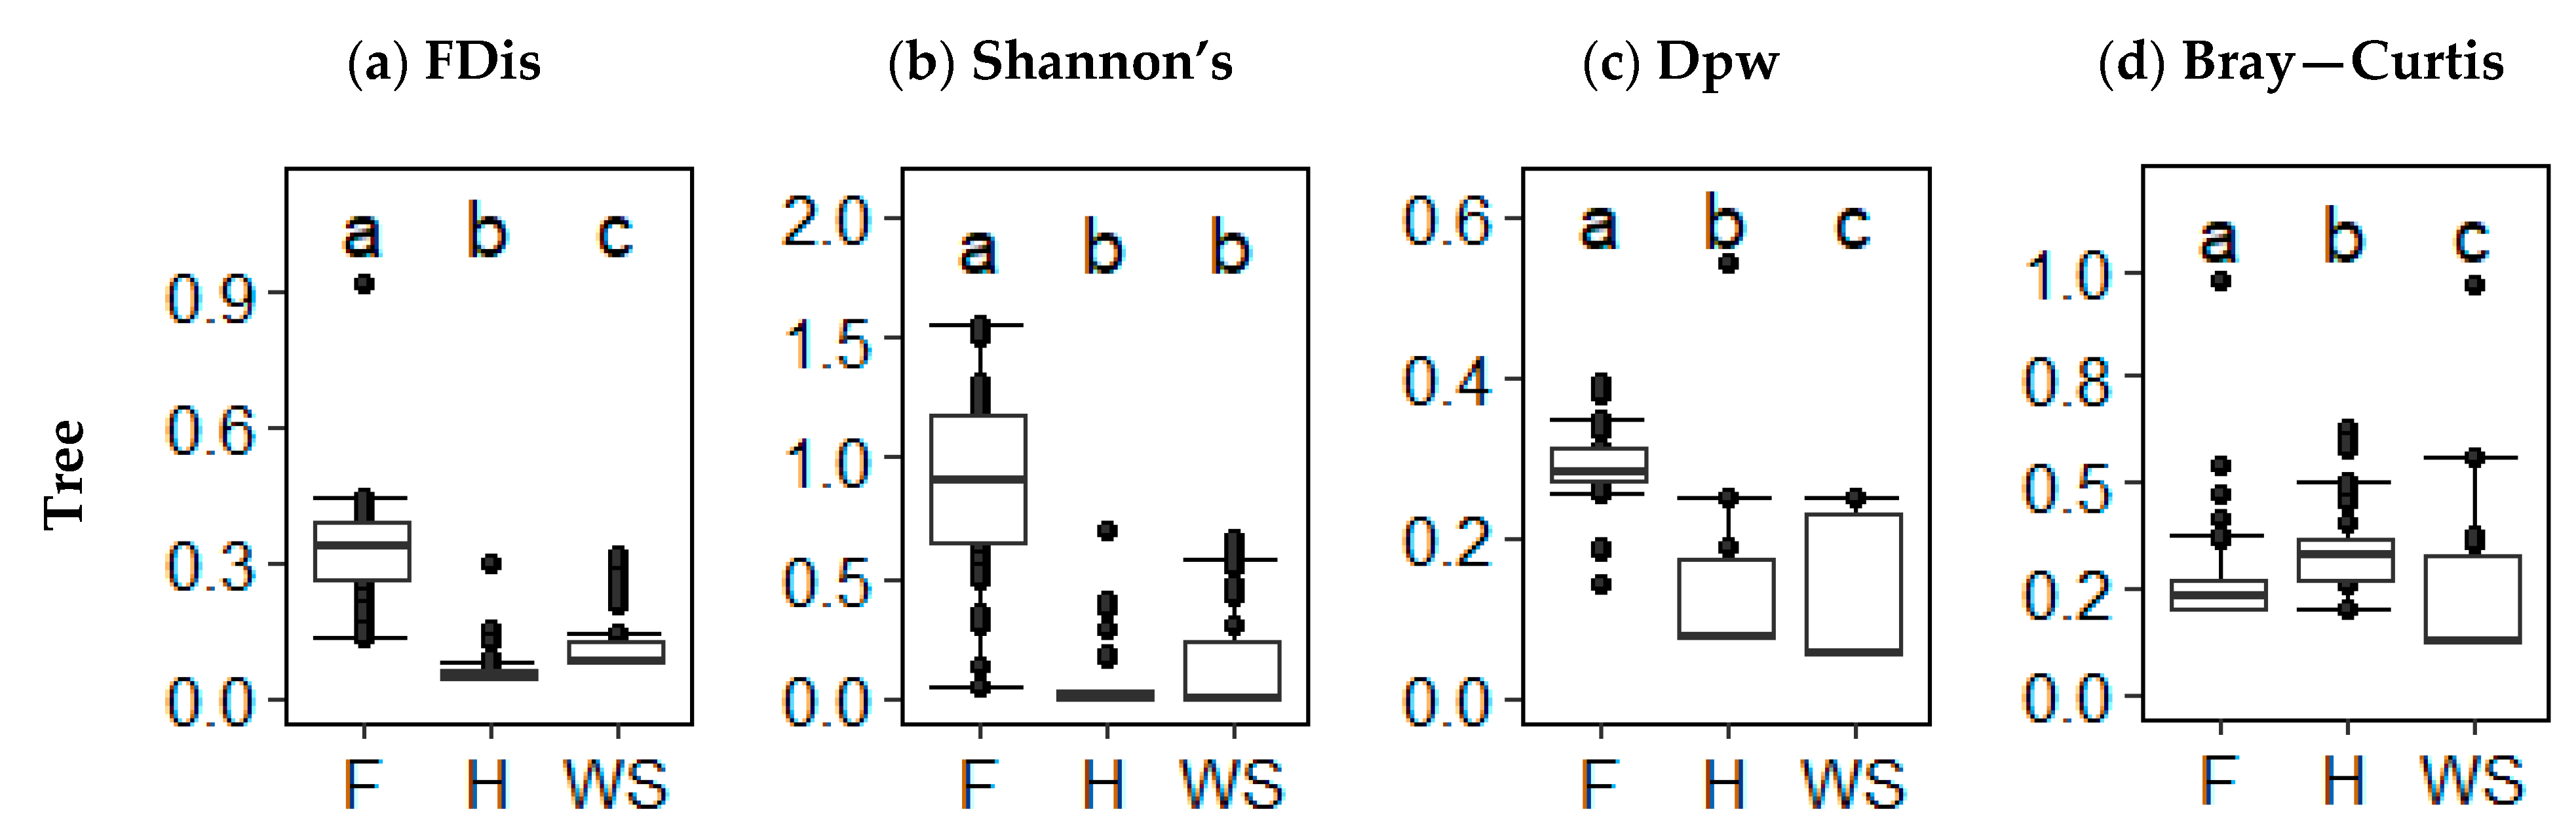
Analysis of tree diversity indicated differentiation in the hierarchical trends compared to overall diversity. Tree alpha FD was highest in forest (shrub savannah: KW, x = 5.314, p < 0.001; heath: KW, x = 9.622, p < 0.001) followed by shrub savannah and then heath (KW, x = −4.440, p < 0.001) (Figure 4a). Less differences were observed within tree alpha TD than tree alpha FD, with forest alpha TD remaining higher than heath (KW, x = 8.309, p < 0.001) and shrub savannah (KW, x = 7.115, p < 0.001) but heath and shrub savannah did not differ (KW, x = −1.231, p = 0.328) (Figure 4b). Beta FD showed higher heterogeneity in forest than heath (KW, x = 6.305, p < 0.001) and shrub savannah (KW, x = 7.916, p < 0.001) and no differences between heath and shrub savannah (KW, x = 1.661, p = 0.145) (Figure 4c). In beta TD, forest was higher than heath and shrub savannah (KW, x = 5.985, p < 0.001; KW, x = 3.133, p < 0.001, respectively), followed by shrub savannah and heath (KW, x = −2.940, p = 0.05) (Figure 4d).
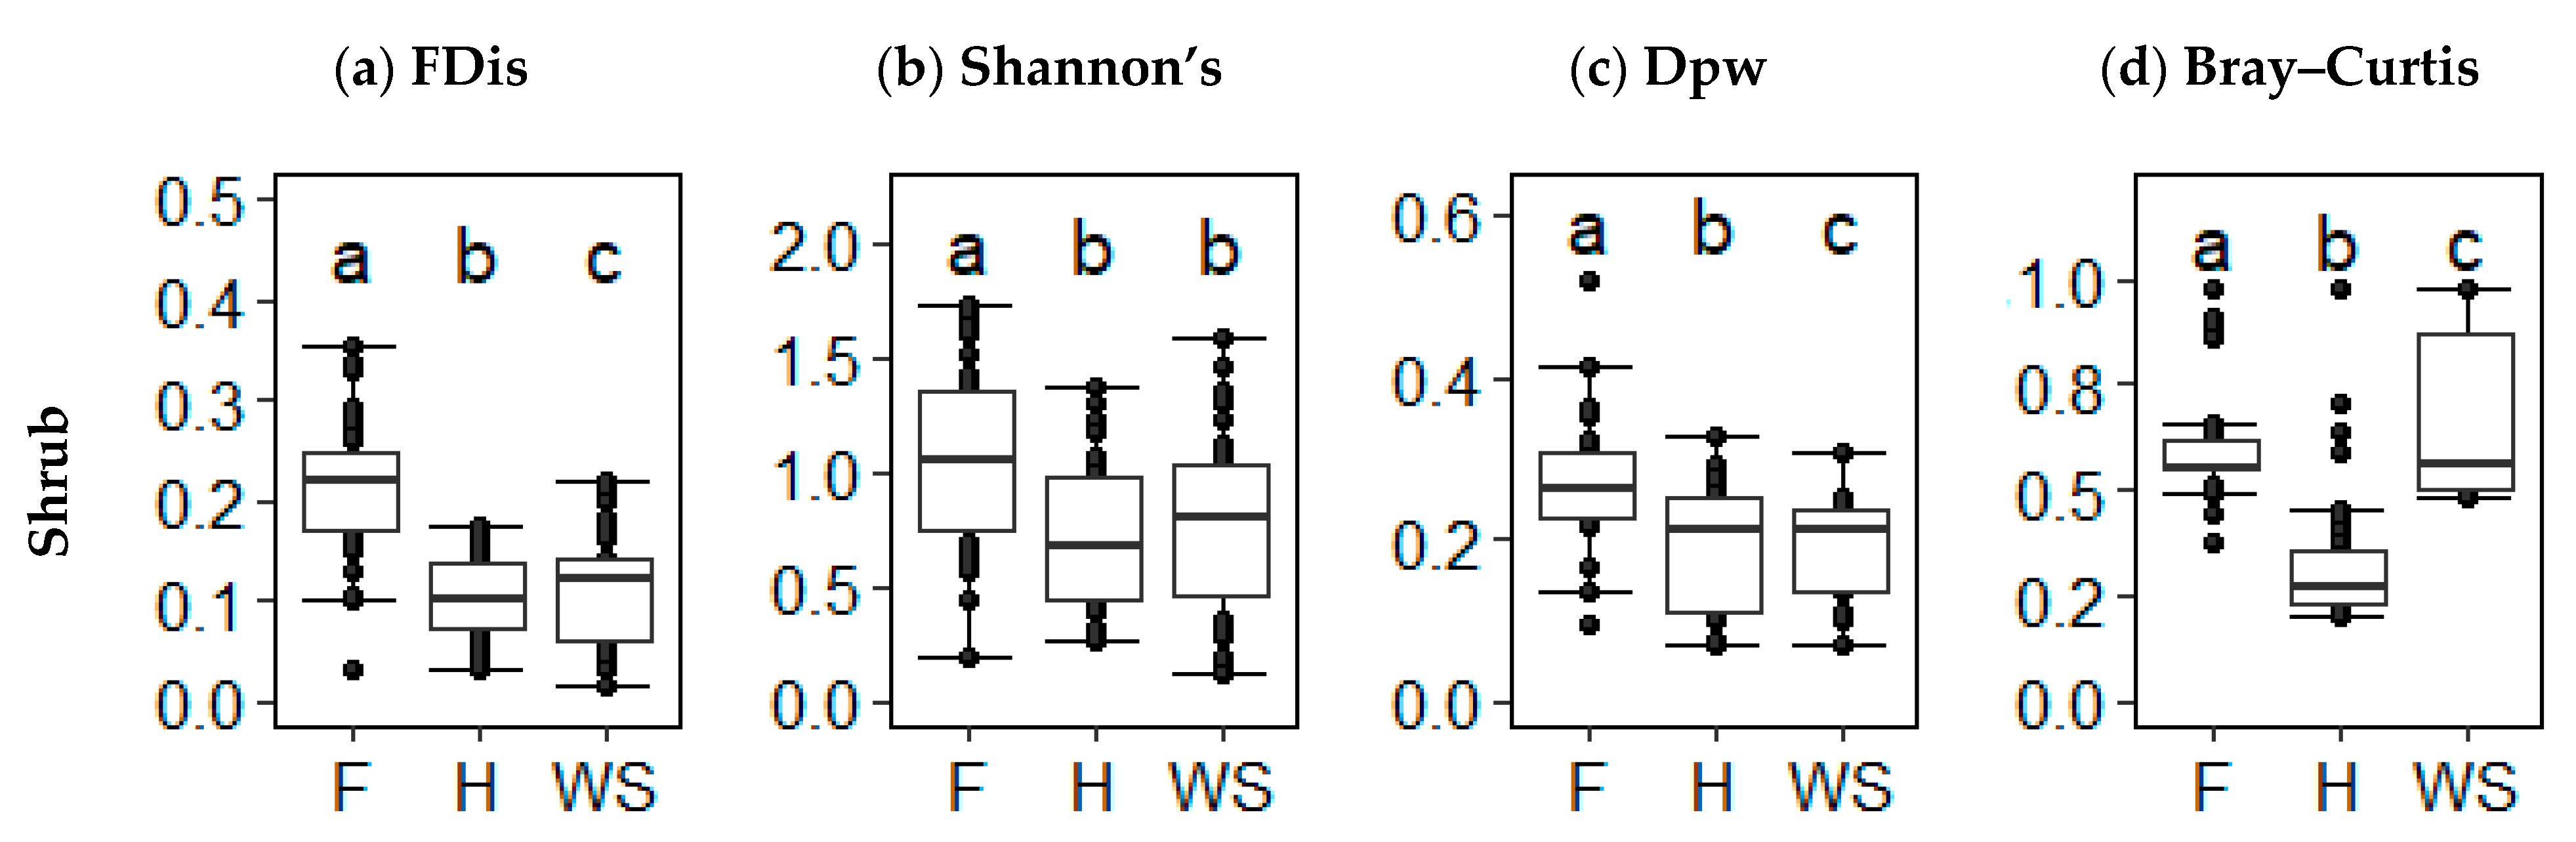
FD and TD indices showed little agreement on the diversity of forest, heath, and wood savanna. Within the shrubs, forest had higher alpha FD than heath and shrub savannah (KW, x = 6.46, p < 0.001; KW, x = 6.094, p < 0.001, respectively), but heath and shrub savannah did not differ significantly (KW, x = −0.704, p = 0.722) (Figure 5a). Shrub alpha TD was consistent with overall alpha TD and tree alpha TD, whereas forest was higher than heath and shrub savannah TD (KW, x = 3.731, p < 0.001; KW, x = 3.049, p = 0.003, respectively), with no difference between heath and shrub savannah (KW, x = −0.7037, p = 0.7224) (Figure 5b). The same trend was found in beta FD; forest had higher beta FD than heath (KW, 4.085, p < 0.001) and shrub savannah (KW, x = 4.406, p < 0.001). Beta FD did not differ between shrub savannah and heath (KW, x = 0.331, p > 0.999) (Figure 5c). However, shrub savannah had greater beta TD than heath (KW, x = 3.755, p < 0.001), and forest had greater beta TD than heath and shrub savannah ((KW, x = 4.385, p < 0.001; KW, x = 8.027, p < 0.001, respectively) (Figure 5d).
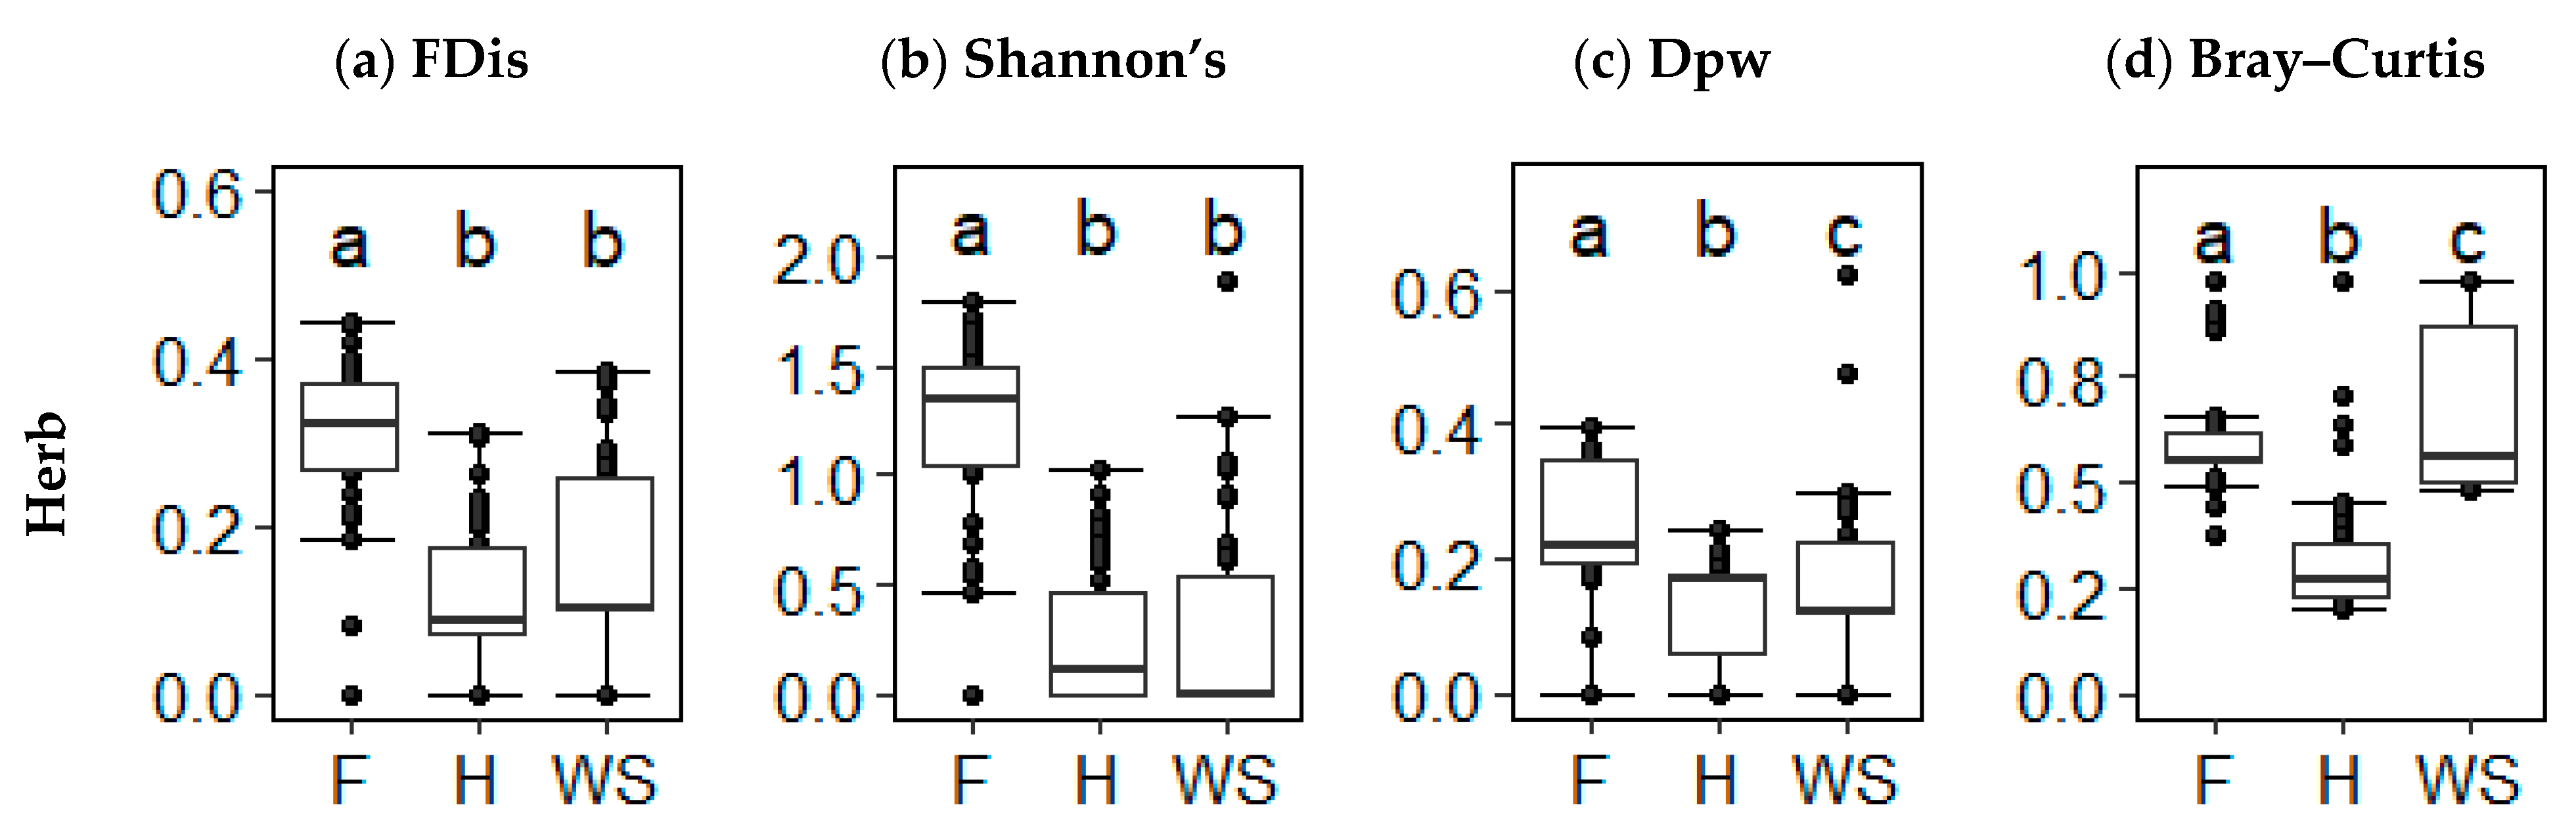
Herbs showed more changes in alternate vegetation state FD than the trees and shrubs but retained similar ranking with respect to TD. Forest had the greatest alpha FD (heath: KW, x = 7.031, p < 0.001; shrub savannah: KW, x = 4.393, p < 0.001) followed by shrub savannah then heath (KW, x = −2.719, p = 0.010) (Figure 6a). Forest had higher herb alpha TD than heath (KW, x = 6.554, p < 0.001) and shrub savannah (KW, x = 6.624, p < 0.001). In heath, herb alpha TD did not differ from that of shrub savannah (KW, x = 0.072, p = 0.072) (Figure 6b). Like the tree and shrub subgroup, the herb subgroup had greater beta FD in forest than heath (KW, x = 5.467, p < 0.001) and shrub savannah (KW, x = 2.396, p = 0.025). Unlike the tree and shrub subgroup, the shrub savannah herb beta FD was greater than heath (KW, x = −3.165, p = 0.002) (Figure 6c). Heath had the greatest beta TD (forest: KW, x = −7.296, p < 0.001; shrub savannah: KW, x = 0.901, p < 0.001) followed by shrub savannah and forest (KW, x = −6.421, p < 0.001) (Figure 6d).
3.3. Mean Trait Values of Forest, Heath, and shrub savannah
Mean trait values varied widely across communities and sites. Specific leaf area was the highest in forest compared to shrub savannah (KW, x = 7.950, p < 0.001) and heath (KW, x = 6.166, p < 0.001) followed by heath and shrub savannah, with no difference observed between the latter two communities (KW, x = 1.838, p = 0.099). A similar trend was observed in community-wide leaf dry matter (LDMC) content, where forest had higher LDMC than shrub savannah and heath. Heath and shrub savannah LDMC did not differ significantly (KW, x = −8.346, p < 0.001; KW, x = −6.679; KW, x = −1.718, p = 0.127, respectively). Specific root length (SRL) was the smallest in forest (heath: KW, x = -6.641, p < 0.001; shrub savannah: KW, x = −3.452, p < 0.001). Heath SRL was greater than that of shrub savannah (KW, x = 3.288, p = 0.002). Average seed mass was the greatest in forest compared to heath and shrub savannah (KW, x = 6.522, p < 0.001; KW, x = 7.02, p < 0.001, respectively), and heath seed mass did not differ from shrub savannah (KW, x = 0.498, p = 928). Finally, height was the lowest in heath (forest: KW, x = 6.522, p < 0.001; shrub savannah: KW, x = −7.180, p < 0.001) and the highest in forest and wood savanna (KW, x = −0.443, p = 0.986) (Table 2).
4. Discussion
Our results show that functional and taxonomic diversity were almost consistently higher in post-fire forest than heath and shrub savannah. shrub savannah showed an intermediate level of diversity and retained similar average functional trait values compared to heath, with the exception of height and SRL. Despite strong correlations between overall alpha TD and alpha FD, we found discrepancies in the hierarchical ranking of forest, heath, and shrub savannah between the two measures of alpha diversity within tree and herb life forms. Here, differences between shrub savannah and heath were found solely for alpha FD. In the case of trees, the amplified differences in alpha FD compared to alpha TD are likely a result of greater functional trait differences between the tree species present [33]. One possible reason for the decreased tree diversity in heath than shrub savannah is high biotic filtering, where Kalmia dominance interferes with black spruce regeneration [18,34]. This explanation also provides a rationale for alpha FD capturing more differences than the taxonomic analogue, as it accurately describes the reduction of successful trait ranges that occurs via habitat filtering [35]. The herb subgroup showed more differentiation between heath and shrub savannah due to increased microhabitat conditions captured within the spruce islands, which has been shown to favor biodiversity due to fine-scale spatial variation [36]. However, differences in shrub and overall alpha FD and alpha TD appear equal, suggesting that the spruce islands and their associated microhabitats contribute minimally to community-wide biodiversity and that shrubs control the functional processes in these communities.
The differences between the hierarchical ranking of the three vegetation states between beta TD and beta FD are not surprising, due to the weak correlation observed among them. Within heath, beta TD suggests high levels of heterogeneity. However, beta FD shoSS that the dissimilarity of plant species in the heath varies minimally. Examining beta diversity from a functional perspective indicates that a narrow range of functional traits are capable of establishing themselves in the environmental constraints of heath, which perpetuates the system in a state of homogenization [37]. Consequently, we see that functional homogenization is the highest in heath, followed by shrub savannah then forest. The tree and shrub beta FD do not differ because heath and shrub savannah select for only two conifer species (Picea mariana, Larix laricina). These two conifer species are able to persist in heath and shrub savannah by avoiding the inhospitable seedbed through vegetative reproduction. It appears that the dispersal of herbs, primarily in the spruce islands, is the primary driver of beta FD in shrub savannah (Figure 6c). In contrast, beta FD is the highest in forest due to the divergence of traits into a wider variety of niches. As a result, the biodiversity and consequent increase in competitive interactions between plant species in forest creates a positive feedback loop that results in increased niche differentiation and productivity within the community [38]. Therefore, forests have the highest degree of niche variability, followed by shrub savannah and heath.
It is difficult to include the traits of all plants (including rare species) to calculate FD. However, studies have shown that patterns of FD are often driven by the traits of the dominant species according to the mass ratio hypothesis [13,39,40]. Nonetheless, we recognize that the omission of rare vascular plants and cryptogams in the calculation of FD may have resulted in the loss of some information [18]. Trait analysis of cryptogams is challenging and is still in its infancy [41].
Although levels of niche differentiation vary across the three vegetation states (forest, heath, and shrub savannah) each remains favorable to specific functional traits adapted to the biotic and abiotic conditions in each community. Average SLA, LDMC, and seed mass are similar between heath and shrub savannah. The relatively high LDMC and low SLA observed in heath and shrub savannah represents nutrient conservation, whereas the relatively high SLA and low LDMC in forest is more representative of the rapid production of biomass [42]. This is consistent with pyrogenic organic matter resulting from incomplete combustion of organic matter in heath and wood savanna leading to lower available N, which subsequently lowers the C:N ratio and immobilizes N [43]. Charcoal (pyrogenic carbon) from forest fires has been shown to change soil pH [44] and produce a significant long-term carbon sink [45,46]. Moreover, past research [47] has shown that the abundance of ericaceous plants, such as Kalmia, is negatively correlated with soil ammonium and phosphorus contents, leading to limitations in soil nutrient availability. Additionally, the phenolic compounds produced from the highly abundant Kalmia [48] are known to inhibit nitrogen mineralization. This interferes with nutrient cycling and the establishment of non-ericaceous species. Additionally, thick organic matter occupied by Kalmia creates an inhospitable seedbed for conifers but a suitable condition for vegetative regeneration [49]. Hence, heath and shrub savannah have low seed mass values, as primarily seed regenerating species (black spruce) are outcompeted by vegetatively regenerating ericaceous species. Not surprisingly, SRL differs between each of the three communities and is the greatest in the heath, followed by shrub savannah, then forest. SRL decreases with soil fertility [25]. Therefore, it is likely that the spruce islands present in shrub savannah may contribute to soil fertility, either through nitrogen mineralization via mycorrhiza or simply through limiting the abundance of Kalmia. Plant height was significantly greater in forest and shrub savannah compared to heath. shrub savannah surpassed heath in plant height due to the prevalence of layered spruce islands that evade the hostile seedbed and promote the competitive pressures for light acquisition, resulting in species that are adapted to shaded environments, such as Cornus canadensis, and species that are adapted to acquire light through a rapid increase in height, such as Larix laricina. Accordingly, the three communities represent differentiation of traits to better suit their respective environmental conditions.
The changes in taxonomic and functional biodiversity across the three alternate vegetation states provide insight into ecosystem health and function. From a taxonomic perspective, the increase in alpha and beta diversity observed in forest shoSS that the biodiversity of the system is increased, which predicts that the system may also have a higher degree of functioning and stability than heath and shrub savannah [50]. Yet, beyond that prediction, taxonomic diversity provides little information regarding the functional role of species in the community [51]. Hence, alpha TD found minimal differences between the herb and tree life forms that propelled alpha FD differences between heath and shrub savannah. Alternatively, this suggests that both a lack of fire severity and/or the absence of fire results in a system with less resilience to environmental change and more susceptibility to regime shifts [52], meaning that long-term alteration to the natural fire regime of eastern Canada can result in fragmented assemblages of alternate states.
Functionally, the consequence of reduced black spruce forests has serious implications for productivity and ecosystem function. The loss of functional diversity reduces the level of niche complementarity and variability in resource acquisition strategies [53]. One of the driving factors for loss of function is the biological homogenization observed in heath and shrub savannah. Biological homogenization at the community level alters ecosystem productivity and function through the loss of specialists in a community [54]. This is supported by the increased alpha diversity in this study showing high degrees of coexistence among specialists in the forest.
The functional and taxonomic diversity derived from this study are consistently lower than those reported by other research [18] that compared the functional and taxonomic diversity differences in heath and forest. The differences occurred as a result of methodological differences. The aforementioned study used random quadrats and ocular assessment of tree crown cover, whereas in this study, we used belt transects and basal area of trees to assess tree species cover. The differences of tree diversity measures arise from the relative differences of abundance values generated by crown cover and basal area of trees, where crown cover is far greater than basal area. However, assessing crown cover provides a less precise measure of cover and thus provides the potential to misrepresent the influence of trees on the system’s biodiversity. Alternatively, measuring the basal area of tree species may underrepresent their contribution to biodiversity when used in conjunction with the ocular assessment of ground cover by other species. While methods for conversion from basal area to crown diameter exist, they are inapplicable to immature trees. Thus, there is a need to refine these conversion methods to include immature trees (saplings) in order to properly assess tree species diversity in recently disturbed sites. Independent of methodological differences between tree assessments, herb and shrub diversity values remain lesser when using belt transects. The use of belt transects are superior to quadrats when assessing environmental gradients [55]. Therefore, it is likely that the values derived via the belt transect method more accurately capture the functional characteristics of the system than random quadrats.
5. Conclusions
Forest, heath, and shrub savannah of eastern Canada provide the opportunity to explore the consequences of alternate states that arise from alterations to the natural disturbance regime of an ecosystem. Where the black spruce forest is considered the historic community, deviations from the natural disturbance regime shifted the community to the alternate states of heath and shrub savannah, which resulted in the loss of alpha FD and alpha TD as well as beta FD. Furthermore, the dominant trait values shifted with the creation of alternate states in response to changes in abiotic environmental filters, such as increased post-fire residual organic matter, and biotic filters, such as Kalmia dominance. The systems with less biodiversity are associated with less nutrient availability and lower levels of niche differentiation. This results in a consequent reduction of the establishment potential of species, which dampens the overall ecosystem function.
Author Contributions
Conceptualization, A.U.M.; methodology, A.U.M. & C.S.J.; software, C.S.J.; validation, A.U.M. & C.S.J.; formal analysis, C.S.J.; investigation, C.S.J. & A.U.M.; resources, A.U.M.; data curation, C.S.J.; writing—original draft preparation, C.S.J.; writing—review and editing, A.U.M. & C.S.J.; visualization, C.S.J. & A.U.M.; supervision, A.U.M.; project administration, A.U.M.; funding acquisition, A.U.M. All authors have read and agreed to the published version of the manuscript.
Funding
This research was funded by a Natural Sciences and Engineering Research Council (NSERC) Discovery grant (# RGPIN-2014-06239) awarded to Azim U. Mallik. Colin St. James was supported by a Summer Research Assistantship from the Faculty of Science and Environmental Studies, Lakehead University, and Regina Lauffer was supported by a Mitacs Global link Research Internship; both were awarded through AUM.
Acknowledgments
We thank Phillipe St. Martin for his help during fieldwork and data analysis, as well as his helpful comments on the first draft of this manuscript. We would also like to thank Regina Lauffer for fieldwork assistance and the administration and the staff of Terra Nova National Park for logistical help during our fieldwork.
Conflicts of Interest
The authors declare no conflict of interest.
Appendix A

Table A1.
Plant trait matrix of the 25 most abundant species and five functional traits, specific leaf area (SLA), leaf dry matter content (LDMC), specific root length (SRL), seed mass, and height.
Table A1.
Plant trait matrix of the 25 most abundant species and five functional traits, specific leaf area (SLA), leaf dry matter content (LDMC), specific root length (SRL), seed mass, and height.
| Species | SLA | LDMC | SRL | Seed Mass | Height |
|---|---|---|---|---|---|
| Abies balsamea | 97.87441 | 0.3883 | 17.8755 | 7.6 | 2300 |
| Acer rubrum | 103.3379 | 0.3441 | 74.1858 | 19.7 | 2500 |
| Alnus crispa | 114.3803 | 0.3940 | 53.6722 | 355.1 | 300 |
| Amelanchier canadensis | 167.2021 | 0.3967 | 14.6450 | 5.56 | 250 |
| Aralia nudicaulis | 229.8596 | 0.3086 | 33.0118 | 4.58 | 60 |
| Betula papyrifera | 205.7170 | 0.2766 | 19.2751 | 0.329 | 2000 |
| Clintonia borealis | 288.9256 | 0.0887 | 7.39290 | 4.7 | 40 |
| Cornus canadensis | 204.2082 | 0.2932 | 44.7180 | 6.78 | 20 |
| Ilex mucronata | 183.5735 | 0.3754 | 39.2860 | 10.07 | 300 |
| Kalmia angustifolia | 127.4370 | 0.4006 | 49.9673 | 0.005 | 100 |
| Larix laricina | 148.2500 | 0.3276 | 12.0522 | 0.179 | 2000 |
| Linnaea borealis | 240.2211 | 0.3027 | 61.4427 | 1.2 | 15 |
| Maianthemum canadense | 305.5810 | 0.2062 | 61.1218 | 9 | 22 |
| Picea mariana | 63.70094 | 0.4225 | 38.7228 | 0.90 | 2750 |
| Populous tremuloides | 139.8694 | 0.4092 | 40.5605 | 0.16 | 2500 |
| Prunus pensylvanica | 215.1522 | 0.3213 | 57.6519 | 70.4 | 1200 |
| Rhododendron canadense | 152.4175 | 0.4018 | 55.8353 | 0.018 | 100 |
| Rhododendron groenlandicum | 96.84796 | 0.4363 | 57.7016 | 0.006 | 100 |
| Rubus idaeus | 171.9739 | 0.3509 | 75.7367 | 1.29 | 150 |
| Sorbus americana | 172.2599 | 0.3361 | 79.5787 | 3.13 | 1000 |
| Trientalis borealis | 252.9741 | 0.2957 | 54.2331 | 0.4 | 20 |
| Vaccinium angustifolium | 147.1567 | 0.3491 | 68.6992 | 0.256 | 60 |
| Vaccinium uliginosum | 198.6207 | 0.4143 | 12.6962 | 0.26 | 10 |
| Vaccinium vitis-idaea | 65.14035 | 0.4691 | 18.6890 | 0.965 | 7 |
| Viburnum cassinoides | 144.8790 | 0.3269 | 14.8425 | 16.4 | 305 |
References
- Holling, C.S. Resilience and Stability of Ecological Systems. Annu. Rev. Ecol. Syst. 1973, 4, 1–23. [Google Scholar] [CrossRef] [Green Version]
- Johnstone, J.F.; Allen, C.D.; Franklin, J.F.; Frelich, L.E.; Harvey, B.J.; Higuera, P.E.; Mack, M.C.; Meentemeyer, R.K.; Metz, M.R.; Perry, G.L.; et al. Changing disturbance regimes, ecological memory, and forest resilience. Front. Ecol. Environ. 2016, 14, 369–378. [Google Scholar] [CrossRef]
- Hart, S.J.; Henkelman, J.; McLoughlin, P.D.; Nielsen, S.E.; Truchon-Savard, A.; Johnstone, J.F. Ex-amining forest resilience to changing fire frequency in a fire-prone region of boreal forest. Glob. Chang. Biol. 2019, 25, 869–884. [Google Scholar] [CrossRef] [PubMed]
- Johnstone, J.F.; Hollingsworth, T.N.; Chapin, F.S., III; Mack, M.C. Changes in fire regime break the legacy lock on successional trajectories in Alaskan boreal forest. Glob. Chang. Biol. 2010, 16, 1281–1295. [Google Scholar] [CrossRef]
- Dı́az, S.; Cabido, M. Vive la différence: Plant functional diversity matters to ecosystem processes. Trends Ecol. Evol. 2001, 16, 646–655. [Google Scholar] [CrossRef]
- Lasky, J.R.; Sun, I.F.; Su, S.H.; Chen, Z.S.; Keitt, T.H. Trait-mediated effects of environmental filtering on tree community dynamics. J. Ecol. 2013, 101, 722–733. [Google Scholar] [CrossRef]
- Kraft, N.J.; Adler, P.B.; Godoy, O.; James, E.C.; Fuller, S.; Levine, J.M. Community assembly, co-existence and the environmental filtering metaphor. Funct. Ecol. 2015, 29, 592–599. [Google Scholar] [CrossRef]
- Cadotte, M.W.; Tucker, C.M. Should Environmental Filtering be Abandoned? Trends Ecol. Evol. 2017, 32, 429–437. [Google Scholar] [CrossRef]
- Heffernan, J.; Dong, X.; Braswell, A.E. Multiple Stable States and Regime Shifts. Oxf. Bibliogr. Online Datasets 2018. [Google Scholar] [CrossRef]
- Mason, N.W.H.; De Bello, F.; Mouillot, D.; Pavoine, S.; Dray, S. A guide for using functional diversity indices to reveal changes in assembly processes along ecological gradients. J. Veg. Sci. 2013, 24, 794–806. [Google Scholar] [CrossRef]
- Kahmen, A.; Perner, J.; Audorff, V.; Weisser, W.; Buchmann, N. Effects of plant diversity, community composition and environmental parameters on productivity in montane European grass-lands. Oecologia 2005, 142, 606–615. [Google Scholar] [CrossRef] [PubMed]
- Lee, C.R.; Mitchell-Olds, T. Complex trait divergence contributes to environmental niche differenti-ation in ecological speciation of Boechera stricta. Mol. Ecol. 2013, 22, 2204–2217. [Google Scholar] [CrossRef] [PubMed] [Green Version]
- Grime, J.P. Benefits of plant diversity to ecosystems: Immediate, filter and founder effects. J. Ecol. 1998, 86, 902–910. [Google Scholar] [CrossRef]
- Sánchez-Pinillos, M.; Coll, L.; De Cáceres, M.; Ameztegui, A. Assessing the persistence capacity of communities facing natural disturbances on the basis of species response traits. Ecol. Indic. 2016, 66, 76–85. [Google Scholar] [CrossRef] [Green Version]
- Collier, L.C.S.; Mallik, A. Does post-fire abiotic habitat filtering create divergent plant communities in black spruce forests of eastern Canada? Oecologia 2010, 164, 465–477. [Google Scholar] [CrossRef]
- Mallik, A.U. Ecology of a forest weed of Newfoundland: Vegetative regeneration strategy of Kalmia an-gistifolia. Can. J. Bot. 1993, 71, 161–166. [Google Scholar] [CrossRef]
- Girard, F.; Payette, S.; Gagnon, R. Origin of the lichen-spruce woodland in the closed-crown forest zone of eastern Canada. Glob. Ecol. Biogeogr. 2009, 18, 291–303. [Google Scholar] [CrossRef]
- St. Martin, P.; Mallik, A.U. Alternate successional pathway yields alternate pattern of functional diversity. J. Veg. Sci. 2019, 30, 461–470. [Google Scholar] [CrossRef]
- Girard, F.; Payette, S.; Gagnon, R. Rapid expansion of lichen woodlands within the closed-crown boreal forest zone over the last 50 years caused by stand disturbances in eastern Canada. J. Biogeogr. 2008, 35, 529–537. [Google Scholar] [CrossRef]
- South, R. Biogeography and Ecology of the Island of Newfoundland; Springer Science & Business Media: Berlin/Heidelberg, Germany, 1983; Volume 48. [Google Scholar]
- Environment Canada. Canadian Climate Normals 1981–2010: Gambo, NL. 2017. Available online: http://climate.weather.gc.ca/ (accessed on 5 January 2020).
- Power, R. Vegetation Management Plan for Terra Nova National Park 2000–2004; Department of Canadian Heritage: Hull, QC, Canada, 2000.
- Esri “World Street Map” [Basemap]. Scale Not Given. 7 January 2020. Available online: https://www.arcgis.com/home/webmap/viewer.html?useExisting=1 (accessed on 8 January 2020).
- Reich, P.B.; Walters, M.B.; Ellsworth, D.S. From tropics to tundra: Global convergence in plant functioning. Proc. Natl. Acad. Sci. USA 1997, 94, 13730–13734. [Google Scholar] [CrossRef] [Green Version]
- Smart, S.M.; Glanville, H.C.; Blanes, M.D.C.; Mercado, L.M.; Emmett, B.A.; Jones, D.L.; Cosby, B.J.; Marrs, R.H.; Butler, A.; Marshall, M.R.; et al. Leaf dry matter content is better at predicting above-ground net primary production than specific leaf area. Funct. Ecol. 2017, 31, 1336–1344. [Google Scholar] [CrossRef] [Green Version]
- Ostonen, I.; Püttsepp, Ü.; Biel, C.; Alberton, O.; Bakker, M.R.; Lõhmus, K.; Majdi, H.; Metcalfe, D.; Olsthoorn, A.F.M.; Pronk, A.; et al. Specific root length as an indicator of environmental change. Plant Biosyst. Int. J. Deal. Asp. Plant Biol. 2007, 141, 426–442. [Google Scholar] [CrossRef]
- Falster, D.S.; Westoby, M. Tradeoffs between height growth rate, stem persistence and maximum height among plant species in a post-fire succession. Oikos 2005, 111, 57–66. [Google Scholar] [CrossRef]
- Kahmen, S.; Poschlod, P. Does Germination Success Differ with Respect to Seed Mass and Germination Season? Experimental Testing of Plant Functional Trait Responses to Grassland Management. Ann. Bot. 2007, 101, 541–548. [Google Scholar] [CrossRef] [PubMed] [Green Version]
- R Core Team. A Language and Environment for Statistical Computing; R Foundation for Statistical Computing: Vienna, Austria, 2016. [Google Scholar]
- Laliberté, E.; Legendre, P.; Shipley, B. FD: Measuring Functional Diversity from Multiple Traits, and Other Tools for Functional Ecology—R Package ‘FD’, Version 1.0-12. 2014. Available online: https://CRAN.R-project.org/package=FD (accessed on 16 July 2019).
- Kembel, S.W.; Cowan, P.D.; Helmus, M.R.; Cornwell, W.K.; Morlon, H.; Ackerly, D.D.; Blomberg, S.P.; Webb, C.O. Picante: R tools for integrating phylogenies and ecology. Bioinformatics 2010, 26, 1463–1464. [Google Scholar] [CrossRef] [PubMed] [Green Version]
- Oksanen, J.; Guillaume Blanchet, F.; Friendly, M.; Kindt, R.; Legendre, P.; McGlinn, D.; Wagner, H. Vegan: Community Ecology Package. R Package Version 2.5-4. 2019. Available online: https://CRAN.Rproject.org/package=vegan (accessed on 16 July 2019).
- Dinno, A. Dunn.test: Dunn’s Test of Multiple Comparisons Using Rank Sums. R Package Version 1.3.5. 2017. Available online: https://CRAN.R-project.org/package=dunn.test (accessed on 8 June 2019).
- Devictor, V.; Mouillot, D.; Meynard, C.; Jiguet, F.; Thuiller, W.; Mouquet, N. Spatial mismatch and congruence between taxonomic, phylogenetic and functional diversity: The need for integrative conservation strategies in a changing world. Ecol. Lett. 2010, 13, 1030–1040. [Google Scholar] [CrossRef] [PubMed]
- Mallik, A.U. Conifer Regeneration Problems in Boreal and Temperate Forests with Ericaceous Understory: Role of Disturbance, Seedbed Limitation, and Keytsone Species Change. Crit. Rev. Plant Sci. 2003, 22, 341–366. [Google Scholar] [CrossRef]
- Podani, J. Convex hulls, habitat filtering, and functional diversity: Mathematical elegance versus eco-logical interpretability. Community Ecol. 2009, 10, 244–250. [Google Scholar] [CrossRef] [Green Version]
- Jones, M.M.; Szyska, B.; Kessler, M. Microhabitat partitioning promotes plant diversity in a tropical montane forest. Glob. Ecol. Biogeogr. 2011, 20, 558–569. [Google Scholar] [CrossRef]
- Siefert, A.W.; Ravenscroft, C.; Weiser, M.D.; Swenson, N.G. Functional beta-diversity patterns reveal deterministic community assembly processes in eastern North American trees. Glob. Ecol. Biogeogr. 2013, 22, 682–691. [Google Scholar] [CrossRef]
- Mokany, K.; Ash, J.; Roxburgh, S.H. Functional identity is more important than diversity in influencing ecosystem processes in a temperate native grassland. J. Ecol. 2008, 96, 884–893. [Google Scholar] [CrossRef]
- Li, W.; Cheng, J.-M.; Yu, K.-L.; Epstein, H.E.; Guo, L.; Jing, G.-H.; Zhao, J.; Du, G.-Z. Plant Functional Diversity Can Be Independent of Species Diversity: Observations Based on the Impact of 4-Yrs of Nitrogen and Phosphorus Additions in an Alpine Meadow. PLoS ONE 2015, 10, e0136040. [Google Scholar] [CrossRef] [PubMed] [Green Version]
- Martin, P.S.; Mallik, A.U. The status of non-vascular plants in trait-based ecosystem function studies. Perspect. Plant Ecol. Evol. Syst. 2017, 27, 1–8. [Google Scholar] [CrossRef]
- Diaz, S.; Hodgson, J.G.; Thompson, K.; Cabido, M.; Cornelissen, J.H.; Jalili, A.; Band, S.R. The plant traits that drive ecosystems: Evidence from three continents. J. Veg. Sci. 2004, 15, 295–304. [Google Scholar] [CrossRef] [Green Version]
- Garnier, E.; Shipley, B.; Roumet, C.; Laurent, G. A standardized protocol for the determination of specific leaf area and leaf dry matter content. Funct. Ecol. 2001, 15, 688–695. [Google Scholar] [CrossRef]
- Certini, G. Effects of fire on properties of forest soils: A review. Oecologia 2005, 143, 1–10. [Google Scholar] [CrossRef]
- Jones, M.W.; Santín, C.; van der Werf, G.R.; Doerr, S.H. Global fire emissions buffered by the pro-duction of pyrogenic carbon. Nat. Geosci. 2019, 12, 742–747. [Google Scholar] [CrossRef] [Green Version]
- Wei, X.; Hayes, D.J.; Fraver, S.; Chen, G. Global Pyrogenic Carbon Production During Recent Decades Has Created the Potential for a Large, Long-Term Sink of Atmospheric CO2. J. Geophys. Res. Biogeosci. 2018, 123, 3682–3696. [Google Scholar] [CrossRef]
- Whitman, T.; Enders, A.; Lehmann, J. Pyrogenic carbon additions to soil counteract positive priming of soil carbon mineralization by plants. Soil Biol. Biochem. 2014, 73, 33–41. [Google Scholar] [CrossRef]
- Bloom, R.G.; Mallik, A.U. Relationships between ericaceous vegetation and soil nutrient status in a post-fire Kalmia angustifolia-black spruce chronosequence. Plant Soil 2006, 289, 211–226. [Google Scholar] [CrossRef]
- Mallik, A.U. Can Kalmia angustifolia interference to black spruce (Picea mariana) be explained by allelopathy? Forest Ecol. Manag. 2002, 160, 75–84. [Google Scholar]
- Andrén, O.; Balandreau, J. Biodiversity and soil functioning—from black box to can of worms? Appl. Soil Ecol. 1999, 13, 105–108. [Google Scholar] [CrossRef]
- Swenson, N.G. The role of evolutionary processes in producing biodiversity patterns, and the interrelationships between taxonomic, functional and phylogenetic biodiversity. Am. J. Bot. 2011, 98, 472–480. [Google Scholar] [CrossRef] [Green Version]
- Folke, C.; Carpenter, S.; Walker, B.; Scheffer, M.; Elmqvist, T.; Gunderson, L.; Holling, C.S. Regime Shifts, Resilience, and Biodiversity in Ecosystem Management. Annu. Rev. Ecol. Evol. Syst. 2004, 35, 557–581. [Google Scholar] [CrossRef] [Green Version]
- Ashton, I.W.; Miller, A.E.; Bowman, W.D.; Suding, K.N. Niche complementarity due to plasticity in resource use: Plant partitioning of chemical N forms. Ecology 2010, 91, 3252–3260. [Google Scholar] [CrossRef]
- Clavel, J.; Julliard, R.; Devictor, V. Worldwide decline of specialist species: Toward a global functional homogenization? Front. Ecol. Environ. 2010, 9, 222–228. [Google Scholar] [CrossRef] [Green Version]
- Herpin, U.; Berlekamp, J.; Markert, B.; Wolterbeek, B.; Grodzińska, K.; Siewers, U.; Lieth, H.; Weckert, V. The distribution of heavy metals in a transect of the three states the Netherlands, Germany and Poland, determined with the aid of moss monitoring. Sci. Total Environ. 1996, 187, 185–198. [Google Scholar] [CrossRef]
Figure 1.
Location of study sites in the forest (F, in blue), heath (H, in red), and shrub savannah (SS, in green) communities in Newfoundland, Canada [23]. Table 1 of Siegwart Collier and Mallik 2010 [15] shoSS the fire history (date of fire, fire weather index, duration of fire, area burned etc.) of the study sites.

Figure 2.
(a) Relationship between alpha FD (functional dispersion) and alpha TD (Shannon’s diversity), and (b) relationship between beta FD (functional pairwise dissimilarity) and beta TD (Bray–Curtis dissimilarity). FDis: functional dispersion; Dpw: functional pairwise dissimilarity.
Figure 2.
(a) Relationship between alpha FD (functional dispersion) and alpha TD (Shannon’s diversity), and (b) relationship between beta FD (functional pairwise dissimilarity) and beta TD (Bray–Curtis dissimilarity). FDis: functional dispersion; Dpw: functional pairwise dissimilarity.

Figure 3.
(a) Functional alpha diversity (functional dispersion), (b) taxonomic alpha diversity (Shannon’s diversity), (c) functional beta diversity (functional pairwise dissimilarity), and (d) taxonomic beta diversity (Bray–Curtis dissimilarity) values for all life forms (overall) in forest (F) (n = 40), heath (H) (n = 45), and shrub savannah (SS) (n = 45) alternate states. Unlike letters above the error bars indicate significant differences at p < 0.05.

Figure 4.
(a) Functional alpha diversity (functional dispersion), (b) taxonomic alpha diversity (Shannon’s diversity), (c) functional beta diversity (functional pairwise dissimilarity), and (d) taxonomic beta diversity (Bray–Curtis dissimilarity) values for trees in forest (F) (n = 40), heath (H) (n = 45), and shrub savannah (SS) (n = 45) alternate states. Unlike letters above the error bars indicate significant differences at p < 0.05.

Figure 5.
(a) Functional alpha diversity (functional dispersion), (b) taxonomic alpha diversity (Shannon’s diversity), (c) functional beta diversity (functional pairwise dissimilarity), and (d) taxonomic beta diversity (Bray–Curtis dissimilarity) values for shrubs in forest (F) (n = 40), heath (H) (n = 45), and shrub savannah (SS) (n = 45) alternate states. Unlike letters above the error bars indicate significant differences at p < 0.05.

Figure 6.
(a) Functional alpha diversity (functional dispersion), (b) taxonomic alpha diversity (Shannon’s diversity), (c) functional beta diversity (functional pairwise dissimilarity), and (d) taxonomic beta diversity (Bray–Curtis dissimilarity) values for herbs in forest (F) (n = 40), heath (H) (n = 45), and shrub savannah (SS) (n = 45) alternate states. Unlike letters above the error bars indicate significant differences at p < 0.05.

Table 1.
Sampling design and plot replications to determine species abundance in post-fire forest (F), heath (H), and shrub savannah (SS) communities.
Table 1.
Sampling design and plot replications to determine species abundance in post-fire forest (F), heath (H), and shrub savannah (SS) communities.
| Community Type | Number (#) of Sites | # of Belt Transects | # of 10 × 10 m Plots per Transect | # of 1 × 1 m Quadrat per 10 × 10 m Plot |
|---|---|---|---|---|
| Forest | 3 | 8 | 5 | 5 |
| Heath | 3 | 9 | 5 | 5 |
| shrub savannah | 3 | 9 | 5 | 5 |
Table 2.
Mean and standard deviation of trait values for the specific leaf area (SLA), leaf dry matter content (LDMC), specific root length (SRL), seed mass, and height of plants in three alternate states: forest (F), heath (H), and shrub savannah (SS). * Indicates significant difference at p < 0.05.
| Trait | ||||||||||
|---|---|---|---|---|---|---|---|---|---|---|
| Community | SLA | LDMC | SRL | Seed Mass | Height | |||||
| X̅ | s | X̅ | s | X̅ | s | X̅ | s | X̅ | s | |
| F | 188.45 * | 28.51 | 0.32 * | 0.03 | 45.36 * | 5.94 | 14.0 * | 24.1 | 312.5 | 263.5 |
| H | 140.98 | 13.78 | 0.38 | 0.02 | 51.23 * | 1.32 | 1.22 | 1.97 | 96.15 * | 15.08 |
| SS | 133.08 | 10.59 | 0.39 | 0.01 | 49.44 * | 2.66 | 1.15 | 3.00 | 261.2 | 259.5 |
Publisher’s Note: MDPI stays neutral with regard to jurisdictional claims in published maps and institutional affiliations. |
© 2021 by the authors. Licensee MDPI, Basel, Switzerland. This article is an open access article distributed under the terms and conditions of the Creative Commons Attribution (CC BY) license (http://creativecommons.org/licenses/by/4.0/).
Share and Cite
MDPI and ACS Style
St. James, C.; Mallik, A.U. Functional Ecology of Forest, Heath, and Shrub Savannah Alternate States in Eastern Canada. Forests 2021, 12, 93. https://0-doi-org.brum.beds.ac.uk/10.3390/f12010093
AMA Style
St. James C, Mallik AU. Functional Ecology of Forest, Heath, and Shrub Savannah Alternate States in Eastern Canada. Forests. 2021; 12(1):93. https://0-doi-org.brum.beds.ac.uk/10.3390/f12010093
Chicago/Turabian StyleSt. James, Colin, and Azim U. Mallik. 2021. "Functional Ecology of Forest, Heath, and Shrub Savannah Alternate States in Eastern Canada" Forests 12, no. 1: 93. https://0-doi-org.brum.beds.ac.uk/10.3390/f12010093
Note that from the first issue of 2016, this journal uses article numbers instead of page numbers. See further details here.