The Importance of High–Quality Data for REDD+ Monitoring and Reporting †
by
Marieke Sandker
1,*, 
Oswaldo Carrillo
2,
Chivin Leng
3,
Donna Lee
4,
Rémi d’Annunzio
1 and
Julian Fox
1 1
Forestry Division, Food and Agriculture Organization of the United Nations, Viale delle Terme di Caracalla, 00153 Rome, Italy
2
Technical Unit Specialized in Monitoring Reporting and Verification, National Forestry Commission of Mexico, Periférico Poniente #5360 Col. San Juan de Ocotán Zapopan, Jalisco 45019, Mexico
3
Department of Geospatial Information Services, Ministry of Environment, Morodok Techo Building No. 503, Tonlebassac, Phnom Penh 12301, Cambodia
4
Independent Expert, Leadville, CO 80461, USA
*
Author to whom correspondence should be addressed.
†
The views expressed in this publication are those of the author(s) and do not necessarily reflect the views or policies of FAO.
Forests 2021, 12(1), 99; https://0-doi-org.brum.beds.ac.uk/10.3390/f12010099
Submission received: 9 December 2020
/
Revised: 5 January 2021
/
Accepted: 8 January 2021
/
Published: 18 January 2021
(This article belongs to the Special Issue REDD+: Protecting Climate, Forests and Livelihoods)
Abstract
:This article discusses the importance of quality deforestation area estimates for reliable and credible REDD+ monitoring and reporting. It discusses how countries can make use of global spatial tree cover change assessments, but how considerable additional efforts are required to translate these into national deforestation estimates. The article illustrates the relevance of countries’ continued efforts on improving data quality for REDD+ monitoring by looking at Mexico, Cambodia, and Ghana. The experience in these countries show differences between deforestation areas assessed directly from maps and improved sample-based deforestation area estimates, highlighting significant changes in both magnitude and trend of assessed deforestation from both methods. Forests play an important role in achieving the goals of the Paris Agreement, and therefore the ability of countries to accurately measure greenhouse gases from forests is critical. Continued efforts by countries are needed to produce credible and reliable data. Supporting countries to continually increase the quality of deforestation area estimates will also support more efficient allocation of finance that rewards REDD+ results-based payments.
Keywords:
forest monitoring; uncertainty; REDD+; reference levels; data quality; Cambodia; Ghana; Mexico1. The Important Role of Forests in Climate Change Mitigation
To maintain global warming within a 1.5 degree Celsius increase, we need to both reduce emissions and remove CO2 from the atmosphere [1]. While reducing fossil fuel-related emissions is most critical, 11% of global carbon emissions stem from deforestation and forest degradation [2] and 98% of deforestation happens in developing countries [3]. Furthermore, unless a new cost-effective technology is discovered, only forests can remove CO2 from the atmosphere at the scale needed to meet the Paris Agreement [4,5]. Therefore, to avoid dangerous climate change, we need to reduce emissions from deforestation and forest degradation in the short term and restore forests to remove carbon from the atmosphere in the longer term. Countries have made climate change mitigation pledges, called Nationally Determined Contributions (NDCs), under the Paris Agreement. Many such targets include forest-related greenhouse gases (GHGs). Such targets, however, are only as good as a country’s ability to measure and monitor emissions (and removals) from forests.
One important vehicle for climate change mitigation through forests is REDD+ (Reducing emissions from deforestation and forest degradation and the role of conservation, sustainable management of forests and enhancement of forest carbon stocks in developing countries). REDD+ was negotiated under the United Nations Framework Convention on Climate Change (UNFCCC), in recognition of the importance of forest management in developing countries for climate change mitigation. Included within the concept of REDD+ is the provision of financial resources to developing countries that slow, halt, and reverse deforestation, referred to as “results-based finance”. Such finance is dependent on National Forest Monitoring Systems (NFMS) that are accessible, transparent, reliable, credible, and can support national processes [6], including providing data and information for REDD+ reporting. There are limited financial resources to reward REDD+ performance; therefore, accurate REDD+ data can promote the efficient use of such resources. To estimate emissions from deforestation, countries often use a fixed emission factor and monitor how deforestation area changes. Whether deforestation emissions have gone down is then largely determined by the deforestation area assessments. This article therefore discusses data quality in monitoring forest area changes for REDD+ reporting.
2. Recent Developments in Measuring Forest Area Changes
The last decade has seen a revolution in forest monitoring that has supported the development of (multi-purpose) NFMS in many countries. More and higher resolution satellite imagery, global tree cover change products, and advanced algorithms for analyzing dense time series that distinguish between seasonal trends and real tree cover changes have increasingly become available [7,8,9]. Open source software [10,11,12] (openforis.org) and platforms [13] (sepal.io) have been developed allowing countries (even with limited access to internet) to access and analyze a wealth of satellite imagery to create land cover and land use change maps and collect sample plot data (either for collecting training data for map classification or for collecting reference data). Where it once took countries months to put together Landsat mosaics to create a map, countries can now complete such tasks in a few hours [14]. Furthermore, new practices have been developed to improve assessments of deforestation, notably sample-based methods have come to replace traditional map-based area estimates [15,16,17].
Rapid technological development and more than a decade of REDD+ support has enabled significant progress in REDD+ reporting. REDD+ reporting to the UNFCCC started after the creation of the Warsaw framework for REDD+ at the 19th UNFCCC Conference of the Parties (COP19), held in November 2013 in Warsaw [18]. After this, countries could submit REDD+ forest reference (emission) levels, benchmarks expressed in tons of CO2 equivalent (tCO2eq) for assessing REDD+ performance, to the UNFCCC. Between November 2013 and December 2020, 50 developing countries submitted a forest reference level to the UNFCCC based on estimates of historical emissions and/or removals from their forests [19]. Countries have, for decades, reported forest statistics to FAO’s global forest resources assessment but submitting to the UNFCCC is an increased level of transparency and exposes a country to a new technical assessment. In 96% of cases, such assessments resulted in countries submitting a modified forest reference level and for 77%, countries changed the reference level value [19]. This is a signal of improvements being made as a result of this process, but it is not necessarily a good indicator of data quality. While technical assessment reports include overall assessments of whether the information in submissions are transparent and complete, they do not provide consistent assessments on accuracy, a key indicator of data quality. One reason is the challenge of assessing data remotely. Experts can only compare the estimates against other statistics reported by the country, or against third-party assessments such as data provided through global products—although these are not necessarily more accurate.
3. The Value of Global Forest Area Change Products in REDD+ Reporting
Global products, especially the Global Forest Change (GFC) product [7] and the recently released Tropical Moist Forest product [20] provide useful information and, in some locations, data of high quality. Both products provide spatially explicit and freely accessible results from time-series analysis of Landsat images characterizing tree cover extent and change. They can, however, differ from national assessments of forest area, deforestation, and deforestation trends. This difference is explained either by tree cover (or tree cover change) not translating well into forest area (or forest area change), or due to one or the other assessment being inaccurate.
Despite differences between global tree cover (or change) and national forest cover (or change) assessments, global products can still be useful to countries in their national assessments. Several countries (e.g., Ethiopia, Liberia, Equatorial Guinea, Nigeria, Sri Lanka, and Zambia) have made use of GFC data as an interim step in their forest area change assessments, either by ‘translating’ it into a forest area change map used for stratification of their sample-based assessment, or through the identification of training data for forest/tree cover loss [21,22,23,24,25,26]. The final deforestation assessments of the above-mentioned countries were in most cases significantly different from GFC tree cover loss, indicating substantial additional effort required by countries. For Sri Lanka and Nigeria, the national deforestation assessments were 19% and 23%, respectively, higher than the GFC estimated tree cover loss. Equatorial Guinea assessed deforestation 54% below GFC tree cover loss and Zambia and Ethiopia measured deforestation 80% and 300% higher than GFC tree cover loss. Landsat is known to perform poorly in detecting trees in dry and open forest, due to the resolution [27], which most likely explains the large discrepancies with GFC data.
In some cases, the GFC product is very close to national assessments. For example, GFC estimates of tree cover loss in Paraguay are only 4% different from the national deforestation estimate; similarly, the difference in GCF tree cover loss and Colombia’s estimates of forest loss in the Amazon are just 5% different [28], though the country-wide estimate is 37% different [29]. In cases where the overall estimates of forest or tree cover loss are similar, it does not necessarily mean that the analysis of where such loss occurred is similar, for which an accuracy assessment gives a better indication. Ghana used a 4 by 4 km systematic grid to assess the accuracy of GFC data and found a user accuracy of 3% (out of 59 loss points suggested by GFC, only 2 were deforestation) and a producer accuracy of 4% (of the 46 points of deforestation in the reference data, 44 had not been classified as tree cover loss in GFC) [30]. By contrast, Sri Lanka’s forest area change map (which is a combination of its nationally created forest map and tree cover loss from the GFC product) had a user and producer accuracy of 79% and 89% respectively [25]. By using its national forest map and only considering GFC loss within its forest, Sri Lanka managed to filter out many tree crop dynamics.
A frequent explanation of the difference between national and GFC estimates is that tree crop harvesting is included in tree cover loss estimates in the global product but not considered deforestation in national assessments and that small patches of tree loss may be considered as degradation, rather than deforestation, in national data. During the technical analysis of Uganda’s REDD+ results submitted to the UNFCCC, the assessors noticed Uganda’s deforestation assessment for 2015–2017 was a factor three lower than GFC tree cover loss [31]. Uganda looked into the difference, re-assessing 49 plots that were stable in Uganda’s assessment and loss in GFC. Of these 29 plots, 60% were harvesting in plantations, the others concerned degradation (logging/fire) [32].
In conclusion, global products can provide a useful starting point for some countries, but significant additional effort is required to convert these into robust deforestation estimates. Furthermore, there are many benefits to countries analyzing their own data and developing a NFMS for reporting as well as informing national decision-making processes. Accessible, transparent, reliable, credible, and relevant NFMS can result in better decision making for forests and have contributed, for example, to driving down deforestation in Brazil, and the implementation of sustainable forest management in Cameroon [6].
4. How Countries Have Increasingly Come to Use Sample-Based Area Estimation
As countries were invited to report on REDD+ to the UNFCCC, many started by building on existing land cover analyses. Several countries had forest maps for different years. In many cases, countries assessed forest change through post-classification, i.e., comparing two separately created classifications against each other to estimate forest loss (and sometimes gain). This approach is prone to the escalation of classification errors [33].
More recently, countries are using direct change detection, where images are compared to assess change instead of comparing classifications [19,34]. However, this method will still contain classification errors some of which may be systematic [35,36,37,38].
Reporting area statistics directly from maps (regardless of classification errors) is referred to as pixel counting. In theory, if maps were perfect, pixel counts would provide an ideal solution for reporting on land cover and land cover change areas. Using pixel counts to calculate areas from maps enables the production of consistent data at all spatial scales, down to the resolution of the map itself. This approach has obvious advantages in terms of (apparent) simplicity and making the dataset easy to use, derive, and present. It would also allow area estimates of forest changes that are consistent at all scales, and ensure the “sum of the parts equals the whole”. However, this approach also carries errors and biases at all scales [35,36,37,38].
Map accuracy can be assessed through sample unit observations. Ground observations are generally accepted as the most accurate source of information for these assessments but may be cost-prohibitive to acquire, particularly for remote and inaccessible forest regions [38]. Instead of ground observations, visual interpretations of remotely sensed data such as aerial imagery or satellite imagery are often used under the assumption that such interpretations are of higher quality than the map data [15,39]. Accordingly, remote sensing literature has increasingly suggested that area estimates (for example, of forest loss) should be made using the sample-data collected for the accuracy assessment and correcting for classification errors. This also provides a means to estimate the associated confidence interval around the estimate of, e.g., forest loss, which is needed to report uncertainty [16,17,35,36,37,38,39,40]. Estimates using information from the error matrix produced in map accuracy assessment are referred to as stratified area estimates.
The Intergovernmental Panel on Climate Change has developed guidelines for national GHG inventories, which state that estimates should neither over- nor under-estimate emissions (or removals) and that countries should report the uncertainties of GHG estimates [17,41]. The Global Forest Observation Initiative [16] indicates sample-based estimates allow to correct for systematic errors while pixel-counting methods provide no assurance that estimates are “neither over- nor under-estimates” or that “uncertainties are reduced as far as practicable”.
Sample-based estimates can use a systematic or simple random design, or stratified design where a change map is used to stratify the sampling (stratified area estimates). Locating sample points with a change map gives a more efficient sampling design [42], as long as the change map is of sufficient quality. Table 1 provides an overview of the main differences between pixel counts, systematic or random sample estimates, and stratified area estimates.
Over the past years, countries have made important improvements in forest monitoring for REDD+. Of the 50 countries that submitted a reference level to the UNFCCC in 2020, eight countries submitted more than once, in most cases introducing improvements [19]. Of the 18 countries participating in the Forest Carbon Partnership Facility (FCPF) Carbon Fund, many are expected to introduce improvements to their reference levels when submitting their monitoring reports containing emission reductions achieved. Although to date only one country submitted a monitoring report, many are expected to do so over the coming years. We selected three cases where countries replaced post-classification pixel counts with sample-based estimates: Mexico, Cambodia, and Ghana. These are the only known country examples to the authors where post-classification pixel counts were replaced by sample-based estimates in REDD+ reporting. Of the UNFCCC submissions, there is one other country (Madagascar) that replaced a pixel count estimate with a sample-based estimate, but the former estimate was a direct change assessment, not a post-classification approach. The improvements introduced by Mexico, Cambodia, and Ghana illustrate the relevance of reliable REDD+ reporting.
4.1. Mexico
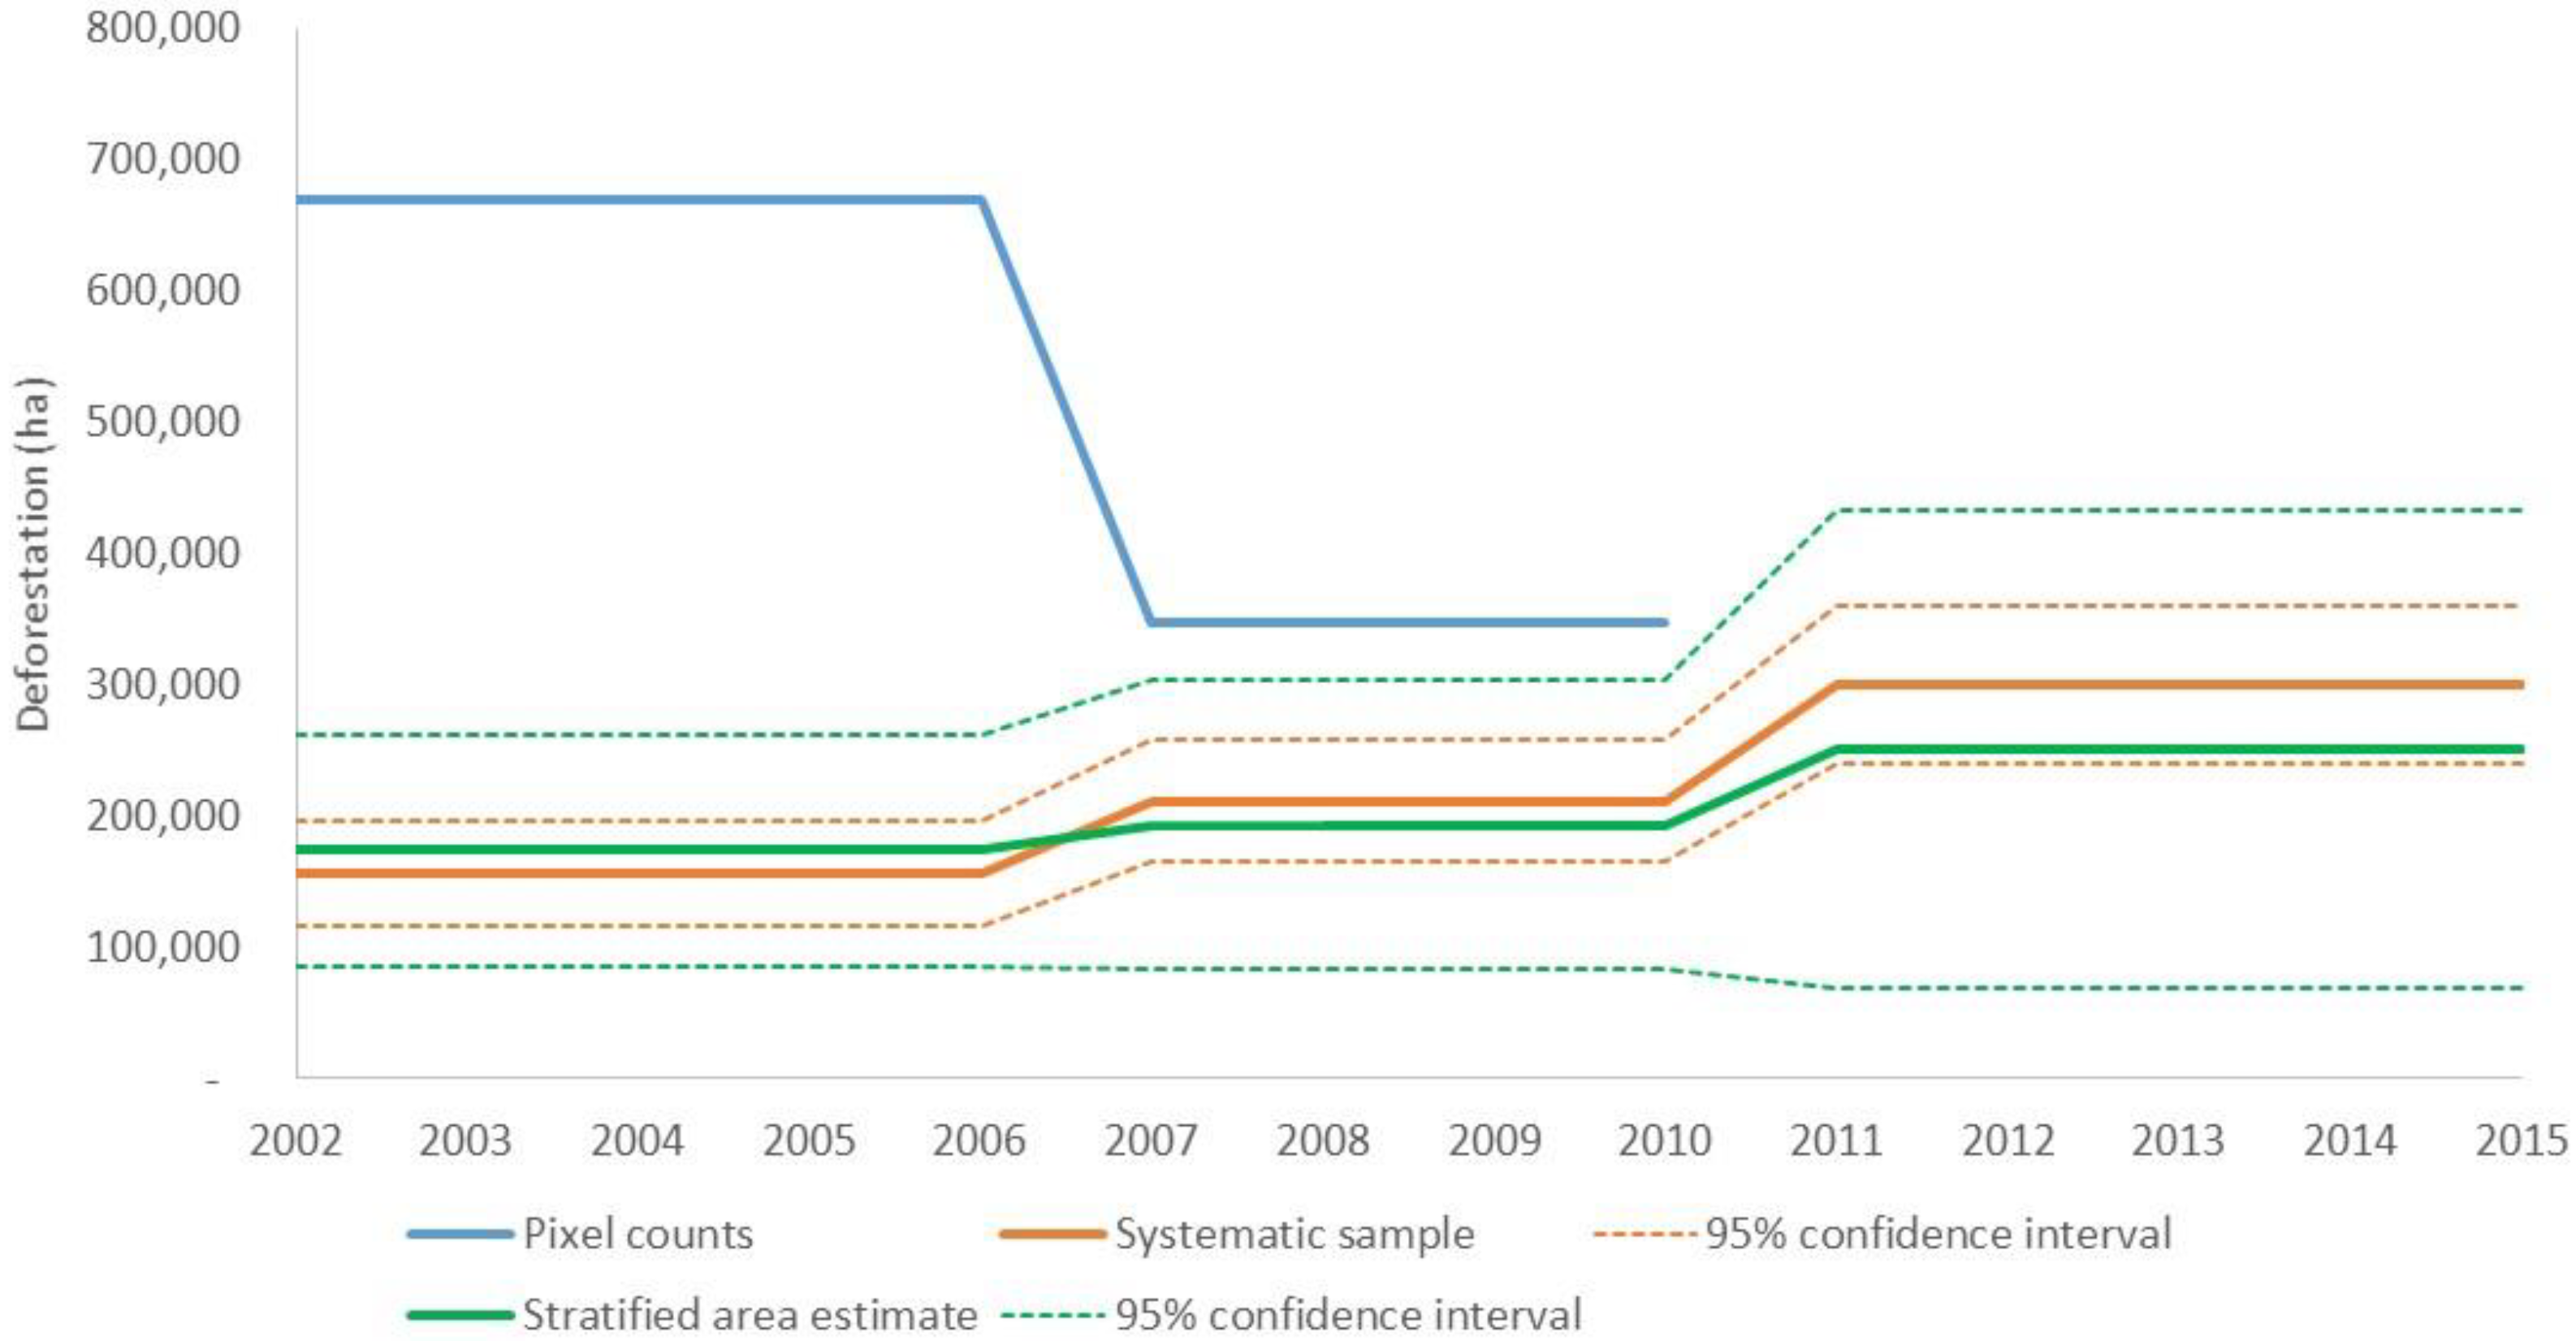
Mexico submitted a REDD+ reference level in 2015 [43] and an improved reference level in 2020 [44] to the UNFCCC. The first submission was post-classification pixel counts; the second submission applied a sample-based estimate using a systematic intensified grid. The first reference level value of historical annual average emissions from deforestation over 2000–2010 was 44.4 million tCO2eq/year. The second reference level for emissions from deforestation over 2007–2016 was estimated at 16.2 million tCO2eq/year. Both reference level submissions included the same pools, above and below ground biomass. The difference between these two estimates are not due to emission reductions from REDD+ efforts, but instead relate to the improved methodology to estimate emissions. Figure 1 shows deforestation estimates in hectares between 2002–2010/2015 using three different methods. One of these methods uses pixel counts (used for the first reference level), one an intensified systematic sample (used for the second reference level), and one a stratified area estimate [45] (used for GHG reporting in Mexico’s 6th national communication). The stratified area estimate used the forest change map from the first reference level to stratify a random sample. The systematic sample estimate contains 26,220 plots, while the stratified area estimate contains 3771 plots for the period 2002–2006, 3737 plots for the period 2007–2010, and 3866 plots for the period 2011–2015. The two sample-based estimates use independently collected sample plots. Pixel counts do not allow for the calculation of a confidence interval around the area estimate, as explained above, while both sample-based approaches allowed for the calculation of confidence intervals, which are included in Figure 1. Deforestation estimates based on the two sample-based approaches differ less than 20% from each other and both fall within each other’s confidence intervals. The pixel count estimate for 2002–2006, however, suggests deforestation was approximately four times higher than that estimated using sample-based methods. Furthermore, the pixel count assessment suggests a steep decline in deforestation between 2002 and 2010, whereas both sample-based methodologies suggest a slight increase for this same period.
In its first reference level, Mexico omitted the uncertainty around activity data and only included the uncertainties of emission factors. Its reported confidence interval around the emission estimate was 2% suggesting a high level of precision. In its improved emission estimate in the second reference level, the uncertainty analysis was more complete covering more sources of error and therefore, despite the estimate being more accurate, the confidence interval increased to 7% [46]. The aggregate uncertainty is a combination of the uncertainty of activity data (in Figure 1) and emission factors, where the latter is very small due to the large number of plot measurements in the national forest inventory.
4.2. Cambodia
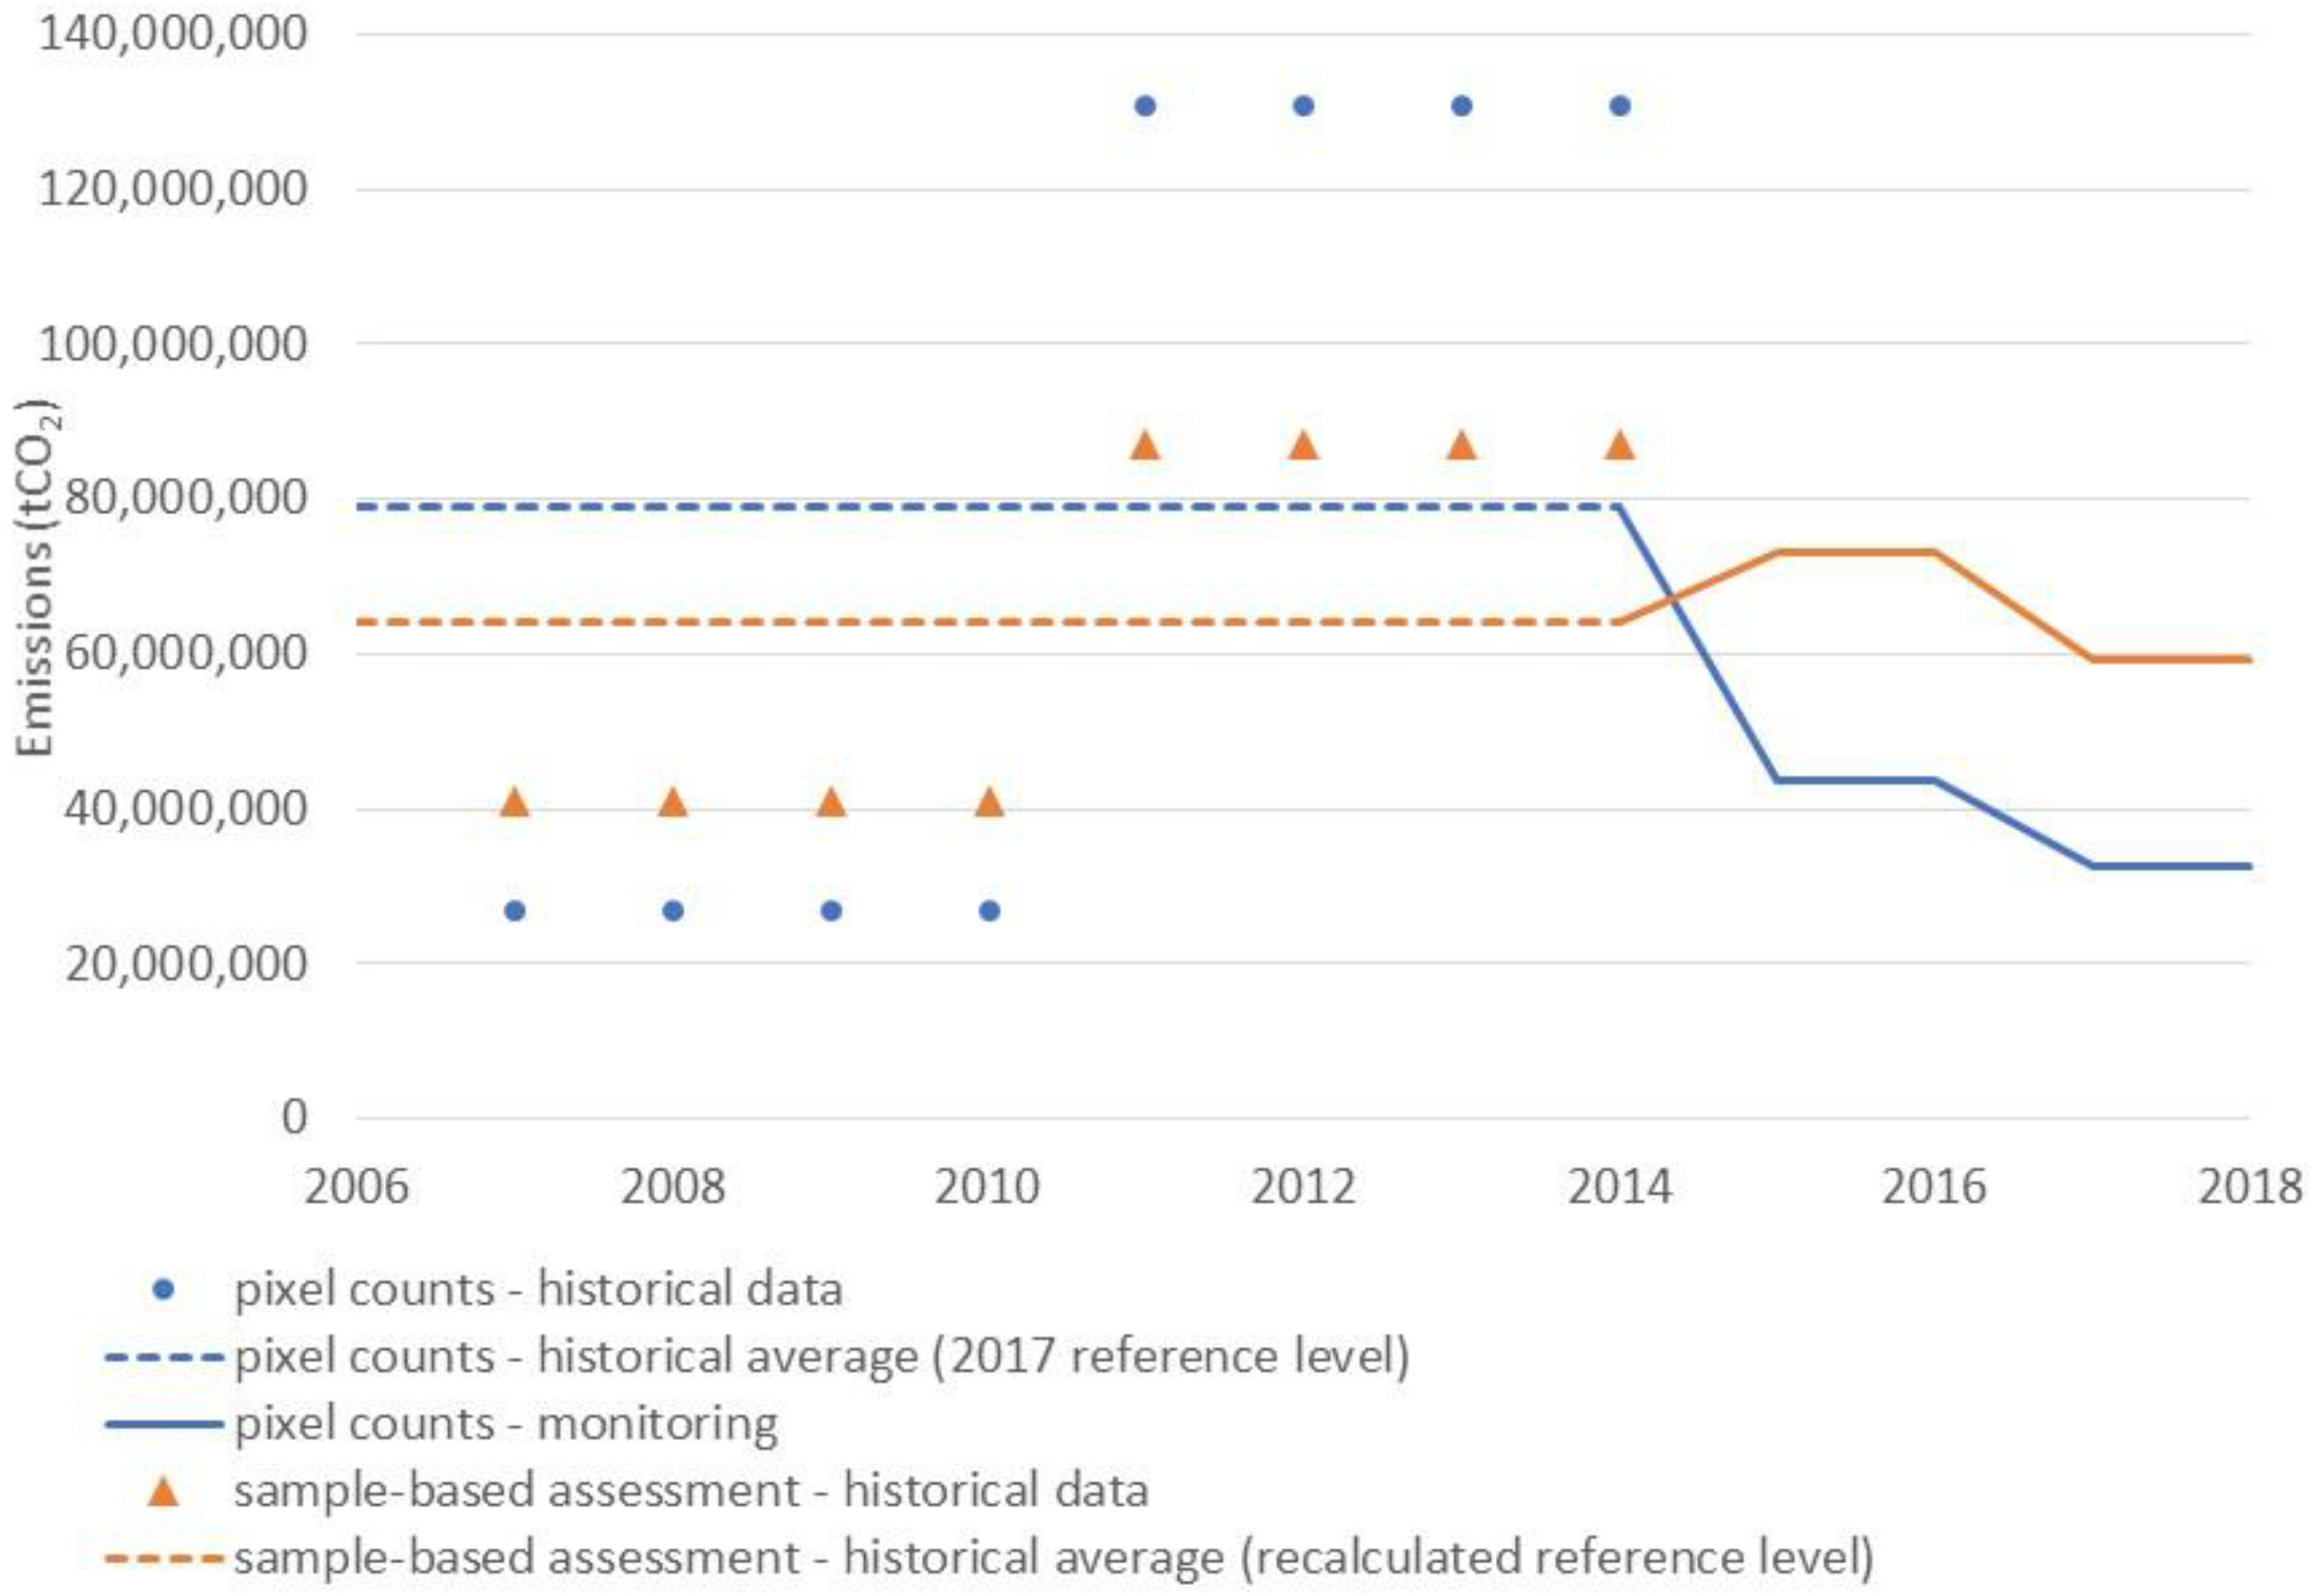
Cambodia submitted a reference level to the UNFCCC in 2017 [47] and submitted REDD+ results in the technical annex of its biennial update report to the UNFCCC in September 2020 [48]. The guidance in COP decisions is for countries to maintain full consistency in the use of estimation methods between the technically assessed reference level and the results reported. Cambodia therefore assessed results as map areas obtained through post-classification pixel counts. However, prior to submitting REDD+ results, the country implemented a sample-based forest area change assessment based on a stratified area estimate. The stratified area estimate was obtained by post-stratifying a systematic 6 km × 6 km sample of 4921 plots using the forest area change map used in the reference level and results submissions. For transparency, Cambodia included these improved results in an annex. The post-classification methodology suggested that Cambodia had emission reductions of 163 million tCO2eq for 2015–2018. By contrast, the sample-based estimate suggests results were limited to the period 2017–2018, totaling 9.5 million tCO2eq (Figure 2).
4.3. Ghana
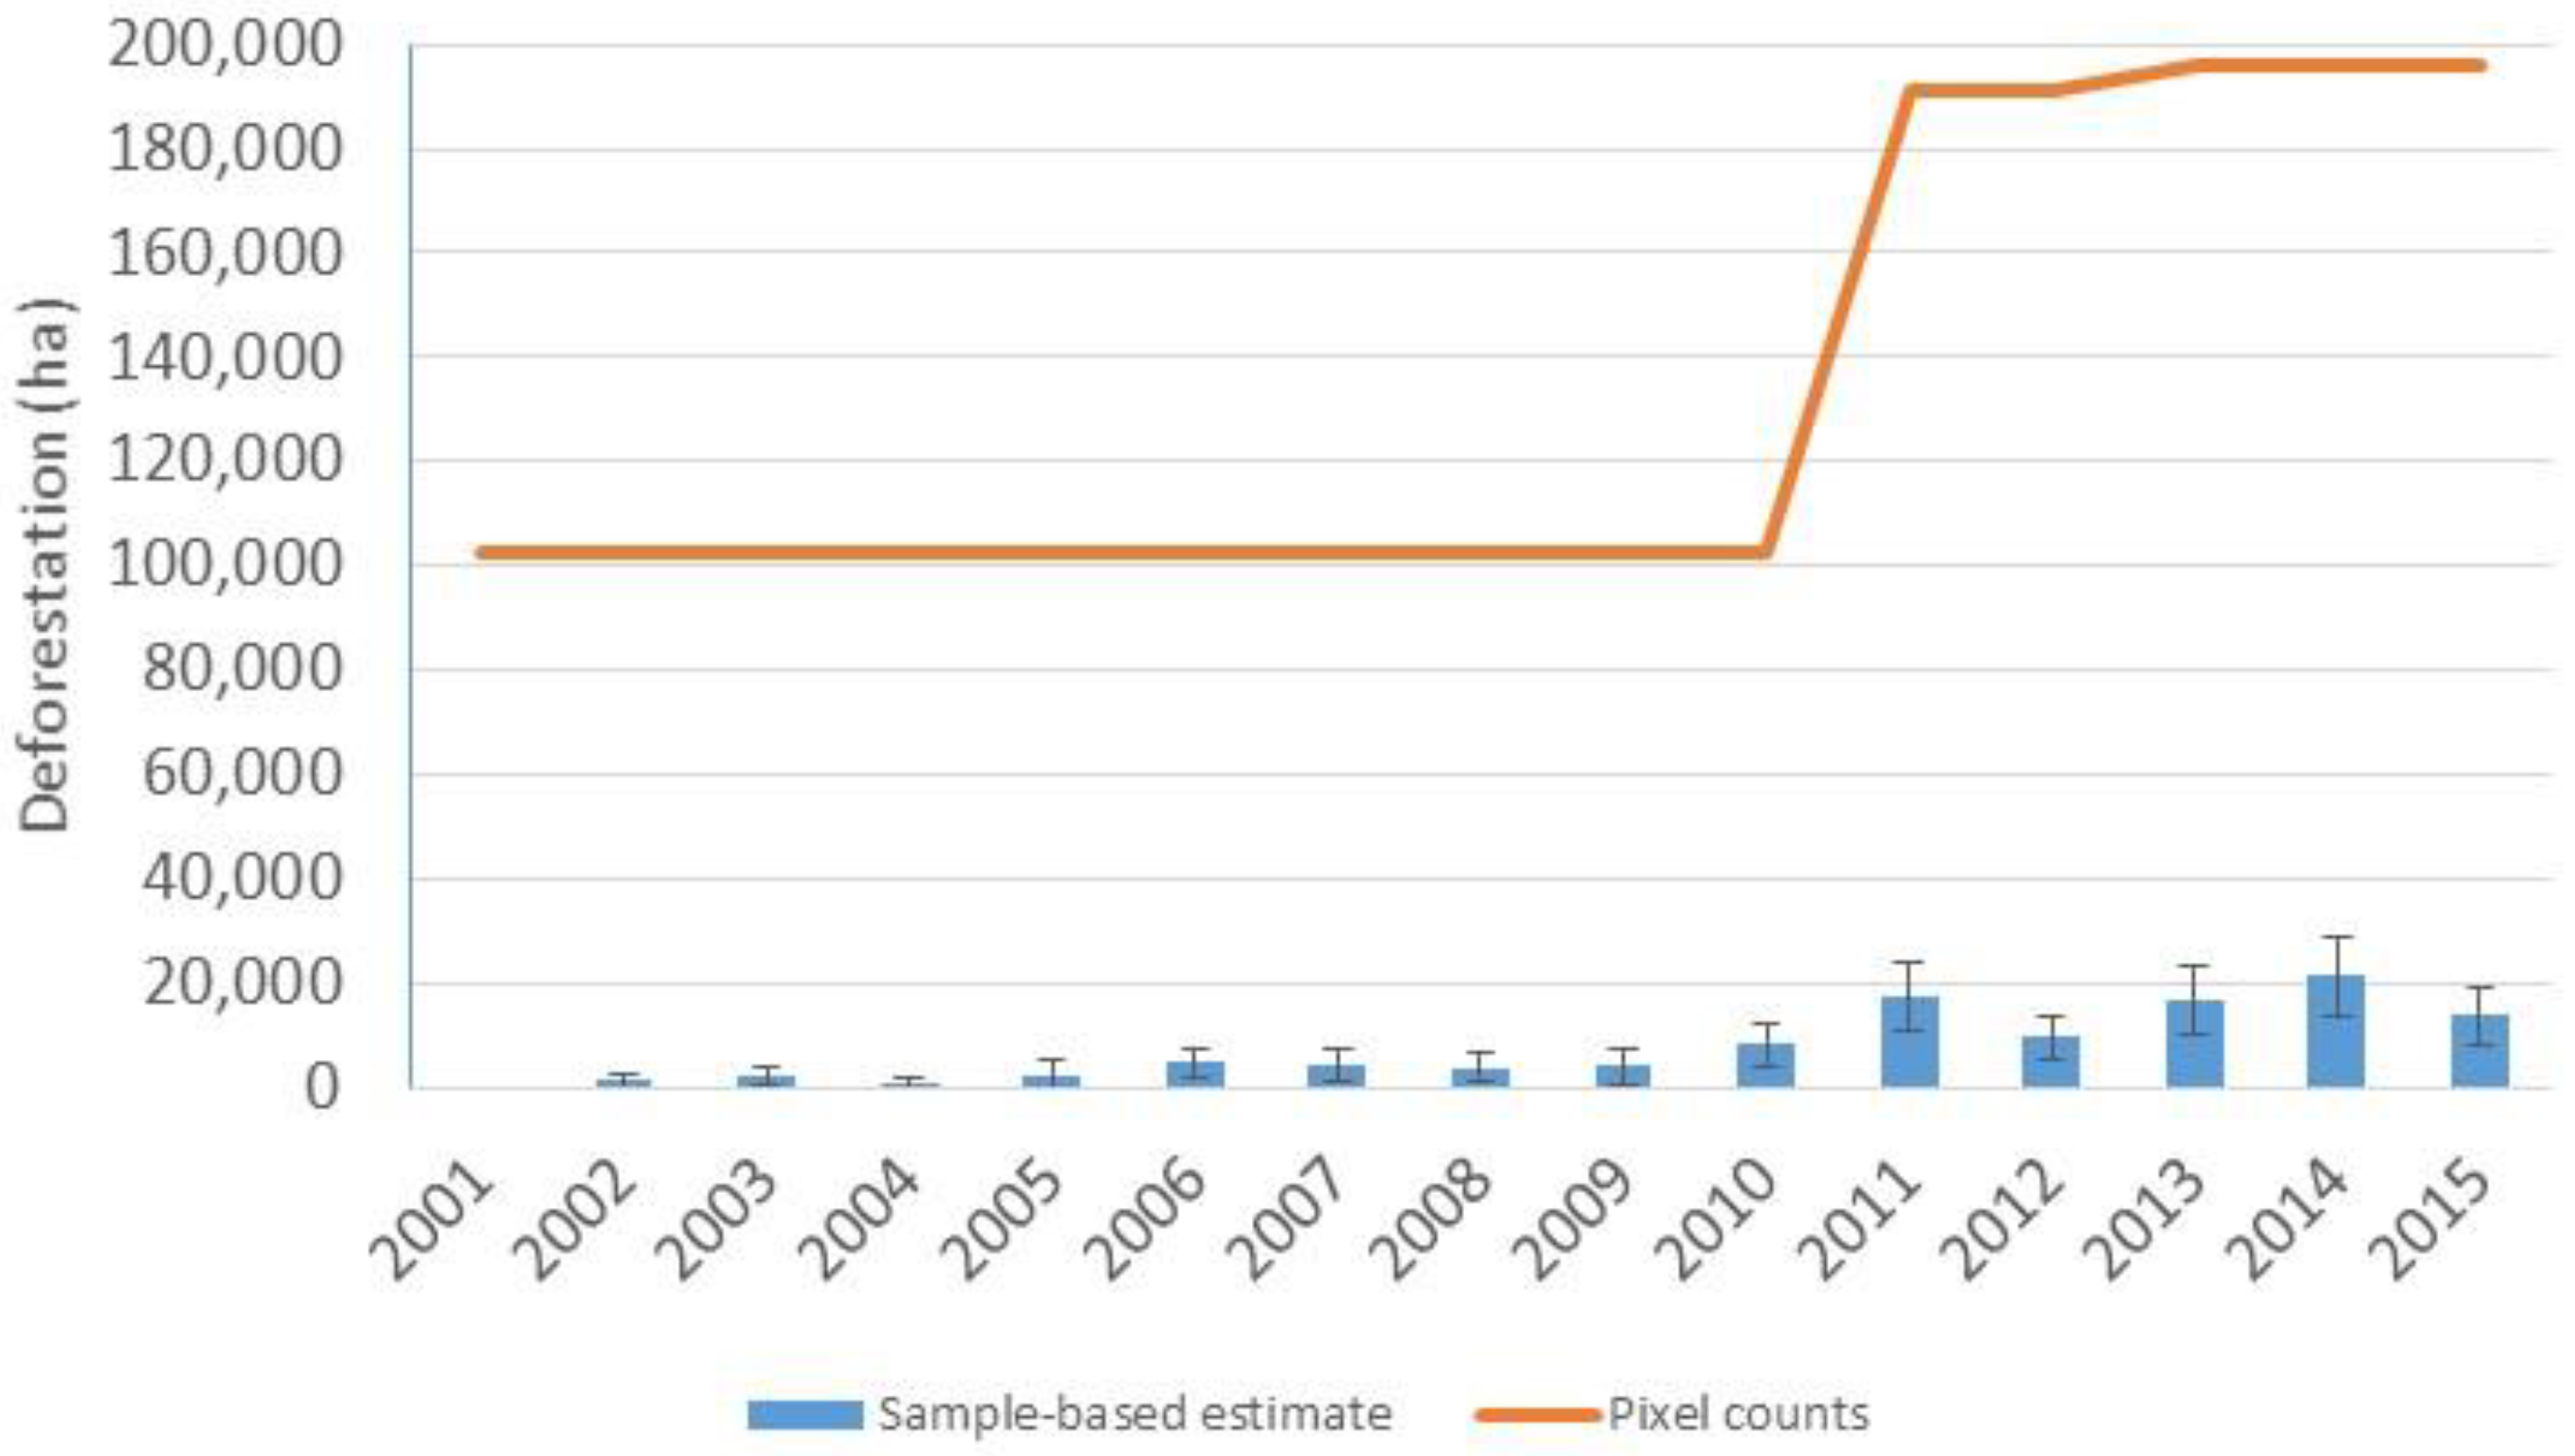
Ghana submitted a reference level for the cocoa landscape to the FCPF Carbon Fund in 2017 [49]. The methodology used in the initial submission was pixel counts obtained through post-classification. Ghana replaced this methodology by an intensified systematic sample containing 7689 plots. Creating forest area change maps of Ghana’s cocoa forest mosaic landscape is particularly challenging due to the difficulties of distinguishing between cocoa and forest and the scattered dynamics in the landscape. This is illustrated by the very low user and producer accuracy of the GFC product discussed in Section 3 of this article. The initial deforestation assessment was 138,624 ha/year for the reference period 2005–2014. This deforestation estimate was re-assessed at 9197 ha/year for the same period with the improved methodology (Figure 3) [30], which is currently undergoing validation.
Ghana’s initial reference level submitted in 2017 for deforestation within the cocoa landscape was 27.7 million tCO2/year. The recalculated reference level [30], subject to validation, is 4.1 million tCO2/year.
In the examples of Mexico, Cambodia, and Ghana, pixel counts were much higher than the sample-based estimates. This is not uncommon with post-classification due to the escalation of classification errors having a large impact on rare change classes [33]. Pixel counts of forest loss can also be much lower than sample-based estimates, especially where pixel counts are extracted from direct change assessment maps applying an algorithm that is conservative in detecting change. For example, Madagascar’s deforestation emissions estimate increased by 60% when pixel counts were replaced with sample-based activity data [50].
The above examples illustrate the importance of continued efforts to improve NFMS and data quality. The three countries all had technically assessed reference levels where, in each case, the UNFCCC technical assessment reports concluded data and information provided was transparent, complete and in overall accordance with the guidelines contained in the Warsaw Framework. Nonetheless, these countries recognized the importance of continuing to improve their data resulting in significant revisions of their initial emission estimates.
5. High Uncertainties and Large Revisions also Happen in Annex I Countries
Uncertainties in Annex I forest and land use related GHG inventories tend to be higher than in other sectors [51]. The most recent inventory report for the European Union (EU), for example [52], states the uncertainty of fuel combustion is 0.8%, while the uncertainty of GHG estimates in the land sector is over 22%. Though high compared to uncertainties in the energy sector, uncertainty reporting did improve substantially over the past years as the uncertainty for the land sector reported by the EU was 41% in the 2016 inventory [53]. At the country level, these uncertainties can be even higher. For example, Austria’s average uncertainty of the total emissions/removals from the land sector ranged from 85 to 220% (for GHG inventories reported from 1990 to the present), largely due to uncertainties in the litter and soil pools in the forest category (the average uncertainty drops to 37% if these pools are not included) [54]. It should be noted that, when the next flux is close to zero because emission and removal fluxes compensate each other, the percentage uncertainty may be particularly high.
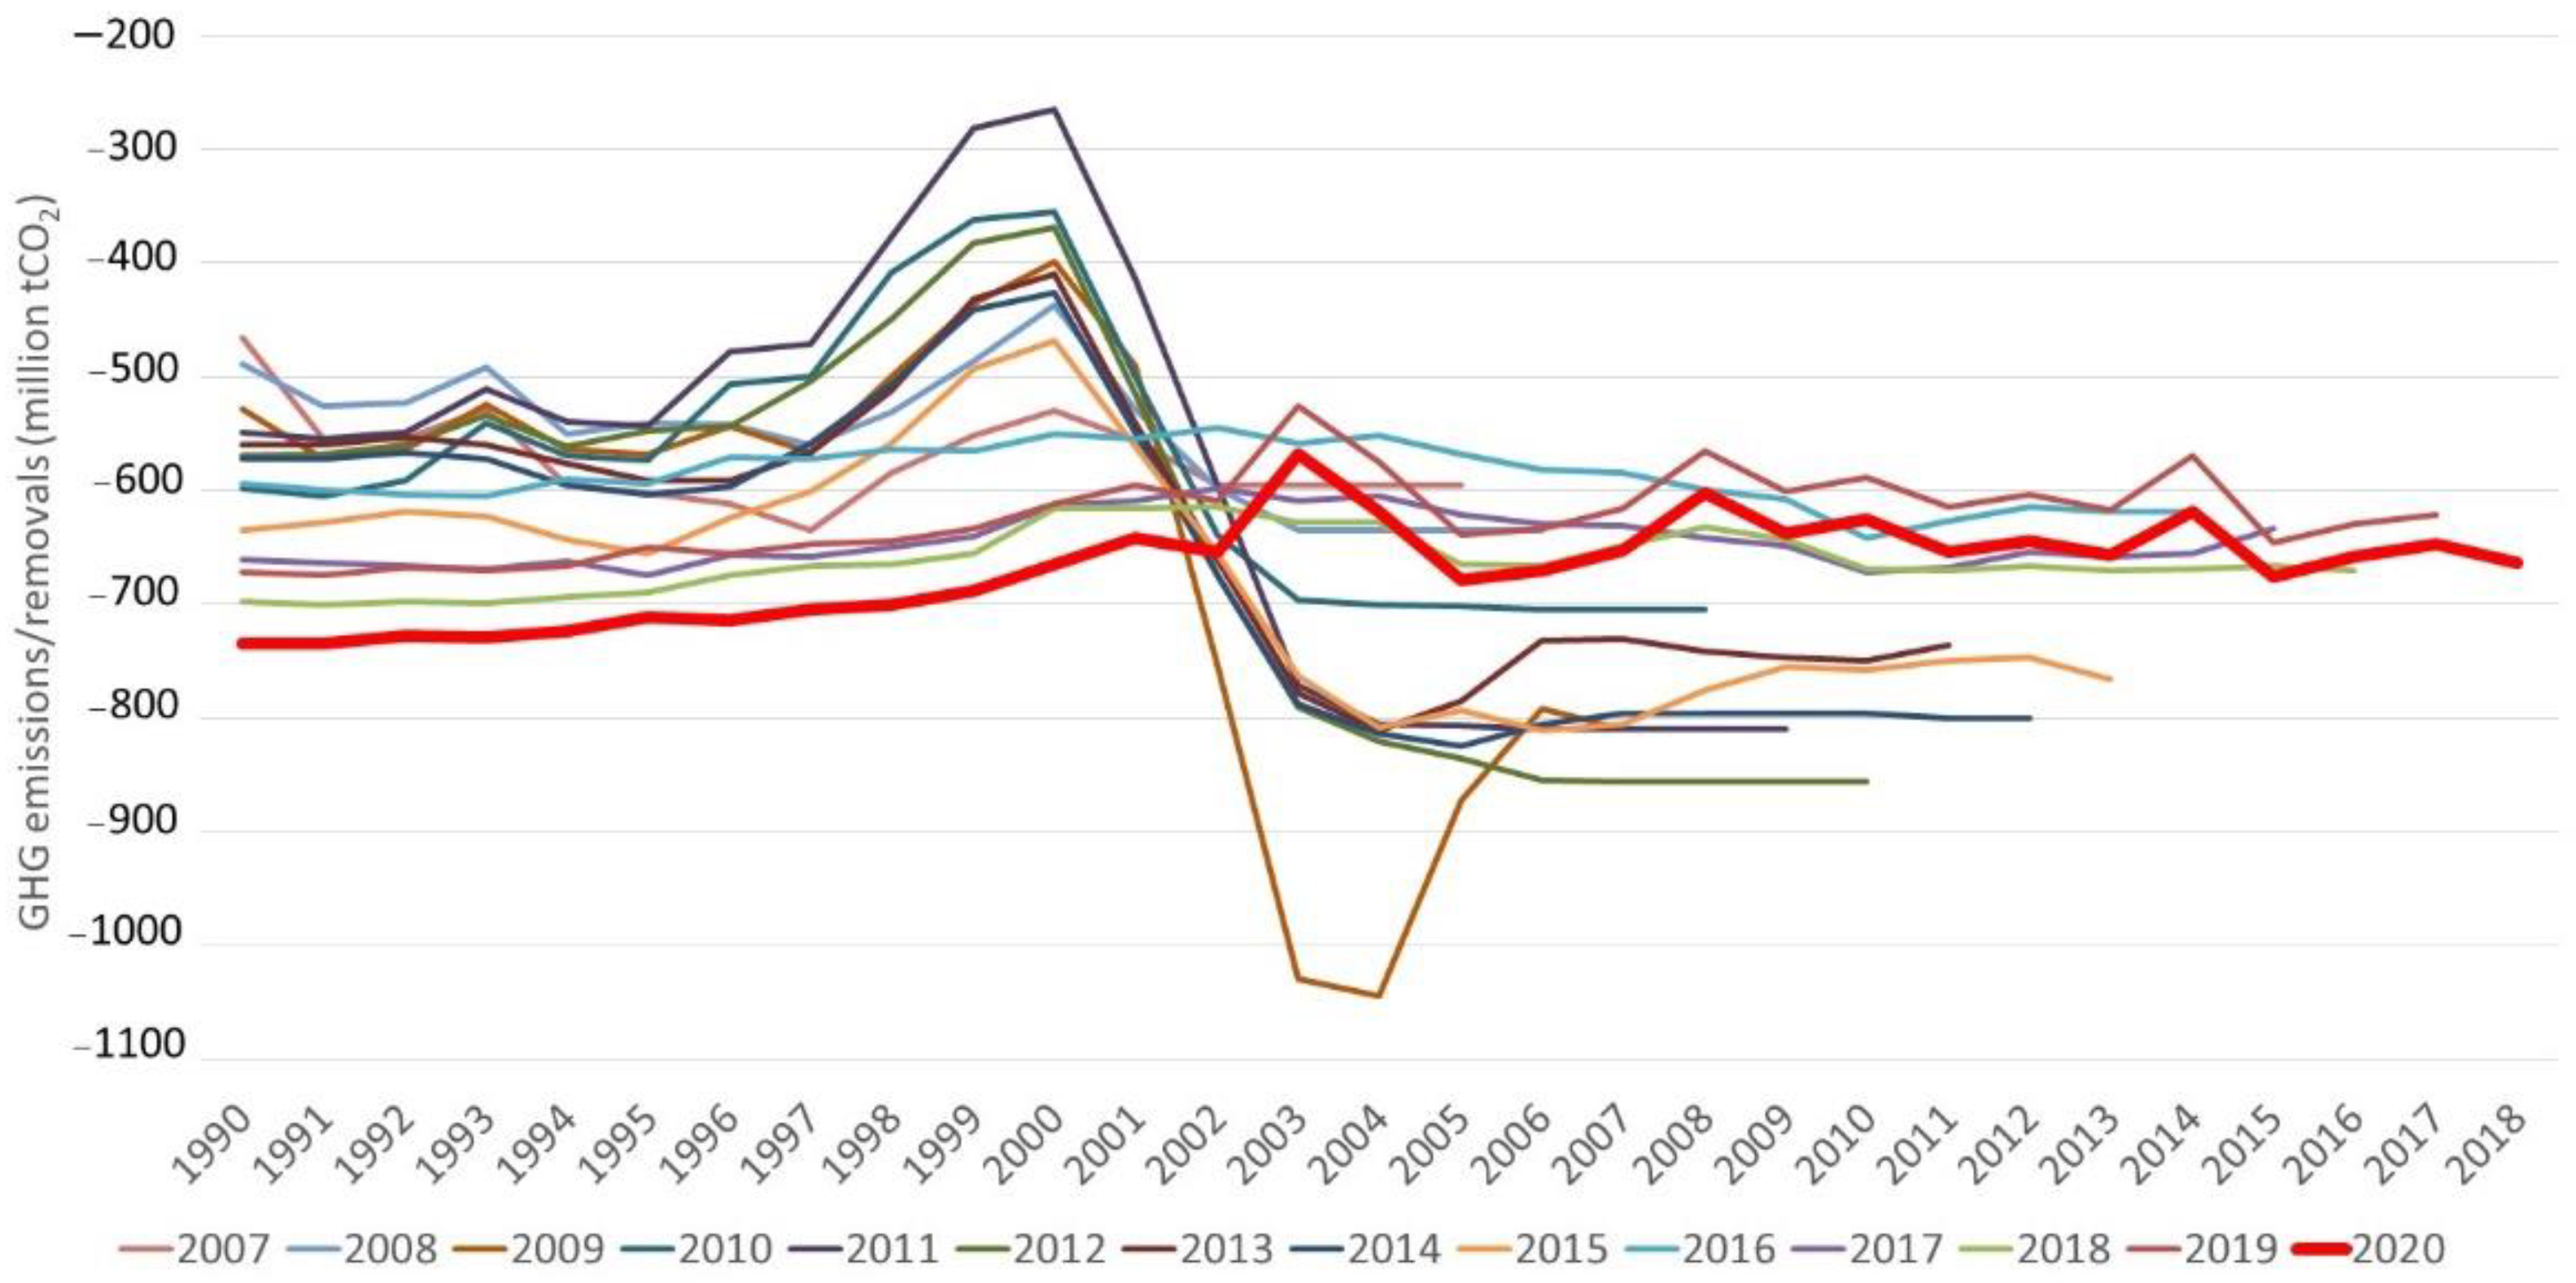
Data quality in the forest sector is important for all countries, not just those intending to access REDD+ finance. For example, high quality data can improve countries’ Paris Agreement targets [55]. Significant revisions in emission estimates associated with re-assessments of emissions (or removals) from forests and other land use are not only happening in developing countries. For example, comparing the annual GHG inventories reported by the United States illustrates how, over time, removals from forest land remaining forest land changed as the US improved its data. Figure 4 illustrates how recalculations of removals changed the GHG estimates—in some cases by hundreds of millions of tCO2eq [56]. In addition, the trend assessment changed over time—for example, the 2010 inventory assessed removals from forest land to be declining from 1990 to 2008, however, the 2020 recalculation suggests removals were increasing during that same period. Such changes make it difficult to both establish climate targets, as well as track progress towards or deviations from such targets [57].
Uncertainties in forest land converted to other lands, or deforestation, in Annex I inventories can also be high. For example, GHG estimates from forest land converted to cropland are around 80% uncertain in the most recent 2020 US GHG inventory [56]. Similarly, the uncertainty of CO2 emissions from the same category in Canada’s 2020 GHG inventory are over 200% [58]. It is to be expected that GHG estimates of forest land conversion in Annex I inventories are higher than in tropical forest countries since deforestation is a rarer event and in many cases more pools (such as soil carbon) are included in the estimation.
6. Discussion and Conclusions
This paper highlights data quality issues associated with pixel count estimates as opposed to sample-based estimates, but it would be an over-simplification to suggest data quality issues are limited to this. Countries are making improvements on many other fronts, not least in improving pixel count estimates to create more accurate (change) maps. Furthermore, sample-based estimates are not necessarily always of high quality, as the quality of sample-based estimates is strongly reliant on the quality of the reference data [39], which in turn depends on the training of the interpreters, clarity of definitions and interpretation keys, and resources available to the interpreters. Furthermore, under-sampling in large stable classes with stratified area estimates may introduce considerable uncertainty in parameter estimates obtained from the sample data [38]. Global products, in particular the GFC product, can form a useful starting point for countries in their forest area change assessments but countries need to evaluate and modify them, for example, to respond to their national forest definition. Discrepancies may be particularly large in countries with a high level of tree crop or plantation dynamics (e.g., Côte d’Ivoire, Uganda) or in dry forest landscapes with scattered small-scale deforestation (e.g., Ethiopia, Zambia), where global products tend to perform poorly. There are also many ancillary benefits to countries in developing a (multi-purpose) National Forest Monitoring System to support national processes for improved forest and land management.
It is important that countries continue to improve their data to produce reliable estimates of forest-related emissions and removals. The need for continued efforts to improve measurement and reporting of land sector GHGs by all countries should not be underestimated. Doing so will improve the ability of countries to set Paris Agreement targets, as well as report on the achievement of them.
With the promise of REDD+ results-based payments, countries are making immense efforts in collecting better data on their forest resources, data that can serve the country beyond REDD+ in their national forest policy making and NDC implementation. Multi-purpose forest monitoring can support decision making within the country, and the implementation of activities that result in emission reductions and enhancements. Improvements in data quality can also support governments developing jurisdictional programs aiming to access results-based payments, or to issue carbon credits, for example under the World Bank’s Carbon Fund or the emerging Architecture for REDD+ Transactions, which have more stringent requirements but can access carbon market finance. Country progress made on REDD+ reporting is encouraging and hopefully, in the future, can demonstrate that forests are on their way to realizing their mitigation potential, which is critical for achieving Paris Agreement goals.
Author Contributions
Conceptualization, M.S. and J.F.; Mexico case, O.C., Cambodia case, C.L.; Annex I countries, D.L. and M.S.; writing—original draft preparation, M.S.; writing—review and editing, R.d., D.L., J.F.; supervision, J.F. All authors have read and agreed to the published version of the manuscript.
Funding
This research was funded by the Food and Agriculture Organization of the United Nations.
Acknowledgments
The authors would like to acknowledge Till Neeff and two anonymous reviewers for their useful comments provided. Furthermore, the authors would like to acknowledge Ghana’s National REDD+ Secretariat for its contributions to the Ghana case and Giacomo Grassi for his review of references to EU GHG LULUCF inventory reporting.
Conflicts of Interest
The authors declare no conflict of interest.
References
- IPCC. Global Warming of 1.5 °C. An IPCC Special Report on the Impacts of Global Warming of 1.5 °C above Pre-Industrial Levels and Related Global Greenhouse Gas Emission Pathways, in the Context of Strengthening the Global Response to the Threat of Climate Change, Sustainable Development, and Efforts to Eradicate Poverty; Masson-Delmotte, V., Zhai, P., Pörtner, H.O., Roberts, D., Skea, J., Shukla, P.R., Pirani, A., Moufouma-Okia, W., Péan, C., Pidcock, R., et al., Eds.; Intergovernmental Panel on Climate Change: Geneva, Switzerland, 2018. [Google Scholar]
- IPCC. Climate Change 2014: Synthesis Report; Core Writing Team, Pachauri, R.K., Meyer, L.A., Eds.; Contribution of Working Groups I, II and III to the Fifth Assessment Report of the Intergovernmental Panel on Climate Change; Intergovernmental Panel on Climate Change: Geneva, Switzerland, 2014; 151p. [Google Scholar]
- FAO. Global Forest Resources Assessment 2020; FAO: Rome, Italy, 2020; Available online: https://fra-data.fao.org/ (accessed on 1 July 2020).
- Millar, R.J.; Fuglestvedt, J.S.; Friedlingstein, P.; Rogelj, J.; Grubb, M.J.; Matthews, H.D.; Skeie, R.B.; Forster, P.M.; Frame, D.J.; Allen, M.R. Emission budgets and pathways consistent with limiting warming to 1.5 C. Nat. Geosci. 2017, 10, 741. [Google Scholar] [CrossRef]
- Goodwin, P.; Katavouta, A.; Roussenov, V.M.; Foster, G.L.; Rohling, E.J.; Williams, R.G. Pathways to 1.5 C and 2 C warming based on observational and geological constraints. Nat. Geosci. 2018, 11, 102. [Google Scholar] [CrossRef]
- Neeff, T.; Piazza, M. How countries link forest monitoring into policy-making. Forest Policy Econ. 2020, 118. [Google Scholar] [CrossRef]
- Hansen, M.C.; Potapov, P.V.; Moore, R.; Hancher, M.; Turubanova, S.A.; Tyukavina, A.; Thau, D.; Stehman, S.V.; Goetz, S.J.; Loveland, T.R.; et al. High-Resolution Global Maps of 21st-Century Forest Cover Change. Science 2013, 342, 850–853. [Google Scholar] [CrossRef] [PubMed] [Green Version]
- DeVries, B.; Verbesselt, J.; Kooistra, L.; Herold, M. Robust monitoring of small scale forest disturbances in a tropical montane forest using Landsat time series. Remote Sens. Environ. 2015, 161, 107–121. [Google Scholar] [CrossRef]
- Dutrieux, L.P.; Verbesselt, J.; Kooistra, L.; Herold, M. Monitoring forest cover loss using multiple data streams, a case study of a tropical dry forest in Bolivia. ISPRS J. Photogramm. Remote Sens. 2015, 107, 112–125. [Google Scholar] [CrossRef]
- Bey, A.; Sánchez-Paus Díaz, A.; Maniatis, D.; Marchi, G.; Mollicone, D.; Ricci, S.; Bastin, J.-F.; Moore, R.; Federici, S.; Rezende, M.; et al. Collect Earth: Land Use and Land Cover Assessment through Augmented Visual Interpretation. Remote Sens. 2016, 8, 807. [Google Scholar] [CrossRef] [Green Version]
- Tzamtzis, I.; Federici, F.; Hanle, L. A Methodological Approach for a Consistent and Accurate Land Representation Using the FAO Open Foris Collect Earth Tool for GHG Inventories. Carbon Manag. 2019, 10, 437–450. [Google Scholar] [CrossRef]
- Koskinen, J.; Leinonen, U.; Vollrath, A.; Ortmann, A.; Lindquist, E.; d’Annunzio, R.; Pekkarinen, A.; Käyhkö, N. Participatory mapping of forest plantations with Open Foris and Google Earth Engine. ISPRS J. Photogramm. Remote Sens. 2019, 148, 63–74. [Google Scholar] [CrossRef]
- Tenneson, K.; Patterson, M.S.; Lindquist, E.J.; Wiell, D.; Markert, K.; Ellenburg, W.L., II; Ate, P.; Quyen, N.H.; Anderson, E.; Chishtie, F.; et al. A Cloud Based Approach to Synchronize the Advancements in Global Land Cover Mapping. In American Geophysical Union, Fall Meeting 2018, Abstract #B22A-03; Smithsonian Astrophysical Observatory/NASA Astrophysics Data System. Available online: https://ui.adsabs.harvard.edu/abs/2018AGUFM.B22A..03T (accessed on 7 December 2020).
- De Sousa, C.; Fatoyinbo, L.; Neigh, C.; Boucka, F.; Angoue, V.; Larsen, T. Cloud-computing and machine learning in support of country-level land cover and ecosystem extent mapping in Liberia and Gabon. PLoS ONE 2020, 15, e0227438. [Google Scholar] [CrossRef]
- Olofsson, P.; Foody, G.M.; Herold, M.; Stehman, S.V.; Woodcock, C.E.; Wulder, M.A. Good practices for estimating area and assessing accuracy of land change. Remote Sens. Environ. 2014, 148, 42–57. [Google Scholar] [CrossRef]
- GFOI. Integration of Remote-sensing and Ground-Based Observations for Emissions and Removals of Greenhouse Gases in Forests: Methods and Guidance from the Global Forest Observations Initiative (GFOI) 2016, Chapter 5, Section 5.1.5 Estimating Uncertainty of Area and Change in Area. Available online: https://www.reddcompass.org/measurement-estimation?fid=%2Fmgd%2F5.1.5&ver=v2#gfoi-mgd-content (accessed on 20 April 2018).
- IPCC. 2019 Refinement to the 2006 IPCC Guidelines for National Greenhouse Gas Inventories; Volume 4: Agriculture, forestry and other Land Use, Chapter 3: Land Representation; Intergovernmental Panel on Climate Change: Geneva, Switzerland, 2019. [Google Scholar]
- UNFCCC. Warsaw Framework for REDD-Plus, Modalities for Measuring, Reporting and Verifying; Decision 14/CP.19; UNFCCC: Bonn, Germany, 2013. [Google Scholar]
- FAO. From Reference Levels to Results Reporting: REDD+ under the United Nations Framework Convention on Climate Change; 2020 Update; FAO: Rome, Italy, 2020. [Google Scholar] [CrossRef]
- Vancutsem, C.; Achard, F.; Pekel, J.-F.; Vieilledent, G.; Carboni, S.; Simonetti, D.; Gallego, J.; Aragao, L.; Nasi, R. Long-term (1990–2019) monitoring of tropical moist forests dynamics. bioRxiv 2020. [Google Scholar] [CrossRef]
- Ministry of Agriculture, Livestock, Forests and the Environment of Equatorial Guinea. Proposed Forest Reference Emission Level Submission to the UNFCCC. 2020. Available online: https://redd.unfccc.int/files/eg_frlsubmissions_2020_01_13.pdf (accessed on 7 December 2020).
- Environment, Forest and Climate Change Commission of Ethiopia. Modified Forest Reference Level Submission to the UNFCCC. 2017. Available online: https://redd.unfccc.int/files/ethiopia_frel_3.2_final_modified_submission.pdf (accessed on 7 December 2020).
- Environmental Protection Agency of Liberia. Proposed Forest Reference Emission Level Submission to the UNFCCC. 2020. Available online: https://redd.unfccc.int/files/liberia_frel_submission_december_2019.pdf (accessed on 7 December 2020).
- Federal Ministry of Environment of Nigeria. Modified Forest Reference Emission Level Submission to the UNFCCC. 2019. Available online: https://redd.unfccc.int/files/nigeria_national_frel_modified_revised__for_posting.pdf (accessed on 7 December 2020).
- Ministry of Environment of Sri Lanka. Modified Forest Reference Level Submission to the UNFCCC. 2017. Available online: https://redd.unfccc.int/files/sl_frl_modified_submission_november_2017.pdf (accessed on 7 December 2020).
- Ministry of Lands, Natural Resources and Environmental Protection of Zambia. Zambia’s Forest reference Emissions Level Submission to the UNFCCC. 2016. Available online: https://redd.unfccc.int/files/2016_submission_frel_zambia.pdf (accessed on 7 December 2020).
- Bastin, J.F.; Berrahmouni, N.; Grainger, A.; Maniatis, D.; Mollicone, D.; Moore, R.; Patriarca, C.; Picard, N.; Sparrow, B.; Abraham, E.M.; et al. The extent of forest in dryland biomes. Science 2017, 356, 635–638. [Google Scholar] [CrossRef] [PubMed] [Green Version]
- Harris, N.; Davis, C.; Goldman, E.D.; Petersen, R. Comparing Global and National Approaches to Estimating Deforestation Rates in REDD+ Countries Working Paper; World Resources Institute: Washington, DC, USA, 2018; Available online: wri.org/publication/comparing-global-national-approaches (accessed on 7 December 2020).
- Ministry of Environment and Sustainable Development of Colombia. Proposed Forest Reference Emission Level Submission to the UNFCCC. 2020. Available online: https://redd.unfccc.int/files/02012019_nref_colombia_v8.pdf (accessed on 7 December 2020).
- Forestry Commission of Ghana. Emission Reduction Monitoring Report for the Forest Carbon Partnership Facility (FCPF) Carbon Fund. 2021; Forthcoming. [Google Scholar]
- Government of the Republic of Uganda. Uganda’s Technical Annex with REDD+ Results from Reducing Emissions from Deforestation, Biennial Update Report Technical Annex Submitted to the UNFCCC. 2020. Available online: https://unfccc.int/sites/default/files/resource/REDD%20%20Technical%20Annex%202020.pdf (accessed on 7 December 2020).
- Diisi, J.; Coordinator GIS and Mapping, National Forest Authority, Kampala, Uganda; Senyonjo, E.; Coordinator Inventory, National Forest Authority, Kampala, Uganda. Personal communication, 2020.
- Tewkesbury, A.P.; Comber, A.J.; Tate, N.J.; Lamb, A.; Fisher, P.F. A critical synthesis of remotely sensed optical image change detection techniques. Remote Sens. Environ. 2015, 160, 1–14. [Google Scholar] [CrossRef] [Green Version]
- UNFCCC REDD+ Web Platform. Available online: https://redd.unfccc.int/fact-sheets/forest-reference-emission-levels.html (accessed on 4 January 2020).
- McRoberts, R.E. Satellite image-based maps: Scientific inference or pretty pictures? Remote Sens. Environ. 2011, 115, 715–724. [Google Scholar] [CrossRef]
- Olofsson, P.; Foody, G.M.; Stehman, S.V.; Woodcock, C.E. Making better use of accuracy data in land change studies: Estimating accuracy and area and quantifying uncertainty using stratified estimation. Remote Sens. Environ. 2013, 129, 122–131. [Google Scholar] [CrossRef]
- Stehman, S.V. Estimating area from an accuracy assessment error matrix. Remote Sens. Environ. 2013, 132, 202–211. [Google Scholar] [CrossRef]
- Olofsson, P.; Arévaloa, P.; Espejo, A.B.; Green, C.; Lindquist, E.; McRoberts, R.E.; Sanz, M.J. Mitigating the effects of omission errors on area and area change estimates. Remote Sens. Environ. 2020, 236, 111492. [Google Scholar] [CrossRef]
- McRoberts, R.E.; Stehman, S.V.; Liknes, G.C.; Næsset, E.; Sannier, C.; Walters, B.F. The effects of imperfect reference data on remote sensing-assisted estimators of land cover class proportions. ISPRS J. Photogramm. Remote Sens. 2018, 142, 292–300. [Google Scholar] [CrossRef]
- Ying, Q.; Hansen, M.C.; Potapov, P.V.; Tyukavina, A.; Wang, L.; Stehman, S.V.; Moore, R.; Hancher, M. Global bare ground gain from 2000 to 2012 using Landsat imagery. Remote Sens. Environ. 2017, 194, 161–176. [Google Scholar] [CrossRef] [Green Version]
- IPCC. Good Practice Guidance for Land Use, Land-Use Change and Forestry; Intergovernmental Panel on Climate Change: Geneva, Switzerland, 2003; 590p. [Google Scholar]
- Stehman, S.V. Estimating area and map accuracy for stratified random sampling when the strata are different from the map classes. Int. J. Remote Sens. 2014, 35, 4923–4939. [Google Scholar] [CrossRef]
- Government of Mexico. Modified Forest Reference Emission Level Submission to the UNFCCC. 2015. Available online: https://redd.unfccc.int/files/frel_mexico_modified.pdf (accessed on 14 June 2020).
- Government of Mexico. Initial Forest Reference Emission Level Submission to the UNFCCC. 2020. Available online: https://redd.unfccc.int/files/nref_2007-2016_mexico.pdf (accessed on 14 June 2020).
- Government of Mexico. Sixth National Communication to the UNFCCC. 2018. Available online: https://unfccc.int/sites/default/files/resource/MEX_6aNC_Revisada_0.pdf (accessed on 14 June 2020).
- Government of Mexico. Modified Forest Reference Emission Level Submission to the UNFCCC. 2021; Forthcoming. [Google Scholar]
- General Department of Environmental Knowledge and Information, Ministry of Environment of Cambodia. Modified Forest Reference Emission Level Submission to the UNFCCC. 2017. Available online: https://redd.unfccc.int/files/camfrl_may_22_2017.pdf (accessed on 14 June 2020).
- General Department of Environmental Knowledge and Information, Ministry of Environment of Cambodia. Technical Annex Pursuant to Decision 14/CP.19, Results Achieved by the Kingdom of Cambodia from Reducing Emissions from Deforestation, Forest Degradation and Enhancement of Forest Carbon Stock, Biennial Update Report Technical Annex Submitted to the UNFCCC. 2020. Available online: https://unfccc.int/sites/default/files/resource/20201006_Cambodia_BUR_REDD_Technical_Annex.pdf (accessed on 30 October 2020).
- Forestry Commission of Ghana. Emission Reduction Program Document for the Forest Carbon Partnership Facility (FCPF) Carbon Fund. 2017. Available online: http://www.fcghana.org/nrs/index.php/reports-documents/category/5-spreadsheet-for-erpd (accessed on 10 November 2020).
- Ministry of Environment and Forest Ecology, Madagascar. Modified Forest Reference Emission Level submission to the UNFCCC. 2018. Available online: https://redd.unfccc.int/files/20180528_frel_mada_modified.pdf (accessed on 14 June 2020).
- Iversen, P.; Lee, D.; Rocha, M. Understanding Land Use in the UNFCCC, Climate and Landuse Alliance Report. 2014. Available online: https://www.climateandlandusealliance.org/reports/understanding-land-use-in-the-unfccc/ (accessed on 1 June 2018).
- European Union. Annual European Union Greenhouse Gas Inventory 1990–2018 and Inventory Report Submission to the UNFCCC Secretariat. 2020. Available online: https://www.eea.europa.eu/publications/european-union-greenhouse-gas-inventory-2020 (accessed on 30 November 2020).
- European Union. Annual European Union Greenhouse Gas Inventory 1990–2014 and Inventory Report 2016 Submission to the UNFCCC Secretariat. 2015. Available online: https://www.eea.europa.eu/publications/european-union-greenhouse-gas-inventory-2016 (accessed on 30 November 2020).
- Environment Agency Austria. Austria’s National Inventory Report submission under the UNFCCC. 2020. Available online: https://unfccc.int/documents/226418 (accessed on 20 October 2020).
- McGlynn, E.; Harper, K.; Li, S.; Berger, M. Reducing Climate Policy Risk: Improving Certainty and Accuracy in the U.S. Land Use, Land Use Change, and Forestry Greenhouse Gas Inventory, Climate Works Report. 2019. Available online: https://www.climateworks.org/wp-content/uploads/2019/09/Reducing-Climate-Policy-Risk-REPORT.pdf (accessed on 20 November 2020).
- United States Environmental Protection Agency (US EPA). Greenhouse Gas Inventory of the United States, Multiple Years. Available online: https://www.epa.gov/ghgemissions/inventory-us-greenhouse-gas-emissions-and-sinks (accessed on 30 November 2020).
- Ohrel, S.B. Policy Perspective on the Role of Forest Sector Modeling. J. For. Econ. 2019, 34, 187. [Google Scholar] [CrossRef] [PubMed]
- Environment and Climate Change Canada. National Inventory Report Submitted to the UNFCCC. 2020. Available online: https://unfccc.int/documents/224829 (accessed on 30 November 2020).
Figure 1.
Mexico’s deforestation estimates using pixel counts and two sample-based methodologies, generated from data in Mexico’s reference level submissions and Mexico’s 6th national communication to the UNFCCC [43,45,46].

Figure 2.
Cambodia’s emission estimates based on pixel count and sample-based activity data generated from data in Cambodia’s technical annex to its Biennial Update Report (BUR) submitted to the UNFCCC in 2020 [48].
Figure 2.
Cambodia’s emission estimates based on pixel count and sample-based activity data generated from data in Cambodia’s technical annex to its Biennial Update Report (BUR) submitted to the UNFCCC in 2020 [48].

Figure 3.
Ghana’s deforestation assessment based on pixel counts and sample-based methodology generated from data in Ghana’s initial and recalculated reference level for the Carbon Fund [30,49].

Figure 4.
US recalculations of GHGs from forest land remaining forest land (in million tCO2/year), generated from United States Environmental Protection Agency data provided in national GHG inventories (2007–2020) [56].
Figure 4.
US recalculations of GHGs from forest land remaining forest land (in million tCO2/year), generated from United States Environmental Protection Agency data provided in national GHG inventories (2007–2020) [56].


Table 1.
Main characteristics of area estimates based on pixel counts and two sample-based approaches.
Table 1.
Main characteristics of area estimates based on pixel counts and two sample-based approaches.
| Pixel Counts (Map Alone) | Sample-Based Estimates | ||
|---|---|---|---|
| Systematic or Random Sample (Interpreted Sample Plots Alone) | Stratified Area Estimate (Map and Interpreted Sample Plots) | ||
| Simplicity | Simple (to extract statistics from map but map creation can be highly complex). Consistent estimates at all spatial scales. | Medium complex. Consistent estimates at all spatial scales but sub-level estimates require sufficient sampling density. | Highly complex. Level of complexity increases with the number of classes for which estimates are assessed. Sub-levels will need to be considered in the sampling design; otherwise, no statistics for lower scales will be produced. |
| Sampling design | Not applicable. | Not optimized for assessment of rare features, generally requires larger sample size. | Can be optimized for assessment of rare features when considered in sampling design and if the map is sufficiently accurate. Generally requires smaller sample size, which may allow for more emphasis on high quality interpretation. |
| Accuracy | Classification errors are not removed, estimates contain bias (which can be substantial, especially with post-classification). | Classification errors are reduced as much as possible if best available data is used (best available imagery and expert classification). Possible bias in sample data interpretation is not corrected for. Interpretation bias can be reduced as far as practicable following recommendations by [39] | Classification errors are removed as much as possible, estimates are corrected for bias. Possible bias in sample data interpretation is not corrected for. Interpretation bias can be reduced as far as practicable following recommendations by [39] For estimates of rare classes, errors of omission in large classes may introduce considerable uncertainty in parameter estimates obtained from sample data unless recommendations by [38] are implemented to reduce the impact of omission errors. |
| Uncertainty reporting | Does not allow the computation of a confidence interval | Allows a confidence interval to be calculated based on sampling error with assumptions on data distribution. | Allows a confidence interval to be calculated based on sampling error. |
Publisher’s Note: MDPI stays neutral with regard to jurisdictional claims in published maps and institutional affiliations. |
© 2021 by Food and Agriculture Organization of the United Nations. Licensee MDPI, Basel, Switzerland.
Share and Cite
MDPI and ACS Style
Sandker, M.; Carrillo, O.; Leng, C.; Lee, D.; d’Annunzio, R.; Fox, J. The Importance of High–Quality Data for REDD+ Monitoring and Reporting. Forests 2021, 12, 99. https://0-doi-org.brum.beds.ac.uk/10.3390/f12010099
AMA Style
Sandker M, Carrillo O, Leng C, Lee D, d’Annunzio R, Fox J. The Importance of High–Quality Data for REDD+ Monitoring and Reporting. Forests. 2021; 12(1):99. https://0-doi-org.brum.beds.ac.uk/10.3390/f12010099
Chicago/Turabian StyleSandker, Marieke, Oswaldo Carrillo, Chivin Leng, Donna Lee, Rémi d’Annunzio, and Julian Fox. 2021. "The Importance of High–Quality Data for REDD+ Monitoring and Reporting" Forests 12, no. 1: 99. https://0-doi-org.brum.beds.ac.uk/10.3390/f12010099
Note that from the first issue of 2016, this journal uses article numbers instead of page numbers. See further details here.