
Soil Mesofauna Responses to Fire Severity in a Sclerophyllous Forest in Central Chile
by
 ,
,
Ricardo Castro-Huerta
1 ,
,
Carolina Morales
1,
John Gajardo
2,*,
Enrique A. Mundaca
1 and
Marco Yáñez
3 1
Escuela de Agronomía, Facultad de Cs. Agrarias y Forestales, Universidad Católica del Maule, Maule 3466706, Chile
2
Instituto de Bosques y Sociedad, Facultad de Ciencias Forestales y Recursos Naturales, Campus Isla Teja, Universidad Austral de Chile, Valdivia 5090000, Chile
3
Instituto de Investigación Interdisciplinaria, Universidad de Talca, 2 Norte 685, Talca 3460000, Chile
*
Author to whom correspondence should be addressed.
Forests 2021, 12(11), 1444; https://0-doi-org.brum.beds.ac.uk/10.3390/f12111444
Submission received: 27 August 2021
/
Revised: 20 September 2021
/
Accepted: 18 October 2021
/
Published: 23 October 2021
(This article belongs to the Section Forest Biodiversity)
Abstract
:Forest fires may have severe impacts on the aboveground biodiversity and soil chemical and biological properties. Edaphic organisms are highly sensitive to disturbances and are typically used to measure the magnitude of these events. Overall, little is known about the responses of these organisms to fires differing in their severity levels. This study aimed to assess the effect of fire severity on the soil mesofauna community diversity and structure in a site located in a Mediterranean zone of central Chile. In postfire conditions, we use spectral indexes from satellite images to map fire severity at four levels (non-damage (ND), low damage (L), medium damage (M), high damage (H)). Soil samples were collected at each severity level, and the mesofauna abundance was quantified. Although the metrics describing species diversity and dominance were similar among fire severity levels, the abundance and composition of the mesofauna were specifically altered at the high severity level. The edaphic mesofauna can be considered suitable bioindicators to evaluate the postfire ecosystem recovery, especially in the areas highly damaged by fire.
1. Introduction
Soils contain a wide diversity of organisms affecting the earth’s biogeochemical processes and consequently the ecosystem functioning [1,2,3]. Among these organisms, the edaphic fauna is classified according to adult width size in microfauna (<0.2 mm), mesofauna (0.2–2 mm), and macrofauna (<2 mm) [4,5]. Overall, most of the meso- and macrofauna correspond to arthropods, which are represented by Isopoda, Myriapoda, Insecta, Acari and Collembola, as inhabitants of the litter and the soil [6].
Anthropogenic and natural disturbances can change the composition and abundance of the arthropod communities [7,8], which is why the edaphic fauna is considered as a biological indicator of soil health [9,10,11]. Forest fires are one of the most important large-scale disturbances affecting an ecosystem’s functioning [12]. Fires can reduce the vegetation strata and biodiversity and increase the soil degradation and emission of greenhouse gases, whose magnitude is associated with fire severity [13]. Fire severity maps provide a spatial quantification of a fire’s impact on the landscape and can be used to prioritize resources and as baselines for future monitoring requirements [14]. In this context, the fire severity measured the ecological changes that have occurred in a burned area (postfire) relative to the previous conditions (prefire), which depends on the duration and intensity of fires [15]. In the end, the soil biological and physicochemical properties, postfire climatic conditions, and the depth of the horizontal fire radiation determine the resilience of the soil communities [16] associated with both the survival patterns and colonization of soil organisms [17,18,19,20].
In January and February 2017, the Mediterranean zone of Chile was affected by one of the most extensive fires in its modern history, covering an area of approximately 587,000 hectares, mainly of sclerophyllous forest and commercial plantations, adding a new level to the world scale used to classify forest fires [21]. Although these large fires are uncommon in this zone [22], current trends show an increase in the frequency of these fire events in the world [23]. Satellite technologies allow a fairly accurate modelling of fire severity by quantifying differences in plant biomass [24,25,26], and the accuracy is still increasing with new developments [27,28,29,30]. These technologies have even been successfully applied to estimate fire severity in arid areas [31] and agricultural crops [32], but their application needs to be validated and compared with real data [33,34,35]. Overall, there are concerns about the impacts of fires on the global ecosystem, especially on soil invertebrates, which provide essential ecosystem services and are crucial to energy flow and nutrient cycling processes [36,37]. Fontúrbel et al. [38] mentioned that soil mesofauna may need more time to recover post fire compared with other soil organisms and that a fire may change the structure of the soil organic layer, which is the habitat of these communities. Thus, in this study, we assessed the responses of the soil arthropod mesofauna to the fire severity in a typical sclerophyllous forest found in the Mediterranean zone of Chile. We use satellite images and Geographic Information Systems technology to identify areas with different levels of fire severity and sampled the soil arthropod mesofauna composition and diversity present in these areas. We hypothesize that the postfire soil mesofauna community structure is negatively altered when increasing the fire severity.
2. Materials and Methods
2.1. Study Site and Soil Characteristics
This study was carried out in the Central Valley of Chile, specifically in the area of Villavicencio, San Javier district, Maule Region [Figure 1]. In January 2017, this area was affected by one of the biggest fires in modern Chilean history [39]. The site is located at an average altitude of 158 m.a.s.l. and has a temperate mesothermal climate, Mediterranean stenothermal semiarid inland, and annual precipitation of 840 mm. Mean temperatures vary from 30.1 °C in summer to 4 °C in winter [40]. The vegetation corresponds to a sclerophyllous and deciduous forest [41]. The state is a regressive climax represented by a degraded open forest and shrubland, with some dominance of invasive species, which undergo rapid growth and regeneration under recurrent fires [42]. The soil belongs to Pocillas soil series, characterized by sedimentary soil of lacustrine origin, loamy clay texture, grey to brown color, and 40–50 cm depth, pH 6.5, and 3.7% organic matter [43].
2.2. Remote Sensing Data and Experimental Design
Fire severity was estimated using data from the Multispectral Instrument [MSI] sensor onboard the Sentinel-2 satellite platform [44], whose data is freely available and can be downloaded from the Copernicus Open Access Hub [45]. Based on the short-term severity assessment indicated by Key & Benson [24], two summer images were used, before (19 January 2017) and after (20 March 2017) the fire. The satellite data were atmospherically corrected to obtain surface reflectance using the Sen2Cor algorithm [46]. Considering the field plot size, we took advantage of the high spatial resolution of the MSI sensor and decided to resample the bands used at 10 m. The spectral indices Normalized Burn Ratio [NBR], difference Normalized Burn Ratio [dNBR] [15], and Relative delta Normalized Burn Ratio [RdNBR] [25] were calculated using the satellite images.
where, ρNIR, ρSWIR, are the surface reflectance for the near infra-red band [B8] and the short-wave near infra-red band [B12]; NBRPRE and NBRPOST represent the NBR for the situations previous to and after the fire, respectively. According to the thresholds obtained from multiple fires and regions by Parks et al. [30], calculated RdNBR continuous values were discretized in four severity categories: No damage (ND), low (L), medium (M), and high (H). Satellite images were processed by QGIS 2.18 software [47].
2.3. Soil Sampling and Processing
On November 30, 2017, three sampling plots per severity level were randomly distributed [Figure 1]. We took care of locating the plots on homogeneous patches within the severity levels, privileging accessible sectors, and avoiding steeped slopes to guarantee personnel safety [33]. To allow locating the plot under homogenenious condition, we computed the Soil Adjusted Vegetation (SAVI) [48] from pre-fire images. SAVI values varied from 0.17 to 0.35, which indicates the open-areas within the site. We considered these values relatively homogeneous regarding the degradation stage of this ecosystems. The sample collection was carried out according to the modified Tropical Soil Biology and Fertility protocol [49], based on the extraction of a 10 × 10 × 10 cm soil pit, designed to collect endogenic fauna. Subsequently, the samples were placed in labeled bags and subjected to a mesofauna extraction system two days after collect using the Berlese-Tüllgren method to ensure high extraction efficiency. [50]. Briefly, it consisted of a funnel with a sieve [opening diameter of 2 mm or 10 mesh], where the soil was unbundled manually and located inside the funnel under 60 W light bulb for seven days to ensure the mesofauna fall into a flask containing a 70% alcohol solution.
2.4. Species Identification and Biodiversity Analysis
Species identification was assessed at each sample through a binocular stereoscope loupe (Olympus® SZ40 with light source TL2, Lytle, TX, USA), and using the Recognizable Taxonomic Unit (RTU) criterion for each taxonomic group indicated in Table 1. This was used to separate unknown taxa and assess species richness when identification at species level was not possible [51]. The Shannon-Wiener and Simpson diversity indexes were calculated per sample. The former assumes that all species are represented in the samples, indicating uniformity in abundance according to all species sampled [52]. The latter focuses on the most abundant or dominant species, estimating the probability that two individuals randomly sampled from the same sample belong to the same species [53].
2.5. Statistical Analysis
We analysed the degree of structuring per sample unit using a non-metric Multidimensional Scaling [nmMDS] analysis [54,55] to calculate the Bray–Curtis and Jaccard similarity matrix [53]. Clusters were determined by adjusting convex envelope graphics [Convex Hull] and the calculation of the Kruskal Stress value, which is considered adequate to define groupings at values lower than 0.1, and unacceptable when above 0.15 [56,57]. To identify differences among clusters a one-way similarity analysis [ANOSIM] was used based on the distance measures of the Bray–Curtis [54] and Jaccard index [53]. These analyses were performed using the free software PAST® (Oslo, Norway) [58]. Measures of diversity and composition were analysed through a one-way analysis of variance using the linear models and generalized linear models for continuous and discrete variables, whereas mean comparisons was determined by the Tukey’s test, using R (www.r-project.org (accessed on 20 June 2021)). Significant differences were considered at a probability level of 0.1 regarding the low replication of the study.
3. Results and Discussion
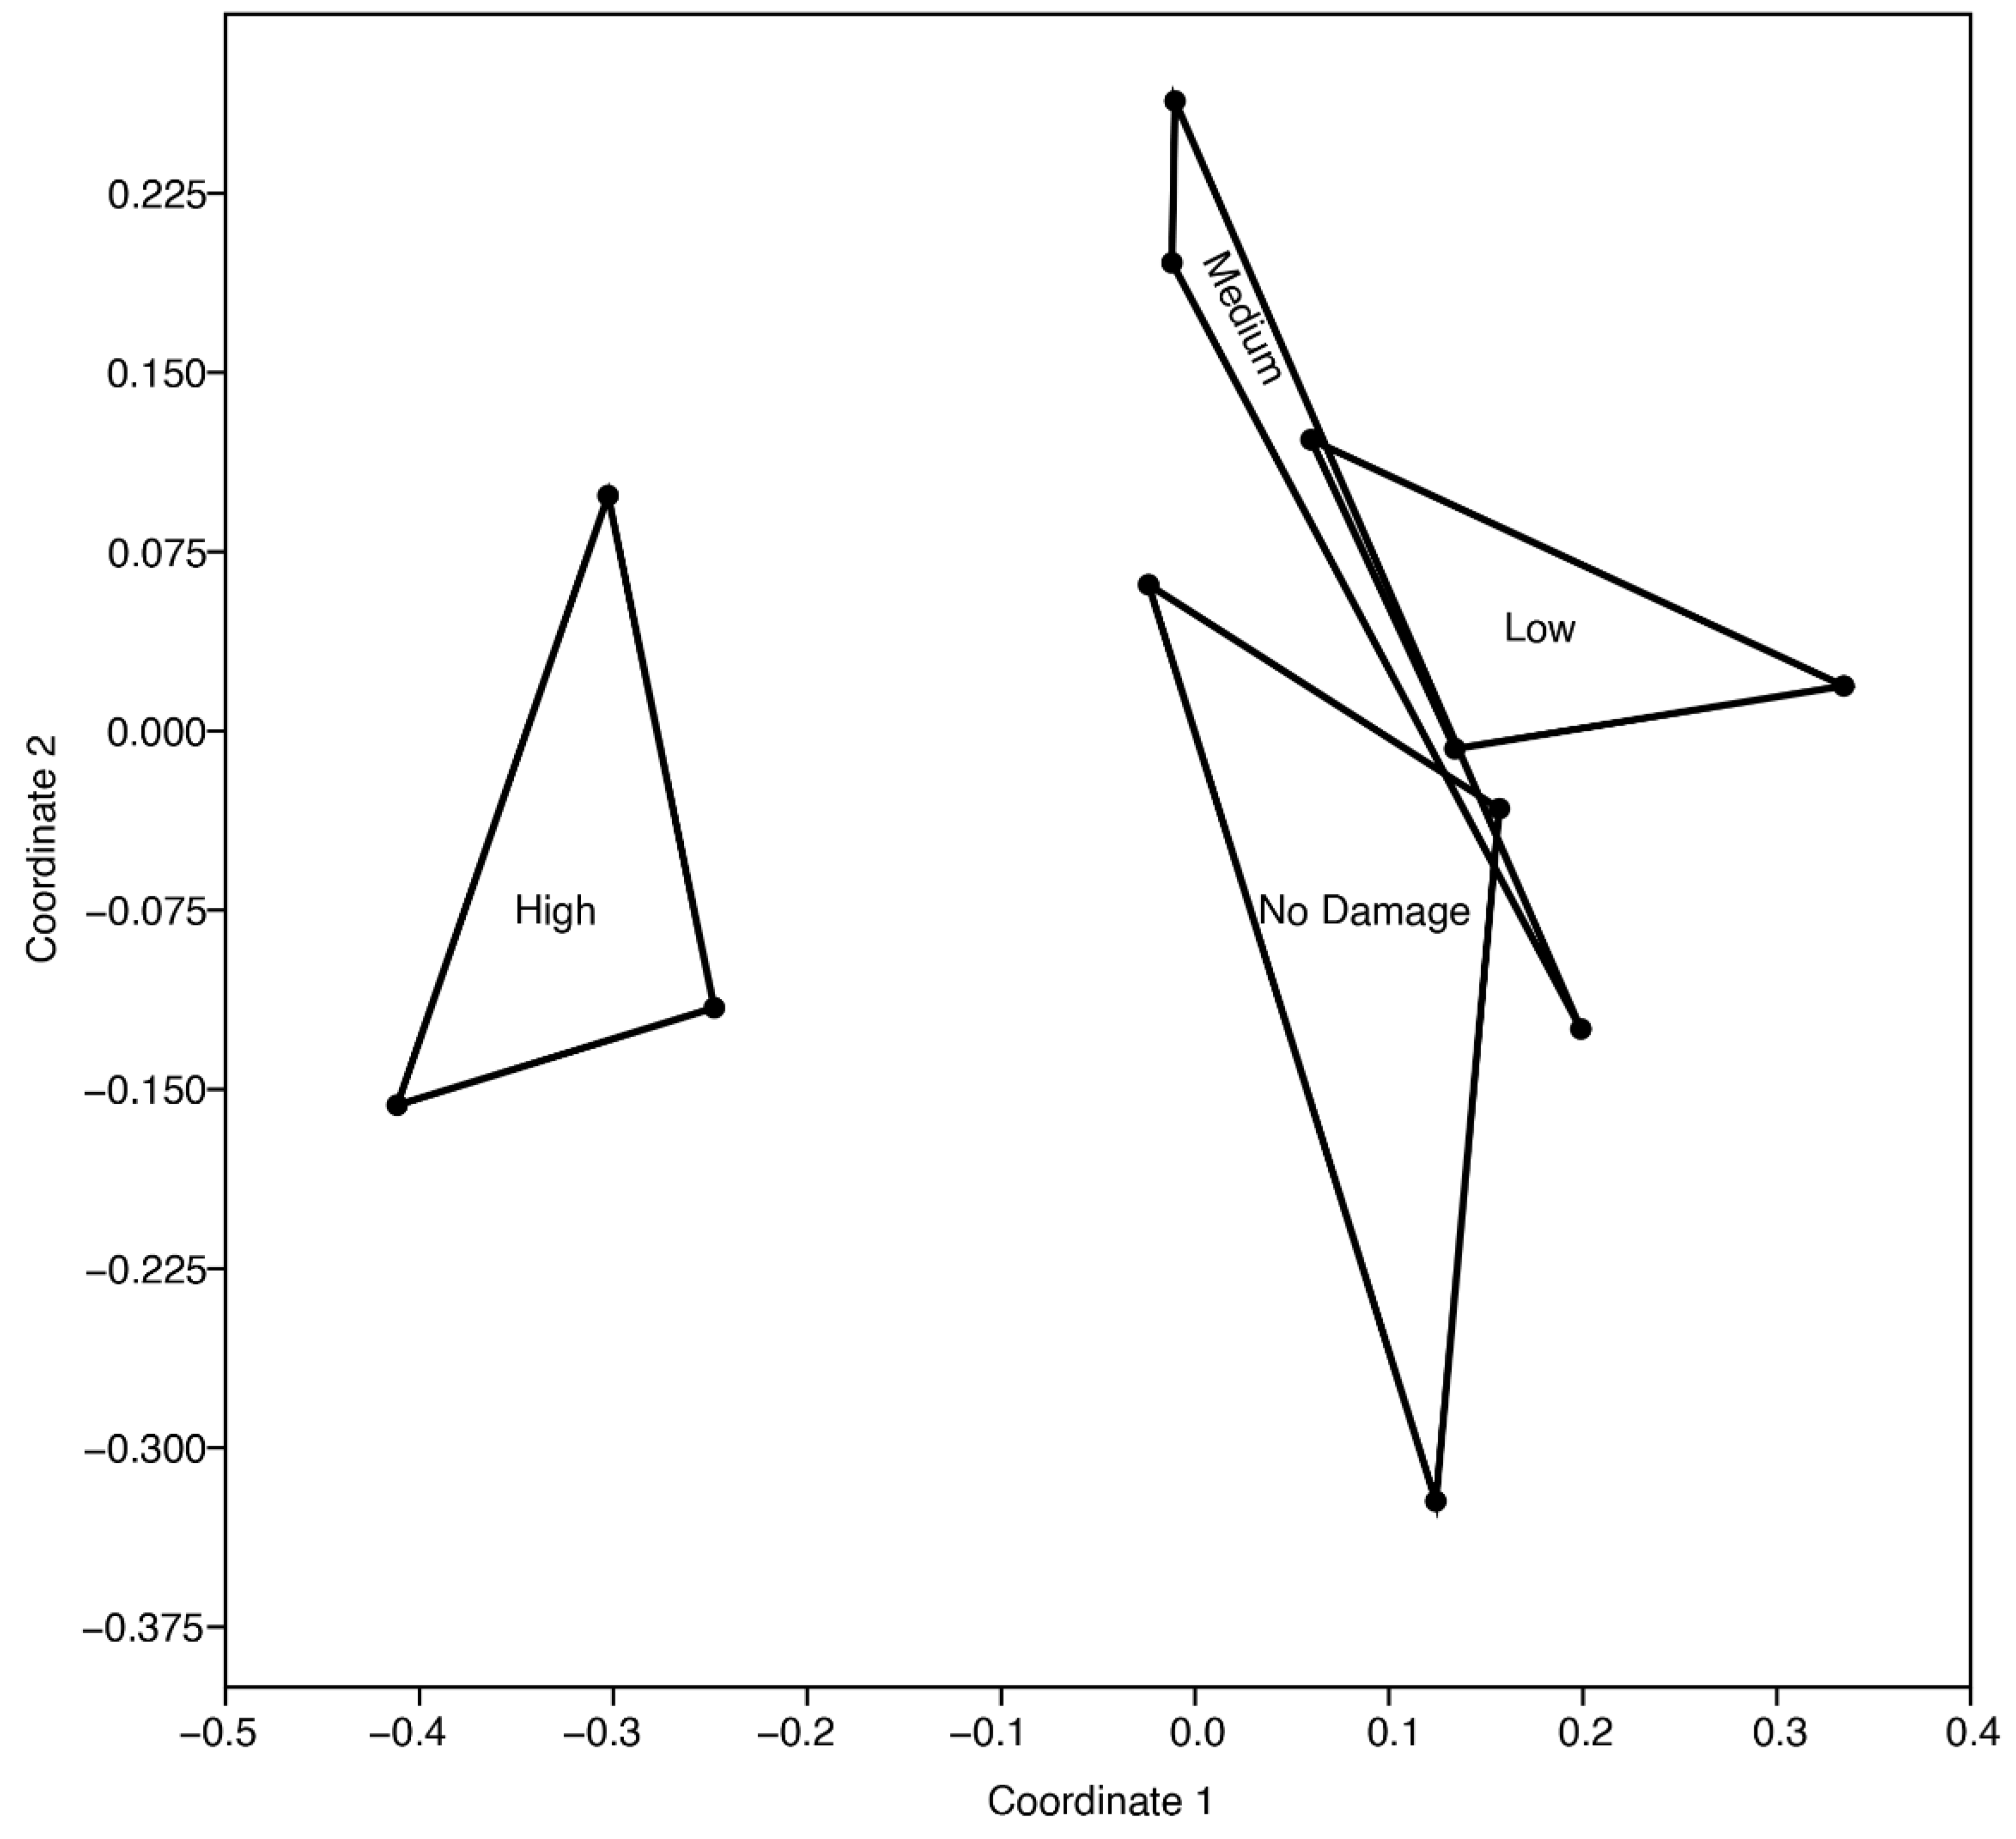
This study partially supports the hypothesis that the postfire soil mesofauna community structure is negatively altered when increasing the fire severity. The multidimensional scaling analysis showed a clear distinction between the groups established with the Jaccard’s method (Kruskal’s stress value of 0.11) (Figure 2), mainly due to a differentiation of the high severity level (H) relative to the others. Similarly, the one-way similarity analysis (ANOSIM) indicated significant differences among fire severity levels on the Jaccard index (R = 0.3812, p = 0.0167), implying differences in the community composition [59], and consequently an effect of fire on the habitat of soil invertebrate communities [20]. Otherwise, the Bray–Curtis analysis did not showed differences between severity levels (Kruskal’s stress value of 0.06, R = 0.084, p = 0.2970). Overall, the results must be interpreted with care because of the low replication of this study. Even so, the pairwise comparison among severity levels revealed some evidence about the differences in community composition in the high severity level relative to the other levels (p = 0.1) [Table 2].
Table 3 shows the mean values of species richness, relative abundance, Shannon-Wiener, and Simpson biodiversity, which are based on the proportional abundance of the quantification of species to estimate diversity [52,60]. Overall, all the parameters were relatively similar among the fire severity level, except abundance, which exhibited lower values in the high severity level. The low species richness in high severity is probably a consequence of decreased vertebrate survival and a slow recolonization process. The mean Shannon-Weaver index and Evenness among severity levels varied from 1.65 to 1.81 and 0.51 to 0.66, respectively. According to Pla [61], these values indicate a high diversity and homogeneity in the distribution of the mesofaunal community. Unlike, some studies show that a higher fire severity may increase the dominance, since there are populations of invertebrates that are favored by fires [62,63,64].
Remote Sensing tools used to estimate severity are based on the response of the reflectance of objects affected by the fire on the Earth’s surface. When the estimated severity level is high, it generally implies the removal of the entire vegetation cover, the response being mainly from the soil [13]. However, when the severity level is medium or low, optical sensors can only observe responses from the upper parts of the canopy. Other phenomena that occur in the lower strata, including the ground, may be invisible from the perspective of satellites [25]. This combination of factors affects the adequate quantification of severity [15]. The latter could explain that the main differences between the communities found in the different levels of severity occurred only in categories H and ND.
A total of 139 arthropod RTUs were recorded from all samples (Table 1). The most frequent and abundant taxa among all samples were Collembolla and Acari. This result is not surprising as both groups have been reported to constitute approximately 72% to 98% of the soil arthropod fauna, the most representative and abundant groups of the edaphic mesofauna [65]. In this regard, these groups of organisms are known to regulate and stabilize the soil through a complex network of interactions, participating in the decomposition of organic matter and the cycling of nutrients [66,67,68]. In terms of functional groups, we found particular arthropod groups to occur in specific fire severity levels (Table 1). For instance, a high amount of Oribatida mites were found in all the severity levels, except in H. This finding is likely explained by a higher loss of soil organic matter in high severity because these organisms are primarily detritivorous and secondary decomposers and play a crucial role in transforming organic matter [66,67,69]. Otherwise, the higher presence of Oribatida is not surprising as it is known to dominate nutrient-poor soils [70]. Thus, a medium severity level might alter the nutrient status in these soils. Oppositely, Trombidiformes tended to be higher in their severity level.
Mesostigmata mites were among the most abundant organism. These are known for being predators of the micro- and mesofauna and as soil quality indicators since they commonly show high population numbers in undisturbed soils [71]. In this study, there was no abundance pattern of Mesostigmata mites associated with the fire severity, which agreed with the study by Kamczyc et al. [72]. At high severity, there was a higher abundance of Psocoptera, a pioneering group colonizing disturbed areas, whose presence indicates a soil recovery action [11]. In addition, in areas with a high impact of fires, soil nutrients are abruptly mineralized, decreasing food sources for soil invertebrates and slowing their recovery [73]. On the other hand, the high abundance of Collembolla at low severity (L) is a good indicator of healthy in soils, as collembolans feed on saprofitic fungal hyphal networks which are particularly susceptible to disturbance and contribute to the control of phytopathogenic microorganisms in agriculture systems. [5]. In general, in sclerophyllous ecosystems such as the one in this study, it is common to observe a high variability in plants and fauna, which allows a rapid recovery of the ecosystem providing that the soil is not devoid of vegetation [62]. Thus, the maintenance of diversity and ecological processes depends on the heterogeneity and structural complexity [74].
4. Conclusions
In the assessed sclerophyllous forest, the postfire soil mesofauna community structure was altered only with a high fire severity level. Thus, we partially accept our hypothesis as the results showed no effect on the soil mesofauna communities at low and medium fire severity, suggesting a high resilience of the edaphic richness at these levels of damage. Furthermore, the ability to remotely assess the damages of forest fires would considerably reduce the costs and time required to evaluate the actual damage in the field. However, the estimation of postfire damages with remote sensing tools must be validated with biological data to improve their estimation when projecting reforestation and restoration strategies.
Author Contributions
Conceptualization, R.C.-H., C.M. and E.A.M.; methodology, R.C.-H., C.M., E.A.M. and J.G.; writing—original draft preparation, R.C.-H., C.M., E.A.M., J.G. and M.Y.; writing—review and editing, R.C.-H., C.M., E.A.M., J.G. and M.Y. All authors have read and agreed to the published version of the manuscript.
Funding
This research was funded by the Fondo de Investigación del Bosque Nativo (FIBN) de la Corporación Nacional Forestal de Chile (CONAF), grant number FIBN 010/2017.
Acknowledgments
We would like to thanks to Baron Philippe de Rothschild, a vineyard company, who provided the experimental site for this study.
Conflicts of Interest
The authors declare no conflict of interest. The funders had no role in the design of the study; in the collection, analyses, or interpretation of data; in the writing of the manuscript, or in the decision to publish the results.
References
- Bardgett, R.D.; Van Der Putten, W.H. Belowground biodiversity and ecosystem functioning. Nature 2014, 515, 505–511. [Google Scholar] [CrossRef]
- Briones, M.J. The serendipitous value of soil fauna in ecosystem functioning: The unexplained explained. Front. Environ. Sci. 2018, 6, 149. [Google Scholar] [CrossRef]
- Graham, E.B.; Knelman, J.E.; Schindlbacher, A.; Siciliano, S.; Breulmann, M.; Yannarell, A.; Beman, J.; Abell, G.; Philippot, L.; Prosser, J. Microbes as engines of ecosystem function: When does community structure enhance predictions of ecosystem processes? Front. Microbiol. 2016, 7, 214. [Google Scholar] [CrossRef] [PubMed] [Green Version]
- Eisenbeis, G. Biology of soil invertebrates. In Intestinal Microorganisms of Termites and Other Invertebrates; König, H., Varma, A., Eds.; Springer: Berlin, Germany, 2006; pp. 3–53. [Google Scholar]
- Lavelle, P.; Spain, A. Soil Ecology; Kluwer Academic Publishers: New York, NY, USA, 2001; p. 654. [Google Scholar]
- Eisenbeis, G.; Wichard, W. Atlas on the Biology of Soil Arthropods; Springer Science & Business Media: Berlin/Heidelberg, Germany, 2012. [Google Scholar]
- Brussaard, L.; De Ruiter, P.C.; Brown, G.G. Soil biodiversity for agricultural sustainability. Agric. Ecosyst. Environ. 2007, 121, 233–244. [Google Scholar] [CrossRef]
- Sánchez-Bayo, F.; Wyckhuys, K. Worldwide decline of the entomofauna: A review of its drivers. Biol. Conserv. 2019, 232, 8–27. [Google Scholar] [CrossRef]
- Adhikari, K.; Hartemink, A.E. Linking soils to ecosystem services—A global review. Geoderma 2016, 262, 101–111. [Google Scholar] [CrossRef]
- Bünemann, E.K.; Bongiorno, G.; Bai, Z.; Creamer, R.E.; De Deyn, G.; de Goede, R.; Fleskens, L.; Geissen, V.; Kuyper, T.W.; Mäder, P.; et al. Soil quality–A critical review. Soil Biol. Biochem. 2018, 120, 105–125. [Google Scholar] [CrossRef]
- Socarrás, A. Mesofauna edáfica: Indicador biológico de la calidad del suelo. Forrajes 2013, 36, 5–13. [Google Scholar]
- Riaño, D.; Ruiz, J.; Martínez, J.; Ustin, S. Burned area forecasting using past burned area records and Southern Oscillation Index for tropical Africa (1981–1999). Remote Sens. Environ. 2007, 107, 571–581. [Google Scholar] [CrossRef]
- De Santis, A.; Chuvieco, E. GeoCBI: A modified version of the Composite Burn Index for the initial assessment of the short-term burn severity from remotely sensed data. Remote Sens. Environ. 2009, 113, 554–562. [Google Scholar] [CrossRef]
- Brewer, C.K.; Winne, J.C.; Redmond, R.L.; Opitz, D.W.; Mangrich, M.V. Classifying and mapping wildfire severity. Photogramm. Eng. Remote Sens. 2005, 71, 1311–1320. [Google Scholar] [CrossRef] [Green Version]
- Key, C.H. Ecological and sampling constraints on defining landscape fire severity. Fire Ecol. 2006, 2, 34–59. [Google Scholar] [CrossRef]
- Bengtsson, J. Disturbance and resilience in soil animal communities. Eur. J. Soil Biol. 2002, 38, 119–125. [Google Scholar] [CrossRef]
- Arellano, S.; Vega, J.A.; Rodríguez y Silva, F.; Fernández, C.; Vega-Nieva, D.; Álvarez-González, J.G.; Ruiz-González, A.D. Validación de los índices de teledetección dNBR y RdNBR para determinar la severidad del fuego en el incendio forestal de Oia-O Rosal (Pontevedra) en 2013. Rev. Teledetección 2017, 49, 49–61. [Google Scholar] [CrossRef] [Green Version]
- Certini, G. Effects of fire on properties of forest soils: A review. Oecologia 2005, 143, 1–10. [Google Scholar] [CrossRef] [PubMed]
- Fernández, I.; Morales, N.; Olivares, L.; Salvatierra, J.; Gómez, M.; Montenegro, G. Restauración Ecológica Para Ecosistemas Nativos Afectados por Incendios Forestales; Pontificia Universidad Católica de Chile: Santiago, Chile, 2010; p. 162. [Google Scholar]
- Wikars, L.-O.; Schimmel, J. Immediate effects of fire-severity on soil invertebrates in cut and uncut pine forests. For. Ecol. Manag. 2001, 141, 189–200. [Google Scholar] [CrossRef]
- De la Barrera, F.; Barraza, F.; Favier, P.; Ruiz, V.; Quense, J. Megafires in Chile 2017: Monitoring multiscale environmental impacts of burned ecosystems. Sci. Total Environ. 2018, 637, 1526–1536. [Google Scholar] [CrossRef] [PubMed]
- Úbeda, X.; Sarricolea, P. Wildfires in Chile: A review. Glob. Planet. Chang. 2016, 146, 152–161. [Google Scholar] [CrossRef]
- Westerling, A.L. Increasing western US forest wildfire activity: Sensitivity to changes in the timing of spring. Philos. Trans. R. Soc. B Biol. Sci. 2016, 371, 20150178. [Google Scholar] [CrossRef]
- Key, C.; Benson, N. Landscape Assessment: Ground Measure of Severity, the Composite Burn Index; and Remote Sensing of Severity, the Normalized Burn Ratio; USDA Forest Service, Rocky Mountain Research Station: Fort Collins, CO, USA, 2006; p. 55. [Google Scholar]
- Miller, J.D.; Thode, A.E. Quantifying burn severity in a heterogeneous landscape with a relative version of the delta Normalized Burn Ratio (dNBR). Remote Sens. Environ. 2007, 109, 66–80. [Google Scholar] [CrossRef]
- Parson, A.; Robichaud, P.R.; Lewis, S.A.; Napper, C.; Clark, J.T. Field Guide for Mapping Post-Fire Soil Burn Severity; Department of Agriculture, Forest Service, Rocky Mountain Research Station: Fort Collins, CO, USA, 2010; p. 49. [Google Scholar]
- Boucher, J.; Beaudoin, A.; Hébert, C.; Guindon, L.; Bauce, É. Assessing the potential of the differenced Normalized Burn Ratio (dNBR) for estimating burn severity in eastern Canadian boreal forests. Int. J. Wildland Fire 2016, 26, 32–45. [Google Scholar] [CrossRef]
- Filipponi, F. BAIS2: Burned Area Index for Sentinel-2; Multidisciplinary Digital Publishing Institute: Basel, Switzerland, 2018; p. 364. [Google Scholar]
- Lanorte, A.; Danese, M.; Lasaponara, R.; Murgante, B. Multiscale mapping of burn area and severity using multisensor satellite data and spatial autocorrelation analysis. Int. J. Appl. Earth Obs. Geoinf. 2013, 20, 42–51. [Google Scholar] [CrossRef]
- Parks, S.A.; Dillon, G.K.; Miller, C. A new metric for quantifying burn severity: The relativized burn ratio. Remote Sens. 2014, 6, 1827–1844. [Google Scholar] [CrossRef] [Green Version]
- Klinger, R.; Brooks, M. Alternative pathways to landscape transformation: Invasive grasses, burn severity and fire frequency in arid ecosystems. J. Ecol. 2017, 105, 1521–1533. [Google Scholar] [CrossRef] [Green Version]
- Wang, S.; Baig, M.H.A.; Liu, S.; Wan, H.; Wu, T.; Yang, Y. Estimating the area burned by agricultural fires from Landsat 8 Data using the Vegetation Difference Index and Burn Scar Index. Int. J. Wildland Fire 2018, 27, 217–227. [Google Scholar] [CrossRef] [Green Version]
- Cansler, C.A.; McKenzie, D. How robust are burn severity indices when applied in a new region? Evaluation of alternate field-based and remote-sensing methods. Remote Sens. 2012, 4, 456–483. [Google Scholar] [CrossRef] [Green Version]
- Miller, J.D.; Quayle, B. Calibration and validation of immediate post-fire satellite-derived data to three severity metrics. Fire Ecol. 2015, 11, 12–30. [Google Scholar] [CrossRef]
- Storey, E.A.; Stow, D.A.; Roberts, D.A. Evaluating uncertainty in Landsat-derived postfire recovery metrics due to terrain, soil, and shrub type variations in southern California. GIScience Remote Sens. 2020, 57, 352–368. [Google Scholar] [CrossRef]
- Pressler, Y.; Moore, J.C.; Cotrufo, M.F. Belowground community responses to fire: Meta-analysis reveals contrasting responses of soil microorganisms and mesofauna. Oikos 2019, 128, 309–327. [Google Scholar] [CrossRef]
- Zaitsev, A.S.; Gongalsky, K.B.; Malmström, A.; Persson, T.; Bengtsson, J. Why are forest fires generally neglected in soil fauna research? A mini-review. Appl. Soil Ecol. 2016, 98, 261–271. [Google Scholar] [CrossRef]
- Fontúrbel, T.; Carrera, N.; Vega, J.A.; Fernández, C. The Effect of Repeated Prescribed Burning on Soil Properties: A Review. Forests 2021, 12, 767. [Google Scholar] [CrossRef]
- González, M.E.; Gómez-González, S.; Lara, A.; Garreaud, R.; Díaz-Hormazábal, I. The 2010–2015 Megadrought and its influence on the fire regime in central and south-central Chile. Ecosphere 2018, 9, e02300. [Google Scholar] [CrossRef] [Green Version]
- Santibáñez, F.; Uribe, J. Atlas Agroclimático de Chile: Regiones VI y VII; Universidad de Chile: Santiago, Chile, 1993; p. 66. [Google Scholar]
- Luebert, F.; Pliscoff, P. Ecosistemas Terrestres. In Biodiversidad de Chile, Patrimonio y Desafíos, Ocho Libros; CONAMA, Ed.; Comisión Nacional del Medio Ambiente: Santiago, Chile, 2008; pp. 74–87. [Google Scholar]
- Castillo, M.; Plaza, Á.; Garfias, R. A recent review of fire behavior and fire effects on native vegetation in Central Chile. Glob. Ecol. Conserv. 2020, 24, e01210. [Google Scholar] [CrossRef]
- Reyes, G.; Zamora, G.; Torres, P.; Salinas, C. Estudio Agrológico Región Del Maule. Descripción de Suelos Materiales y Símbolos, 2012. Sobre Ortoimágenes a Escala de Salida 1:10.000; 9569365048; Centro de Información de Recursos Naturales: Santiago, Chile, 2012; p. 32. [Google Scholar]
- Drusch, M.; Del Bello, U.; Carlier, S.; Colin, O.; Fernandez, V.; Gascon, F.; Hoersch, B.; Isola, C.; Laberinti, P.; Martimort, P. Sentinel-2: ESA’s Optical High-Resolution Mission for GMES Operational Services. Remote Sens. Environ. 2012, 120, 25–36. [Google Scholar] [CrossRef]
- ESA. Copernicus Open Access Hub. Sentinels Scientific Data Available. Available online: https://scihub.copernicus.eu/ (accessed on 15 November 2018).
- Louis, J.; Debaecker, V.; Pflug, B.; Main-Knorn, M.; Bieniarz, J.; Mueller-Wilm, U.; Cadau, E.; Gascon, F. Sentinel-2 Sen2Cor: L2A processor for users. In Proceedings of the Proceedings Living Planet Symposium, Prague, Czech Republic, 9–13 May 2016; pp. 1–8. [Google Scholar]
- Team, Q.D. QGIS Geographic Information System; QGIS Association: Beaverton, OR, USA, 2018. [Google Scholar]
- Huete, A.R. A soil-adjusted vegetation index (SAVI). Remote Sens. Environ. 1988, 25, 295–309. [Google Scholar] [CrossRef]
- Swift, M.; Bignell, D. Standard Methods for Assessment of Soil Biodiversity and Land Use Practice; International Centre for Research in Agroforestry, Southeast Asian Regional Research Programme: Bogor, Indonesia, 2001. [Google Scholar]
- Sandler, R.V.; Falco, L.B.; Di Ciocco, C.; De Luca, R.; Coviella, C.E. Eficiencia del embudo Berlese-Tullgren para extracción de artrópodos edáficos en suelos Argiudoles típicos de la provincia de Buenos Aires. Cienc. Del Suelo 2010, 28, 1–7. [Google Scholar]
- Oliver, I.; Beattie, A.J. A possible method for the rapid assessment of biodiversity. Conserv. Biol. 1993, 7, 562–568. [Google Scholar] [CrossRef]
- Villareal, H.; Álvarez, M.; Córdoba-Córdoba, S.; Escobar, F.; Fagua, G.; Gast, F.; Mendoza-Cifuentes, H.; Ospina, M.; Umaña, A. Manual de Métodos Para el Desarrollo de Inventarios de Biodiversidad; Instituto de Investigación de Recursos Biológicos Alexander Von Humboldt: Bogotá, Colombia, 2004; p. 238. [Google Scholar]
- Magurran, A.E. Measuring Biological Diversity; John Wiley & Sons: Hoboken, NJ, USA, 2013. [Google Scholar]
- Clarke, K.R. Non-parametric multivariate analyses of changes in community structure. Aust. J. Ecol. 1993, 18, 117–143. [Google Scholar] [CrossRef]
- Field, J.; Clarke, K.; Warwick, R. A practical strategy for analysing multispecies distribution patterns. Mar. Ecol. Prog. Ser. 1982, 8, 37–52. [Google Scholar] [CrossRef]
- Johnson, R.A.; Wichern, D.W. Applied Multivariate Statistical Analysis; Pearson: London, UK, 2014; Volume 6. [Google Scholar]
- Kruskal, J.B.; Wish, M. Multidimensional Scaling; Sage Publications: Newbury Park, CA, USA, 1978; p. 93. [Google Scholar]
- Hammer, Ø.; Harper, D.A.; Ryan, P.D. PAST: Paleontological statistics software package for education and data analysis. Palaeontol. Electron. 2001, 4, 9. [Google Scholar]
- Clarke, K.R.; Warwick, R.M. Similarity-based testing for community pattern: The two-way layout with no replication. Mar. Biol. 1994, 118, 167–176. [Google Scholar] [CrossRef]
- Martella, M.; Trumper, E.; Bellis, L.; Renison, D.; Giordano, P.; Bazzano, G.; Gleiser, R. Manual de Ecología. Evaluación de la biodiversidad. Reduca (Biología) 2012, 5, 71–115. [Google Scholar]
- Pla, L. Biodiversidad: Inferencia basada en el índice de Shannon y la riqueza. Interciencia 2006, 31, 583–590. [Google Scholar]
- Buckingham, S.; Murphy, N.; Gibb, H. The effects of fire severity on macroinvertebrate detritivores and leaf litter decomposition. PLoS ONE 2015, 10, e0124556. [Google Scholar] [CrossRef] [Green Version]
- Camero, E.R.; Chamorro, C.B. La fauna edáfica en bosques y plantaciones de coníferas de la Estación San Lorenzo-Sierra Nevada de Santa Marta. Acta Biológica Colomb. 1999, 4, 35–45. [Google Scholar]
- Coyle, D.R.; Nagendra, U.J.; Taylor, M.K.; Campbell, J.H.; Cunard, C.E.; Joslin, A.H.; Mundepi, A.; Phillips, C.A.; Callaham, M.A., Jr. Soil fauna responses to natural disturbances, invasive species, and global climate change: Current state of the science and a call to action. Soil Biol. Biochem. 2017, 110, 116–133. [Google Scholar] [CrossRef]
- Lindo, Z.; Visser, S. Microbial biomass, nitrogen and phosphorus mineralization, and mesofauna in boreal conifer and deciduous forest floors following partial and clear-cut harvesting. Can. J. For. Res. 2003, 33, 1610–1620. [Google Scholar] [CrossRef]
- Culliney, T.W. Role of arthropods in maintaining soil fertility. Agriculture 2013, 3, 629–659. [Google Scholar] [CrossRef] [Green Version]
- Frouz, J. Effects of soil macro-and mesofauna on litter decomposition and soil organic matter stabilization. Geoderma 2018, 332, 161–172. [Google Scholar] [CrossRef]
- Lavelle, P.; Decaëns, T.; Aubert, M.; Barot, S.b.; Blouin, M.; Bureau, F.; Margerie, P.; Mora, P.; Rossi, J.-P. Soil invertebrates and ecosystem services. Eur. J. Soil Biol. 2006, 42, S3–S15. [Google Scholar] [CrossRef]
- Iturrondobeitia, C.; Subías, L. Orden Oribatida (=Cryptostigmata). Rev. IDE@-SEA 2015, 16, 1–17. [Google Scholar]
- Ferragut, F. Orden Prostigmata. Rev. IDE@-SEA 2015, 14, 1–8. [Google Scholar]
- Moraza, M.; Balanzategui, I. Orden Mesostigmata. Rev. IDE@-SEA 2015, 12, 1–16. [Google Scholar]
- Kamczyc, J.; Urbanowski, C.; Pers-Kamczyc, E. Mite communities (Acari: Mesostigmata) in young and mature coniferous forests after surface wildfire. Exp. Appl. Acarol. 2017, 72, 145–160. [Google Scholar] [CrossRef] [PubMed] [Green Version]
- Sileshi, G.; Mafongoya, P. The short-term impact of forest fire on soil invertebrates in the miombo. Biodivers. Conserv. 2006, 15, 3153–3160. [Google Scholar] [CrossRef]
- Arroyo, M.K.; Armesto, J.J.; Rozzi, R.; Peñaloza, A. Bases de la sustentabilidad ecológica y sus implicaciones para el manejo y conservación del bosque nativo en Chile. In Silvicultura de Los Bosques Nativos de Chile; Lara, C., Donoso, C., Eds.; Editorial Universitaria: Santiago, Chile, 1999; pp. 35–60. [Google Scholar]
Figure 1.
Villavicencio study site, commune of Villa Alegre Region del Maule, Chile.

Figure 2.
Jaccard similarity grouping, Kruskal stress = 0.11.


Table 1.
Total abundance of soil arthropods mesofauna per species.
| Soil Arthropods Mesofauna | Severity | Treatment | ||||||||||
|---|---|---|---|---|---|---|---|---|---|---|---|---|
| No Damage | Low | Medium | High | |||||||||
| RTUs | Abundance | % | RTUs | Abundance | % | RTUs | Abundance | % | RTUs | Abundance | % | |
| Arachnida | ||||||||||||
| Acari | ||||||||||||
| Sarcoptiformes | 6 | 62 | 9.27 | 7 | 20 | 2.79 | 3 | 14 | 3.36 | 1 | 1 | 0.70 |
| Mesostigmata | 9 | 137 | 20.48 | 9 | 90 | 12.55 | 7 | 67 | 16.07 | 6 | 33 | 23.24 |
| Oribatida | 18 | 288 | 43.05 | 21 | 252 | 35.15 | 24 | 207 | 49.64 | 7 | 23 | 16.20 |
| Trombidiformes | 5 | 6 | 0.90 | 5 | 36 | 5.02 | 6 | 29 | 6.95 | 4 | 33 | 23.24 |
| Other Acari | 2 | 48 | 7.17 | 2 | 21 | 2.93 | 2 | 7 | 1.68 | 7 | 9 | 6.34 |
| Araneae | 1 | 2 | 0.30 | 1 | 1 | 0.14 | 0 | 0 | 0 | 0 | 0 | 0 |
| Pseudoscorpionida | 1 | 8 | 1.20 | 1 | 7 | 0.98 | 1 | 15 | 3.60 | 0 | 0 | 0 |
| Hexapoda | ||||||||||||
| Ectognatha | ||||||||||||
| Coleoptera | 3 | 20 | 2.99 | 1 | 4 | 0.56 | 3 | 4 | 0.96 | 3 | 7 | 4.93 |
| Diptera | 3 | 13 | 1.94 | 4 | 76 | 10.60 | 2 | 4 | 0.96 | 0 | 0 | 0 |
| Hemiptera | 0 | 0 | 0 | 1 | 1 | 0.14 | 2 | 2 | 0.48 | 0 | 0 | 0 |
| Hymenoptera | 0 | 0 | 0 | 0 | 0 | 0 | 0 | 0 | 0.00 | 1 | 2 | 1.41 |
| Isopoda | 0 | 0 | 0 | 1 | 1 | 0.14 | 1 | 1 | 0.24 | 0 | 0 | 0 |
| Lepidoptera | 1 | 1 | 0.15 | 1 | 1 | 0.14 | 0 | 0 | 0.00 | 1 | 1 | 0.70 |
| Protura | 0 | 0 | 0 | 1 | 37 | 5.16 | 1 | 7 | 1.68 | 1 | 1 | 0.70 |
| Psocoptera | 3 | 4 | 0.60 | 1 | 1 | 0.14 | 2 | 8 | 1.92 | 3 | 10 | 7.04 |
| Thysanoptera | 1 | 1 | 0.15 | 0 | 0 | 0 | 1 | 1 | 0.24 | 1 | 3 | 2.11 |
| Entognatha | ||||||||||||
| Collembola | 9 | 45 | 6.73 | 19 | 137 | 19.11 | 6 | 37 | 8.87 | 5 | 19 | 13.38 |
| Diplura | 2 | 9 | 1.35 | 1 | 4 | 0.56 | 1 | 2 | 0.48 | 0 | 0 | 0 |
| Myriapoda | ||||||||||||
| Chilopoda | 1 | 17 | 2.54 | 1 | 11 | 1.53 | 1 | 12 | 2.88 | 0 | 0 | 0 |
| Symphyla | 1 | 8 | 1.20 | 2 | 17 | 2.37 | 0 | 0 | 0 | 0 | 0 | 0 |
| Total | 66 | 669 | 100 | 79 | 717 | 100 | 63 | 417 | 100 | 40 | 142 | 100 |
Table 2.
R test and p-value from the analysis of similarities (ANOSIM) for paired comparison among fire severity levels.
Table 2.
R test and p-value from the analysis of similarities (ANOSIM) for paired comparison among fire severity levels.
| Bray–Curtis | Jaccard | |||
|---|---|---|---|---|
| Paired Comparison | R | p-Value | R | p-Value |
| ND vs. L | −0.2593 | 0.7986 | −0.0741 | 0.7973 |
| ND vs. M | −0.0741 | 0.6978 | 0.0020 | 0.5992 |
| ND vs. H | 0.5185 | 0.0989 | 0.7407 | 0.1031 |
| L vs. M | −0.2222 | 0.8034 | 0.0001 | 0.4057 |
| L vs. H | 0.4444 | 0.7986 | 0.9630 | 0.0995 |
| M vs. H | 0.2963 | 0.2018 | 0.8704 | 0.0988 |
Table 3.
Mean (±standard error) for diversity and composition structure parameters by fire severity level.
Table 3.
Mean (±standard error) for diversity and composition structure parameters by fire severity level.
| Severity Level | Taxa | Abundance | Dominance | Simpson Index | Shannon Index | Evenness |
|---|---|---|---|---|---|---|
| ND | 11.0 ± 1.52 a | 222.3 ± 108.0 a | 0.23 ± 0.06 a | 0.77 ± 0.06 a | 1.81 ± 0.18 a | 0.60 ± 0.13 a |
| L | 10.6 ± 1.76 a | 239.0 ± 106.0 a | 0.26 ± 0.04 a | 0.73 ± 0.04 a | 1.69 ± 0.10 a | 0.54 ± 0.09 a |
| M | 10.6 ± 1.20 a | 139.0 ± 61.8 a | 0.29 ± 0.07 a | 0.71 ± 0.07 a | 1.66 ± 0.18 a | 0.52 ± 0.08 a |
| H | 8.33 ± 1.33 a | 47.3 ± 14.3 b | 0.25 ± 0.08 a | 0.74 ± 0.08 a | 1.65 ± 0.24 a | 0.66 ± 0.11 a |
Note: Different letters indicate significant differences according to the Tukey’s comparisons test.
Publisher’s Note: MDPI stays neutral with regard to jurisdictional claims in published maps and institutional affiliations. |
© 2021 by the authors. Licensee MDPI, Basel, Switzerland. This article is an open access article distributed under the terms and conditions of the Creative Commons Attribution (CC BY) license (https://creativecommons.org/licenses/by/4.0/).
Share and Cite
MDPI and ACS Style
Castro-Huerta, R.; Morales, C.; Gajardo, J.; Mundaca, E.A.; Yáñez, M. Soil Mesofauna Responses to Fire Severity in a Sclerophyllous Forest in Central Chile. Forests 2021, 12, 1444. https://0-doi-org.brum.beds.ac.uk/10.3390/f12111444
AMA Style
Castro-Huerta R, Morales C, Gajardo J, Mundaca EA, Yáñez M. Soil Mesofauna Responses to Fire Severity in a Sclerophyllous Forest in Central Chile. Forests. 2021; 12(11):1444. https://0-doi-org.brum.beds.ac.uk/10.3390/f12111444
Chicago/Turabian StyleCastro-Huerta, Ricardo, Carolina Morales, John Gajardo, Enrique A. Mundaca, and Marco Yáñez. 2021. "Soil Mesofauna Responses to Fire Severity in a Sclerophyllous Forest in Central Chile" Forests 12, no. 11: 1444. https://0-doi-org.brum.beds.ac.uk/10.3390/f12111444
Note that from the first issue of 2016, this journal uses article numbers instead of page numbers. See further details here.