Article

Thinning Effect of C Sequestration along an Elevation Gradient of Mediterranean Pinus spp. Plantations

by
Antonio M. Cachinero-Vivar
,
Guillermo Palacios-Rodríguez
,
Miguel A. Lara-Gómez
and
Rafael M. Navarro-Cerrillo
*
Department of Forestry, School of Agriculture and Forestry, University of Cordoba, DendrodatLab-ERSAF, Laboratory of Dendrochronology, Silviculture and Climate Change, Edif. Leonardo da Vinci, Campus de Rabanales s/n, 14071 Córdoba, Spain
*
Author to whom correspondence should be addressed.
Submission received: 12 October 2021 / Revised: 12 November 2021 / Accepted: 15 November 2021 / Published: 17 November 2021
(This article belongs to the Special Issue Adaptive Forest Management to Climatic Change)

Abstract

:
Forests are key elements in mitigating the effects of climate change due to the fact of their carbon sequestration capacity. Forest management can be oriented to optimise the carbon sequestration capacity of forest stands, in line with other productive objectives and the generation of ecosystem services. This research aimed to determine whether thinning treatments have a positive influence on the growth patterns of some of the main Mediterranean pine species and, therefore, on their Carbon (C) fixation capacity, both in terms of living biomass and soil organic carbon. The results obtained show that C sequestration capacity (biomass and SOC) increased at higher thinning intensities due to the induced alterations in tree growth patterns. We observed almost a 1.5-fold increase in P. nigra and P. sylvestris, respectively, and over a two-fold increase in P. pinaster under heavy thinning treatments; SOC stocks were affected by the intensity of the thinning treatments. These results can contribute to improving silvicultural practices aimed at C sequestration in forest plantations located in dry areas of the Mediterranean.

1. Introduction

Forests ecosystems are key elements in the mitigation of global warming through their carbon-fixing capacity [1]. Over the last decades, it has been witnessed how politicians are keen on controlling and reducing excessive anthropogenic activities such as the conversion of forests into croplands and urban areas. The Intergovernmental Panel on Climate Change’s report [2] addressed the response of countries to reduce the constant increase in atmospheric CO2 and, consequently, global warming alterations. Terrestrial carbon sinks are considered by the Kyoto Protocol (KP) to offset greenhouse gas emissions. By doing this, an opportunity is provided to count net changes and develop evidence that soil carbon stocks could be affected by management practices [3]. Recent concerning underestimations regarding global CO2 emission sources have been brought to attention by policymakers. These measurements are critically pointing at global C sequestration to assess the impact of forest management on climate change mitigation (EASAC). A sharp increase in forest harvesting has been found in 26 European countries with potential climate change impacts from forest carbon sequestration and other ecosystem services containing C impacts associated with increased forest harvesting [4].
Silvicultural treatments, normally used for ecological or economic purposes, aim to maximise forest resources, although biodiversity and biological interactions might be indirectly improved [5]. Notwithstanding, timber production, or the process of managing stands seeking woody outputs, is the main goal when seeking an economic asset. A solution combining both purposes would provide the possibility of improving the carbon storage of forests through new forest management practices [6]. Forest management, especially harvesting, could shift soil C balance [7]. Thinning and harvesting techniques are the most influential measures to affect the amount of carbon sequestered [8]. Thinning generally changes the microclimate in pine forests, producing an impact on the amount of litter in the soil, which is temporarily lowered in heavily thinned stands. Thus, thinning contributes to boosting the decomposition rate of forest floor C, since evapotranspiration and soil C pools decrease, affecting the understory herbs as well as soil productivity in nutrient availability [3,9,10,11]. Numerous studies have described the benefits of thinning on increasing tree growth rate and forest productivity due to the reduction in competition for resources [12,13,14].
Soil organic carbon (SOC) present in the forest, known as a natural form of energy storage, is a major contributor to overall soil health and climate change [15], and it could be a determinant barrier to controlling excess anthropogenic CO2 emissions. It is also known that from the total carbon accumulated in boreal forests, approximately 30% is stored in soil [16]. SOC concentrations are low in arid regions [1], and due to the impact of climate change, the rise in temperatures will generally lead to a decrease in SOC of 28% in humid, 20% in sub-humid, and approximately 15% in arid zones, which are the objects of this study [17,18]. It is widely recognised that forest soil carbon is a key factor in the global carbon cycle [6]. The understanding of all links in stocks and fluxes in the global C balance is extremely important for categorising the sources and sinks of C and to developing mitigation strategies for climate change. These mitigation strategies require increasing the C sequestration capacity of forest ecosystems and designing adaptive forest management strategies [19,20]. Mediterranean arid zones are considered vulnerable in the context of climate change [21]. Pine plantations established at the rear edge of species distribution are under a notorious growing threat, becoming drier and vulnerable to drought and wildfires as well as limiting its growing resources over time, producing mortality that affects forest ecosystem dynamics such as the carbon balance. Particularly, in dry areas in the Mediterranean Basin, an increase in arid conditions were observed to be linked to a more frequent diminution of precipitation triggering forest dieback [22]. In this sense, adult trees are seeing an increased mortality rate because of summer drought and limited silvicultural practices [23]. The continuous debilitation of forest vigour promotes an increase in carbon emissions [24]. In this paper, we studied the effect of different thinning intensities on C pools (biomass and soil) and sequestration for three Mediterranean pine species (i.e., Pinus pinaster L., P. nigra Arnold. and P. sylvestris L.). These practices can certainly lead to long-term C sequestration in Mediterranean forest soils. With this in mind, we aimed to obtain promising answers for the following hypotheses: (a) Do thinning treatments positively alter tree growth patterns in Mediterranean pine species and, therefore, the biomass C dynamic? (b) Are biomass and soil organic carbon storage that are modulated by thinning treatments beneficial to climate sensitivity? (c) Are we then managing our forests efficiently? The results of this work can contribute to improving the silvicultural practices oriented to the sequestration of C in forest plantations located in dry Mediterranean areas.

2. Materials and Methods
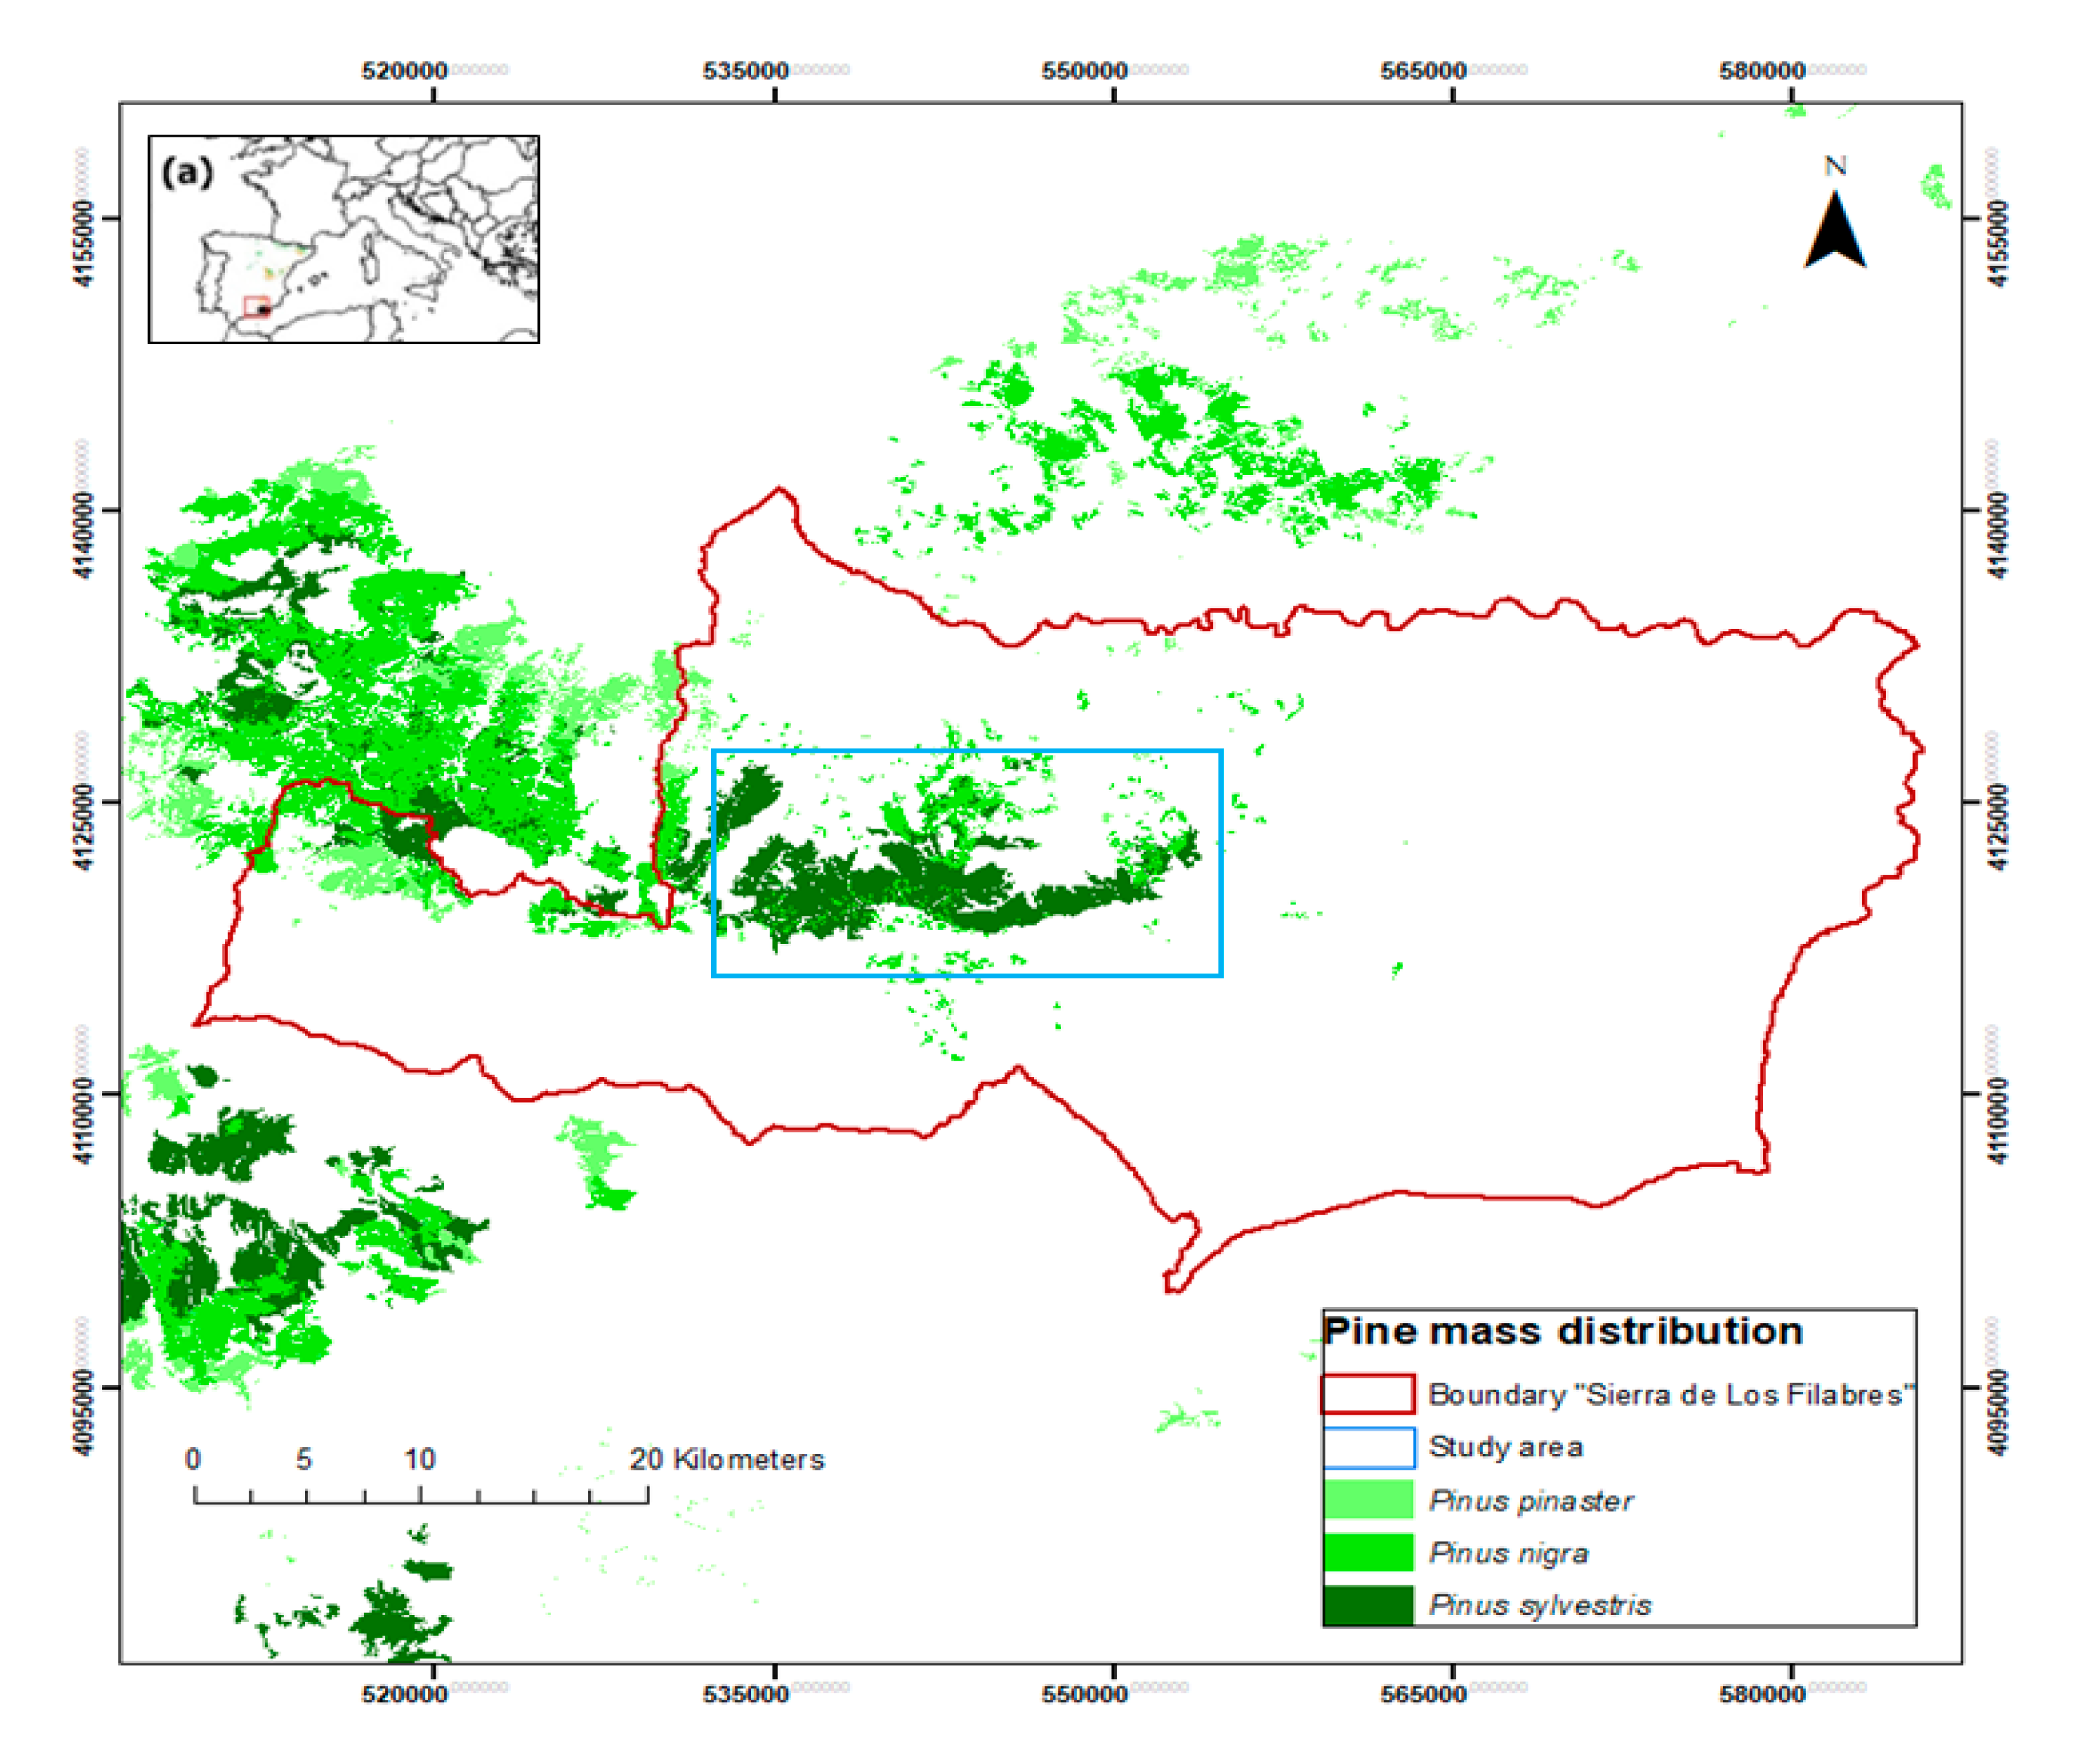
2.1. Study Area

The study area was located at Sª de Los Filabres, southeastern mountains of the Andalusia region, Almeria, Spain (Figure 1): 37°22′ N, 2°50′ W. The terrain, extending across 45,000 ha, possess a notable altitudinal distribution that varies between 750 and 2168 m.a.s.l.; thus, a wide range of bioclimes are present [25]. The mean annual precipitation is near 320 mm, and the mean annual temperature oscillates between 7 and 16 °C, being appertained within the Mediterranean semi-arid climate region (Figure S1). Geologically, the area has a pH between 6.5 and 7 and is characterised with xerorthents regosols and limestone substrate [26], mainly developed on schists and quartzites enriched with abundant slates and shales with steep slopes greater than 35% as the predominant topography. Most of the forest stands in the area come from reforestation undertaken toward the third quarter of the last century, with the most frequently used species being Pinus pinaster, P. nigra, P. sylvestris and P. halepensis. Some natural areas of native pine stands can also be found over the mentioned area.

2.2. Experimental Design and Field Data

In June 2008, a thinning experiment was established. The experimental design was based on a randomised complete block setup with three blocks and three treatments for each of the studied species [27]. The chosen layout of the plots and the blocks’ location were placed next to each other with a 15 m wide buffer strip around the 1600 m2 area related to each plot to minimise microclimatic, site and edaphic variations across the experimental design. Three intensities of thinning were applied:heavy thinning (T60) with the removal of 60% of the initial basal area (BA), moderate thinning (T30) removing 30% of the initial BA, and control (C) or no thinning area (Table 1). Thinning treatments were carried out with the main objective of removing overgrown, undersized, dying or suppressed trees to promote future development under natural conditions and uniform densities and spacing. Thinning debris, such as slash and stumps, were removed from the experimental plots. All trees with a diameter at breast height (1.3 m above ground level) larger than 10 cm were measured, labelled and had their dasometric variables measured, that is: diameter at breast height (dbh, cm) using a calliper (Haglöf Mantax, Långsele, Sweden), total height (H, m) using a Vertex III hypsometer (Haglöf, Sweden), stand density (N, stems/ha−1) and basal area (G, m2 ha−1) (Table 1).
Above and belowground biomass (Mg ha−1) were obtained using the allometric models developed for softwood species [28], as the compute of the compartment was calculated using biomass Equations (1)–(4) (Table S1). At this point, a 0.5 standard coefficient was applied to assess the biomass C content [29].

2.3. Soil Sampling and Analysis

In June 2016, an extensive field survey took place to select the soil sampling locations in which both orographic and physiographic conditions were considered. Soil sampling was performed by establishing a 12-point soil sampling grid inside the 40 × 40 m2 experimental plot for each of the proposed treatments. Points were taken with a 5 m margin to the border and a 15 m distance between them and the central samples. Hereafter, systematic distribution of transects lines according to the maximum slope was represented. Soil extractions were conducted and sampled together by layers at four fixed–equal intervals (0–10, 10–20, 20–30 and 30–40 cm) below the forest floor. These were taken using a steel corer (8 cm diameter and 60 cm length) reaching up to a 40 cm depth. Following the chosen extraction procedure, 48 soil soundings were priory projected in each plot. Nevertheless, in some cases, the point location slightly shifted due to the rocky formation of the soil, where it was not feasible to extract the entire sample length. There was a litter layer on these sites; however, this was not sampled since the C present on it produces an overestimation in the final output.
Upon receiving the soil extractions in the laboratory, they were carefully placed to be air dried. Once finished, coarse (≥2 mm) and fine (<2 mm) particles were separated with a sieve. Coarse material was then weighted and stored, and the resultant fine particles fraction was sieved through a 0.5 mm mesh and kept for SOC determination, drawing out all particulate organic matter. At this point, three replicates of each measurement were processed for each of the soil samples. The Walkey–Black method via wet oxidation [30] was applied over the fine fraction to obtain the organic carbon content, and the bulk density (BD) layered in the soil was calculated following [31] (1)–(3) in g cm−3:
BD = 100/((%OM)/(0.244) + (100 − %OM)/1.64)
Soil organic matter percentage (SOM) was obtained using a 1.64 constant for mineral bulk density [32], and soil organic carbon stock (SOC-S) was consequently obtained in Mg ha−1 following [33]:
%OM = %SOC ∗ 1.724
SOC-S = SOC ∗ BD ∗ D
where 1.724 is the Van Bemmelen constant factor, D is the thickness of the analysed layer (cm) and SOC40-S is the sum of the SOC in the first 40 cm from the soil’s surface obtained for each horizon.
The plots’ establishment, soil samples’ position, tree layer’s structure as well as tree positions were obtained using Field-Map technology (IFER-MMS, Field-Map Technology 6 July 2017, and https://www.field-map.com). This technology permits gauging at the level of a single tree measurement through to a level of research or inventory plot for both mapping and dendrometric measurements.

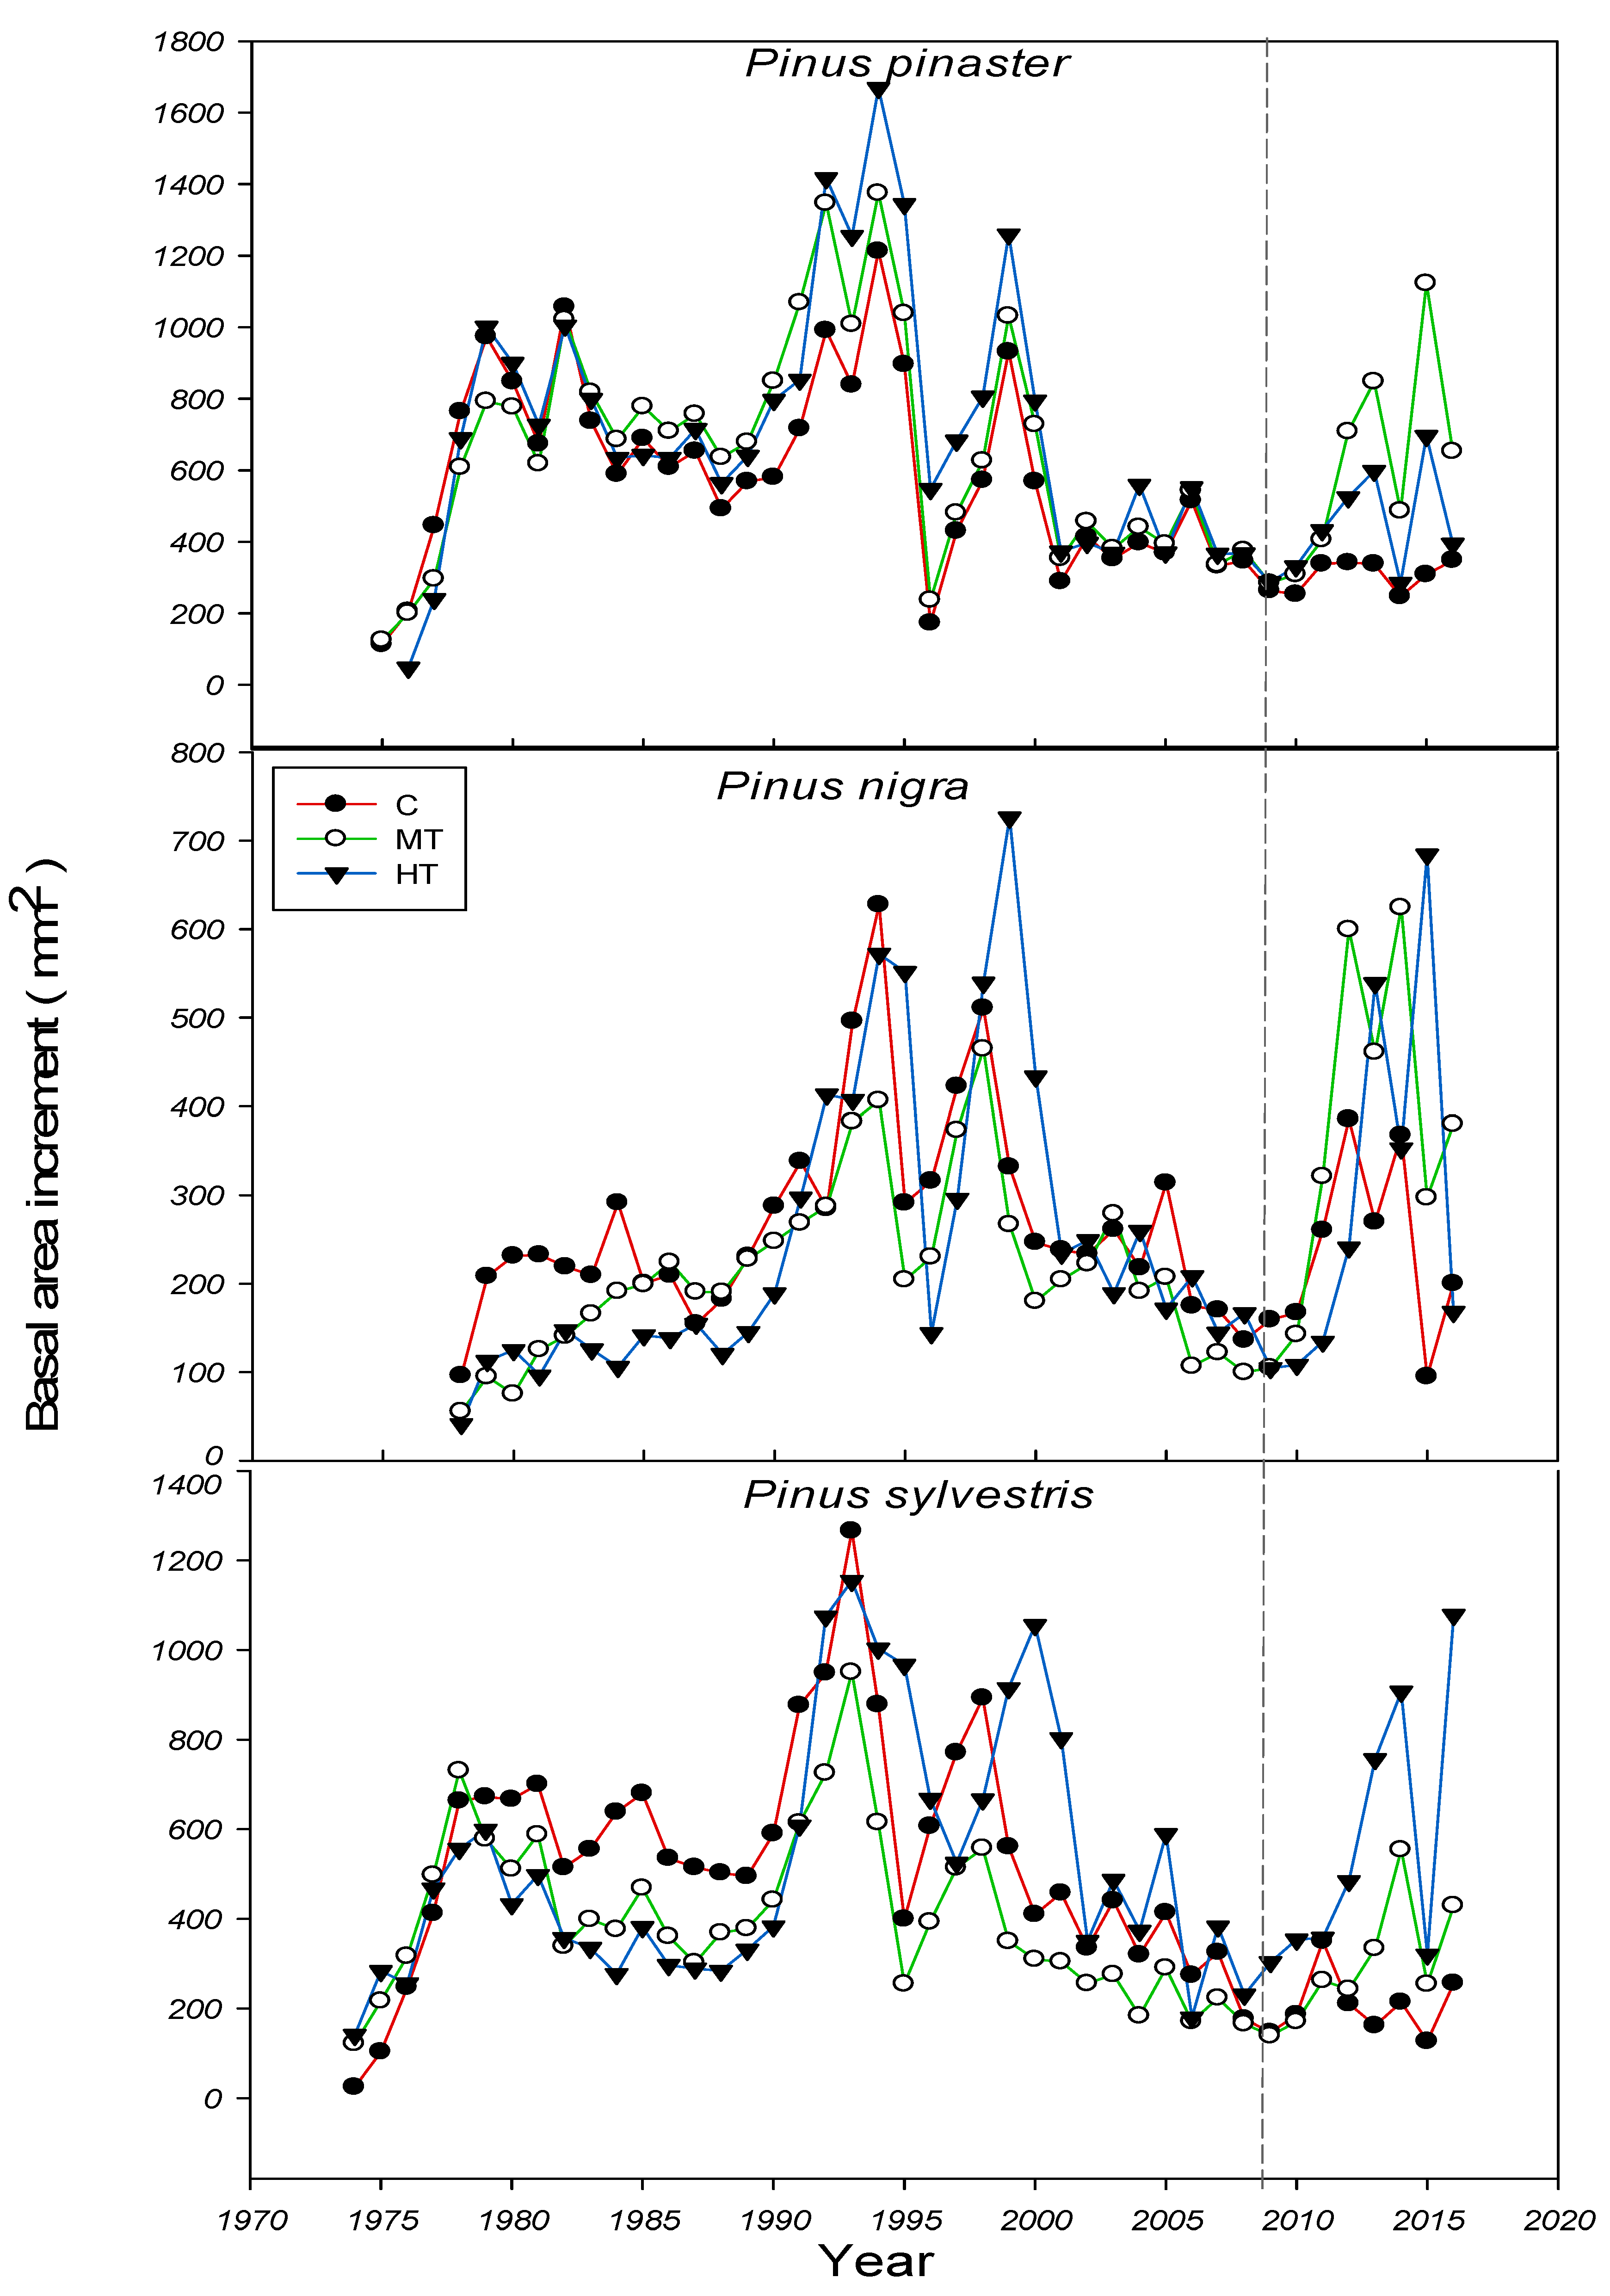
2.4. Dendrochronological Sampling and Analysis

As a complementary tool to assess the impact of thinning on tree growth, in June 2016, 15 dominant trees in each plot with a dbh larger than 15 cm were cored with a Pressler increment borer at 1.3 m above ground level. Samples were extracted in pairs from each tree following the direction perpendicular to the maximum slope [34], separated by at least 90º. Upon arrival of the individually labelled samples at the laboratory, cores were air dried at room temperature before preparing them with sandpaper using a progressively finer grain to allow for clear tree-ring exposure for cross-dating analysis [35]. Annual increments were scanned at a 1600 dpi resolution and measured to the nearest 0.01 mm accuracy with a LINTAB device (Rinntech, Heidelberg, Germany), where tree-ring width series were obtained and subsequently evaluated using the computer program COFECHA [36], which adds a high degree of confidence that tree-ring series have been, first, measured accurately and, secondly, cross-dated correctly. Hereafter, with the objective of determining the best growth response for each thinning treatment, tree-ring width data were transformed into the basal area increment (BAI, cm2) using the following formula:
BAI = π (R2 t − R2 t−1)
where R corresponds to the tree radius, and t is the year of tree-ring formation.
Residual chronologies of the ring-width index (RWI) were complementarily obtained once the influence of long-term biological trends on radial growth was discarded, due to the increasing tree size and age, by applying a double-detrending of the tree ring series upon fitting spline and negative exponential curves to each series, provided by the dplR package in R software.

2.5. Statistical Analysis

The impact of forest thinning treatments at the plot level on C sequestration was statistically analysed. The normality of the variables (Shapiro–Wilk test, n ≤ 50, p < 0.05) and homoscedasticity (Levene’s test, p < 0.05) were studied. Variables that did not fit the normal distribution were transformed by the square root function, since the exponential function did not fit the criteria. The comparison of growth between thinning treatments and tree species was performed using one-way analysis of variance (ANOVA, p < 0.05 for variables with normal distribution and homoscedasticity, penalizing by Bonferroni’s procedure (p < 0.047). Tamhane tests (p < 0.05) were applied when the variables fit a normal distribution but were heteroscedastic. SOC was analysed according to soil layers (0–10, 10–20, 20–30 and 30–40 cm) as well as for the whole soil depth (0–40 cm). To quantify the trends in radial growth, dendrochronological results were also statistically assessed for the last 20 years’ growth frame as well as pre- and post-thinning year treatments upon applying the same analysis test. An additional array of dendrochronological parameters was statistically derived to provide greater consistency to our analysis, considering the entire growth period and the growth achieved pre- and post-thinning year for the studied species across treatments. Mean sensitivity (MS), a measure of the relative difference of indexed tree-ring width from one year to the next, mean among trees correlation (Rbar) and derived chronology reliability through expressed population signal (EPS) were calculated. All statistical analyses were performed using “R” version 3.3.1 [37].

3. Results

Our results showed no significant differences in the total carbon stock accumulated in the above and belowground biomass. In P. pinaster, C content increased from 33.2 Mg of C ha−1 in the control plots to 49.6 Mg of C ha−1 in moderate thinning and 73.1 Mg of C ha−1 in heavy thinning 8 years after thinning (F = 1.40, p = 0.316). The same trend was observed in P. nigra (29.0, 33.0 and 36.4 Mg of C ha−1, respectively, F = 0.07, p = 0.925) and P. sylvestris (38.5, 43.0 and 51.5 Mg of C ha−1, respectively, F = 0.27, p = 0.765) (Table 2).
Total SOC in the top 40 cm of mineral soil showed different patterns across species and treatments, ranging from 18.5 Mg C ha−1 in the control up to 28.1 Mg C ha−1 in moderate thinning but reducing to 15.5 Mg C ha−1 in heavy thinning for P. pinaster (F = 6.39, p = 0.700). On the contrary, SOC decreased in the control treatment (27.6 Mg C ha−1) to moderate (23.4 Mg C ha−1) and heavy (22.6 Mg C ha−1) thinning treatments (F = 1.89, p = 0.158). With considerably higher values, SOC also decreased in the control (37.0 Mg C ha−1) to moderate (31.6 Mg C ha−1) and slightly higher in heavy (34.0 Mg C ha−1) thinning treatments (F = 1.23, p = 0.297) (Figure S2, Tables S2 and S3).
BAI values, considering the last 20 years of growth, were significantly affected by thinning intensity. For P. pinaster, BAI20 increased from 4.27 cm2 in the control to 5.33 cm2 in moderate thinning and 5.23 cm2 in heavy thinning (F = 1.431, p > 0.243). Similar trends were observed for P. sylvestris (3.57, 2.93 and 5.50 cm2, respectively, F = 4.691, p < 0.010), and for P. nigra (2.49, 2.79 and 2.99 cm2, respectively), although in this case differences were not significant (F = 0.510, p > 0.602). Growth rates before and after thinning year (2008) showed no significant differences in P. pinaster (4.10 vs. 5.77 mm in moderate and 4.19 vs. 4.43 mm in heavy thinning, Fpre = 1.424, p > 0.246; Fpost = 1.861, p > 0.180). Considerably smaller growth rates were observed in P. nigra stands (1.66 vs. 4.03 mm in moderate and 1.69 vs. 3.52 mm in heavy thinning, Fpre = 1.773, p > 0.175; FpostT = 2.090, p > 0.150) and P. sylvestris (2.13 vs. 3.01 mm in moderate and 3.62 vs. 5.87 mm and heavy thinning, Fpre = 3.151, p < 0.046; Fpost = 7.082, p < 0.004) (Table 3 and Table S4).

4. Discussion

Through this work deployment, we have brought to the fore the importance of modulating forest structure after analysing experimental data to extricate the fluctuations in forest growth dynamics, biomass generation and carbon storage affections, which were generated upon varying forest structures via thinning treatment intensities for three of the most important pine species across the Mediterranean Basin. These results further strengthen our confidence, demonstrating how methodical forest management practices can certainly modulate carbon sequestration and forest health over time.
Differences found in the amount of C in the live tree biomass components (above and below ground) were previously demonstrated, where biomass C stock was significantly higher in unthinned plots [8,38,39,40,41] in P. halepensis, P. pinaster, P. nigra and P. sylvestris populations at a non-approximate location to one another. In contrast, biomass content was assessed considering proximity among species at its harshest edafo-climatic conditions, with a positive increase in C stocks across thinning treatments. Even though the basal area diminished with biomass loss due to the thinning operations, the trees chosen to remain in the thinned plots were those dominants in the stand; thus, the mean diameter at breast height considerably increased due to the reduced competition for resources. Consequently, an exponential trend in C stocks was observed where the thinning was more intense, resulting in an almost 1.5-fold increase in P. nigra and P. sylvestris, respectively, and over a two-fold increase in P. pinaster under heavy thinning treatments (Table 2). Hence, in line with our first hypothesis, thinning treatments altered tree growth patterns in response to mass adaptation when competition for essential resources is diminished, allowing those thinned stands to produce greater trees upon internally fixing C via live biomass generation.
Forest management treatments, such as thinning and harvesting, modify soil C dynamics, resulting in the variation of soil conditions. However, these variations through thinning treatments across soil horizons fluctuated depending on the species, location, parent material and whether the harvesting biomass removed was left on site after thinning operations in addition to its historical management. In the Mediterranean area, soil C stocks are usually lower in content than those located in less arid conditions [42]. Surveyed stands were situated in shallow soils with a low or non-existing humus surface horizon directly overlying the weathering rock in a landscape with active erosion processes, associated with soil degradation and the reduction of valuable land to desertification due to the strong interconnection between biophysical and anthropogenic components caused by agricultural abandonment over the past decades. Hence, looking at our soil data, the tested thinning intensities showed how the soil C stock trend suffered a reduction from the top horizon layer up to 40 cm depth, which is in accordance with [43], except in the unthinned plots where P. nigra was present. P. pinaster significantly affected the C stock in moderate thinning plots, up to the first 30 cm. In addition, the experimental thinning treatments did not greatly increment across intensities and species as reported in previous findings [44,45] due to the harvest management residue impact, except for P. pinaster, where a significant difference was notable in the moderate treatment. This carbon recovery 8 years after harvesting was the principal source of fluctuation [7].
Forest rotation lengths were designed to maintain timber production regularly as well as to sequester carbon through above- and below-ground biomass generation. However, the ability to prove the efficiency of such management practices relies on how we manage our forest plantations.
Looking at the historical climatic characterisation, including mean annual temperature, spring precipitation and annual SPEI (Figure S1), and supporting this with tree growth in terms of basal area increment (Figure 2), and ring width index (Figure S3) in the years characterised by severe droughts before (1995 and 2005) and after thinning treatments (2012 and 2015), a decline in radial growth was induced [22] and, therefore, in C sequestration also, indicating how biomass and soil organic carbon storage are modulation benefits climate sensitivity, which is in concordance with our second hypothesis.
Such differences found in terms of C sequestration in unmanaged to managed forests outline the relevant importance of combating forest decline against mitigation effects. As previously reported [40,46], special care should be taken in efficiently managing our forests by applying silvicultural treatments that ensure sustainable ecosystem regulation.

5. Conclusions

This research work highlighted the importance of forest management in modulating the capacity of forest stands as carbon sinks. By managing the intensities of the thinning treatments within the designed silvicultural itineraries, the carbon sequestration capacity of P. pinaster, P. nigra and P. sylvestris forest stands in Mediterranean environments can be increased, and it can also contribute to the improvement of forest health over time. Thus, carbon sequestration capacity over time tends to increase markedly at higher thinning intensities due to the induced alterations in tree growth patterns. Remnant trees showed a positive response when competition for resources decreased, allowing for a higher generation of live biomass and increasing SOC stocks at stand level and, thus, a higher carbon sequestration capacity of the forest stand.

Supplementary Materials

The following are available online at https://0-www-mdpi-com.brum.beds.ac.uk/article/10.3390/f12111583/s1, Figure S1: (Above) Historic climate characterisation of the study considering mean annual temperature (T); (Below) spring precipitation (P) and the annual standardised precipitation evapotranspiration index (SPEI) for the 1950–2016 period (r2 and P correspond to annual temperature and the SPEI statistics); Figure S2: Depth distribution of SOC (Mg C ha−1) by species and grade of thinning. Control or unthinned plots (0% of BA removed), moderate plots (30% of BA removed) and heavy plots (60% of BA removed) at Sª de Los Filabres (Almeria, Spain); Figure S3: Chronologies of growth index (RWI) for Pinus pinaster, Pinus nigra and Pinus sylvestris. The vertical, dashed lines correspond to the 2008 thinning year. Treatments: C—control (0% BA removed); MT—moderate thinning (30% BA removed), HT—heavy thinning (60% BA removed); Table S1: Selected biomass models for Pinus spp. Ws: biomass weight of the stem fraction; Wb7: biomass weight of the thick branch fraction with a diameter greater than 7 cm; Wb2–7: biomass weight of the medium branch fraction with a diameter between 2 and 7 cm; Wb2+n: biomass weight of the thin branch fraction with a diameter smaller than 2 cm, with needles; Wr: biomass weight of the below-ground fraction (all in kg); d = dbh (cm); h = tree height (m). Equations were indexed by compartments for stem biomass (1), thick branches (2), medium branches (3), thin branches + needles (4), and roots (5); Table S2: ANOVA comparison of species with SOC distribution across horizons and total depth at Sª de Los Filabres (Almeria, Spain). Significant differences indicated by p < 0.05 and no significant differences by p > 0.05; Table S3: ANOVA multiple comparisons of total SOC for the studied species among treatments. Control (0%), moderate thinning (30%) and heavy thinning (60%) at Sª de Los Filabres (Almeria, Spain). Significant differences indicated by p < 0.05 and no significant differences by p > 0.05; Table S4: ANOVA comparison and Post Hoc analysis of standard BAIn, BAI pre & post-thinning year against treatments (C, control; MT, moderate thiunnig; HT, heavy thinning at Sª de Los Filabres (Almeria, Spain). Significant differences (p < 0.05) and no significant differences (p > 0.05) (p < 0.05, * p < 0.01).

Author Contributions

R.M.N.-C., A.M.C.-V. and G.P.-R. planned and designed the research. A.M.C.-V. performed the data analysis. M.A.L.-G. and G.P.-R. conducted the fieldwork and contributed to data elaboration and analysis. A.M.C.-V. and R.M.N.-C. wrote the manuscript, with contributions by all authors. All authors have read and agreed to the published version of the manuscript.

Funding

This research was collaboratively funded by the LIFE FOREST CO2 “Assessment of Forest-Carbon Sinks and Promotion of Compensation Systems as Tools for Climate Change Mitigation” (European Commission LIFE14 CCM/ES/001271), ESPECTRAMED (CGL2017–86161-R) and ISO-Pine (UCO-1265298) projects. The information included reflects only the opinion of the authors, and the European Commission/Agency is not responsible for any use that may be made of the information contained in this scientific paper.

Data Availability Statement

The data that support the findings of this study are available on request from the last author, R.M.N.-C. The data are not publicly available due to the fact of project restrictions.

Acknowledgments

The authors thank the Andalucía Department of Agriculture and Environment, which provided access to and background information on the field site. We are very grateful to Francisco Pereña, Emidio Silveiro and Andrés Cortés for their valuable assistance during fieldwork and data acquisition and processing; without them, this project would not have been possible. We also thank Marta Álvarez for guidance regarding interpretation of the soil data. We also acknowledge the institutional support of the University of Cordoba-Campus de Excelencia CeiA3.

Conflicts of Interest

The authors declare no conflict of interest. The funders had no role in the design of the study; in the collection, analyses, or interpretation of data; in the writing of the manuscript, or in the decision to publish the results.

References

  1. Lal, R. Soil carbon sequestration to mitigate climate change. Geoderma 2004, 123, 1–22. [Google Scholar] [CrossRef]
  2. McCarthy, J.J.; Canziani, O.F.; Leary, N.A.; Dokken, D.J.; White, K.S. (Eds.) Climate Change 2001: Impacts, Adaptation, and Vulnerability: Contribution of Working Group II to the Third Assessment Report of the Intergovernmental Panel on Climate Change; Cambridge University Press: Cambridge, UK, 2001. [Google Scholar]
  3. Jandl, R.; Lindner, M.; Vesterdal, L.; Bauwens, B.; Baritz, R.; Hagedorn, F.; Johnson, D.W.; Minkkinen, K.; Byrne, K.A. How strongly can forest management influence soil carbon sequestration? Geoderma 2007, 137, 253–268. [Google Scholar] [CrossRef]
  4. Ceccherini, G.; Duveiller, G.; Grassi, G.; Lemoine, G.; Avitabile, V.; Pilli, R.; Cescatti, A. Abrupt increase in harvested forest area over Europe after 2015. Nature 2020, 583, 72–77. [Google Scholar] [CrossRef] [PubMed]
  5. Spake, R.; Yanou, S.; Yamaura, Y.; Kawamura, K.; Kitayama, K.; Doncaster, C.P. Meta-analysis of management effects on biodiversity in plantation and secondary forests of Japan. Conserv. Sci. Pract. 2019, 1, e14. [Google Scholar] [CrossRef]
  6. Bonan, G.B. Forests and climate change: Forcings, feedbacks, and the climate benefits of forests. Science 2008, 320, 1444–1449. [Google Scholar] [CrossRef] [PubMed] [Green Version]
  7. Nave, L.E.; Vance, E.D.; Swanston, C.W.; Curtis, P.S. Harvest impacts on soil carbon storage in temperate forests. For. Ecol. Manag. 2010, 259, 857–866. [Google Scholar] [CrossRef]
  8. Ruiz-Peinado, R.; Bravo-Oviedo, A.; López-Senespleda, E.; Montero, G.; Río, M. Do thinnings influence biomass and soil carbon stocks in Mediterranean maritime pinewoods? Eur. J. For. Res. 2013, 132, 253–262. [Google Scholar] [CrossRef]
  9. Roig, S.; del Río, M.; Cañellas, I.; Montero, G. Litter fall in Mediterranean Pinus pinaster Ait. stands under different thinning regimes. For. Ecol. Manag. 2005, 206, 179–190. [Google Scholar] [CrossRef]
  10. Pang, X.; Bao, W.; Zhu, B.; Cheng, W. Responses of soil respiration and its temperature sensitivity to thinning in a pine plantation. Agric. For. Meteorol. 2013, 171, 57–64. [Google Scholar] [CrossRef]
  11. Noormets, A.; Epron, D.; Domec, J.C.; McNulty, S.G.; Fox, T.; Sun, G.; King, J.S. Effects of forest management on productivity and carbon sequestration: A review and hypothesis. For. Ecol. Manag. 2015, 355, 124–140. [Google Scholar] [CrossRef] [Green Version]
  12. Horner, G.J.; Baker, P.J.; Mac Nally, R.; Cunningham, S.C.; Thomson, J.R.; Hamilton, F. Forest structure, habitat and carbon benefits from thinning floodplain forests: Managing early stand density makes a difference. For. Ecol. Manag. 2010, 259, 286–293. [Google Scholar] [CrossRef]
  13. Martín-Benito, D.; Del Río, M.; Heinrich, I.; Helle, G.; Cañellas, I. Response of climate-growth relationships and water use efficiency to thinning in a Pinus nigra afforestation. For. Ecol. Manag. 2010, 259, 967–975. [Google Scholar] [CrossRef]
  14. Sohn, J.A.; Saha, S.; Bauhus, J. Potential of forest thinning to mitigate drought stress: A meta-analysis. For. Ecol. Manag. 2016, 380, 261–273. [Google Scholar] [CrossRef]
  15. Smith, P.; Fang, C.; Dawson, J.J.; Moncrieff, J.B. Impact of global warming on soil organic carbon. Adv. Agron. 2008, 97, 1–43. [Google Scholar] [CrossRef]
  16. Janssens, I.A.; Freibauer, A.; Ciais, P.; Smith, P.; Nabuurs, G.J.; Folberth, G.; Schlamadinger, B.; Hutjes, R.W.; Ceulemans, R.; Schulze, E.D.; et al. Europe’s terrestrial biosphere absorbs 7 to 12% of European anthropogenic CO2 emissions. Science 2003, 300, 1538–1542. [Google Scholar] [CrossRef] [PubMed] [Green Version]
  17. Bottner, P.; Coûteaux, M.M.; Vallejo, V.R. Soil organic matter in Mediterranean-type ecosystems and global climatic changes: A case study—The soils of the Mediterranean Basin. In Global Change and Mediterranean-Type Ecosystems; Springer: New York, NY, USA, 1995; pp. 306–325. [Google Scholar] [CrossRef]
  18. Cheddadi, R.; Guiot, J.; Jolly, D. The Mediterranean vegetation: What if the atmospheric CO2 increased? Landsc. Ecol. 2001, 16, 667–675. [Google Scholar] [CrossRef]
  19. Schlesinger, W.H.; Amundson, R. Managing for soil carbon sequestration: Let’s get realistic. Glob. Chang. Biol. 2019, 25, 386–389. [Google Scholar] [CrossRef] [PubMed] [Green Version]
  20. Finzi, A.C.; Giasson, M.A.; Plotkin, A.A.B.; Aber, J.D.; Boose, E.R.; Davidson, E.A.; Dietze, M.C.; Ellison, A.M.; Frey, S.D.; Goldman, E.; et al. Carbon budget of the Harvard Forest Long-Term Ecological Research site: Pattern, process, and response to global change. Ecol. Monogr. 2020, 90, e01423. [Google Scholar] [CrossRef]
  21. Schröter, D.; Cramer, W.; Leemans, R.; Prentice, I.C.; Araújo, M.B.; Arnell, N.W.; Bondeau, A.; Bugmann, H.; Carter, T.R.; Gracia, C.A.; et al. Ecosystem service supply and vulnerability to global change in Europe. Science 2005, 310, 1333–1337. [Google Scholar] [CrossRef] [Green Version]
  22. Salguero, R.S.; Cerrillo, R.M.; Camarero, J.J.; Cancio, A.F. Drought-inducted growth decline of Aleppo and maritime pine forests in south-eastern Spain. For. Syst. 2010, 19, 458–469. [Google Scholar]
  23. Bravo, F.; Bravo-Oviedo, A.; Diaz-Balteiro, L. Carbon sequestration in Spanish Mediterranean forests under two management alternatives: A modeling approach. Eur. J. For. Res. 2008, 127, 225–234. [Google Scholar] [CrossRef]
  24. Leemans, R.; Rounsevell, M.D.; Midgley, G.F.; Price, J.T.; Fischlin, A.; Dube, O.P.; Velichko, A.A.; Tarazona, J.; Gopal, B.; Turley, C. Ecosystems, their properties, goods and services. In Climate Change: Impacts, Adaptation and Vulnerability. Contribution of Working Group II to the Fourth Assessment Report of the Intergovernmental Panel on Climate Change; Cambridge University Press: Cambridge, UK, 2007. [Google Scholar]
  25. De Giles, J.P.; Martínez, A.M.; Sola, A.J.; Poveda, J.F.M. Análisis corológico y novedades florísticas de la Sierra de los Filabres (Andalucía Oriental, España). Lagascalia 2006, 26, 51–70. [Google Scholar]
  26. Nicolás, A.D.; Gandullo, J.M. Ecología de los Pinares Españoles. I. Pinus Pinaster Ait; Ministerio de Agricultura, Instituto Forestal de Investigaciones y Experiencias: Madrid, Spain, 1967. [Google Scholar]
  27. Queen, J.P.; Quinn, G.P.; Keough, M.J. Experimental Design and Data Analysis for Biologists; Cambridge University Press: Cambridge, UK, 2002. [Google Scholar]
  28. Ruiz-Peinado, R.; del Rio, M. New models for estimating the carbon sink capacity of Spanish softwood species. For. Syst. 2011, 20, 176–188. [Google Scholar] [CrossRef] [Green Version]
  29. Penman, J.; Gytarsky, M.; Hiraishi, T.; Krug, T.; Kruger, D.; Pipatti, R.; Buendia, L.; Miwa, K.; Ngara, T.; Tanabe, K.; et al. Good Practice Guidance for Land Use, Land- Use Change and Forestry; Intergovernmental Panel on Climate Change: IPCC National Greenhouse Gas Inventories Program, Institute for Global Environmental Strategies (IGES) for the IPCC: Kanagawa, Japan, 2003. [Google Scholar]
  30. Nelson, D.W.; Sommers, L.E. Total carbon, organic carbon, and organic matter. In Methods of Soil Analysis: Part 3 Chemical Methods; SSSA: Madison, WI, USA, 1996; Volume 5, pp. 961–1010. [Google Scholar] [CrossRef]
  31. Post, W.M.; Kwon, K.C. Soil carbon sequestration and land-use change: Processes and potential. Glob. Chang. Biol. 2000, 6, 317–327. [Google Scholar] [CrossRef] [Green Version]
  32. Mann, L.K. Changes in soil carbon storage after cultivation. Soil Sci. 1986, 142, 279–288. [Google Scholar] [CrossRef]
  33. Farina, R.; Marchetti, A.; Francaviglia, R.; Napoli, R.; Di Bene, C. Modeling regional soil C stocks and CO2 emissions under Mediterranean cropping systems and soil types. Agric. Ecosyst. Environ. 2017, 238, 128–141. [Google Scholar] [CrossRef]
  34. Fritts, H.C. Tree-Rings and Climate; Academic Press: London, UK, 1976. [Google Scholar]
  35. Yamaguchi, D.K. A simple method for cross-dating increment cores from living trees. Can. J. For. Res. 1991, 21, 414–416. [Google Scholar] [CrossRef]
  36. Holmes, R.L. Computer-assisted quality control in tree-ring dating and measurement. Tree Ring Bull. 1983, 43, 69–78. [Google Scholar]
  37. R Core Team. R: A Language and Environment for Statistical Computing; R Foundation for Statistical Computing: Vienna, Austria, 2018; Available online: https://www.r-project.org (accessed on 12 May 2021).
  38. Ruiz-Peinado, R.; Bravo-Oviedo, A.; Montero, G.; Del Río, M. Carbon stocks in a Scots pine afforestation under different thinning intensities management. Mitig. Adapt. Strateg. Glob. Chang. 2016, 21, 1059–1072. [Google Scholar] [CrossRef]
  39. Bravo-Oviedo, A.; Ruiz-Peinado, R.; Modrego, P.; Alonso, R.; Montero, G. Forest thinning impact on carbon stock and soil condition in Southern European populations of P. sylvestris L. For. Ecol. Manag. 2015, 357, 259–267. [Google Scholar] [CrossRef]
  40. Navarro-Cerrillo, R.M.; Duque-Lazo, J.; Rodríguez-Vallejo, C.; Varo-Martínez, M.; Palacios-Rodríguez, G. Airborne laser scanning cartography of on-site carbon stocks as a basis for the silviculture of Pinus halepensis plantations. Remote Sens. 2018, 10, 1660. [Google Scholar] [CrossRef] [Green Version]
  41. Navarro-Cerrillo, R.M.; Sánchez-Salguero, R.; Rodriguez, C.; Lazo, J.D.; Moreno-Rojas, J.M.; Palacios-Rodriguez, G.; Camarero, J.J. Is thinning an alternative when trees could die in response to drought? The case of planted Pinus nigra and P. sylvestris stands in southern Spain. For. Ecol. Manag. 2019, 433, 313–324. [Google Scholar] [CrossRef]
  42. Romanyà, J.; Rovira, P.; Duguy, B.; Vallejo, R.; Rubio Sánchez, A. C sequestration issues in the Mediterranean soils. Greenh. Gas Budg. Soils Chang. Clim. Land Use (BurnOut) Cost 2010, 639, 15–22. [Google Scholar]
  43. Conkling, B.L.; Hoover, C.M.; Smith, W.D.; Palmer, C.J. Using forest health monitoring data to integrate above and below ground carbon information. Environ. Pollut. 2002, 116, S221–S232. [Google Scholar] [CrossRef]
  44. Johnson, D.W.; Curtis, P.S. Effects of forest management on soil C and N storage: Meta analysis. For. Ecol. Manag. 2001, 140, 227–238. [Google Scholar] [CrossRef]
  45. Jones, H.S.; Garrett, L.G.; Beets, P.N.; Kimberley, M.O.; Oliver, G.R. Impacts of harvest residue management on soil carbon stocks in a plantation forest. Soil Sci. Soc. Am. J. 2008, 72, 1621–1627. [Google Scholar] [CrossRef]
  46. Del Río, M.; Calama, R.; Cañellas, I.; Roig, S.; Montero, G. Thinning intensity and growth response in SW-European Scots pine stands. Ann. For. Sci. 2008, 65, 308. [Google Scholar] [CrossRef] [Green Version]
Figure 1. Distribution of Pinus pinaster, Pinus nigra and Pinus sylvestris in the Mediterranean Basin and study area at Sierra de Los Filabres (Almeria, Spain).
Forests 12 01583 g001
Figure 2. Mean curves of basal area increment (BAI) chronologies for Pinus pinaster, Pinus nigra and Pinus sylvestris. The vertical, dashed line corresponds to the 2008 thinning year. Treatments: C—control (0% BA removed); MT—moderate thinning (30% BA removed); HT—heavy thinning (60% BA removed).
Forests 12 01583 g002
Table 1. Characterisation of the Pinus spp. of dasometric variables per treatment plot at Sª de Los Filabres (Almería, Spain). Treat: thinning intensities of stem density removed—T0 (0%), T30 (30%) and T60 (60%); Age: years of the plantation; N: stand density (stems ha−1); HO: dominant height (m); DBHm: mean diameter at breast height (cm); G: basal area (m2 ha−1). Values are the means ± standard error (in brackets).
SpeciesTreatAgeNHODBHmG
Pinus pinasterT04216008.0 (0.11)19.6 (0.01)48.3 (5.02)
T304211207.8 (0.07)23.3 (0.01)47.8 (4.58)
T60426407.9 (0.08)27.4 (0.01)37.7 (4.06)
Pinus nigraT0407549.9 (0.7)11.8 (0.9)8.2 (1.2)
T30405289.3 (0.8)12.8 (0.6)6.8 (0.6)
T60403029.7 (1.1)13.3 (0.6)4.2 (0.5)
Pinus sylvestrisT0437239.6 (0.4)14.7 (0.6)12.3 (1.0)
T30435069.5 (0.4)15.1 (0.9)9.1 (1.3)
T60432899.6 (0.4)15.3 (0.8)5.3 (0.7)
Table 2. Combination of the structural characteristics and biomass C stock of Pinus spp. according to thinning intensities of basal area percentage removed (control or unthinned plots 0%; moderate thinning 30%; heavy thinning 60%) and quantification of soil organic carbon by depth horizon per soil sampling plot at Sª de Los Filabres (Almeria, Spain). Values are the means ± standard error (in brackets), and superscripts (a, b) indicate when pairwise comparisons were significantly different.
Species ControlModerate ThinningHeavy Thinning
Biomass FractionC in Biomass (Mg C ha−1)
Pinus pinasterStems15.3 (0.4)21.0 (0.3)29.0 (0.3)
Thick–medium branches2.2 (0.0)3.8 (0.0)6.2 (0.1)
Small branches and foliage6.4 (0.1)9.6 (0.0)14.0 (0.1)
Roots9.3 (0.1)15.2 (0.0)23.9 (0.2)
Total33.2 (0.6) a49.6 (0.3) a73.1 (0.7) a
Depth (cm)SOC (Mg C ha−1)
0–106.1 (0.1)8.6 (1.2)3.7 (0.6)
10–205.5 (0.1)8.1 (1.4)4.6 (0.8)
20–304.0 (0.1)8.9 (1.9)4.0 (0.7)
30–402.9 (0.1)3.4 (0.5)3.8 (0.9)
Total18.5 (1.8) a28.1 (3.7) b15.5 (2.2) a
Biomass FractionC in biomass (Mg C ha−1)
Pinus nigraStems16.4 (0.2)18.0 (0.2)20.1 (0.2)
Thick–medium branches3.6 (0.0)4.3 (0.1)4.6 (0.1)
Small branches and foliage5.0 (0,0)5.9 (0.0)6.4 (0.0)
Roots3.9 (0.1)4.8 (0.1)5.3 (0.0)
Total29.0 (0.3) a33.0 (0.4) a36.4 (0.3) a
Depth (cm)SOC (Mg C ha−1)
0–106.4 (0.7)5.4 (0.5)5.9 (0.7)
10–205.8 (0.6)6.4 (0.6)6.1 (0.6)
20–308.5 (1.0)7.2 (1.0)6.0 (0.7)
30–407.3 (0.8)5.1 (0.6)5.2 (0.6)
30–406.60 (1.24)4.884.22 (0.71)
Total27.6 (2.3) a23.4 (2.2) a22.6 (1.5) a
Biomass FractionC in Biomass (Mg C ha−1)
Pinus sylvestrisStems16.0 (0.2)16.7 (0.1)17.3 (0.1)
Thick–medium branches3.1 (0.1)3.3 (0.0)3.4 (0.0)
Small branches and foliage5.4 (0.1)8.2 (0.0)15.6 (0.0)
Roots14.0 (0.0)14.8 (0.1)15.2 (0.0)
Total38.5 (0.4) a43.0 (0.2) a51.5 (0.1) a
Depth (cm)SOC (Mg C ha−1)
0–1012.2 (1.2)10.4 (0.9)9.0 (0.8)
10–2010.0 (1.0)9.5 (0.8)9.8 (1.0)
20–3010.1 (0.8)6.8 (0.5)8.4 (0.8)
30–406.9 (1.0)5.4 (0.9)7.3 (0.9)
Total37.0 (2.9) a31.6 (2.4) a34.0 (2.3) a
Table 3. Dendrochronological statistics of sampled Pinus pinaster, Pinus nigra and Pinus sylvestris for the three treatments (C, control or unthinned plots; MT, moderate thinning; HT, heavy thinning). TRW: mean tree-ring width; BAI20: mean basal area increment over the last 20 years; BAIpreT: mean basal area increment before thinning year; BAIpostT: mean basal area increment after thinning year (all in mm); MS: mean sensitivity; Rbar, mean among trees correlation; EPS, expressed population signal. Values are the means ± standard errors (in brackets), and superscripts (a, b) indicate when pairwise comparisons were significantly different. The hyphen symbol indicates no thinning treatment in the control plots.
SpecieTreatTime SpanTRWBAI20BAIpreTBAIpostTMSRbarEPS
Pinus pinasterC1975–20165.46 (0.39)4.27 (0.37) a--0.3530.7780.988
MT1975–20166.39 (0.45)5.33 (0.51) a4.10 (0.22) a5.77 (0.88) a0.3280.7720.987
HT1975–20165.48 (0.47)5.23 (0.49) b4.19 (0.28) a4.43 (0.49) b0.3470.4240.804
Pinus nigraC1977–20162.57 (0.18)2.49 (0.23) a--0.3810.5000.899
MT1977–20162.30 (0.19)2.79 (0.30) a1.66 (0.22) b4.03 (0.6) b0.3200.6150.938
HT1977–20162.59 (0.27)2.99 (0.39) a1.69 (0.17) a3.52 (0.69) a0.3770.6030.935
Pinus sylvestrisC1973–20164.74 (0.38)3.57 (0.42) b--0.3330.6930.952
MT1973–20163.51 (0.26)2.93 (0.26) a2.13 (0.18) a3.01 (0.44) a0.3360.6140.937
HT1973–20164.99 (0.39)5.50 (0.57) a3.62 (0.43) a5.87 (0.95) a0.3980.4220.874
Publisher’s Note: MDPI stays neutral with regard to jurisdictional claims in published maps and institutional affiliations.

