Article

Influence of Edaphic Salinity on Leaf Morphoanatomical Functional Traits on Juvenile and Adult Trees of Red Mangrove (Rhizophora mangle): Implications with Relation to Climate Change

by
Alejandra Robles Sánchez
1,2,*,
José Ernesto Mancera Pineda
1,
Xavier Marquínez Casas
1 and
Jairo Humberto Medina Calderón
3
1
Departamento de Biología, Facultad de Ciencias, Universidad Nacional de Colombia Sede Bogotá, Carrera 45#26-85, Bogotá 111321, Colombia
2
Corporation Center of Excellence in Marine Sciences—CEMarin, Carrera 21#35-53, Bogotá 111311, Colombia
3
Unidad de Docencia y Formación, Universidad Nacional de Colombia Sede Caribe, San Andrés Isla, Carretera Circunvalar San Luis Free Town 52-44, San Andrés 880008, Colombia
*
Author to whom correspondence should be addressed.
Submission received: 28 September 2021 / Revised: 31 October 2021 / Accepted: 13 November 2021 / Published: 18 November 2021
(This article belongs to the Special Issue Advances in Mangrove Ecology)

Abstract

:
Rhizophora mangle L. is one of the most distributed species of neotropical mangroves. The species exhibits great phenological variability that is associated with saline concentrations of the sediment where it grows. Among the organs that are most affected by interstitial and tidal water salinity concentrations are the leaves. Since the hypersalinity generates water deficiency, it changes photosynthetic and hydraulic processes of the plant. To understand the relationship between the variation in leaf blade parameters and the water stress generated by salinity in two growth stages, morphoanatomical functional traits were quantified in leaves of juveniles and adults of R. mangle in three structurally different mangrove forests with different ranges of natural salinity (Oligohaline: 5.8–11.7 practical salinity units (PSU); Euhaline: 9.2–35.6 PSU and 23.9–47.7 PSU). We hypothesized that water stress caused by salinity generates modification in conductivity, water-storage, and photosynthetic tissues. Our results showed a greater number of morphoanatomical traits affected by salinity in juveniles compared to adults, greater variability in the traits associated with water accumulation and transport. Adults and juveniles subjected to higher values of salinity had traits more tolerant of variability in this factor, allowing superior adaptation to environments with high water deficit than individuals originating in oligohaline environments. This difference in adaptability to salinity between populations of R. mangle may imply different responses to climate change, where populations of oligohaline origin will be more susceptible to hypersalinization resulting from this phenomenon, while populations of euhaline origin could more effectively tolerate the aquatic stresses caused, allowing a prolongation of their permanence and the provision of their ecosystem services over time.

1. Introduction

Rhizophora mangle L. is a viviparous, facultative halophytic mangrove species that grows in brackish and fresh waters of the tropical and subtropical coasts of the Western Hemisphere [1,2,3]. It is widely distributed from the Caribbean of the Florida Peninsula to Brazil and on the Pacific Coast from Mexico to Chile [2,4]. It is a successional pioneer species [5] that has an optimal growth range at salinities between 8 and 60 practical units of salinity–PSU (practical salinity units) [6] and develops an ultrafiltration mechanism at the level of root cells to prevent the entry of excess solutes [7]. It can develop tree or shrub morphology [8] reaching up to 30 m tall and 100 cm DBH [9,10]. Salinity stress in R. mangle generates changes at the physiological and anatomical level. These changes are related to coping with high saline concentrations by expanding hypodermal hyaline cells, allowing an increase in the storage capacity of Cl− and Na+ ions in their vacuoles [11]. Increased leaf thickness [12], reduced stomatal conductance [13], the suberization of cell walls in roots for blocking apoplastic transport [14,15] and hydraulic redistribution that dilutes the salts accumulated in the rhizosphere, promoting their diffusion from the root surface to the soil [3]. Finally, a water efficiency mechanism face to water deficit which limits the transport of photosynthetic electrons, affecting carbon reduction processes [16] and increase in relative water content in the leaves of individuals subjected to low salinities [13]. In tress of R. mangle wood has lower density and greater porosity in the rainy season (low salinity), and it is denser and less porous in the dry season (high salinity) [17].
These morphoanatomical and physiological variations show that there is extensive information on the effect of salinity on the growth and development of this species. However, there are no studies comparing the physiological and morphoanatomical responses to interstitial salinity of individuals of R. mangle at different growth stages.
Mangrove forests provide a wide range of goods and services for coastal communities (food, fisheries, coastal protection, sediment retention, water filtration, and carbon sequestration or export) [18,19,20,21,22]. But the forests are highly vulnerable to the effects of climate change [23,24]. Phenomena such as sea level rise, changes in ocean currents, increased number and energy of storms, increased temperature and alterations in precipitation strongly influence interstitial salinity, affecting the structure, composition and distribution of mangrove forests [24,25]. This may result in processes such as latitudinal and vertical migration of species and transformation of adjacent ecosystems [24,25,26].
In island mangrove forests the effects of climate change can be devastating since species migration may be slowed down by the presence of human communities and limited areas, leading to their disappearance and consequent loss of goods and services. There is a need to assess which populations of R. mangle might become more vulnerable or tolerant to the effects of climate change in island areas. For this purpose, a useful tool is the response of functional traits to the variation of interstitial salinity of different populations.
The objective of this work was to provide information on the effects of increased salinity on the functional traits of R. mangle in different growth stages and the potential ecological implications considering the effects of climate change. For this purpose, the morphoanatomic responses were determined in the foliar tissues of juvenile and adult individuals subjected to three natural ranges of edaphic salinity. R. mangrove was chosen as a model for the research, because among the species present in the Caribbean it is the most vulnerable to increased salinity, its maximum tolerance value is 60 PSU) [6].
As a working hypothesis we propose that due to the water stress generated by salinity, the conductive and water storage tissues (more developed hypodermis, thicker xylem vessels) and the photosynthetic tissues (palisade and more developed spongy parenchyma) will be modified and that this modification will depend directly on the increase in interstitial salinity. Likewise, the morphoanatomy of a greater number of tissues will be modified in juveniles compared to adults, since the former are in a stage of competition for resources and adaptation to various environmental conditions, while the latter, being reproductively active, they have adapted to the changes of each salinity gradient. This adaptation will allow populations of euhaline origin, an advantage against a possible increase in salinity caused by the phenomenon of climate change.

2. Materials and Methods
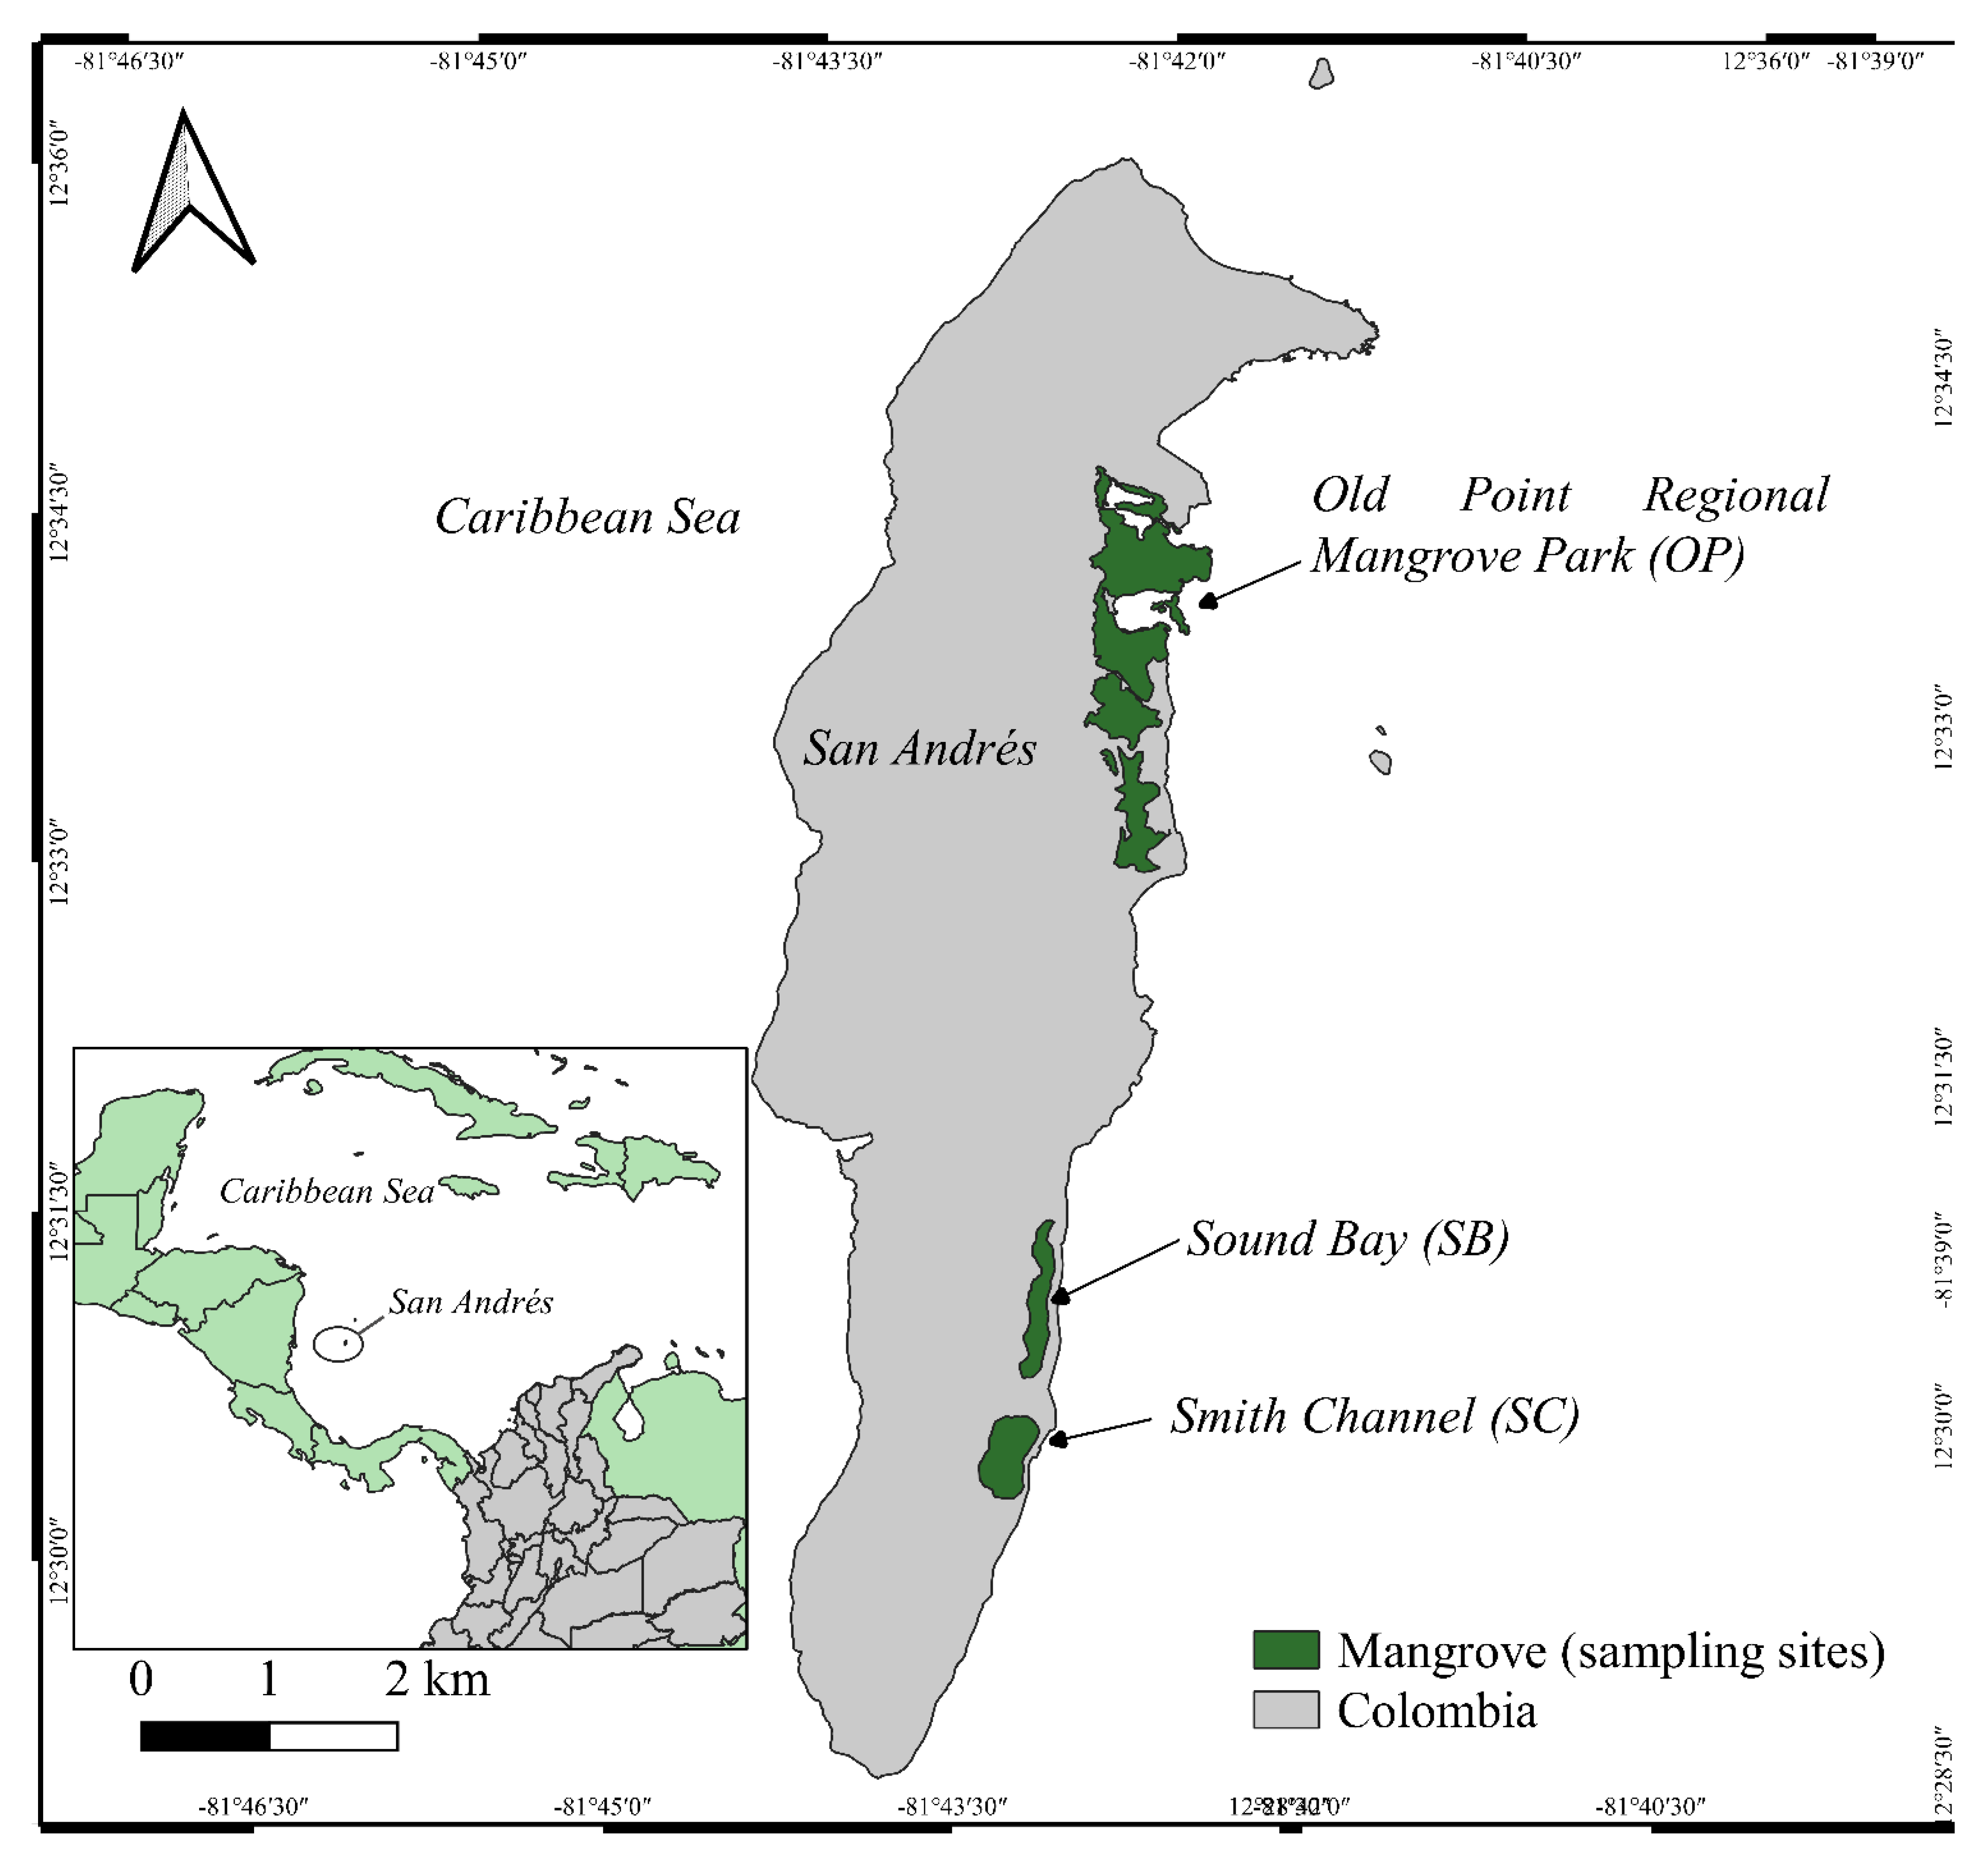
2.1. Study Area

The island of San Andrés is part of the archipelago of San Andrés, Providencia and Santa Catalina, which is of volcanic origin [27], and is located in the transition zone of tropical dry and tropical humid climates [28]. The island is elongated in a NS direction with a length of 12.5 km, a maximum width of 3 km, and an area of 27 km2, with some hills up to 86 m above sea level in the central part [28,29,30]. The climate is semi-humid due to the influence of trade winds that mitigate dry conditions. The average annual temperature is 27.4 °C with highs of 30 °C (May and June) and low temperatures of 25.5 °C (December and February). The mean annual rainfall is 1797.8 mm with an irregular distribution of 80% of the annual rainfall falling during the wet season (October to December) and the dry season occurs from January to April. Between the months of May and July the rainfall is moderate [29,31].
There are six mangrove forests on the San Andrés island, most of which are located on the eastern side of the island [30], of these, three with different salinity ranges and the highest coverage were selected: Old Point Regional Mangrove Park (0–18 PSU), Sound Bay Forest (10–40 PSU) and Smith Channel Forest (20−70 PSU) [17,32,33,34,35] (Figure 1).
Old Point is located in the northeast (12°34′00.5″ N; −81°42′19.3″ W), has an area of 65 ha [17] and trees 7.9 ± 0.2 m tall and 8.5 ± 0.3 cm DBH [17]. Two types of forest are in Old Point, a fringe forest where R. mangle dominates over Laguncularia racemosa and Avicennia germinans (relative densities 79%, 15% and 6%, respectively), and basin forest where A. germinans dominates over L. racemosa and R. mangle (relative densities 58%, 23% and 20%, respectively) [36]. The hydroperiod of Old Point is determined by rainfall and tides, the interstitial salinity ranges between 20–70 PSU [32,33,35]. This forest is euhaline according to the Venice classification [37].
Sound Bay is located to the southeast of the island (12°30′42.94″ N; −81°42′57.7″ W). Its area is 14.4 ha [30] with trees averaging 13.6 ± 7.59 m tall and 18.4 ± 11.25 cm DBH. Within this forest, R. mangle dominates over L. racemosa and A. germinans (relative densities of 49%, 28%, and 23% respectively) [34]. The forest is isolated from the sea and the effect of tides by sand barriers and by the main road of the island, classifying as an inland mangrove [38]. The hydroperiod depends on climate and groundwater. The interstitial salinity ranges between 10 PSU and 40 PSU [34]. Sound Bay is euhaline according to the Venice classification [37].
Smith Channel is located to the southeast of the island (12°30′11.3″ N, −81°43′06.8″ W), its area is 17 ha [17] with trees of heights averaging 21.9 ± 0.7 m and 31.5 ± 1.2 cm DBH. In this forest, R. mangle dominates over L. racemosa (relative densities 75% and 25% respectively) [17,32,33]. This forest, like Sound Bay, is considered an inland forest due to its isolation from the sea [38]. The hydroperiod depends on rainfall and groundwater [38], the interstitial salinity varies from 0 PSU to 18 PSU [17]. Smith Channel is euhaline according to the Venice classification [37].
In terms of soil composition, Smith Channel reports slightly higher nitrogen and phosphorus concentrations than those reported for Old Point (nitrogen: 2.16 ± 0.18 mg cm3 and 1.88 ± 0.12 mg cm3 respectively; phosphorus: 0.09 ± 0.014 mg cm3 and 0.08 ± 0.004 mg cm−3 respectively). This organic matter was slightly higher at Old Point versus Smith Channel (105.7± 5.0 mg cm3 and 97.5± 4.3 mg cm3 respectively) [17,35]. For the Sound Bay Forest, no compositional information is available.

2.2. Collection and Fixation of Plant Organs

In each of the mangrove forests, three individuals (juveniles and adults) of R. mangle were randomly selected. Defined as juveniles the vegetative individuals from 1.5 m to 2.0 m tall have never blossomed. Adult individuals at more than 2 m tall have reproductive capacity. Three leaves of different branches located at the apical part were taken from each individual. This sampling was carried out during four times of the year (May, August and November 2016 and March 2017), with 54 samples collected per season (27 samples for juveniles and 27 samples for adults) and a total of 216 samples for the entire experiment (108 samples for juveniles and 108 samples for adults). The collected samples were fixed in FAA solution (10:5:85, Formol: acetic acid: ethanol 70%) for 48 h and changed to 70% ethanol for storage and subsequent morphological and anatomical measurements.

2.3. Physicochemical Variables of Interstitial Water

In interstitial water from each forest, salinity was measured with a Schott conductimeter (handylab LF-12), and pH was measured with a Schott pH meter (handylab pH11). The collection of interstitial water for physicochemical measurements was carried out at a depth of 30 cm using two methods: The first was carried out in Old Point and Sound Bay forests with a rod connected to a hose and a syringe to obtain the water sample by pressure [39]. The rod was buried 30 cm in the ground, and the sample was obtained by absorption from the syringe. The second method used in the Smith Channel Forest, where the substrate is very compact, opening a hole 30 cm deep with the help of a shovel, where water infiltration was used for the sample. Salinity values were reported in PSU. Three replicas of physicochemical measurements were taken for each forest. Measurements occurred simultaneously with the leaf collection in May, August and November 2016 and March 2017.

2.4. Preparation of Leaves for Measuring Foliar Area

Leaf area measurements were carried out in the Laboratorio de Biología y Ecología Marina, Department of Biology of Universidad Nacional de Colombia–Bogotá. Measurements were carried out from the analysis of images with the Image J software version ij152-win-java8 of photographs of each leaf together with a metric guide (precision in mm).

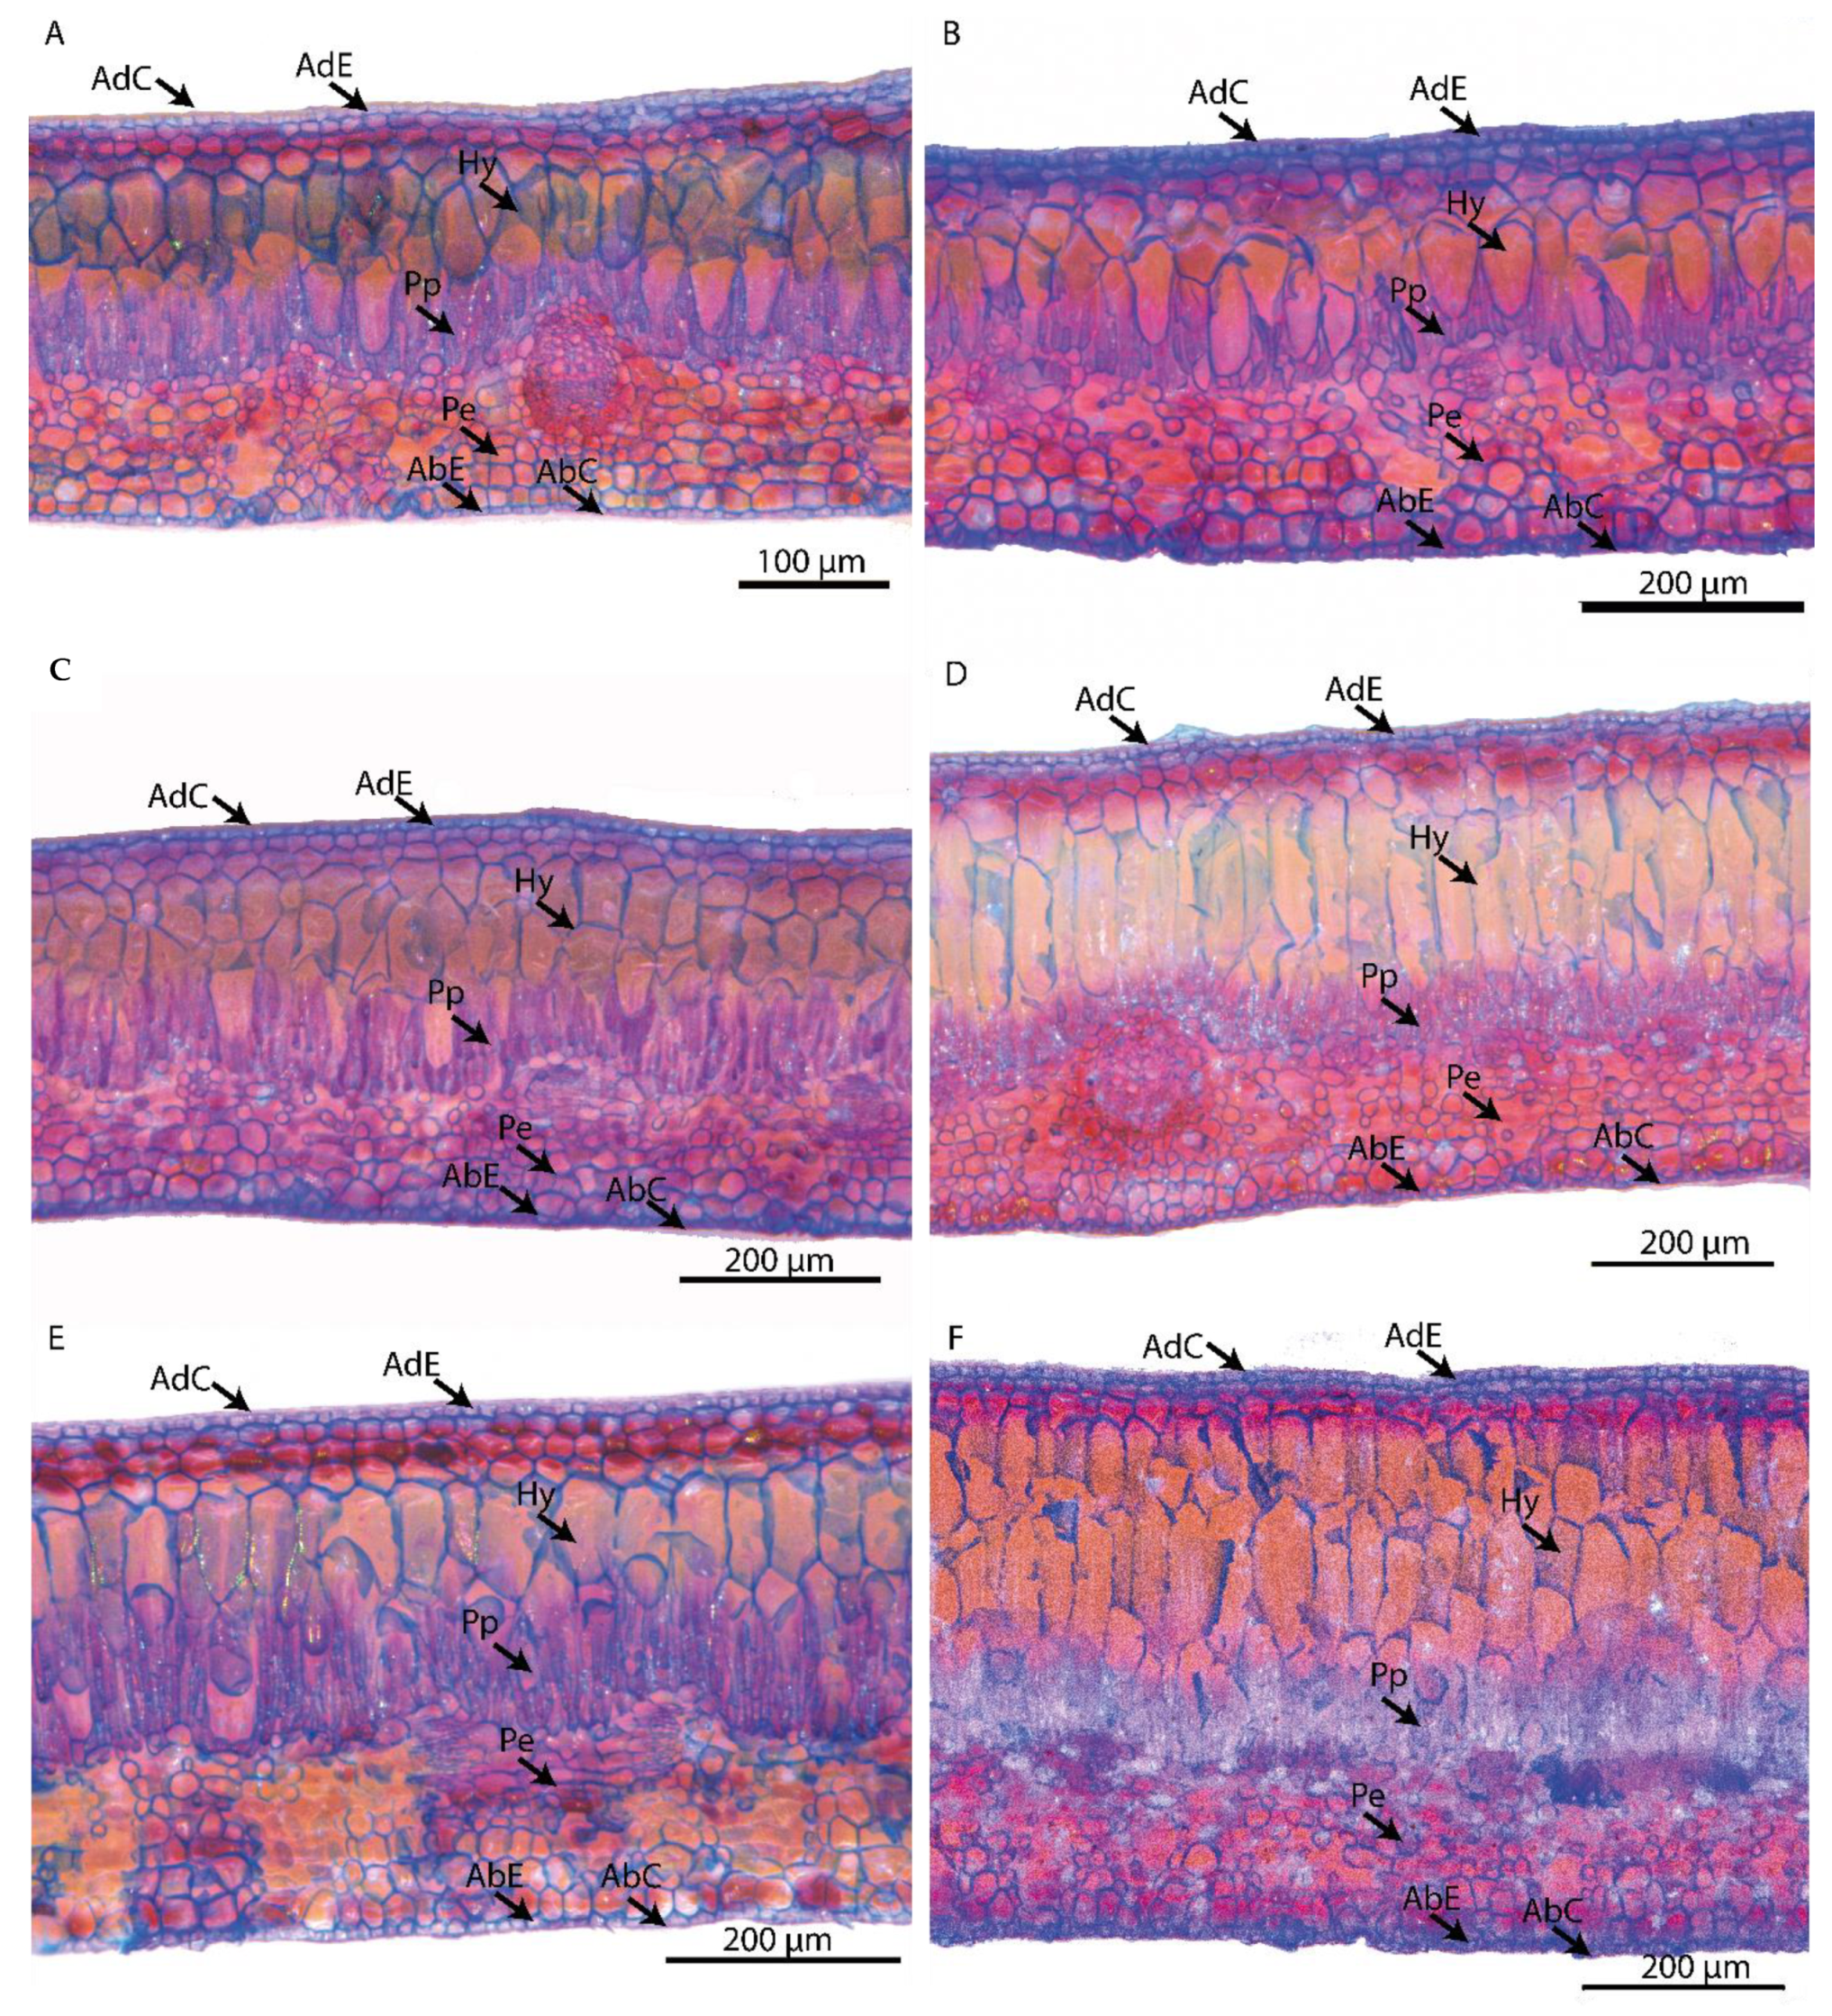
2.5. Preparation of Tissues for Fresh Histological Measurement

Foliar tissue measurements were carried out in the Laboratorio de Equipos Ópticos, Department of Biology of Universidad Nacional de Colombia–Bogotá. For each leaf, a cross-sectional tissue fragment of 0.5 cm × 0.3 cm was excised covering both the beam and the back of the leaf. In the case of the central vein, three fragments of 0.3 cm were excised. The tissues were rinsed with 5% hypochlorite for 15 min. The samples were washed and neutralized with acetic water (1 drop of glacial acetic acid per 100 mL of distilled water) for 10 min to stabilize the pH and finally washed with distilled water. After rinsing, the samples were stained with a double stain Astra blue–basic fuchsin as follows: each sample was immersed in 10 mL of distilled water, then three drops of basic fuchsin were added for 5 min generating a solution. The sample was then washed with distilled water and reimmersed in 10 mL of distilled water, to which three drops of Astra-blue was added for 15 min, and the fragments were finally washed with distilled water [34]. When the tissues were dyed, they were observed with a Leica M205 Stereoscope and photographed with a MC170HD camera, using the Leica application suite (LAS).

2.6. Measurement of Tissues

The area and thickness of the entire leaf were measured. The thickness of: cuticle and epidermis adaxial and abaxial, hypodermis, palisade parenchyma and spongy parenchyma were measured at the leaf’s anatomical level. The lumen diameter of the xylem vessels and the thickness of their lignified walls were measured in the central vein of the leaf. Measurements were determined with the Image J software version ij152-win-java8 and photo editing with Adobe Photoshop CC2017.

2.7. Statistical Analysis of Morphological and Anatomical Measurements

To determine whether there were significant differences between the salinity and pH ranges of the three forests evaluated, a Kruskal Wallis -KW test (0.05 significance) was performed and plotted in a boxplot.
The quantification of the morphoanatomic variables generated continuous data without normal distribution. These data did not fit either exponential or gamma distributions, so it was not possible to perform statistical analyzes such as Generalized lineal Models (GLM). Therefore, the comparison of R. mangle functional traits between forests and growth stages was based on the non-parametric Kruskal Wallis (KW) test. In each group, a Spearman correlation coefficient test was carried out to determine the relationship between the functional traits and the ranges of interstitial salinity of each forest. To determine the significant differences between the functional traits of the evaluated groups (among adults, among juveniles and between ages), a Kruskal Wallis test -KW (0.05 significance) was performed for each trait against the salinity ranges. The results were plotted on box diagrams. Statistical analyses and graphs were performed with the R software (version 4.0.2). The conventions for each age and forest are SC + JV: Smith Channel juveniles, SC + AD: Smith Channel adults, SB + JV: Sound Bay juveniles, SB + AD: Sound Bay adults, OP + JV: Old Point juveniles, OP + AD: Old Point adults.

3. Results

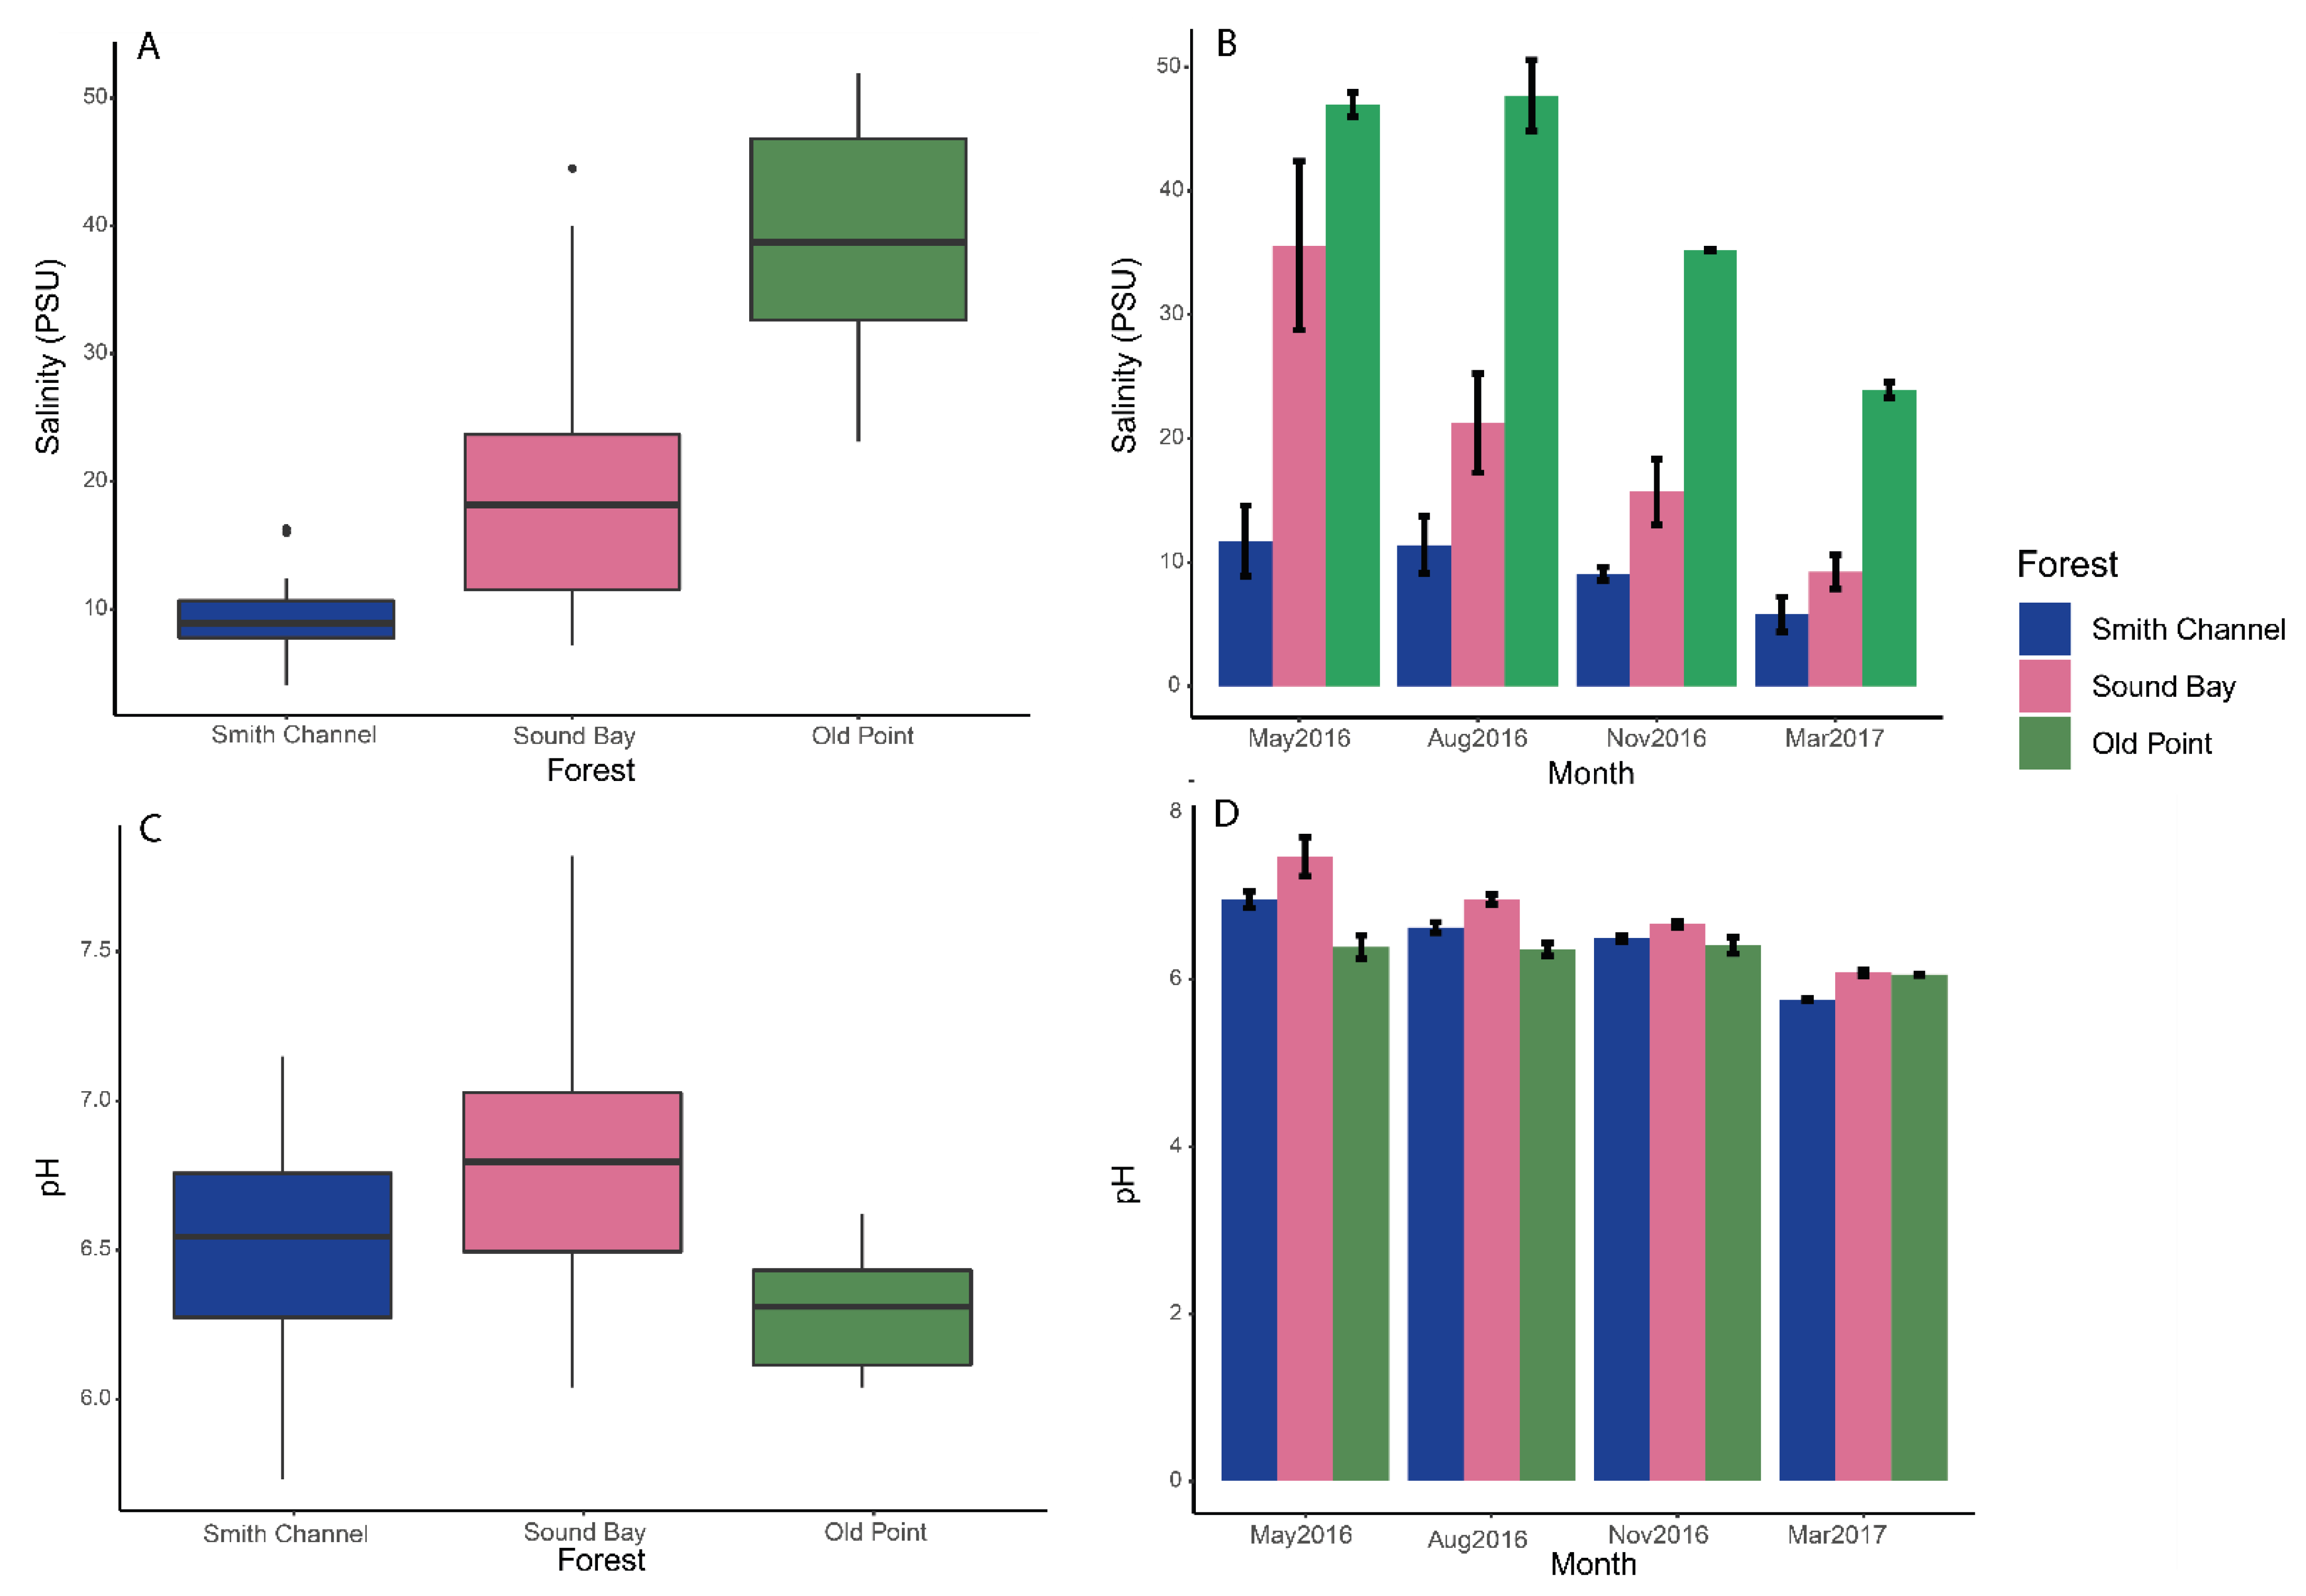
3.1. Physicochemical Variables

3.1.1. Salinity

The interstitial salinity ranges evaluated showed marked differences between the three sites according to the Kruskal Wallis-KW test (X2 = 23,162, p < 0.001, df = 2). The lowest mean salinity value was 9.5 ± 1.3 PSU at Smith Channel with a range of 4.1 PSU to 16.3 PSU, followed by Sound Bay Forest (20.4 PSU ± 5.6, range of 7.20 PSU to 44.50 PSU) and with the highest interstitial salinity at Old Point (38.46 PSU ± 5.6, range of 23.10 PSU to 52 PSU) (Figure 2A).
In the Smith Channel Forest, the salinity ranged from 5.8 PSU to 11.7 PSU, showing a difference between the maximum and minimum salinity of 5.9 PSU. In Sound Bay Forest, the salinity ranged from 9.2 PSU to 35.5 PSU with a difference between maximum and minimum salinity of 26.3 PSU, four times greater than at Smith Channel. At Old Point forest the salinity ranged from 23.9 PSU to 47.7 PSU with a difference between maximum and minimum salinity of 23.7 PSU, four times greater than at Smith Channel. In the three sampling sites, interstitial salinity was decreasing with a slight variation at Old Point during the May and August when salinity was higher in the second measurement compared to the first (Figure 2B).

3.1.2. pH

The pH was significantly different among the three sites according to the KW test (X2 = 6.7635, p = 0.034, df = 2). In Smith Channel Forest, the mean pH value was 6.45 ± 0.2 and the range of variation increased from 5.7 to 7.1. In the Sound Bay Forest, the mean pH value was 6.7 ± 0.2 and the range of variation was 6.0 to 7.8. In the Old Point Forest, the mean pH value was 6.3 ± 0.08 and the range of variation was 6.0 to 6.6 (Figure 2C). At the internal level of each forest, the Smith Channel pH ranged from 5.7 to 6.9 showing a difference between the maximum and minimum pH of 1.2. In Sound Bay the pH range was between 6.0 and 7.4, showing a variation between the maximum and minimum values of 1.3. At Old Point, the pH range was between 6.0 and 6.4, with a difference between the maximum and minimum value of 0.3, the lowest among the three forests. The Figure 2D evidence that the greatest difference in pH between the three forests was present in the first sampling (May 2016) when salinity showed the highest values at the three sites. For all three sites and at different sampling times, pH values tended to be neutral.

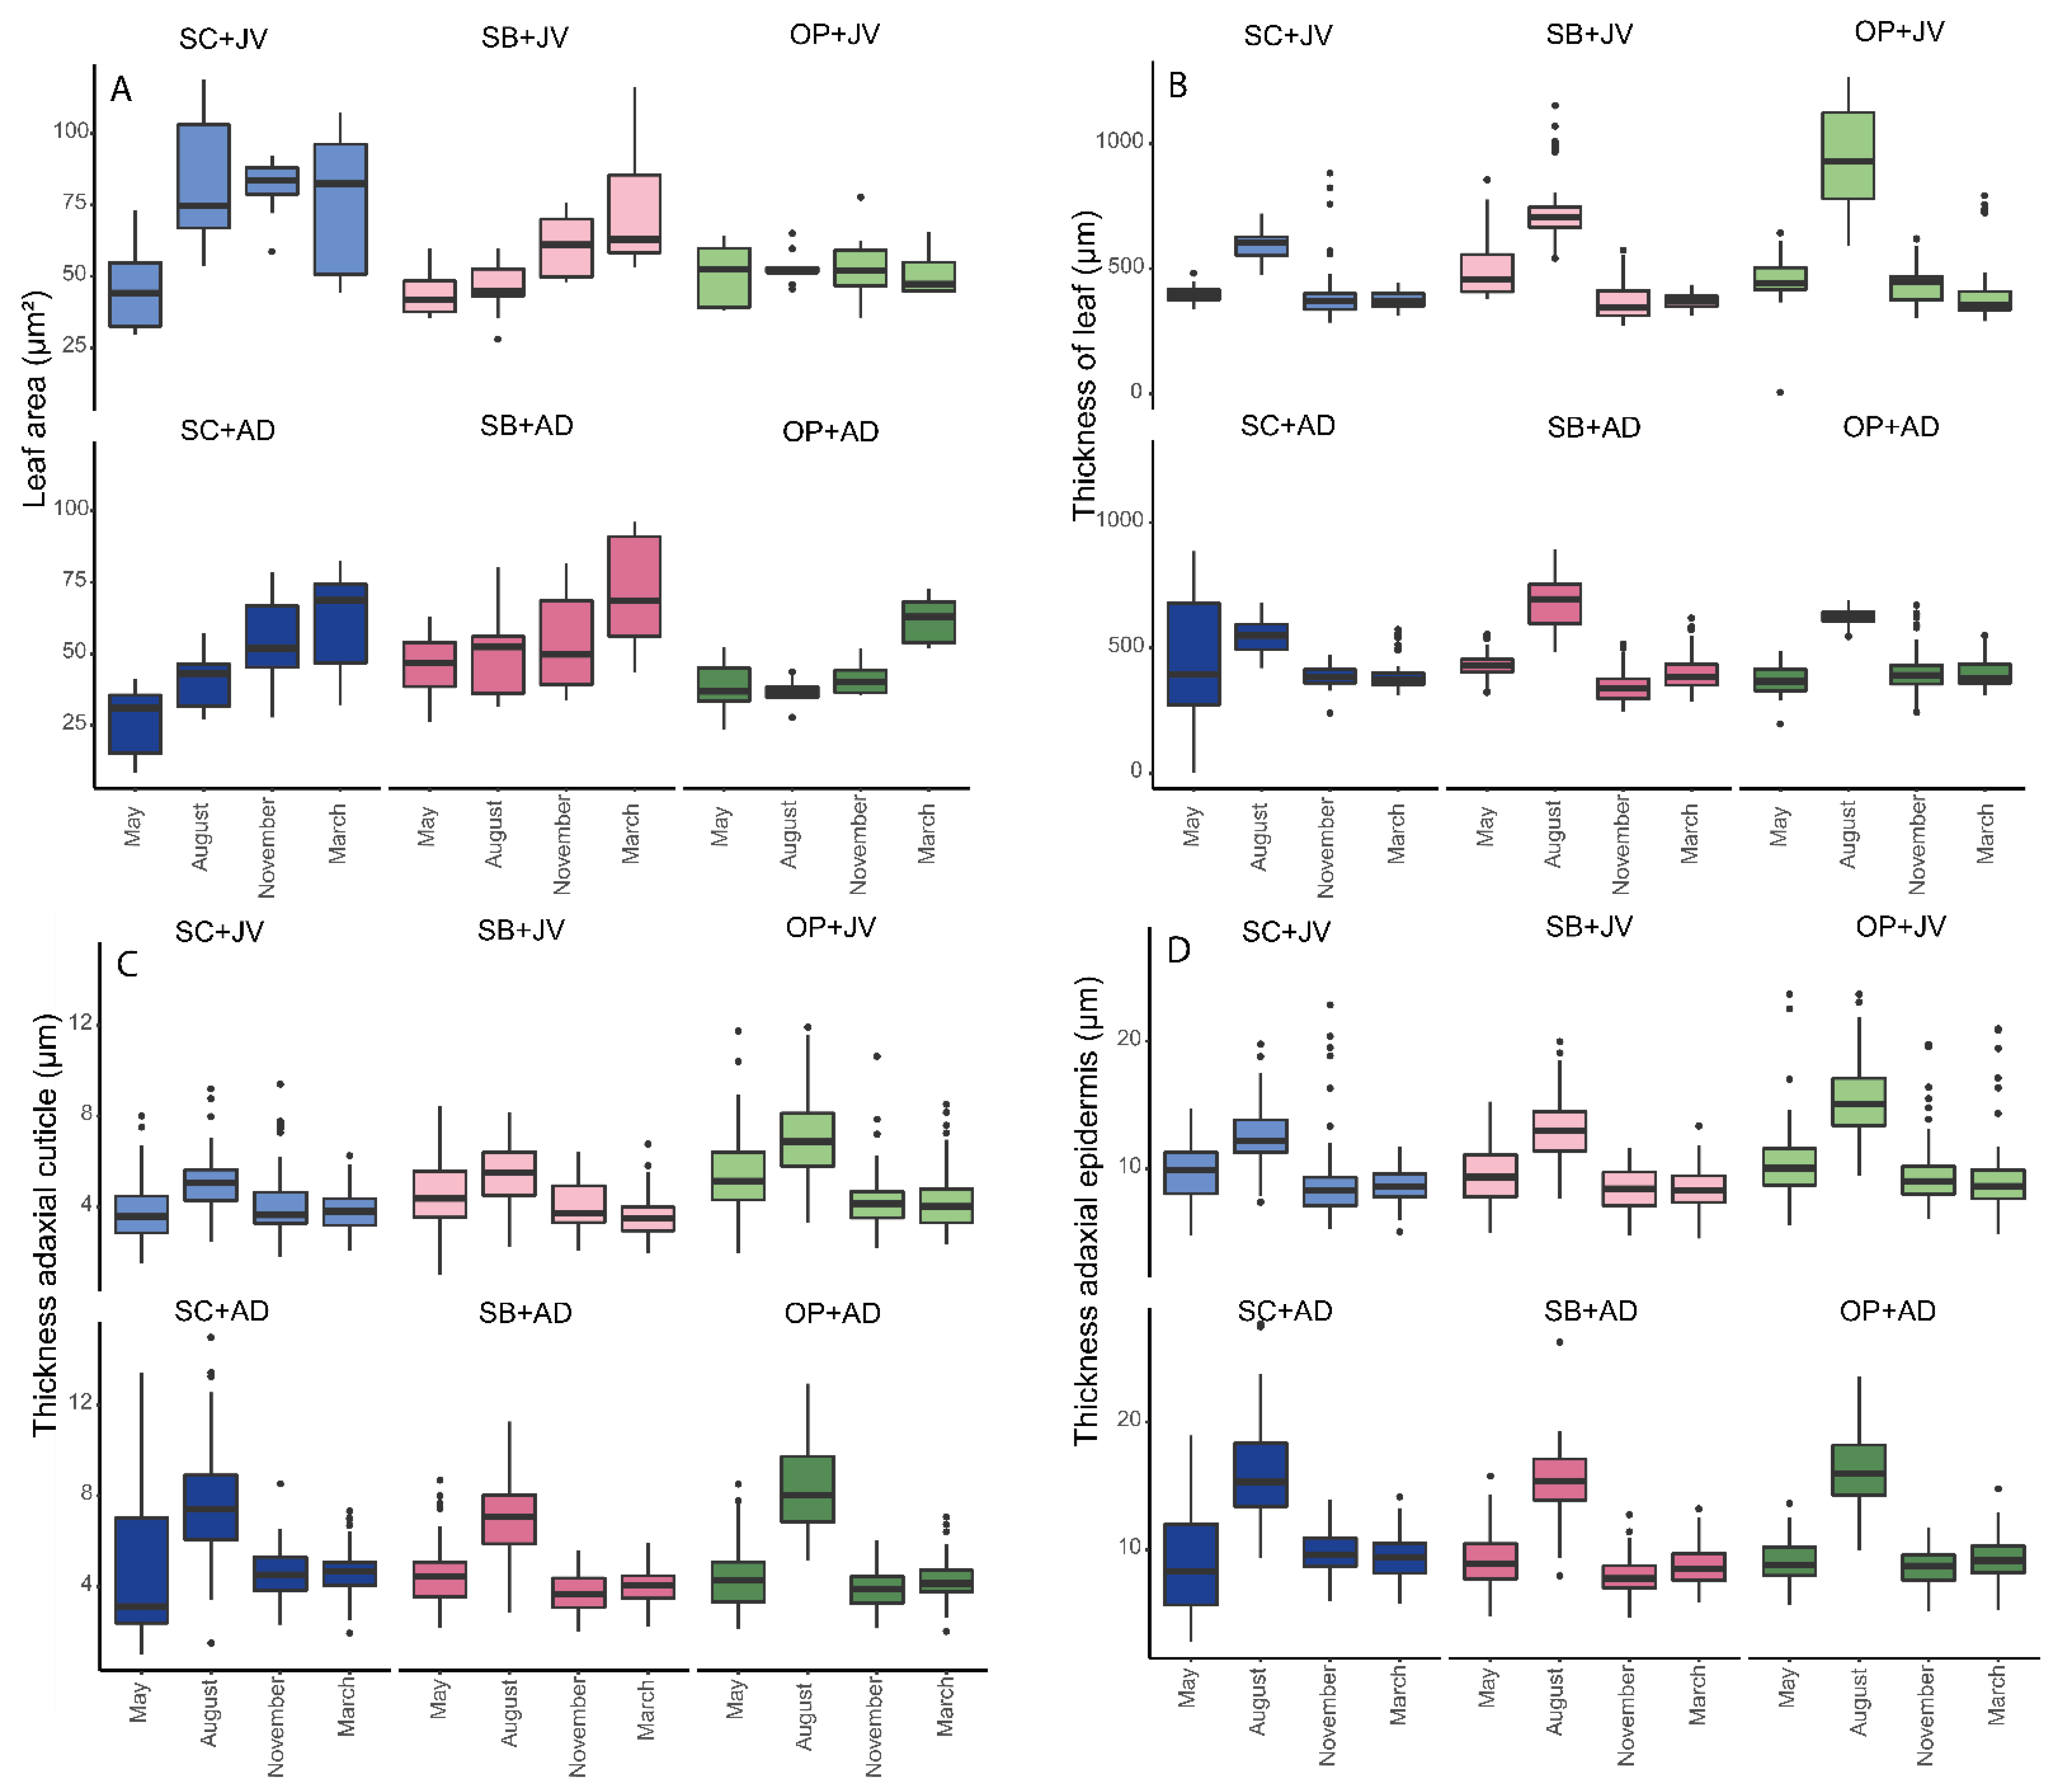
3.2. Morphoanatomical Measurements on Leaf of R. mangle

3.2.1. Comparison of Tissues between Groups

The KW tests showed significant differences in all morphoanatomical traits evaluated among the ages and among the three forests. At the intra-age, the juveniles showed significant differences in all the traits evaluated, while in adults, only significant differences were found in the traits leaf area, cuticle thickness, and adaxial epidermis, lumen diameter of the xylem vessels and wall thickness of the xylem vessels (Table 1) indicating that the change in the interstitial salinity gradient affects the foliar functional traits in form differential at both ages.

3.2.2. Spearman’s Correlation between Salinity and Morphoanatomical Traits by Age and Forest

At the level of juveniles, we observed that the most traits (except leaf area and abaxial cuticle) showed positive correlations of between 48% and 75% with an increase in salinity in the OP + JV group.
In the case of the SB + JV group, the morphoanatomical traits thickness of hypodermis, thickness of leaf and thickness of the wall of the xylem vessels showed positive correlations between 40% and 73% with the salinity range, while the traits’ leaf area and diameter of lumen of the xylem vessels showed negative correlations between 40% and 69% with the salinity range. In the SC + JV group, the trait diameter of the lumen of the xylem vessels and thickness of the wall of the xylem vessels showed a positive correlation of more than 40% with interstitial salinity, while the leaf area showed a negative correlation of 47% with interstitial salinity.
In adults, in OP + AD group most traits showed positive correlations between 46% and 60% with an increase in salinity, while the trait leaf area showed a negative correlation (70%) with the salinity range.
In the SB + AD group, the morphoanatomical trait thickness of palisade parenchyma, thickness of the leaf, diameter of the lumen of the xylem vessels and thickness of the wall of the xylem vessels showed positive correlations between 40% and 53%, while the leaf area showed a negative correlation of 43% with the salinity range. In the SC + AD group, the diameter of the lumen of the xylem vessels had a positive correlation of 41% with interstitial salinity, while the leaf area had a negative correlation of 47% with salinity.
Results determined that a greater number of functional traits on the leaf lamina were affected when salinity values were high (Old Point Forest), while as salinity decreased (Sound Bay and Smith Channel forests), the number of functional traits affected by salinity decreased.

3.2.3. Measurement of Morphoanatomical Traits Evaluated (by Age and Time)

The leaf area showed a very marked tendency of increasing size with decreased salinity in both juveniles and adults (Figure 3A). In addition, both juveniles and adults of Old Point showed a much lower variability compared to the other groups. In the juvenile of Old Point (OP + JV) there was no tendency of leaf area changes compared to the saline gradient, In Smith Channel (oligohaline) forest the variability of leaf area was high, indicating that water stress due to salinity was low. In Sound Bay in (intermediate salinity–euhaline) both groups the greatest variation in the measurement was seen when the salinity showed low values (March) that indicates that the water stress for the leaf was reduced in the last measurement. In the other measurements, the variability was lower, indicating greater water stress.
For leaf thickness the relationship between the salinity range and thickening leaf was evident at the level of juveniles and adults from Old Point and Sound Bay, while in adults and juveniles from Smith Channel the correlation was positive and mild (Figure 3B).
At Old Point, juvenile adaxial cuticle thickness showed a positive correlation with increased salinity. The greatest thickness was observed in August (Figure 3C and Figure 4), when the salinity was greater (47.7 PSU). In Smith Canal juveniles and adults, where salinity was much lower, the variation of the adaxial cuticle layer was greater and the changes in the adaxial cuticle depending on salinity were slight. In the case of juveniles and adults from the Sound Bay forest, the change in layer thickness in relation to salinity was small (Figure 3C and Figure 4).
For the thickness of the adaxial epidermis, both juveniles and adults from Old Point had the strongest changes with respect to the range of salinity of the forest. In the Figure 3D and Figure 4 the average thickness of the adaxial epidermis was greater at the highest salinity. In the case of juveniles and adults from Smith Channel and Sound Bay, the correlation between tissue thickness and salinity range was positive and slight, so no trend was observed.
In the thickness of the hypodermis, the tissue tended to thicken when salinity was increased in the juveniles and adults of Old Point (OP + JV and OP + AD) and in the juveniles of Sound Bay (SB + JV A greater range of variation in the thickness of the trait was observed in the juveniles of Old Point, when the salinity values were higher (August = 47.70 PSU), indicating greater water accumulation due to water stress.
For the photosynthetic parenchyma, a positive relationship was found between the thickness of the palisade parenchyma and the increase in salinity in juveniles and adults from Old Point and in adults from Sound Bay. The greatest variation in the thickness of this tissue occurred at high salinities in juveniles and adults of Smith Channel (Figure 4 and Figure 5B).
For the spongy parenchyma, the strongest and most positive correlation between thickness and increased salinity was found in juveniles and adults of Old Point. The greatest variation in the thickness of this trait (Figure 4 and Figure 5C) was observed in adults of Smith Channel at high salinities (May = 11.73 PSU).
The thickness of the abaxial epidermis relative to the salinity range was evident in juveniles and adults from Old Point, while in the case of juveniles and adults from Smith Channel and Sound Bay, this relationship was slight.
In the xylem vessels, for the diameter of the lumen, a positive correlation of increased the trait with increased salinity in the juveniles of Smith Channel and Old Point and in the adults of the three forests (Figure 6A and Figure 7).
The thickness of the wall of the xylem vessels, in all groups changed when the salinity range was positive (Figure 6B and Figure 7) and was weaker in Smith Channel adults (SC + AD). The variation in thickness was greater in the juveniles of Old Point when salinity reported the highest values (August = 47.70 PSU) and in the adults of Sound Bay when salinity was at intermediate values (August = 21.23 PSU).

4. Discussion

4.1. Functional Traits and Response to the Salinity Ranges

Salinity results show a gradient in the eastern part of San Andrés island, beginning low towards the southern part of the island (Smith Channel forest) with intermediate salinities in the middle part of the island (Sound Bay forest) and ending in high salinities towards the northern part (Old Point forest). The marked and differential ranges in each forest indicated that the conditions of salinity stress were contrasting. This explained the higher growth of individuals in the oligohaline forest, where salinity stress was low, while in the higher salinity forest, water stress was so high that the trees were low in height [17,32,33,34]. In addition, the interstitial salinity reports obtained in this study for Old Point and Smith Channel coincided with values reported in previous years by different authors in the same study areas [17,32,33,35], indicating that salinity ranges have been maintained over time. The variation of interstitial salinity agreed with the irregular distribution of rainfall during the year, causing changes in the hydroperiod that are reflected in the salinity gradients presented for each forest.
Although, according to the KW test the pH values showed significant differences among the three forests, the pH remained at neutral or slightly acidic levels (Figure 2C,D). This observation was important because the availability of primary nutrients (e.g., phosphorus and nitrogen) and secondary nutrients (e.g., calcium and magnesium) was affected by pH values. In organic soils, there is a greater availability of nutrients when pH is 5.5 and in mineral soils when pH is 6.5 [40,41], which allows the inference that the pH reported during the time of this experiment did not represent a stress factor that could limit the development of functional traits of the leaf. On the other hand, plants of the genus Rhizophora can grow at neutral pH [41], confirming that the pH results obtained in this study did not generate a condition of limiting nutrient uptake in the species.
A greater number of differences in morphoanatomical traits (area, thickness of leaf, adaxial and abaxial cuticle, adaxial and abaxial epidermis, hypodermis, palisade and spongy parenchyma, lumen of the xylem vessels and thickness wall of the xylem vessels) were determined among the juveniles of the three forests. Although in adults these differences were found in only five traits (leaf area, thickness cuticle and adaxial epidermis, diameter of the lumen of xylem vessels and thickness of the wall of xylem vessels), indicating that the change or adaptation of traits to the salinity conditions of the environment had different responses according to the stage of growth of the individual. In the juveniles, individuals were in a stage of adaptation to salinity gradients and their fluctuations; therefore, a greater plasticity of the morphoanatomical traits occurs in order to stabilize the tissues to the environmental conditions. In the case of adults, the difference in the number of traits was smaller, because they are individuals who have endured fluctuations in salinity for a much longer period of time that has allowed the development of less variable tissues and more tolerance to water stress.
The morphoanatomical traits evaluated in juveniles and adults of R. mangle showed a higher incidence of salinity in the groups developed in the euhaline environment (Old Point), since in both juveniles and adults, a greater number of traits was significantly related to the fluctuation of salinity compared to the groups evaluated in the other forests. In the case of the juveniles and adults of the Sound Bay and Smith Channel forests, the traits associated with water loss were most related to salinity stress.
Two of the traits strongly related to salinity in juveniles and adults of the three forests were reduced leaf area and increased leaf thickness (Table 2. Figure 3A,B). Variation in leaf area is considered an indicator of responses to environmental stress [42]. In the case of mangrove environments, the increase in interstitial salinity functions as a stressor, generating water deficit. As a tolerance mechanism, plants reducing the size of the leaves and increasing their thickness [43], generate more effective cooling by convection and a reduction in water loss [13]. This explains the tendency of both juveniles and adults to shrink leaf area and thickening leaf when salinity increased in the three forests evaluated. Although in the juveniles and adults of the Smith Channel, the relationship between leaf thickness leaf and salinity was weaker than in the other groups, the tendency for a positive correlation with low water stress was maintained.
A particular case was seen with the leaf area in juveniles of Old Point, since its relationship with the salinity gradient was very low (6%) compared to the other groups. Due to this we can infer that in the Old Point forest where the salinity values were the highest, water stress was higher for the juveniles, affecting the development of leaf morphology. During the juvenile growth stage, the individuals of R. mangle were in a process of adaptation to the fluctuating conditions of the environment, therefore, front an event of water stress, the energy investment was greater in the formation of succulent leaves in order to accumulate a greater quantity of water, allowing an explanation for the greater variation in the thickness of the leaf during the first measurements in the experiment. This probably allowed Old Point juveniles to maintain adequate photosynthetic rates without the need for area reduction during salinity increase.
The diameter of the lumen of xylem vessels is one of the most variable functional traits depending on interstitial salinity [44]. As an adaptative mechanism to water deficit caused by salinity, plants generate narrower vessels and in greater quantity that reduces the risk of cavitation [3,45,46,47,48,49]. In our research, the response was inverse (Table 2. Figure 6A and Figure 7) because the diameter of the lumen was greater at high salinities in most of the groups evaluated (except for Sound Bay juveniles), that would imply an adaptation that would affect the ability of the tissue to cope with environmental stress or a prejudicial trait in the species [50]. This is because the risk of embolism is high, causing the interruption of the flow of water and the death of individuals. To counteract this damage to the hydraulic system, the thickness of the wall of the xylem vessels within the groups evaluated plays a crucial role (Table 2. Figure 6B and Figure 7), because the thickening of the walls acts as a compensatory response to counteract the increase in lumen and thus prevent the formation of bubbles due to the water deficit. It also responds to high internal tensions, allowing the adaptation of individuals to the environment [51].
The hypodermis was a tissue that correlated positively and moderately with salinity in juveniles and adults from Old Point and in juveniles from Sound Bay, while in juveniles and adults from Smith Channel and adults from Sound Bay it did so only slightly (Table 2. Figure 4 and Figure 5A). The thickening of this tissue was a response to the water deficit generated by the stress of salinity, where the need to accumulate water caused the plant to increase the storage tissue through the formation of elongated hyaline cells, allowing a counteraction with the water deficit and withstanding the osmotic shock through the accumulation of solutes in the vacuoles of these cells. This generates a succulent leaf and protects the cytoplasm from toxic solute levels [11,13,52,53,54]. The slight response in some of the groups evaluated indicates that in the oligohaline environment (Smith Channel), the water stress is low and therefore the leaves do not need greater thickening (result in line with the thickness of the leaf blade). In the mid-salinity euhaline environment (Sound Bay), there was stress due to water deficiency, but this affected more the juveniles than the adults, since the former were adapting, while the latter were tolerant of the fluctuations of the interstitial salinity range of the forest.
Photosynthetic traits also showed a positive correlation with salinity that was much stronger in the juveniles and adults of Old Point, and in the juveniles of Sound Bay (palisade parenchyma). The thickening of the palisade parenchyma is a xerophytic character that seeks to maintain the photosynthetic rate [55], because the saline stress reduces the diffusion of CO2 towards the chloroplasts and the closure of the stomata to prevent the loss of water. This affects the functioning and shape of chloroplasts (changes in the thylakoidal membranes), reducing their efficiency [56,57]. It is therefore essential to thicken photosynthetic tissue to maintain greater efficiency in chloroplasts. On the other hand, the presence of a thicker spongy parenchyma allows the reduction of intercellular spaces in order to reduce the loss of water during the process of opening the stomata, generating a more efficient use of water resources [13,58].
Regarding the protective tissues in the leaf blade, adaxial cuticle and epidermis and abaxial epidermis, thickness had a positive correlation with the salinity ranges of both juveniles and adults (Table 2. Figure 3C,D, Figure 4 and Figure 5D), although this was much less common in groups from the oligohaline forest (Smith Channel) and the mid-saline forest (Sound Bay). The thickening of these traits is related to the protection of internal tissues to prevent water loss. The waxed cuticular layer acts as a protective barrier that reduces perspiration and therefore loss of non-stomatic water [11,59]. Therefore, thickening was present in all groups, acting as the external barrier to perspiration in a water-deficient environment. With respect to the epidermis (adaxial and abaxial) its thickening functions as a second barrier to reduce the loss of water by perspiration. A particular case was the abaxial cuticle, where the change was minimal in relation to salinity (Table 2, Figure 4). This may be due to two factors: first, the presence of a thickened abaxial epidermis restricts the loss of water, Therefore, the energy expenditure for the thickening of the cuticle is not necessary. Second, thickening could affect the stomach opening and the photosynthetic and respiratory process of the plant.
Several authors demonstrate the effect of salinity on the physiology, morphology, anatomy, growth and distribution of mangrove species [13,25,57,60,61,62,63,64]. These effects are strongly represented in the variation of functional traits, since these are morphological, anatomical, biochemical, physiological or phenological attributes specific to organisms that determine their biological effectiveness and therefore their success according to environmental conditions [65]. The present study shows that as the soil salinity increases, the functional traits of R. mangle vary widely in the two ages evaluated. Populations established in higher salinity environments (Old Point) tend to resist abrupt changes in salinity, while populations exposed to low salinity (Smith Channel) tend to be more vulnerable to saline variation, as their functional traits are poor. tolerant of such changes. In the case of populations subjected to intermediate values of salinity (Sound Bay), the population may adapt, since some of the morphoanatomical traits are highly tolerant of increased salinity, although their survival will be lower compared to individuals adapted to higher salinities that could lead to competition between the two populations, causing a total reduction of that originating in an intermediate salinity. A similar response of functional traits to the variation of salinity can occur in species that have as a mechanism of tolerance to salinity stress the exclusion and accumulation of solutes (genera Avicennia, Bruguiera, Osbornia, Rhizophora, Sonneratia) [13], allowing replication of this study in the different mangrove forests of the world.

4.2. Implications of the Responses of the Morphoanatomic Functional Traits of R. mangle to the Variation of Salinity in Possible Climate Change Events (Including the ENSO Phenomenon)

This difference in adaptability between populations of R. mangle will play a very important role for the species, its populations, and its distribution in the face of climate change processes. One of the climatic events that may have an impact on mangrove populations is ENSO. In the Colombian Caribbean, the El Niño phase generates reduced precipitation, increased temperature and increased evaporation and evapotranspiration; while La Niña phase generates increased precipitation and decreased temperature [66].
Based on the specific case of the San Andrés island forest during this research (May 2016 to March 2017), the USA National Office of Oceanic and Atmospheric Administration (NOAA) reported for May 2016 a weakening El Niño leading to an ENSO-neutral trend (ONI index = 0.4) [67] with reduced precipitation associated with high temperatures and considerable evapotranspiration and evaporation that could be related to high salinity values in the three study forests (Figure 2A,B). This explains the high variation and reduction in thickness of most of the traits evaluated. A feature that was strongly affected at this stage was the leaf area, since the reduction in precipitation and the increase of temperature, allow a greater accumulation of salts in the soil, increasing the water deficit, causing a reduction in the size of the leaf to avoid the loss of water and therefore its photosynthetic functions, leading to a reduction of growth [68].
For the second stage of collecting and reviewing traits (August 2016), the El Niño strengthening phase was reported, with an increase in ocean surface temperature and a decrease in precipitation (ONI index = −0.5) [67] that was reflected in the high salinity values that were maintained for the three forests, which were much higher at Old Point. Because the phenomenon El Niño causes drought, the surface layer of water deposited in the forest evaporates quickly, avoiding mixing with interstitial water, generating a greater accumulation of salt in the soil [69]. This explains the high variation in the traits evaluated during this phase of the study for the Old Point individuals. On the other hand, as Old Point is the only forest directly connected to the sea, the increase in the temperature of the water bodies causes greater evaporation, generating a higher concentration of salts on the forest floor, increasing the water deficit within the system. In the case of the Smith Channel and Sound Bay inland forests, their isolation from the sea prevents the entry of hot water bodies, preventing an excessive increase in interstitial salinity.
In the third stage of the traits review (November 2016) a decrease in temperature and an increase in precipitation and rainfall were reported, indicating a phenomenon La Niña (ONI index = −0.7) [67] that led to a reduction in salinity in the three forests and a smaller variation in most of the functional traits. During this phase, an increase in leaf area occurred for most study groups (except for the Old Point juveniles), indicating a reduction in water deficit in each forest. In the last stage of evaluation of the traits (March 2017), mean ocean temperatures were reported indicating an ENSO-neutral (ONI index = 0.1) [67]. For this reason, the salinity was slightly reduced at the study sites and the variation of the traits was lower, except for the leaf area that continued to increase due to the effect of the reduction of the stress salinity [67].
Based on the effects of ENSO on the three forests, it is confirmed that individuals of R. mangle present in the high salinity forest (Old Point) might be more adaptable to future climate change events. This was based on the response of the traits to abrupt changes in salinity during the time of the study. When these individuals are in a forest directly connected to the sea, the increase or decrease of the temperature of ocean water bodies, directly affects the concentration of salts in the soil, generating variations in the water deficit of the environment, acting as a constant stress factor. In the case of inland forests, R. mangle populations are adapted to salinity ranges that are only modulated by two factors: precipitation and groundwater. The functional traits of these populations only tolerate the changes in salinity caused by these factors, i.e., during a prolonged El Niño caused by climate change. Where there is a continuous drought, there may be a greater accumulation of solutes in the soil, and this generates a water deficit not tolerable by the individuals, increasing the risk of cavitation of the xylemic system and the loss of population, forests, and their ecosystem services.
Due to the wide range of goods and services provided by mangroves [22], it is important to assess the possible implications of climate change on these forests. Climate change not only alters temperature, but there are also a number of physical and chemical changes that impact these environments at the structural, functional, and service levels for both human communities and adjacent ecosystems [70]. An interesting case to evaluate is San Andrés island, since it has a small area (27 km2) and low elevation, where the forests studied can be heavily transformed by climate change.
Among the effects of climate change, an extreme increase in temperature is alarming, because it causes increased evaporation, reduced precipitation, and increased soil salinity levels (hypersalinization), leading to high water deficits as the availability of freshwater in the forests decreases [25], mainly affecting oligohaline environments (Smith Channel) or intermediate salinities (Sound Bay). The response of susceptible populations to this phenomenon will be migration towards latitudes where conditions of temperature and precipitation are favorable for their settlement [25,26]. Because the island has such a small area, migration will be limited first by the availability of area and second because the inland forests are surrounded by human settlements that act as a barrier to migration. Both constraints doom forests to extinction. In the case of the Old Point forest, individuals of R. mangle might be able to withstand the increase in salinity caused by extreme temperatures for a time. Then, if the salinity becomes greater than 50 PSU (salinity greater than the range of the forest), the individuals will look for a way to migrate either latitudinally or altitudinally, finding a limited area in the presence of human settlements, leading to their loss. An alternative to save the population of R. mangle at Old Point may be dispersal by means of propagules into the marine environment [71] to the nearest coastal areas, although their success in settlement will depend on the environmental conditions found there.
Sea level rise due to thermal expansion of water and melting of polar caps [26,72] is another phenomenon that involves ecological changes in mangrove ecosystems, as it alters flood levels and generates changes in nutrient availability [25,26]. Two scenarios can be listed, first where sea level rise leads to submerging the forest and the consequent loss of mangroves, and the second where populations migrate to higher altitudes to search of soils with increased freshwater and sediments for stabilization [25].
Because the island has a maximum elevation of 86 m [28,29,30], the areas near the three forests are affected by human communities, and, due to the absence of freshwater streams, altitudinal migration would not be possible. In addition, the only inputs that would allow vertical adjustment of forests are from the productivity of mangrove species, peat formation, and root accumulation, a process that takes millions of years and depends on a rise in the minimum sea level. However, the rapid rise in the current temperature and human intervention in the area do not seem to guarantee that this process would occur [25]. Faced with the immersion scenario, an increase in salinity due to an intrusion of seawater into the Smith Channel Forest would cause hypersalinization, generating an intolerable water deficit for the population of R. mangle, thus, causing total mortality of the species and an increase in the population of L. racemosa that has a better capacity to adapt to the conditions of hypersalinization [73]. Ecological, functional, and structural changes in the forest will occur. In the case of the Sound Bay and Old Point euhaline forests, the former would remain until the salinity exceeds 36 PSU, while the latter, with R. mangle individuals tolerating high salinities, would resist until the salinity values exceed 50 PSU, after which, due to water stress, they could disappear. As a basis for this possible scenario, we can take as an example the case of the Ciénaga Grande de Santa Marta where the hypersalinization of soils due to anthropogenic causes leads to the mortality of a large part of the forest present in this area [74].
A catastrophic effect of climate change is the increase in the number and magnitude of cyclones, intensified by sea-level rise [24,25]. Due to strong winds, excessive saltwater intrusion (hypersalinization) and extreme rainfall in forests such as Smith Channel and Sound Bay, tree fall, substrate collapse, and sediment deposition (affecting seedlings and juveniles) could occur, leading to an imbalance in the ecological functions of the forest and to a deterioration in the environment and loss of its coastal protection regulatory services [19]. As for the Old Point Forest, given that structurally it has smaller individuals (7.9 m approx.), the population of R. mangle could withstand the force of the wind and the increase of the salinity (up to 50 PSU), maintaining for a short time its coastal protection function but after the process of hypersalinization the forest would disappear.
The evaluated effects of climate change show that the loss of the three mangrove forests is inevitable, starting with the oligohaline forest (Smith Channel) due to the susceptibility of its functional traits to increased salinity, followed by the euhaline forest (Sound Bay) that could sustain the increased salinity for a short period of time, and, finally, with the euphaline Forest (Old Point) where R. mangle species is more tolerant to a possible hypersalinization, but after that, if the increase in salinity is extreme, this forest would also disappear. On the San Andrés Island the possibility of a migration of mangrove forests in the face of a possible climate change event is null, because the area of the island is small, its elevation is low, and the presence of human communities acts as a barrier to the forest’s expanse. Because of these scenarios, the loss of goods and services from these forests is inevitable. Coastal protection will be one of the services that will initially be affected, as the three forests function as a natural barrier that protects human communities from the effects of hurricanes [18,19,20,21,22]. In addition, services such as sediment stabilization, climate regulation, nutrient cycle, carbon sequestration or export, raw materials production, water quality improvement, biodiversity shelter, fisheries production, tourism and recreation [18,22] will be gradually lost, directly affecting the stability of adjacent ecosystems and human communities on the island. This interpretation of the impact of climate change on the increase of interstitial salinity and its effect on the morphoanatomical functional traits of R. mangle, can be used as a tool to predict the impact of climate change on the structure and abundance of vulnerable mangrove forests (inland and island forests). Generating possible mechanisms for the protection and conservation of mangrove species in the medium term.

5. Conclusions

The three forests evaluated determine the presence of a salinity gradient on the San Andrés island in a southeastern–northeastern direction that explains the structural differences between the populations of R. mangle of each forest and the variation in the functional traits of the leaf.
The functional traits evaluated determine that there is a greater difference between the juvenile groups because they are in a state of adaptation to the fluctuation of water stress due to salinity, generating a greater plasticity in the traits in order to stabilize to the environmental conditions of the environment. Adults, being individuals that have tolerated the salinity ranges of each forest over a much longer period of time, show a slight variation in response to fluctuations in these environmental factors.
The results of the relationship between salinity and the functional traits of the leaves show that juveniles and adults of the more saline forest (Old Point) are more affected by increased salinity of the environment, indicating that populations originated under euhaline conditions (above 40 PSU) and tended to tolerate more successfully abrupt changes in salinity. In the case of populations of R. mangle of oligohaline origin (Smith Channel), when they develop under conditions of low water stress, they show less variation of leaf functional traits, indicating greater susceptibility to abrupt changes in salinity. For forests with intermediate salinities, the R. mangle population may adapt to an abrupt increase in salinity but would be at a competitive disadvantage to individuals adapted to higher salinities.
Among the functional traits, those that are directly associated with water accumulation and transport functions (foliar area, hypodermis, diameter lumen and thickness xylem vessel) are the most affected by increased interstitial salinity. The minimal increase in salinity affects the efficient use of water that helps to predict that populations originating from oligohaline environments are much more susceptible to abrupt change in salinity.
The functional traits of the leaves of R. mangle and the tolerance and susceptibility of these to different salinity ranges should be considered against possible scenarios of climate change in the future (sea level rise, temperature rise, cyclone increase and magnitude), since they will depend on the permanence or disappearance of the species and the loss of its ecosystem services. The differential response of traits in R. mangle populations to different concentrations of interstitial salinity can be used as a tool to evaluate the response of salt-accumulating and salt-excluding mangrove species found in environments most vulnerable to climate change phenomena. In addition, knowing which types of populations have functional traits that are more tolerant to increased salinity is key to improving the success of the rehabilitation and restoration processes of mangrove forests, since individuals adapted to conditions of high water deficiency due to salinity will be more viable.

Author Contributions

Conceptualization, A.R.S., J.E.M.P., X.M.C. and J.H.M.C.; methodology, A.R.S., J.E.M.P., X.M.C. and J.H.M.C.; software, A.R.S.; formal analysis, A.R.S., J.E.M.P., X.M.C. and J.H.M.C.; investigation, A.R.S., J.E.M.P., X.M.C. and J.H.M.C.; writing—original draft preparation, A.R.S.; writing—review and editing, A.R.S., J.E.M.P., X.M.C. and J.H.M.C.; funding acquisition, A.R.S. All authors have read and agreed to the published version of the manuscript.

Funding

This research was funded by COLCIENCIAS 2016, grant number FP44842-567-2015 as well as by CEMarin (Contract 14-01) and Project 71382: Reservas de Carbono en bosques de manglar de diferentes entornos ambientales costeros en el Pacífico y Caribe colombiano: Bosques de Manglar como mitigadores de cambio climático MinCiencias (HERMES 46808).

Institutional Review Board Statement

Not applicable.

Informed Consent Statement

Not applicable.

Data Availability Statement

The data presented in this study are available on request from the corresponding author.

Acknowledgments

The authors express our gratitude and appreciation to Universidad Nacional de Colombia–Bogota and the Caribbean headquarters for the use of laboratories and equipment and to the San Andrés Botanical Garden for the company of the staff in the field work, the use of laboratories and equipment.

Conflicts of Interest

The authors declare no conflict of interest. The funders had no role in the design of the study; in the collection, analyses, or interpretation of data; in the writing of the manuscript, or in the decision to publish the results.

References

  1. Smith, S.M.; Snedaker, S.C. Salinity Responses in Two Populations of Viviparous Rhizophora mangle L. Seedlings. Biotropica 1995, 27, 435–444. [Google Scholar] [CrossRef]
  2. Arbeláez-Cortés, E.; Castillo-Cárdenas, M.F.; Toro-Perea, N.; Cárdenas-Henao, H. Genetic structure of the red mangrove (Rhizophora mangle L.) on the Colombian Pacific detected by microsatellite molecular markers. Hydrobiologia 2007, 583, 321–330. [Google Scholar] [CrossRef]
  3. Hao, G.-Y.; Jones, T.J.; Luton, C.; Zhang, Y.-J.; Manzane, E.; Scholz, F.G.; Bucci, S.J.; Cao, K.-F.; Goldstein, G. Hydraulic redistribution in dwarf Rhizophora mangle trees driven by interstitial soil water salinity gradients: Impacts on hydraulic architecture and gas exchange. Tree Physiol. 2009, 29, 697–705. [Google Scholar] [CrossRef] [Green Version]
  4. Tomlinson, P.B. The Botany of Mangroves; Cambridge University Press: London, UK, 1986. [Google Scholar]
  5. Davis, J.H. The ecology and geologic role of mangroves in Florida. Publ. Carnegie Inst. Wash. 1940, 517, 303–412. [Google Scholar]
  6. Vanegas, F.H. Protocolo Para la Reproducción de Mangle Rojo (Rhizophora mangle) en Vivero; Pro natura Veracruz, A.C. e ITSZ Ingenieros: Veracruz, Mexico, 2013; p. 73. [Google Scholar]
  7. Scholander, P.F. How Mangroves Desalinate Seawater. Physiol. Plant. 1968, 21, 251–261. [Google Scholar] [CrossRef]
  8. Lugo, A.E.; Snedaker, S.C. The ecology of mangroves. Annu. Rev. Ecol. Syst. 1974, 5, 39–64. [Google Scholar] [CrossRef]
  9. Salas Estrada, J.B. Arboles de Nicaragua; Instituto Nicaragüense de Recursos Naturales y del Ambiente: Managua, Nicaragua, 1993. [Google Scholar]
  10. Ortíz Álvarez, O. El Sector Forestal de la Península Zapata, en Matanzas, Cuba: Aspectos de su Interrelación Con el Cambio Climático. Ph.D. Thesis, Universidad de Alicante, Alicante, Spain, Universidad de Pinar del Río, Pinar del Río, Cuba, 2010. [Google Scholar]
  11. Werner, A.; Stelzer, R. Physiological responses of the mangrove Rhizophora mangle grown in the absence and presence of NaCl. Plant Cell Environ. 1990, 13, 243–255. [Google Scholar] [CrossRef]
  12. Camilleri, J.C.; Ribi, G. Leaf Thickness of Mangroves (Rhizophora mangle) Growing in Different Salinities. Biotropica 1983, 15, 139. [Google Scholar] [CrossRef]
  13. Rodríguez, J.A.R.; Pineda, J.E.M.; Melgarejo, L.M.; Calderón, J.H.M. Functional traits of leaves and forest structure of neotropical mangroves under different salinity and nitrogen regimes. Flora 2018, 239, 52–61. [Google Scholar] [CrossRef]
  14. Peterson, C.A. Exodermal Casparian bands: Their significance for ion uptake by roots. Physiol. Plant. 1988, 72, 204–208. [Google Scholar] [CrossRef]
  15. Parida, A.K.; Jha, B. Salt tolerance mechanisms in mangroves: A review. Trees 2010, 24, 199–217. [Google Scholar] [CrossRef]
  16. Lopes, D.; Tognella, M.M.P.; Falqueto, A.; Soares, M. Salinity variation effects on photosynthetic responses of the mangrove species Rhizophora mangle L. growing in natural habitats. Photosynthetica 2019, 57, 1142–1155. [Google Scholar] [CrossRef] [Green Version]
  17. Ramírez Correa, J.A.; Molina Grajales, E.C.; Bernal Escobar, M. Anillos Anuales y Clima en Rhizophora mangle L. de la Bahía de Cispatá; Revista Facultad Nacional de Agronomía: Medellín, Colombia, 2010; pp. 5639–5650. [Google Scholar]
  18. FAO. The World’s Mangroves 1980–2005; FAO: Rome, Italy, 2007. [Google Scholar]
  19. Spalding, M. World Atlas of Mangroves; Routledge: London, UK, 2010. [Google Scholar] [CrossRef]
  20. Alongi, D.M. Carbon payments for mangrove conservation: Ecosystem constraints and uncertainties of sequestration potential. Environ. Sci. Policy 2011, 14, 462–470. [Google Scholar] [CrossRef]
  21. Sandilyan, S.; Kathiresan, K. Mangrove conservation: A global perspective. Biodivers. Conserv. 2012, 21, 3523–3542. [Google Scholar] [CrossRef]
  22. Russi, D.; ten Brink, P.; Farmer, A.; Badura, T.; Coates, D.; Förster, J.; Kumar, R.; Davidson, N. The Economics of Ecosystems and Biodiversity for Water and Wetlands; IEEP: London, UK; Brussels, Belgium, 2013; Volume 78. [Google Scholar]
  23. Ellison, J.C. Vulnerability assessment of mangroves to climate change and sea-level rise impacts. Wetl. Ecol. Manag. 2015, 23, 115–137. [Google Scholar] [CrossRef] [Green Version]
  24. Ward, R.D.; Friess, D.A.; Day, R.; MacKenzie, R.A. Impacts of climate change on mangrove ecosystems: A region by region overview. Ecosyst. Health Sustain. 2016, 2, e01211. [Google Scholar] [CrossRef] [Green Version]
  25. Osland, M.J.; Feher, L.C.; López-Portillo, J.; Day, R.; Suman, D.O.; Menéndez, J.M.G.; Rivera-Monroy, V.H. Mangrove forests in a rapidly changing world: Global change impacts and conservation opportunities along the Gulf of Mexico coast. Estuar. Coast. Shelf Sci. 2018, 214, 120–140. [Google Scholar] [CrossRef]
  26. Alongi, D.M. The Impact of Climate Change on Mangrove Forests. Curr. Clim. Chang. Rep. 2015, 1, 30–39. [Google Scholar] [CrossRef]
  27. Díaz, M.; Manuel, J.; Díaz-Pulido, G.; Garzón-Ferreira, J.; Geister, J.; Sánchez, J.A.; Zea, S. Atlas de los Arrecifes Coralinos del Caribe Colombiano: I. Complejos Arrecifales Oceánicos; Litoflash: Santa Marta, Colombia, 1996. [Google Scholar]
  28. IGAC. Diccionario Geográfico de Colombia; Instituto Geográfico Agustín: Bogotá, Colombia, 1996.
  29. Gavio, B.P.-C. Historical analysis (2000–2005) of the coastal water quality in San Andrés Island, Sea Flower Biosphere Reserve Caribbean, Colombia. Mar. Pollut. Bull. 2010, 60, 1018–1030. [Google Scholar] [CrossRef]
  30. Coralina, I.; Gómez-López, D.I.; Segura-Quintero, C.; Sierra-Correa, P.C.; Garay-Tinoco, J. Atlas de la Reserva de Biósfera Seaflower. Archipiélago de San Andrés, Providencia y Santa Catalina; Serie de Publicaciones Especiales de INVEMAR # 28; Instituto de Investigaciones Marinas y Costeras “José Benito Vives De Andréis”-INVEMAR-y Corporación para el Desarrollo Sostenible del Archipiélago de San Andrés, Providencia y Santa Catalina-CORALINA: Santa Marta, Colombia, 2012; 180p. [Google Scholar]
  31. IDEAM. Datos de las Variables Climáticas de la Isla de San Andrés, Providenciay Santa Catalina; IDEAM: Bogotá, Colombia, 1995.
  32. Sánchez-Núñez, D.A.; Mancera-Pineda, J.E. Flowering patterns in three neotropical mangrove species: Evidence from a Caribbean island. Aquat. Bot. 2011, 94, 177–182. [Google Scholar] [CrossRef]
  33. Sánchez-Núñez, D.A.; Mancera-Pineda, J.E. Pollination and fruit set in the main neotropical mangrove species from the Southwestern Caribbean. Aquat. Bot. 2012, 103, 60–65. [Google Scholar] [CrossRef]
  34. Robles Sánchez, A. Respuestas Morfoanatómicas de Rhizophora mangle a Diferentes Regímenes de Salinidad en la Isla de San Andrés–Colombia-Caribe Colombiano. Master’s Thesis, Universidad Nacional de Colombia, Bogotá, Colombia, 2019. [Google Scholar]
  35. Medina-Calderón, J.H.; Mancera-Pineda, J.E.; Castañeda-Moya, E.; Rivera-Monroy, V.H. Hydroperiod and Salinity Interactions Control Mangrove Root Dynamics in a Karstic Oceanic Island in the Caribbean Sea (San Andres, Colombia). Front. Mar. Sci. 2021, 7, 1194. [Google Scholar] [CrossRef]
  36. Sánchez-Núñez, D. Patrones de Floración, Polinización y Produccion de Frutos. Master’s Thesis, Universidad Nacional de Colombia, Bogotá, Colombia, 2009. [Google Scholar]
  37. Ito, T. The Venice system for the classification of marine waters according to salinity: Symposium on the classification of brackish waters, Venice, 8–14 April 1958. Jpn. J. Limnol. (Rikusuigaku Zasshi) 1959, 9, 119–120. [Google Scholar] [CrossRef] [Green Version]
  38. Medina Calderón, J.H. Estructura, Biomasa y Producción Primaria Neta de Bosques de Manglar en Ambientes Kársticos de Islas Oceánicas. Ph.D. Thesis, Universidad Nacional de Colombia sede Caribe, San Andrés, Colombia, 2016. [Google Scholar]
  39. McKee, K.L.; Mendelssohn, I.A.; Hester, M.W. Reexamination of pore water sulfide concentrations and redox potentials near the aerial roots of Rhizophora mangle and Avicennia germinans. Am. J. Bot. 1988, 75, 1352–1359. [Google Scholar] [CrossRef]
  40. Donahue, R.L.; Miller, R.W.; Shickluna, S.C. An Introduction to Soils and Plant Growth; Prentice Hall, Inc.: Englewood Cliffs, NJ, USA, 1983. [Google Scholar]
  41. Wakushima, S.; Kuraishi, S.; Sakurai, N. Soil salinity and pH in Japanese mangrove forests and growth of cultivated mangrove plants in different soil conditions. J. Plant Res. 1994, 107, 39–46. [Google Scholar] [CrossRef]
  42. Araújo, R.J.; Jaramillo, J.C.; Snedaker, S.C. LAI and leaf size differences in two red mangrove forest types in south Florida. Bull. Mar. Sci. 1997, 60, 643–647. [Google Scholar]
  43. Ball, M. Ecophysiology of mangroves. Trees 1988, 2, 129–142. [Google Scholar] [CrossRef]
  44. Reef, R.; Lovelock, C. Regulation of water balance in mangroves. Ann. Bot. 2014, 115, 385–395. [Google Scholar] [CrossRef] [Green Version]
  45. Melcher, P.; Goldstein, G.; Meinzer, F.; Yount, D.; Jones, T.; Holbrook, N.; Huang, C. Water relations of coastal and estuarine Rhizophora mangle: Xylem pressure potential and dynamics of embolism formation and repair. Oecologia 2001, 126, 182–192. [Google Scholar] [CrossRef]
  46. Terrazas, T.; Yáñez-Espinosa, L.; López-Mata, L.; Valdez-Hernández, J.I. Wood variation in Laguncularia racemosa and its effect on fibre quality. Wood Sci. Technol. 2004, 38, 217–226. [Google Scholar] [CrossRef]
  47. Hacke, U.G.; Sperry, J.S.; Wheeler, J.K.; Castro, L. Scaling of angiosperm xylem structure with safety and efficiency. Tree Physiol. 2006, 26, 689–701. [Google Scholar] [CrossRef] [PubMed]
  48. Lovelock, C.E.; Ball, M.C.; Feller, I.C.; Engelbrecht, B.M.J.; Ewe, M.L. Differential effects of nitrogen and phosphorus on hydraulic conductance of mangroves along salinity gradients. Physiol. Plant. 2006, 127, 457–464. [Google Scholar] [CrossRef]
  49. Schmitz, N.; Verheyden, A.; Beeckman, H.; Kairo, J.G.; Koedam, N. Influence of a Salinity Gradient on the Vessel Characters of the Mangrove Species Rhizophora mucronata. Ann. Bot. 2006, 98, 1321–1330. [Google Scholar] [CrossRef] [PubMed]
  50. Alpert, P.; Simms, E.L. The relative advantages of plasticity and fixity in different environments: When is it good for a plant to adjust? Evol. Ecol. 2002, 16, 285–297. [Google Scholar] [CrossRef]
  51. Hayward, H.E.; Long, E.M. Anatomical and Physiological Responses of the Tomato to Varying Concentrations of Sodium Chloride Sodium Sulphate, and Nutrient Solutions. Bot. Gaz. 1941, 102, 437–462. [Google Scholar] [CrossRef]
  52. Boughalleb, F.; Denden, M.; Ben Tiba, B. Anatomical changes induced by increasing NaCl salinity in three fodder shrubs, Nitraria retusa, Atriplex halimus and Medicago arborea. Acta Physiol. Plant. 2009, 31, 947–960. [Google Scholar] [CrossRef]
  53. Shannon, M.C.; Grieve, C.M.; Francois, L.E. Whole - plant response to salinity. In Plant-Environment Interactions; Wilkinson, R.E., Ed.; Marcel Dekker, Inc.: New York, NY, USA, 1994; pp. 199–244. [Google Scholar]
  54. Tomlinson, P.B. The Botany of Mangroves, 1st ed.; Cambridge University Press: New York, NY, USA, 1994. [Google Scholar]
  55. Sidhu, S.S. Structure of epidermis and stomatal apparatus of mangrove species. In Proceedings of the International Symposium on Biology and Management of Mangroves; Institute of Food and Agricultural Sciences, University of Florida: Gainesville, FL, USA, 1975; pp. 569–578. [Google Scholar]
  56. Parida, A.; Das, A.; Mittra, B. Effects of NaCl Stress on the Structure, Pigment Complex Composition, and Photosynthetic Activity of Mangrove Bruguiera parviflora Chloroplasts. Photosynthetica 2003, 41, 191–200. [Google Scholar] [CrossRef]
  57. Parida, A.; Das, A.B.; Mittra, B.N. Effects of salt on growth, ion accumulation, photosynthesis and leaf anatomy of the mangrove, Bruguiera parviflora. Trees 2004, 18, 167–174. [Google Scholar] [CrossRef]
  58. Saenger, P. Morphological, anatomical and reproductive adaptations of Australian mangroves. In Mangrove Ecosystems in Australia: Structure, Function and Management; Australia National University Press: Acton, Australia, 1982. [Google Scholar]
  59. Das, S. An adaptive feature of some mangroves of Sundarbans, West Bengal. J. Plant Biol. 1999, 42, 109–116. [Google Scholar] [CrossRef]
  60. Waisel, Y. Biology of Halophytes; Academic Press: New York, NY, USA, 1972. [Google Scholar]
  61. Poljakoff-Mayber, A. Morphological and anatomical changes in plants as a response to salinity stress. In Plants in Saline Environment; Springer: Heidelberg/Berlin, Germany, 1975; pp. 97–117. [Google Scholar] [CrossRef]
  62. Ball, M.; Farquhar, G.D. Photosynthetic and Stomatal Responses of Two Mangrove Species, Aegiceras corniculatum and Avicennia marina, to Long Term Salinity and Humidity Conditions. Plant Physiol. 1984, 74, 1–6. [Google Scholar] [CrossRef] [PubMed] [Green Version]
  63. Aziz, I.; Khan, M.A. Effect of Seawater on the Growth, Ion Content and Water Potential of Rhizophora mucronata Lam. J. Plant Res. 2001, 114, 369–373. [Google Scholar] [CrossRef]
  64. Hoppe-Speer, S.C.; Adams, J.; Rajkaran, A.; Bailey, D. The response of the red mangrove Rhizophora mucronata Lam. to salinity and inundation in South Africa. Aquat. Bot. 2011, 95, 71–76. [Google Scholar] [CrossRef]
  65. Valladares, F.; Gianoli, E.; Gómez, J.M. Ecological limits to plant phenotypic plasticity. New Phytol. 2007, 176, 749–763. [Google Scholar] [CrossRef] [PubMed]
  66. Poveda, G.; Mesa, Ó.J. Las fases extremas del fenómeno ENSO (El Niño y La Niña) y su influencia sobre la hidrología de Colombia. Tecnol. Cienc. Agua 1996, 11, 21–37. [Google Scholar]
  67. NOAA National Weather Service C for Climate Prediction. Historical El Niño/La Niña Episodes (1950-Present). 2021. Available online: https://origin.cpc.ncep.noaa.gov/products/analysis_monitoring/ensostuff/ONI_v5.php (accessed on 31 May 2021).
  68. Moreno, M.M.; del Valle, J.I. Influence of local climate and ENSO on the growth of Abarco (Cariniana pyriformis) in Chocó, Colombia. Trees 2015, 29, 97–107. [Google Scholar] [CrossRef]
  69. Blanco, J.A.; Viloria, E.A. ENSO and salinity changes in the Ciénaga Grande de Santa Marta coastal lagoon system, Colombian Caribbean. Estuarine. Coast. Shelf Sci. 2006, 66, 157–167. [Google Scholar] [CrossRef]
  70. Jennerjahn, T.C.; Gilman, E.; Krauss, K.W.; Lacerda, L.D.; Nordhaus, I.; Wolanski, E. Mangrove ecosystems under climate change. In Mangrove Ecosystems: A Global Biogeographic Perspective; Springer: Cham, Switzerland, 2017; pp. 211–244. [Google Scholar]
  71. Von Prahl, H.; Contreras, R. Manglares y Hombres del Pacífico; Fondo FEN Colombia. Editorial Presencia: Bogotá, Colombia, 1990; p. 193. [Google Scholar]
  72. Qin, D.; Plattner, G.K.; Tignor, M.; Allen, S.K.; Boschung, J.; Nauels, A.; Midgley, P.M. Climate Change 2013: The Physical Science Basis. Contribution of Working Group I to the Fifth Assessment Report of the Intergovernmental Panel on Climate Change (eds TF Stocker et al.); Cambridge University Press: New York, NY, USA, 2014; pp. 5–14. [Google Scholar]
  73. Lovelock, C.E.; Feller, I.C. Photosynthetic performance and resource utilization of two mangrove species coexisting in a hypersaline scrub forest. Oecologia 2003, 134, 455–462. [Google Scholar] [CrossRef] [PubMed] [Green Version]
  74. Cardona, P.; Botero, L. Soil Characteristics and Vegetation Structure in a Heavily Deteriorated Mangrove Forest in the Caribbean Coast of Colombia. Biotropica 1998, 30, 24–34. [Google Scholar] [CrossRef]
Figure 1. Mangrove forest Old Point (OP), Sound Bay (SB) and Smith Channel (SC) in San Andrés island–Colombia.
Forests 12 01586 g001
Figure 2. Interstitial salinity and pH in each of the mangrove forests. (A). Salinity grouped by forest; (B). Salinity for each forest and each time evaluated. (C). pH grouped by forest; (D). pH for each forest and each time evaluated. The bars indicate the standard error of each data group (SE).
Forests 12 01586 g002
Figure 3. Morphoanatomical traits measured in juveniles and adults of R. mangle during four periods. SC + JV: Smith Channel juveniles, SB + JV: Sound Bay juveniles, OP + JV: Old Point juveniles, SC + AD: Smith Channel adults, SB + AD: Sound Bay adults, OP + AD: Old Point adults. (A) Leaf area. SC + JV: n = 36, SB + JV: n = 36, OP + JV: n = 36, SC + AD: n = 36, SB + AD: n = 36, OP + AD: n = 36. (B) Thickness leaf. SC + JV: n = 324, SB + JV: n = 324, OP + JV: n = 326, SC + AD: n = 325, SB + AD: n = 324, OP + AD: n = 320. (C) Thickness adaxial cuticle. SC + JV: n = 324, SB + JV: n = 324, OP + JV: n = 326, SC + AD: n = 325, SB + AD: n = 324, OP + AD: n = 320. (D) Thickness adaxial epidermis. SC + JV: n = 324, SB + JV: n = 324, OP + JV: n = 326, SC + AD: n = 325, SB + AD: n = 324, OP + AD: n = 320.
Forests 12 01586 g003
Figure 4. Histology cuts in the leaf blade of juveniles and adults of R. mangle. (A) SC + AD. (B) SC + JV. (C) SB + AD. (D) SB + JV. (E) OP + AD. (F) OP + JV. AdC = Adaxial cuticle; AdE = Adaxial epidermis; Hy = Hypodermis; Pp = Palisade parenchyma; Sp = Spongy parenchyma; AbE = Adaxial epidermis; AbC = Abaxial cuticle.
Forests 12 01586 g004
Figure 5. Morphoanatomical traits measured in juveniles and adults of R. mangle during four periods. (A) Thickness hypodermis SC + JV: n = 324, SB + JV: n = 324, OP + JV: n = 326, SC + AD: n = 325, SB + AD: n = 324, OP + AD: n = 320. (B) Thickness palisade parenchyma. SC + JV: n = 324, SB + JV: n = 324, OP + JV: n = 326, SC + AD: n = 325, SB + AD: n = 324, OP + AD: n = 320. (C) Thickness spongy parenchyma. SC + JV: n = 324, SB + JV: n = 324, OP + JV: n = 326, SC + AD: n = 325, SB + AD: n = 324, OP + AD: n = 320. (D) Thickness abaxial epidermis. SC + JV: n = 324, SB + JV: n = 324, OP + JV: n = 326, SC + AD: n = 325, SB + AD: n = 324, OP + AD: n = 320.
Forests 12 01586 g005
Figure 6. Morphoanatomical traits measured in juveniles and adults of R. mangle during four periods. (A) Diameter of the lumen of the xylem vessels. SC + JV: n = 1296, SB + JV: n = 1272, OP + JV: n = 1272, SC + AD: n = 1272, SB + AD: n = 1396, OP + AD: n = 1296. (B) Thickness of the wall of the xylem vessels. SC + JV: n = 1296, SB + JV: n = 1272, OP + JV: n = 1272, SC + AD: n = 1272, SB + AD: n = 1396, OP + AD: n = 1296.
Forests 12 01586 g006
Figure 7. Histology cuts in the central vascular vein of the leaf in juveniles and adults of R. mangle. (A) SC + AD. (B) SC + JV. (C) SB + AD. (D) SB + JV. (E) OP + AD. (F) OP + JV. DL = Diameter of the lumen of the xylem vessels; WT = Thickness of the wall of the xylem vessels.
Forests 12 01586 g007
Table 1. Statistical results of morphoanatomical measurements in the leaf of juveniles and adults of R. mangle. KW: Kruskal Wallis. * = significant difference. df = 2 for intra-age comparisons and df = 5 for comparison of all groups.
KWJuvenilesAdultsAll Groups
TissueX2pX2pX2p
Leaf Area14.77<0.001 *7.490.024 *37.61<0.001 *
Leaf Thickness34.9<0.001 *0.820.066344.1<0.001 *
Adaxial Cuticle56.78<0.001 *9.86<0.001 *82.99<0.001 *
Adaxial Epidermis20.04<0.001 *9.57<0.001 *30.01<0.001 *
Hypodermis50.295<0.001 *1.180.55458.12<0.001 *
Palisade Parenchyma62.43<0.001 *0.220.89787.05<0.001 *
Spongy Parenchyma21.47<0.001 *3.910.14157.88<0.001 *
Abaxial Epidermis21.63<0.001 *1.150.56221.95<0.001 *
Abaxial Cuticle6.220.045 *0.520.77117.43<0.001 *
Diameter Lumen Xylem Vessels42.33<0.001 *15.23<0.001 *70.54<0.001 *
Wall Xylem Vessels22.88<0.001 *23.66<0.001 *95.91<0.001 *
Table 2. Results of the Spearman correlation test for morphoanatomical traits (in leaf lamina) measured in juveniles and adults of R. mangle against different salinity ranges. Bold = Correlation greater than 40%.
GroupFunctional Traits
Foliar Leaf
Leaf AreaAdaxial CuticleAdaxial EpidermisHypodermisPalisade ParenchymaSpongy ParenchymaAbaxial EpidermisAbaxial CuticleLeaf ThicknessXylem Lumen DiameterXylem Vessel Thickness
Juveniles
SC + JV−0.4780.0650.3210.3690.0680.2070.283−0.0410.3850.4170.519
SB + JV−0.6960.3540.3340.6220.3080.2150.3970.0990.591−0.4090.734
OP + JV0.0650.5730.6090.7560.5960.5940.5520.3390.7540.6440.482
Adults
SC + AD−0.6740.1010.1210.3960.1800.1720.223−0.1150.2760.4980.331
SB + AD−0.4300.2770.2670.3710.4720.3090.328−0.0730.4080.5380.439
OP + AD−0.7010.5620.5500.4700.5970.5460.6000.2820.5070.5430.462
Publisher’s Note: MDPI stays neutral with regard to jurisdictional claims in published maps and institutional affiliations.

