Article

Land Cover and Land Use Change Decreases Net Ecosystem Production in Tropical Peatlands of West Kalimantan, Indonesia

1
Department of Fisheries and Wildlife, Oregon State University, Corvallis, OR 97331, USA
2
CIFOR—Center for International Forestry Research, Bogor 16115, Indonesia
3
U. S. Geological Survey, Oregon Cooperative Fish and Wildlife Research Unit, Corvallis, OR 97331, USA
4
Department of Soil Science, Tanjungpura University, Pontianak 78124, Indonesia
5
Department of Geophysics and Meteorology, IPB University, Bogor 16680, Indonesia
*
Author to whom correspondence should be addressed.
Submission received: 18 September 2021 / Revised: 1 November 2021 / Accepted: 3 November 2021 / Published: 18 November 2021
(This article belongs to the Special Issue Forest-Atmosphere Interactions)

Abstract

:
Deforested and converted tropical peat swamp forests are susceptible to fires and are a major source of greenhouse gas (GHG) emissions. However, information on the influence of land-use change (LUC) on the carbon dynamics in these disturbed peat forests is limited. This study aimed to quantify soil respiration (heterotrophic and autotrophic), net primary production (NPP), and net ecosystem production (NEP) in peat swamp forests, partially logged forests, early seral grasslands (deforested peat), and smallholder-oil palm estates (converted peat). Peat swamp forests (PSF) showed similar soil respiration with logged forests (LPSF) and oil palm (OP) estates (37.7 Mg CO2 ha−1 yr−1, 40.7 Mg CO2 ha−1 yr−1, and 38.7 Mg CO2 ha−1 yr−1, respectively), but higher than early seral (ES) grassland sites (30.7 Mg CO2 ha−1 yr−1). NPP of intact peat forests (13.2 Mg C ha−1 yr−1) was significantly greater than LPSF (11.1 Mg C ha−1 yr−1), ES (10.8 Mg C ha−1 yr−1), and OP (3.7 Mg C ha−1 yr−1). Peat swamp forests and seral grasslands were net carbon sinks (10.8 Mg CO2 ha−1 yr−1 and 9.1 CO2 ha−1 yr−1, respectively). In contrast, logged forests and oil palm estates were net carbon sources; they had negative mean Net Ecosystem Production (NEP) values (−0.1 Mg CO2 ha−1 yr−1 and −25.1 Mg CO2 ha−1 yr−1, respectively). The shift from carbon sinks to sources associated with land-use change was principally due to a decreased Net Primary Production (NPP) rather than increased soil respiration. Conservation of the remaining peat swamp forests and rehabilitation of deforested peatlands are crucial in GHG emission reduction programs.

1. Introduction

Around 44 Mha out of all worldwide peatlands (400 Mha) lies in tropical nations, of which about 15 to 21 Mha are in Indonesia [1]. A recent study updated the estimate of the total peatlands in Indonesia that is 13.4 Mha [2]. Tropical peatland ecosystems are among the largest ecosystem carbon (C) stocks on earth, with about 82–92 PgC [3,4], The largest peatland area is on the island of Borneo (≈6.8 Mha) [5]. Tropical peatland forests have significantly been affected by deforestation, forest degradation, and land conversion [6,7]. Carbon stocks of tropical peatlands have been estimated to range from 81.7 to 91.9 Pg or about 15–19% of all global peat C stocks (610 Pg) [8]. Peat forests in Indonesia store about 57 Pg C [9]. The degradation is widespread in Indonesia; intact peat swamp forest now only comprises <7% of all peatland areas in Indonesia [7]. Land-use change has shifted carbon dynamics such that the converted peatland landscapes are now net sources of carbon [10].
Factors that govern peat accumulation in the tropical peat swamp forest ecosystem are the diverse vegetation peat-forming communities, the continued supplies of woody organic matters, the inundated environment [11], and the absence of fires. When the conversion of tropical peatlands occurs, these first three factors disappear and cause the rate of peat decomposition to become higher than the rate of organic matter supply. A rapid rate of peat oxidation occurs because of sufficient oxygen availability in the aerobic peat layer due to drainage and shortage of organic matter supply due to deforestation and the change of land cover, from the forest into seral grasses and monoculture oil palm estate.
Agriculture and tree estate development and management in peatlands include draining saturated soils necessary to provide suitable growing conditions [12]. Drainage canals decrease the water levels of peatlands, thus increasing aerobic decomposition rates and, therefore, carbon emissions [9]. An increase of drainage depth by 10 cm may increase emissions of about 9 Mg CO2 ha−1 yr−1 [13]. Another consequence of drainage includes the increased occurrence of peat fires, resulting in the release of significant amounts of CO2, as much as 1400 Mg CO2 ha−1 [14,15].
Changes in carbon sequestration and emissions affected by peat forest deforestation and LUC can be quantified by comparing the net ecosystem production (NEP) of different land cover types in the same ecosystem [16,17]. Net ecosystem production (NEP) is defined as the difference between gross primary production (GPP) and ecosystem respiration (ER) [16]. GPP is defined as the gross vegetation uptake of CO2 utilized for the photosynthesis process [16]. Ecosystem respiration is the total CO2 that is released from the ecosystem to the atmosphere through autotrophic (vegetation) and heterotrophic (microbial) respiration processes [16,18,19]. Net primary production (NPP) is defined as the difference between GPP and autotrophic respiration [20]. NEP is determined by subtracting heterotrophic respiration from NPP. Few studies have determined NEP in tropical peat forests [15,21]. However, [22,23] reported that the NPP of tropical peat forests was 11.2 Mg C ha−1 yr−1 and 13.2 Mg C ha−1 yr−1, respectively.
Many studies have reported differences in soil respiration due to land use. Soil respiration was higher in intact peat forests (21 Mg C ha−1 yr−1) than oil palm and sago estates (15 Mg C ha−1 yr−1 and 11 Mg C ha−1 yr−1, respectively) in Sarawak, Malaysia [24]. In contrast, it was found that soil respiration of Indonesian oil palm estates was higher (28.4 Mg C ha−1 yr−1) than those in both intact and logged peat forests (16.0 Mg C ha−1 yr−1 and 18.5 Mg C ha−1 yr−1, respectively) [25]. A review by [26] concluded that total soil respiration was more significant in managed peat ecosystems (52.3 Mg CO2 ha−1 yr−1) than in natural peat forests (35.9 Mg CO2 ha−1 yr−1). However, in addition to soil emissions, the NPP is needed to determine net greenhouse gas emissions due to land cover change.
Quantification and comparisons of the net emissions and NEP from intact tropical peatland forests with sites logged or converted to agriculture are needed to understand the carbon dynamics and conservation values of these landscapes. We aimed to quantify and determine the differences in NEP in intact peat forest and adjacent, logged forest, degraded sites, and oil palm estates. The primary objectives of this study were to quantify changes in soil CO2 fluxes and NEP resulting from logging (LPSF), logging and fire (ES), and land conversion to oil palm estates. We hypothesized that logging and land-use changes significantly alter the NEP of tropical peat swamp forests. This is because logging and land conversion may significantly increase heterotrophic respiration by lowering groundwater levels impacted by drainage canals; while decreasing NPP by removals of native trees to peat swamp forest ecosystem.

2. Materials and Methods
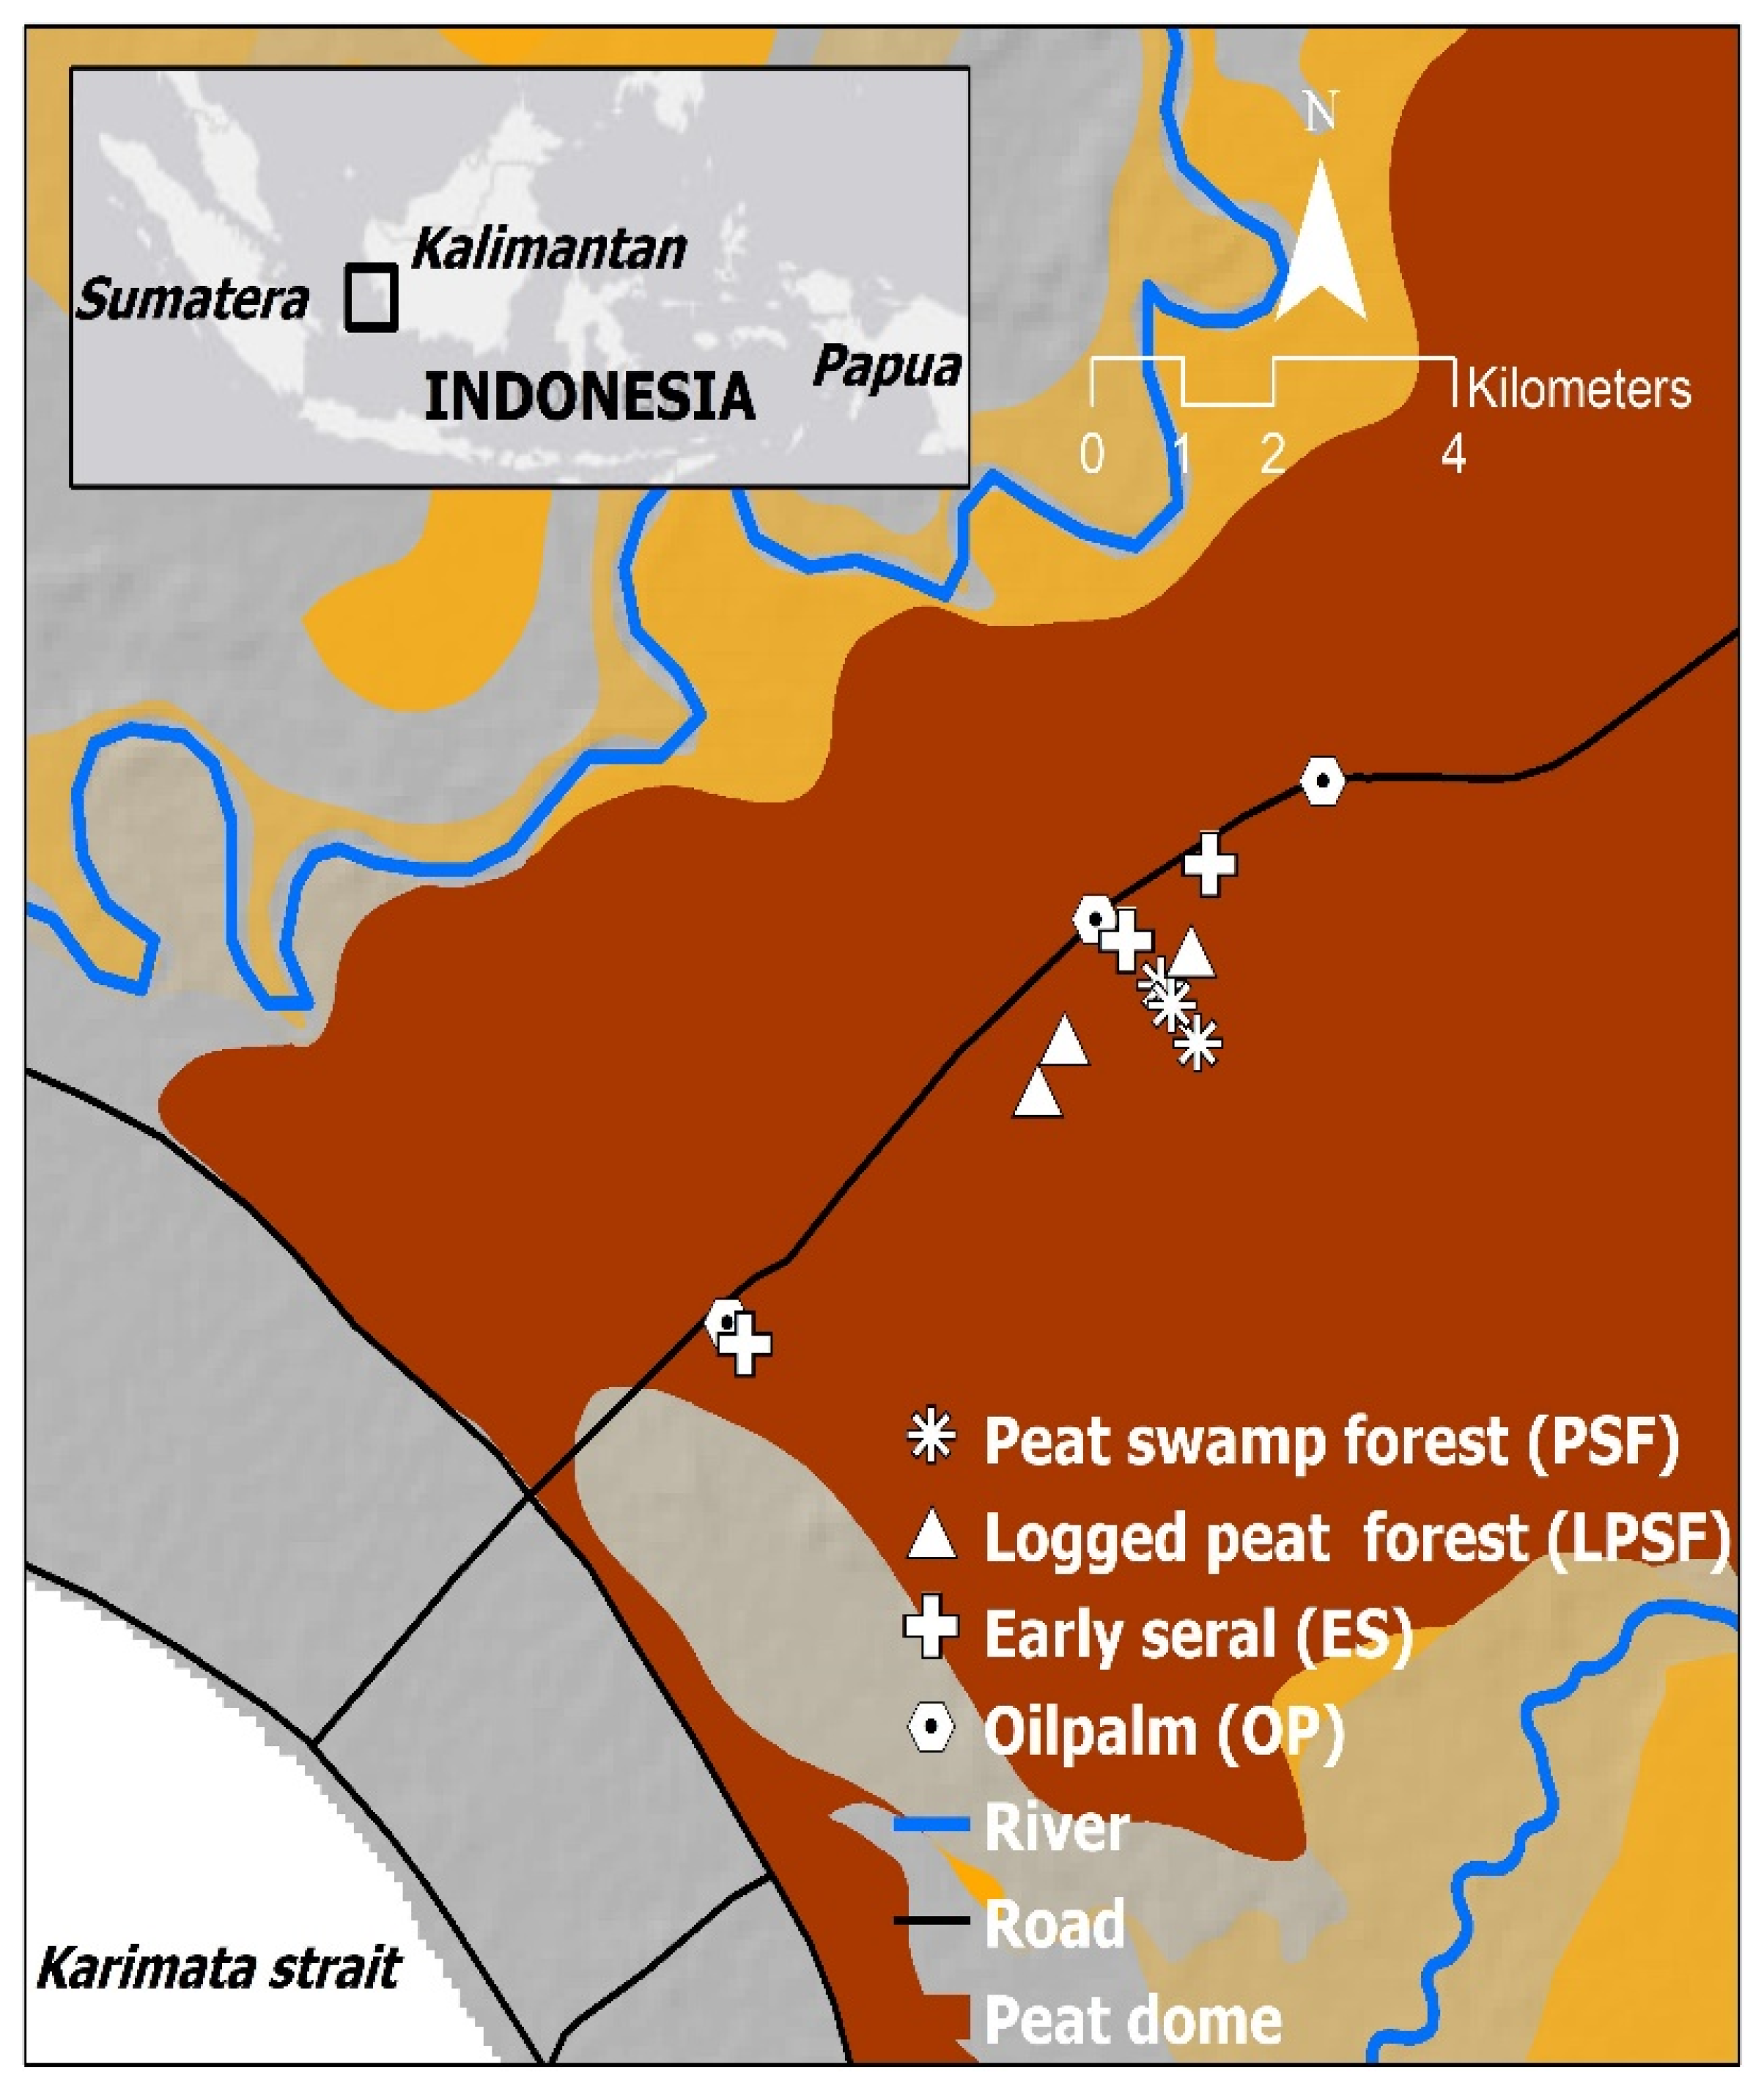
2.1. Study Site

The study area was located near Ketapang, West Kalimantan, Indonesia (Figure 1). The sampled peat dome (34,651 ha) was a deep coastal peatland, which the Pawan River borders on the north, Pesaguhan River on the south, hills on the east, and alluvial soils on the west. The two main rivers flow to the Karimata Strait in the Java Sea. Historical data on rainfall near Ketapang averages 2892 mm per year [27], while the annual temperature averages 27.3 °C (from 1982 to 2012). The study area has a range of elevation above mean sea level from 10 to 24 m [28].
The peat forests on this dome had been partly disturbed and exploited for timber (subsistence use) since about 1988. At that time, the access to the dome was opened through road building and started the timber exploitation and forest conversion [29]. The forests are composed of typical tree species in peat swamps, including Aglaia rubiginosa (Hirn.) Pannel, Dactylocladus stenostachys (Oliv.), and Dyera costulata (Hook.f)., Palaquium spp. [23]. Three relatively undisturbed peat swamp forests/PSF and three logged peat swamp forests/LPSF) were selected in this study. Tree canopy of 30 m heights dominates PSF, and that of 15 m dominates the LPSF sites.
In addition to the forests, three early seral dominated by grasses and ferns (ES) and three smallholder oil palm estates (OP) were sampled. The OP estates were in close proximity to the other land cover types. The early seral sites had been logged in the past. They had been burnt several times, enabling ferns (e.g., Stenochlaena palustris and Blechnum indicum) and grasses (e.g., Themeda triandra and Andropogon gerardii) [31,32] to dominate. Early seral sites were first formed from the logged forests that were initially logged and burned in 1994 (Table 1). The three sampled oil palm (Elaeis guineensis) estates were three, four, and five years old. These estates were established on previously early seral sites that had been cleared and canalized around their boundaries. All sites occurred near the center of the peat dome.

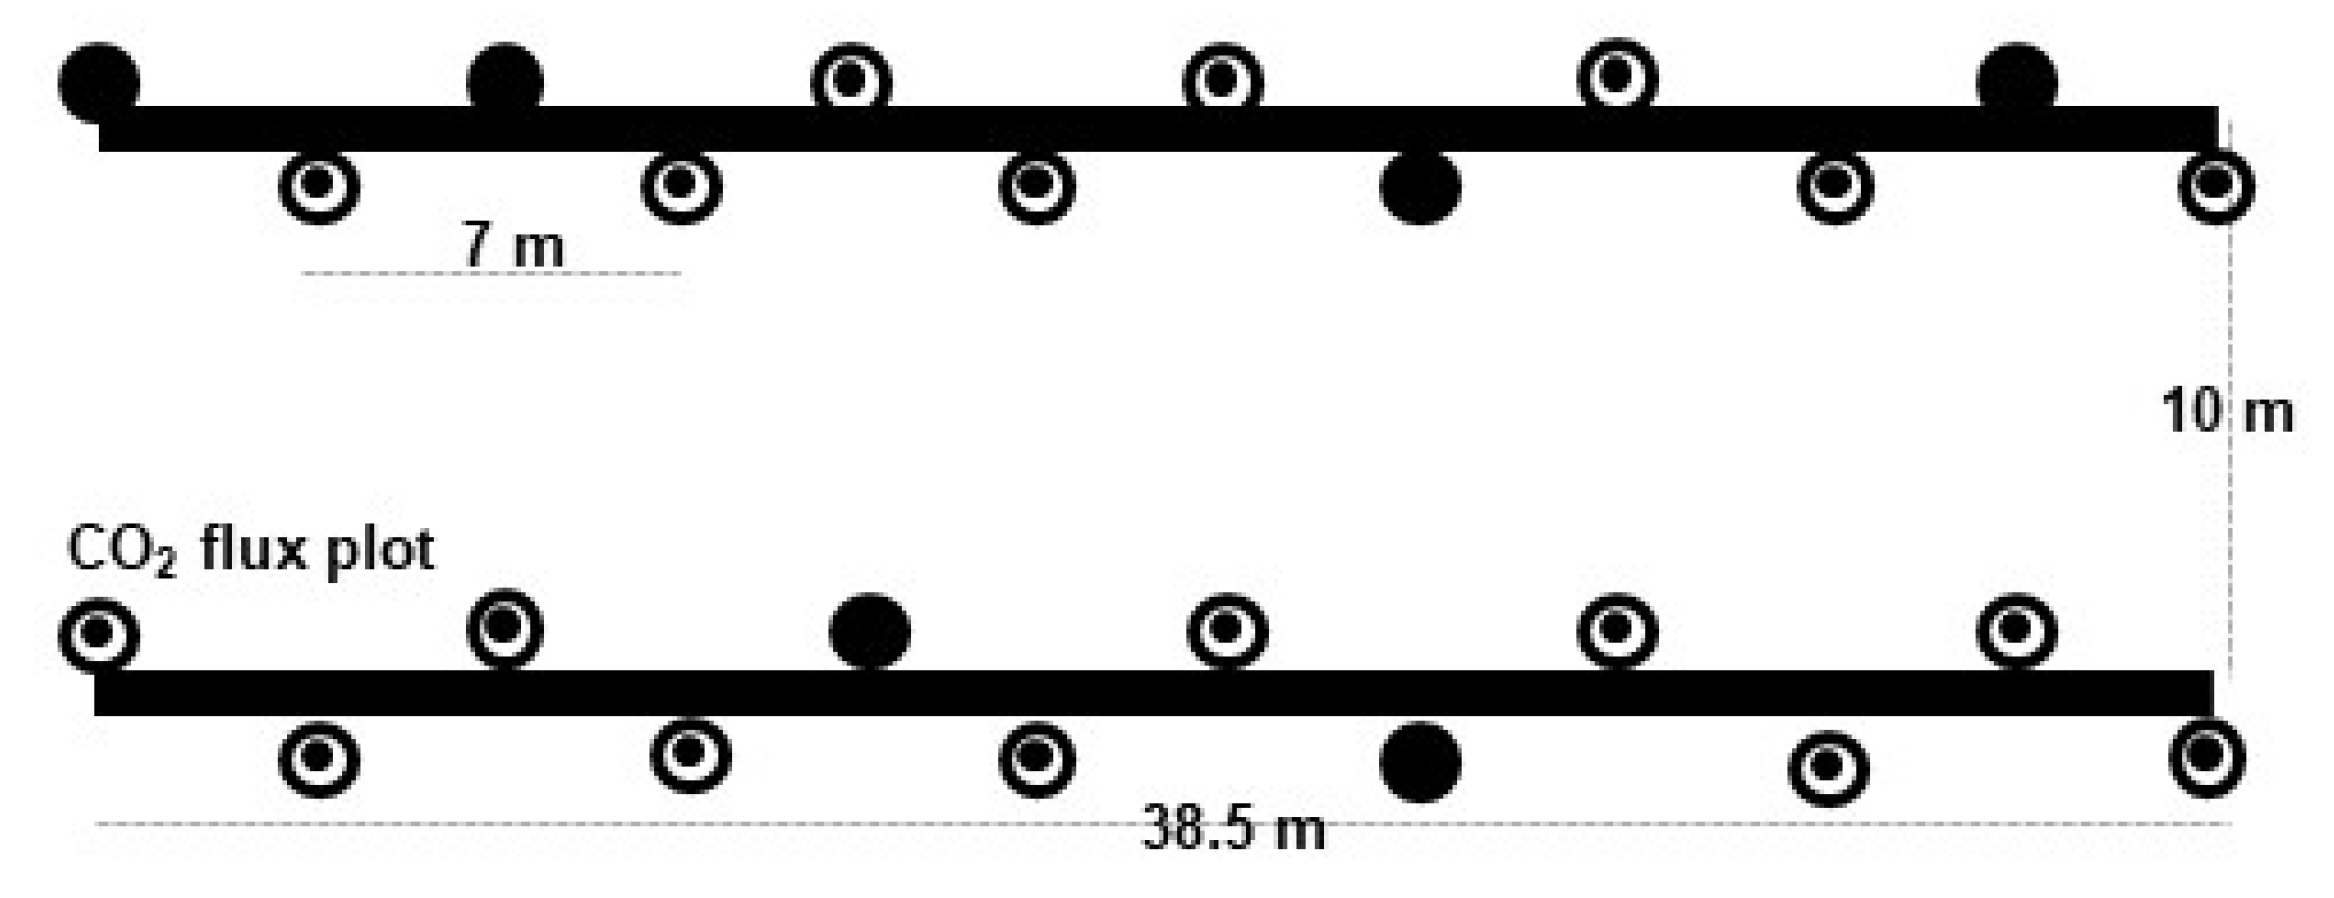
2.2. Soil Respiration: Total, Heterotrophic and Autotrophic Respiration

CO2 emissions from soils were measured monthly on all land cover types for 15 months beginning August 2014. Two transects of 38.5 m were established at each site to measure soil CO2 emissions. Twenty-four sampling points were systematically established 3.5 m apart along each transect (Figure 2).
Eighteen points were marked and selected to measure total soil respiration (autotrophic and heterotrophic sources) and 6 for only heterotrophic respiration. Heterotrophic respiration was accomplished by trenching the perimeter of the plots to a 50 cm depth to cut existing roots. A 200 cm circular circumference of the root barrier was established in the trenched plot [33,34]. The inside trench wall was covered with a very fine mesh aluminum screening, and the trench was backfilled to minimize disturbance. Soil CO2 measurement was done a month after setting up the trenches to provide time for the cut roots to be decomposed. When plants were found growing within the trenched plot, they were removed to avoid root growth affecting the soil’s CO2 emissions. A boardwalk was constructed on each transect to prevent disturbance on the peat surface while measurements were taking place. Autotrophic respiration was calculated by subtracting the heterotrophic to the total soil respiration.
Soil CO2 respiration was measured using a portable infrared gas analyzer EGM-4 (PP Systems, USA) connected to the peat surface with a closed soil respiration chamber. The CO2 emissions (mg m−2 h−1) were calculated from the linear change with time of gas concentration [35]. Soil CO2 concentrations were automatically recorded every 4.5-s interval for about two minutes. In each site, the respiration measurements were taken between 3 pm until 6 pm. Due to the remote and difficult access, only one or two sites could be measured in a day to have similar timing of sampling in all sites.

2.3. Net Primary Production and Net Ecosystem Production

Net primary production (NPP) was measured and quantified for all sample sites of different cover types. The NPP of both aboveground and belowground was quantified [23]. The annual sum of tree growth and litterfall was quantified as aboveground production, while the yearly growth of roots was quantified as belowground production.
In each forested sample site (PSF and LPSF), six plots, six of a 10 m radius circle area, were set up 30 m in the distance along a line transect (total length 150 m; adapted from [5,36]). All trees in each plot were measured for their tree diameter at breast height (DBH) to be later extrapolated using our tree diameter growth model. A total of 120 trees, 20 in each forested site (three PSF and LPSF sites) were randomly chosen in 35 × 10 m2 plots, located 10 m to the 150 m transect. At each site, to create a diameter growth model, tree growth was measured monthly for a year through the installation of tree bands (dendrometer), 1.3 m aboveground (DBH) [37]. In addition, the litterfall accumulation rate was measured using six litterfall traps positioned every 7 m apart along the 35 m transect. Each trap has an area of about 0.23 m2 and was set up a meter above ground and tied to surrounding trees or wooden poles. Litterfall samples were gathered twice during the wet season (November and December 2015) and four times during dry seasons of two consecutive years (September and October of 2014 and 2015). Samples of litterfall were packed in plastic bags and transported to the laboratory at Bogor Agricultural University, Bogor, Indonesia. After those samples were dried at 60 °C to constant mass and weighed, the C content was then measured using a LECO Analyzer (dry combustion method/induction furnace). Chimner and Ewel [22] reported that branch fall production was estimated as 9.89% of the litterfall annual production. Root: shoot ratio in terrestrial biomass [38] was used to estimate the coarse root production, as its ratio to the aboveground biomass of all the forests trees. 12% of the overall annual production of tree, coarse root, and litterfall was used to estimate fine root production [22]. Annual NPP of all trees in PSF and LPSF was thus calculated as a sum of the aboveground and belowground NPP, which captured the annual production of tree growth, coarse and fine root growth, as well as litter and branch fall accumulation.
NPP in oil palm estate was assessed through six 10 m radius plots located 30 m apart along a 150 m transect in each sample site (similar to those in the intact and logged forests). The height of the base of their young leaves of all oil palm trees was measured at all OP sites and re-measured two years later. Annual height growth of oil palm trees was calculated by subtracting the initial tree height from the tree height at Year 2, then dividing by two. Annual biomass growth for OP trees was estimated using an allometric equation [39], which was developed in Sumatera and Borneo islands from harvested oil palm trees <1 to 8 m in height on peatlands [39]. About 75.3% of frond production, which is 68.8% of the tree biomass growth, was used to estimate the pruned frond biomass, and about 71.7% of root production, which is 14.2% of the tree biomass growth, was used to estimate dead root biomass [40]. The dead root and pruned frond production were summed to quantify the annual NPP of OP sites. As the oil palm estates were less than five years old, the contribution of fruit to the total NPP was neglected.
Early seral sites (ES) were measured for their NPP through transect of squared plot design. In each ES site, six 1 m2 plots were established at 7 m intervals along a 35m transect. All aboveground standing herbaceous biomass and litterfall were harvested in a 1 m2 plot at the six locations on each site. These ES plots were burned in September 2014, which enabled us to measure the annual aboveground NPP of ES after a year. Standing mass and litterfall were sampled using destructive sampling. Those masses were packed, weighed, and sub-sampled before transporting to the laboratory. In the laboratory, those samples were dried at 60 °C to constant mass, weighed, and processed with a LECO Analyzer to measure the carbon concentration. We used 110% of total leaf and litterfall to estimate the annual production of root [41]. The Annual NPP of ES was estimated as the sum of whole leaf, litterfall, and root production.
A conversion factor of 0.47 [5] was used to convert biomass to C mass. Then, C mass was reported as CO2 (C-CO2) by multiplying C values by 3.67, the molecular ratio of CO2 to C.
NEP is the difference between NPP and heterotrophic respiration [16]. NPP and respiration values were transformed into the same unit, Mg CO2 ha−1 yr−1, then NEP was calculated by subtracting the heterotrophic respiration value to the NPP. It should be noted that this study did not measure carbon fluxes in the form of methane, aquatic components, and respiration from big woody debris. Thus, the NEP value in this study only represents a part of the total NEP from those studied land use and cover types.

2.4. Soil Parameters

Environmental factors were measured during soil respiration measurements. Water table depth was measured in 6 water wells at each site. The wells were perforated PVC tubes (10 cm diameter) and inserted to depths of 2 m into the peat. The water level was measured once a month, at the same time as CO2 flux measurements. Soil temperature at 10 cm depth was measured using a temperature probe sensor in soils adjacent to the CO2 flux measurement points (i.e., 24 points per site).

2.5. Statistical Analyses

Data distribution among land uses, seasonal rainfall, biomass sources, and primary production sources were tested for their normality using Saphiro-Wilks and Kolmogorov-Smirnov tests. When the data were normally distributed, mean values of CO2 flux and NEP among land cover types were tested for their differences with analysis of variance (ANOVA). A least significant difference (LSD) test was performed to determine which means were significantly different during ANOVA. When non-normally distributed data were found, the Kruskal-Wallis H test was used. Diameter at breast height data of 120 forest trees was used to model tree growth (biomass gain) using regression analyses. Statistical analyses were conducted using IBM SPSS software version 20.

3. Results

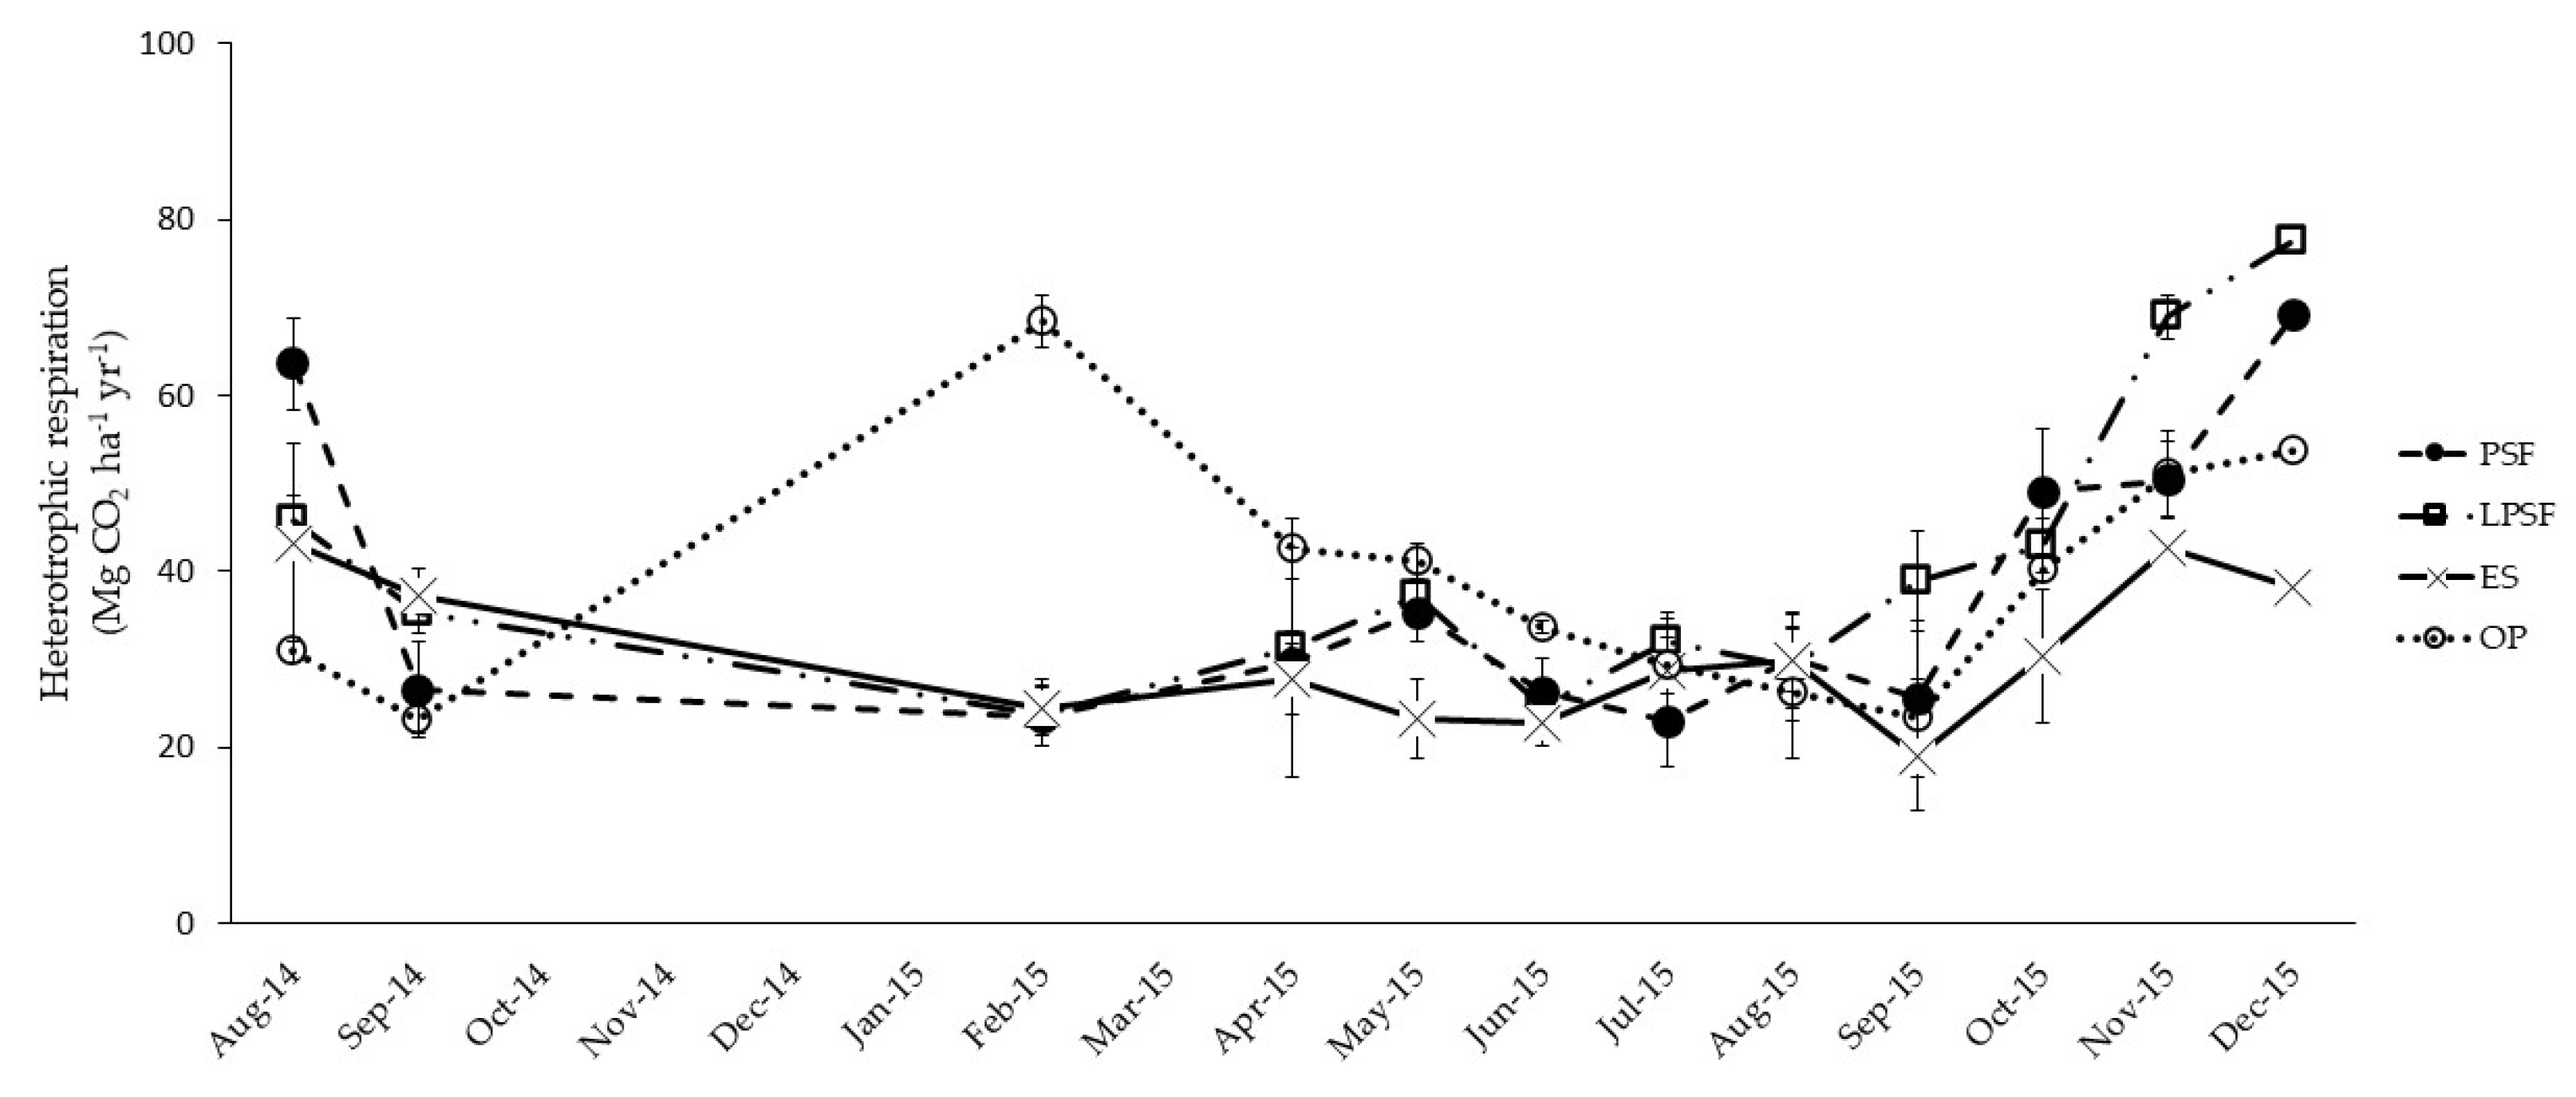
3.1. Annual Ecosystem Respiration

Heterotrophic respiration was significantly different among the land cover types. It was lower in ES sites than in LPSF sites by 10 Mg CO2 ha−1 yr−1 and lower than in OP sites by 8 Mg CO2 ha−1 yr−1 (p < 0.05) (Table 2 and Figure 3). Similarly, total soil respiration in ES (40.8 Mg CO2 ha−1 yr−1) was significantly lower (p < 0.05) than in PSF (48.5 Mg CO2 ha−1 yr−1), LPSF (50.2 Mg CO2 ha−1 yr−1), and OP (47.5 Mg CO2 ha−1 yr−1). All land cover types were similar in their autotrophic respiration, ranging from 9.3 to 10.8 Mg CO2 ha−1 yr−1. In addition, we found a very weak effect of environmental factors such as soil temperature and groundwater level (r2 = 0.05) on respiration (heterotrophic and total soil).
Autotrophic respiration during wet months (4.7 and 3.2 Mg CO2 ha−1 yr−1) was significantly lower (p < 0.05) than dry months (16.3 and 17.8 Mg CO2 ha−1 yr−1) in LPSF and OP, respectively (Table 3). In contrast, heterotrophic respiration during wet months (45.7 Mg CO2 ha−1 yr−1) was significantly higher than in dry months (28.8 Mg CO2 ha−1 yr−1) in the oil palm estates (p = 0.001).
During wet months, total soil respiration in oil palm estates was the highest among land cover types (48.9 Mg CO2 ha−1 yr−1). In this period, the heterotrophic respiration in PSF (36.7 Mg CO2 ha−1 yr−1) was significantly lower than OP (45.7 Mg CO2 ha−1 yr−1; p < 0.01). The total and heterotrophic respiration of ES (38.8 and 29.7 Mg CO2 ha−1 yr−1) were also significantly lower than OP (48.9 and 45.7 Mg CO2 ha−1 yr−1; p < 0.05).
During dry months, total soil respiration in forests ranged from 53.4 to 54.7 Mg CO2 ha−1 yr−1 and was higher than in non-forest sites that ranged from 43.5 to 45.5 Mg CO2 ha−1 yr−1. In this period, heterotrophic respiration of OP (28.8 Mg CO2 ha−1 yr−1) was lower than LPSF (38.4 Mg CO2 ha−1 yr−1; p = 0.006) and PSF (39.0 Mg CO2 ha−1 yr−1; p = 0.09).

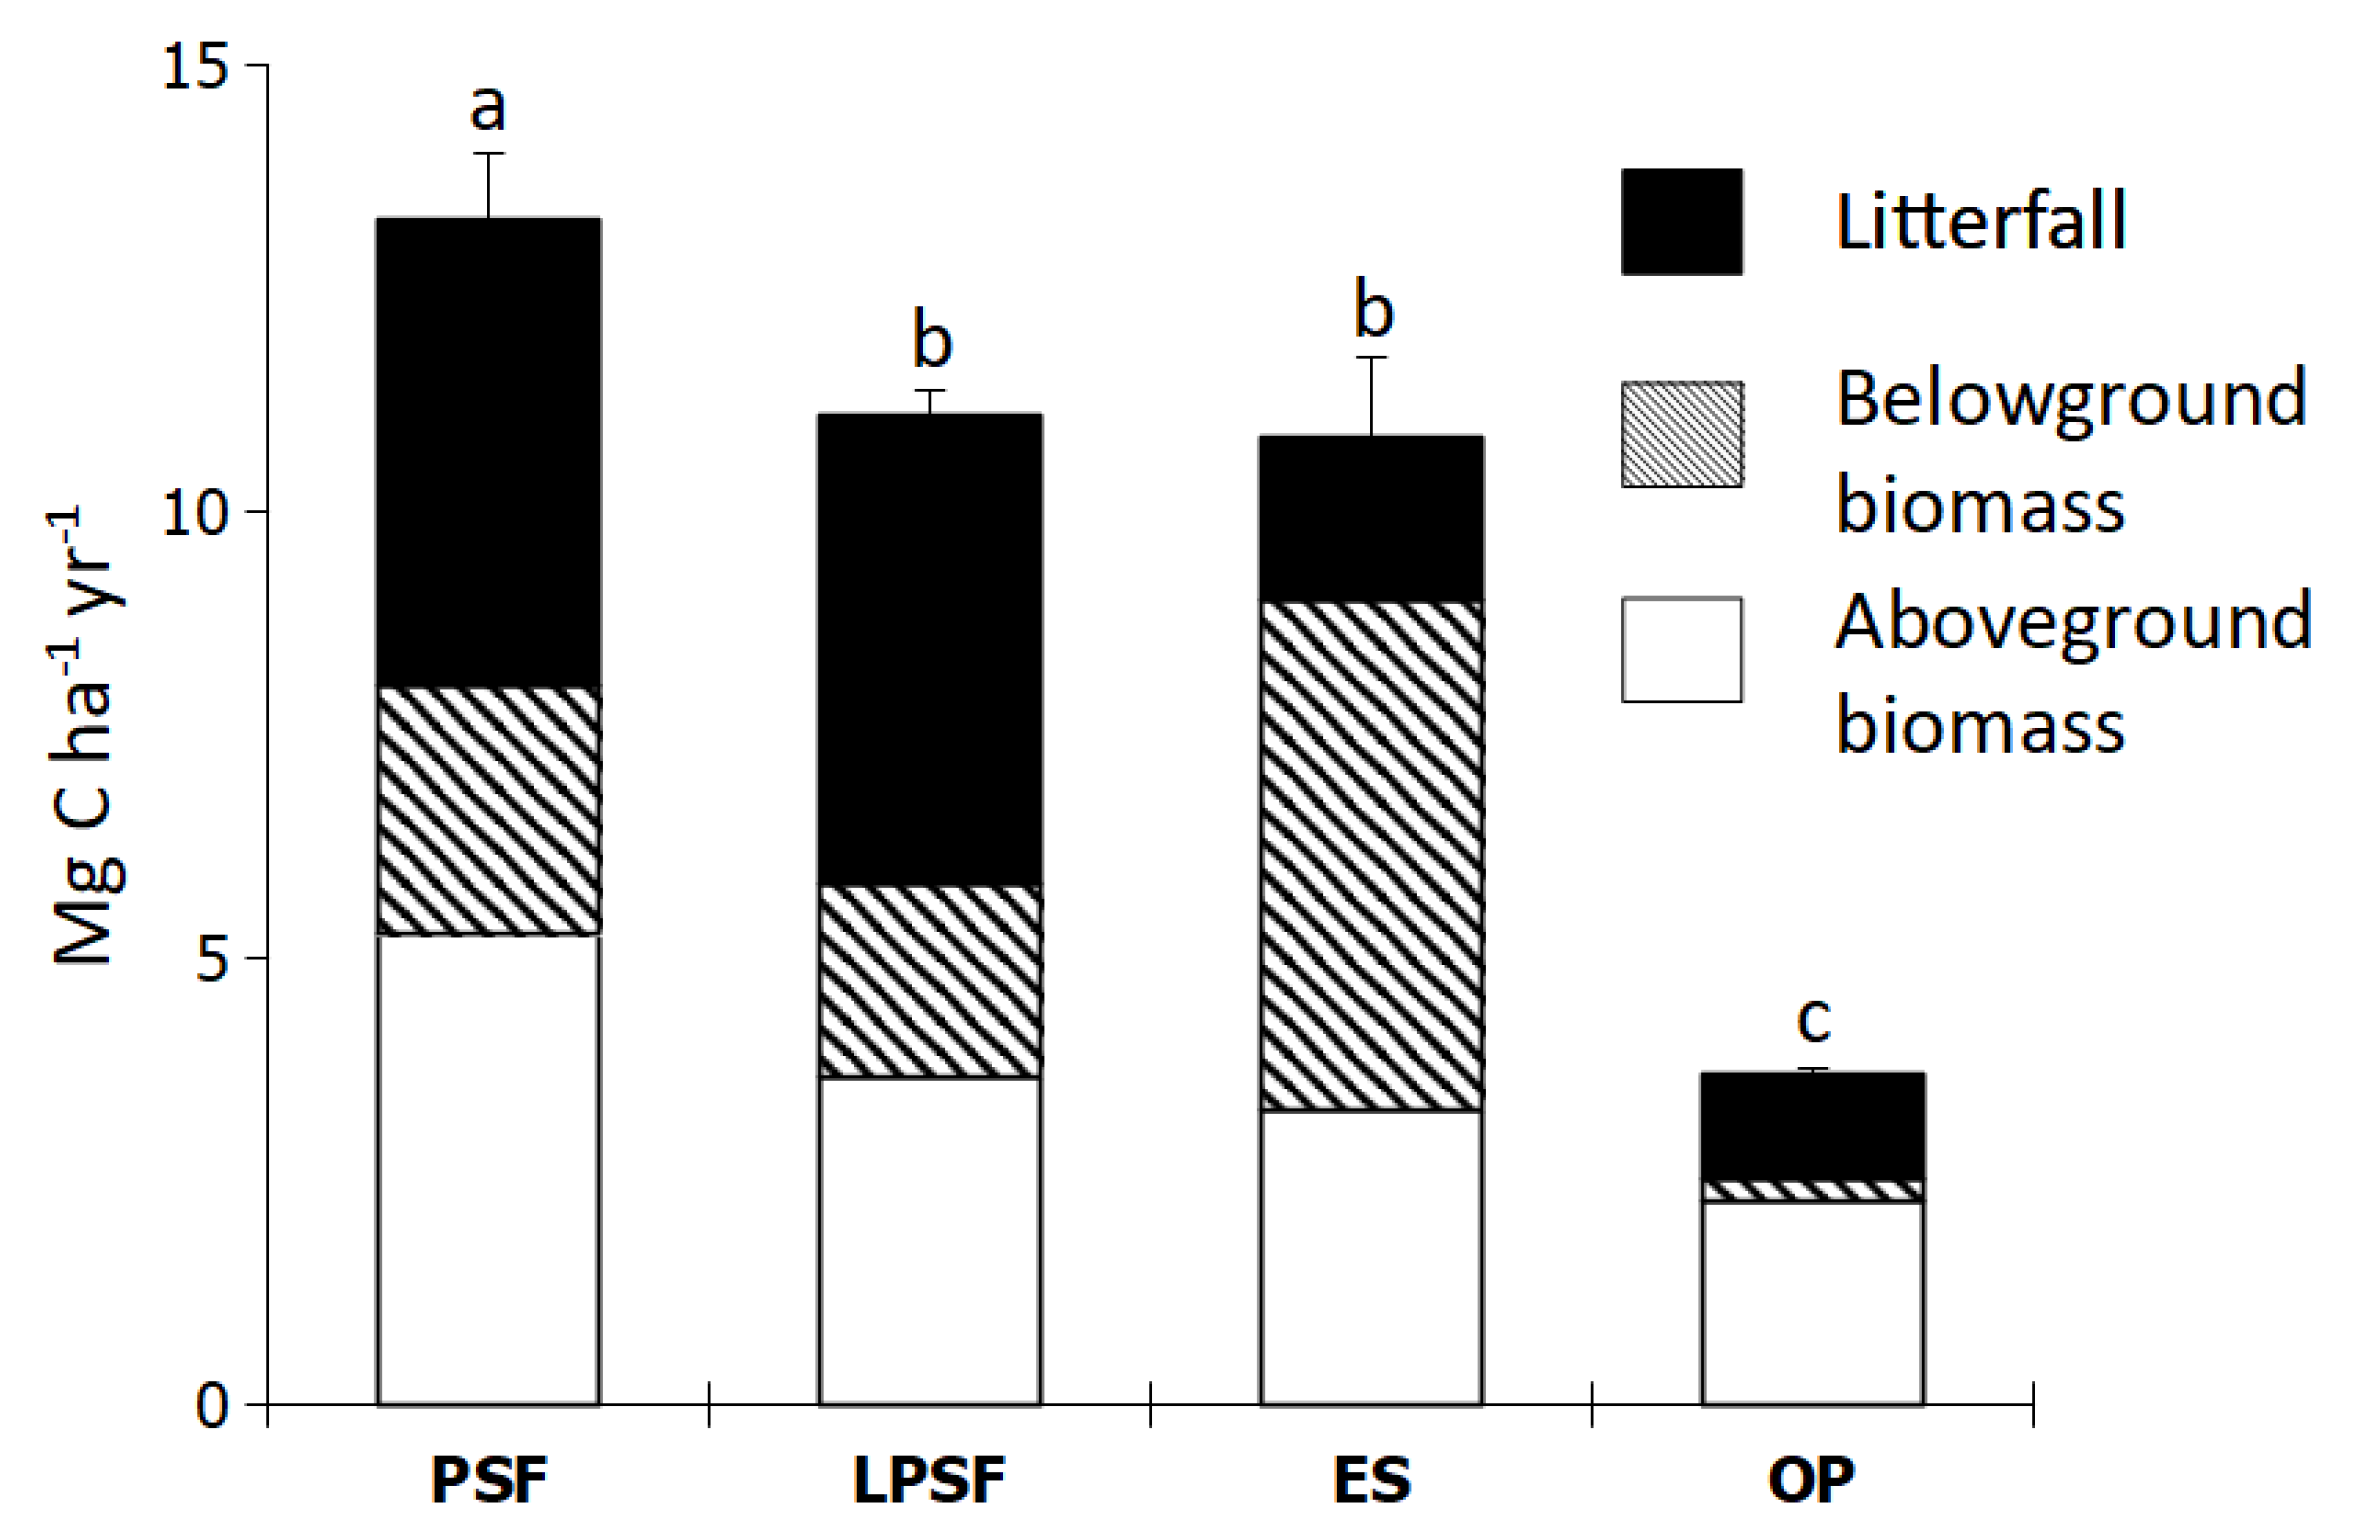
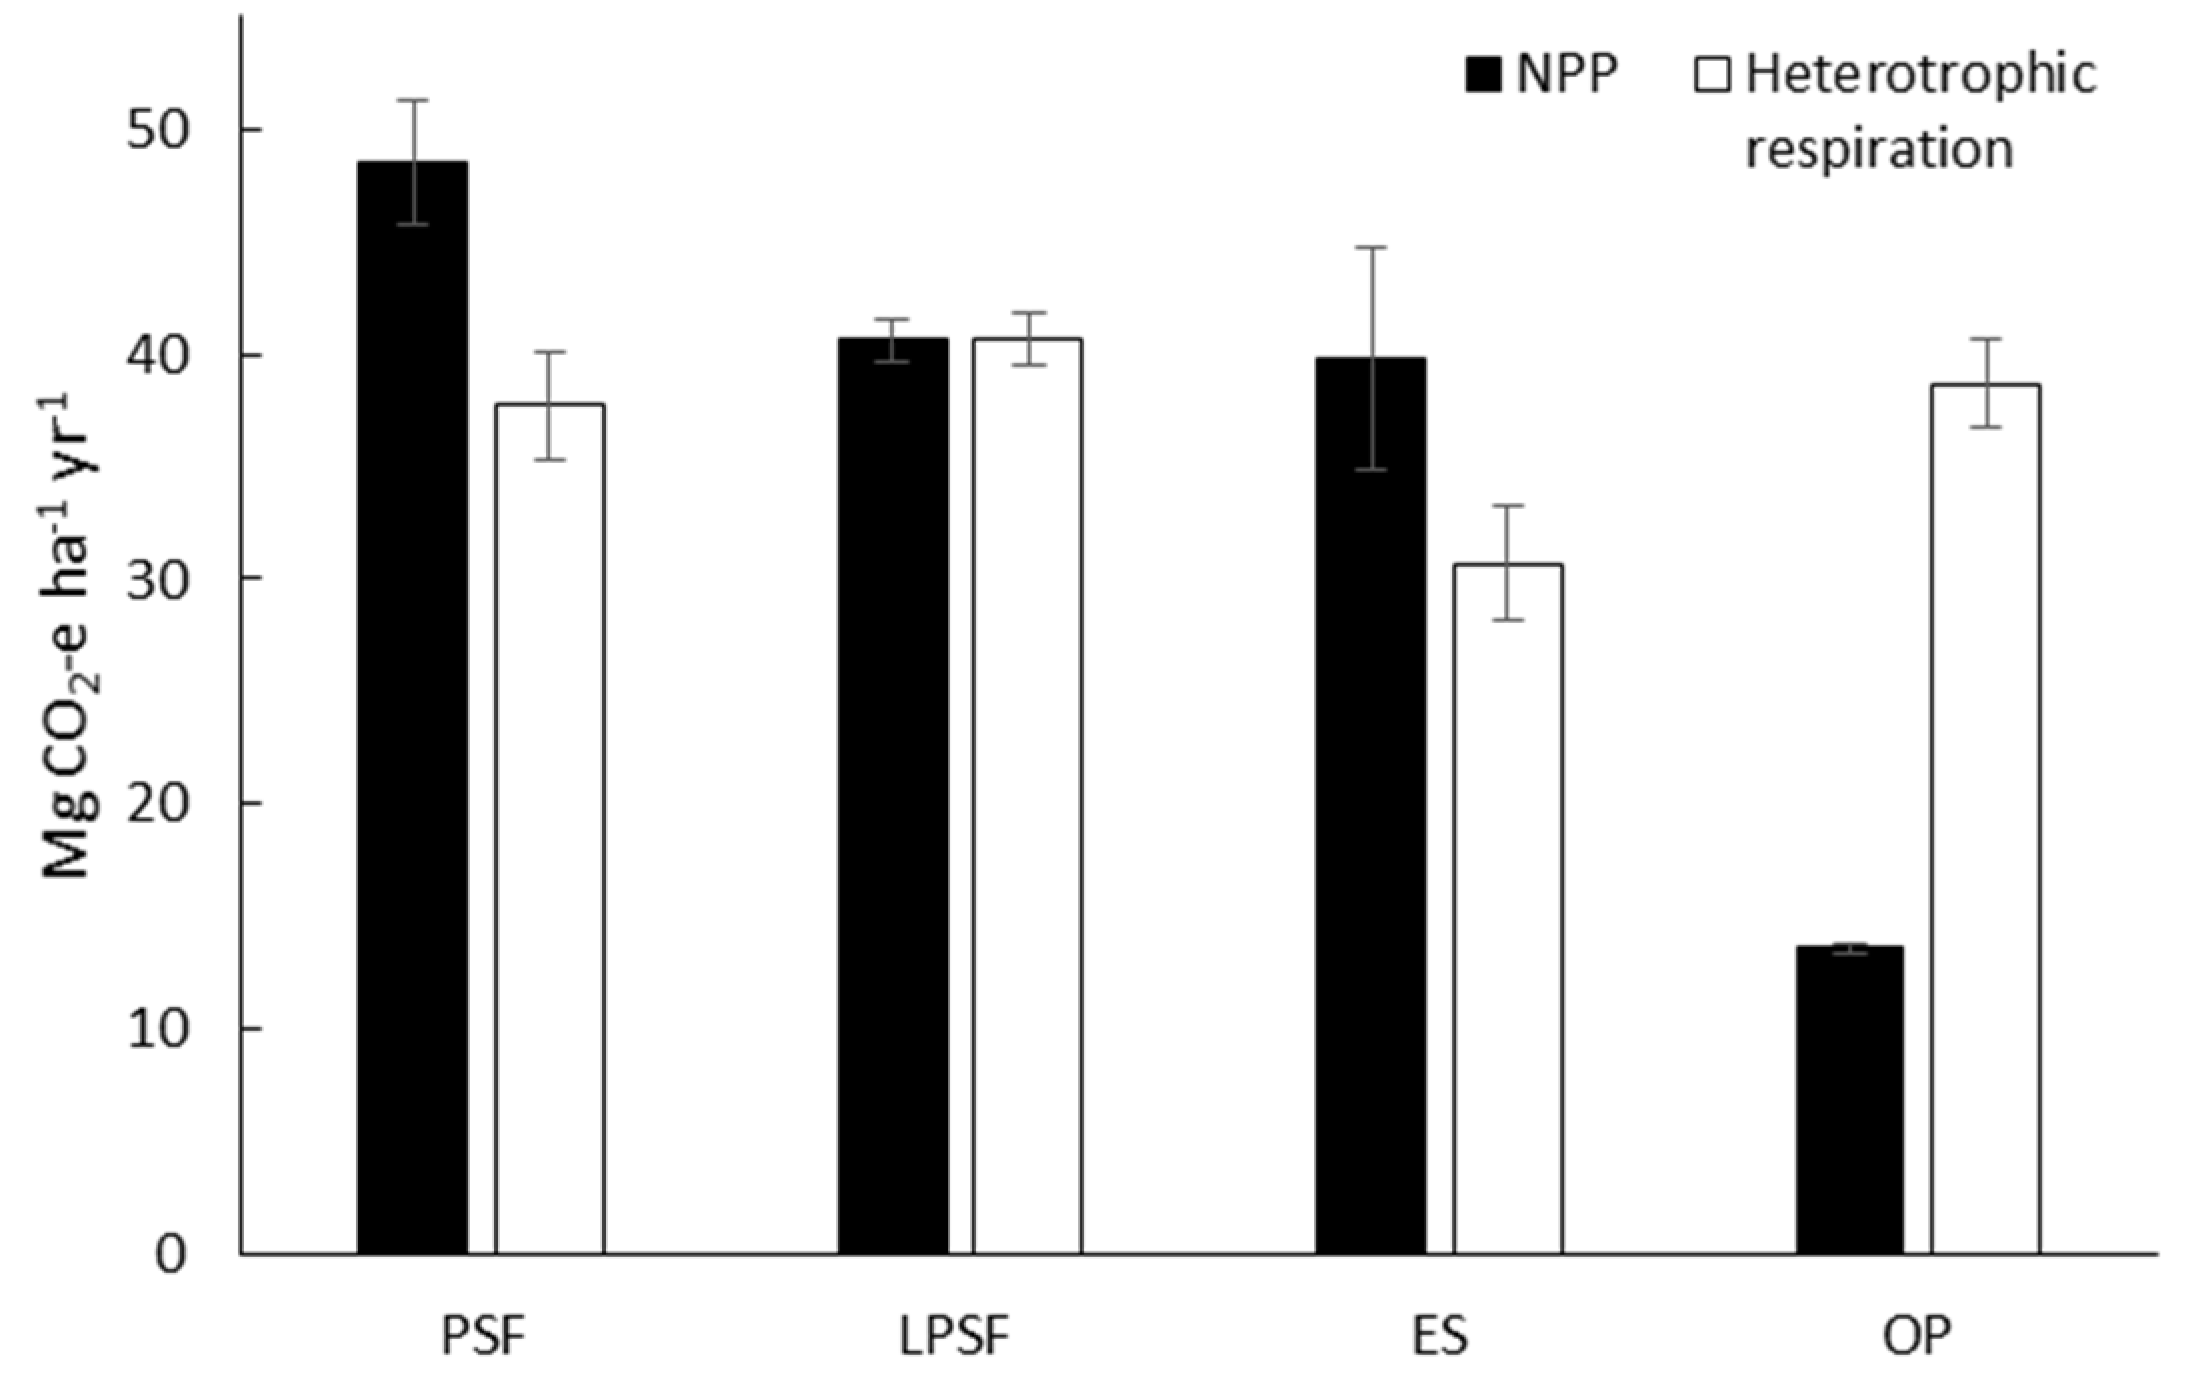
3.2. Net Primary Production in Intact and Logged Peat Swamp Forests

The NPP of intact peat forests (13.2 Mg C ha−1 yr−1) was significantly greater than any other cover type (p = 0.05; [23]). The ecosystem NPP of LPSF was 11.1 Mg C ha−1 yr−1, compared to 10.8 Mg C ha−1 yr−1 for ES and 3.7 Mg C ha−1 yr−1 for OP (Figure 4).

3.3. Net Ecosystem Production

The mean NEP of intact forests was 10.8 Mg CO2 ha−1 yr−1 (2.94 Mg C ha−1 yr−1). In contrast, oil palm estates were significant sources of greenhouse gas emissions. The NEP of oil palm was −25.1 Mg CO2 ha−1 yr−1 (−6.85 Mg C ha−1 yr−1). Logged forests were also sources of greenhouse gas emissions with a slightly negative NEP (−0.1 Mg CO2 ha−1 yr−1). The difference in NEP between intact forest and oil palm was 35.9 Mg CO2 ha−1 yr−1, and between intact and logged forest was 10.9 Mg CO2 ha−1 yr−1.
The NEP of logged forests and oil palm estates was significantly lower than PSF (Table 4) (p = 0.056 and 0.001), but not ES (p = 0.8). NEP was significantly correlated with the NPP (r = 0.95), but not with the heterotrophic respiration (r = 0.08; Figure 5).

3.4. Soil Parameters

Depth to the water table and soil temperatures varied between land cover types (Table 5). There was a lower water table at the OP sites than others, likely due to trenching and canals nearby. The mean annual water table depth in OP was 78.3 cm in contrast to the <50 cm depth for the water levels in other cover types (PSF, LPSF, and ES). The seasonal differences in water table depth in OP between dry season (August to October) and wet season (November to July) were lower than other ecosystems (p < 0.05).
The OP and ES sites were open and had limited shade; thus, more sunlight reached the peat soil surface. The mean soil temperature on these two ecosystems was 30.5 °C and 29.5 °C, respectively, and higher than the soil temperature at PSF and LPSF (27.2 °C and 27.0 °C, respectively). Seasonal differences in soil temperature in ES between the dry and wet seasons were significantly higher than in other ecosystems (p < 0.05).

4. Discussion

4.1. How Land Use Change Affects Soil Respiration in Tropical Peatland Ecosystems

Total soil respiration in the different peatland cover types ranged from 40 to 50 Mg CO2 ha−1 yr−1, and heterotrophic respiration ranged from 31 to 41 Mg CO2 ha−1 yr−1 (Table 1). Similar total soil and heterotrophic respiration were measured in the intact forests, logged forests, and oil palm estates (p > 0.05). However, significantly lower total soil and heterotrophic respiration were found in early seral than intact forests (p < 0.05). We suspect that the lower heterotrophic respiration in early seral sites may be due to the loss of significant soil microbial populations and the decline of labile - non-recalcitrant forms of organic carbon as a result of repeated fires and losses of dissolved organic carbon in early seral ecosystems [42].
Soil respiration (48.5 Mg CO2 ha−1 yr−1) of the intact forests in this study was similar to that reported in a review of South East Asia peatlands [43] but slightly lower than studies from Sumatera, Indonesia (59 Mg CO2 ha−1 yr−1; [25]), South Kalimantan, Indonesia (55 Mg CO2 ha−1 yr−1; [21]) and Sarawak, Malaysia (77 Mg CO2 ha−1 yr−1; [24]). The total soil respiration of logged forest (50.2 Mg CO2 ha−1 yr−1) in our study area was much lower than those reported from a logged forest in Sumatera (68 Mg CO2 ha−1 yr−1; [25]). The differences in soil respiration in these logged forests may vary in the definition of logged forests. In this study, logged forests were only partially logged by local communities (often for domestic uses) and impacted by a 3-m wide and 2-m deep canal to the north (>0.5 km in the distance) and an 8-m wide and 1-m deep canal to the east (4.5 km in the distance). In contrast, other studies measured respiration where drainage canals are denser, and the entire large overstory had been removed.
Soil respiration in our early seral sites (30 Mg CO2 ha−1 yr−1) was also lower than bare land sites in Sumatera (60 Mg CO2 ha−1 yr−1; [44]). Similarly, our soil respiration in the sampled oil palm estates (47.5 Mg CO2 ha−1 yr−1) was lower than studies in Sarawak, Malaysia (55 Mg CO2 ha−1 yr−1; [24]) and Sumatera, Indonesia (104 Mg CO2 ha−1 yr−1; [25]). However, the value was similar to a study in Kalimantan, Indonesia (44 Mg CO2 ha−1 yr−1; [21]). Those differences may have been affected by the use of different methodologies in measuring the soil respiration (portable EGM vs. gas sampling), as well as the inherent differences in land use, peat-soil characteristics [45,46] latitude, and groundwater table [47]. These results suggest that soil respiration of tropical peat forests is highly variable, site-specific, and likely high in annual variation [48].
In comparison with other ecosystems, heterotrophic respiration of intact peat forest in this study was lower than upland tropical rain forests (138 Mg CO2 ha−1 yr−1; [17]), logged peat forests in Jambi (68 Mg CO2 ha−1 yr−1; [25]), and oil palm estate in Jambi (104 Mg CO2 ha−1 yr−1; [25]) and Sarawak (55 Mg CO2 ha−1 yr−1; [24]). Heterotrophic respiration in peat forests was also higher than other wetlands such as mangrove forests in Australia (20 Mg CO2 ha−1 yr−1; [49]) and Thailand (8 Mg CO2 ha−1 yr−1; [17,50]).
The land cover type had no impact on heterotrophic respiration in tropical peat forests landscapes [21,47]. However, other studies have found that land cover change in tropical peat forests decreases [24] or increases heterotrophic respiration [25]. Rather than affecting heterotrophic respiration, we found that land-use change affects carbon dynamics principally through decreased carbon sequestration rates (NPP).

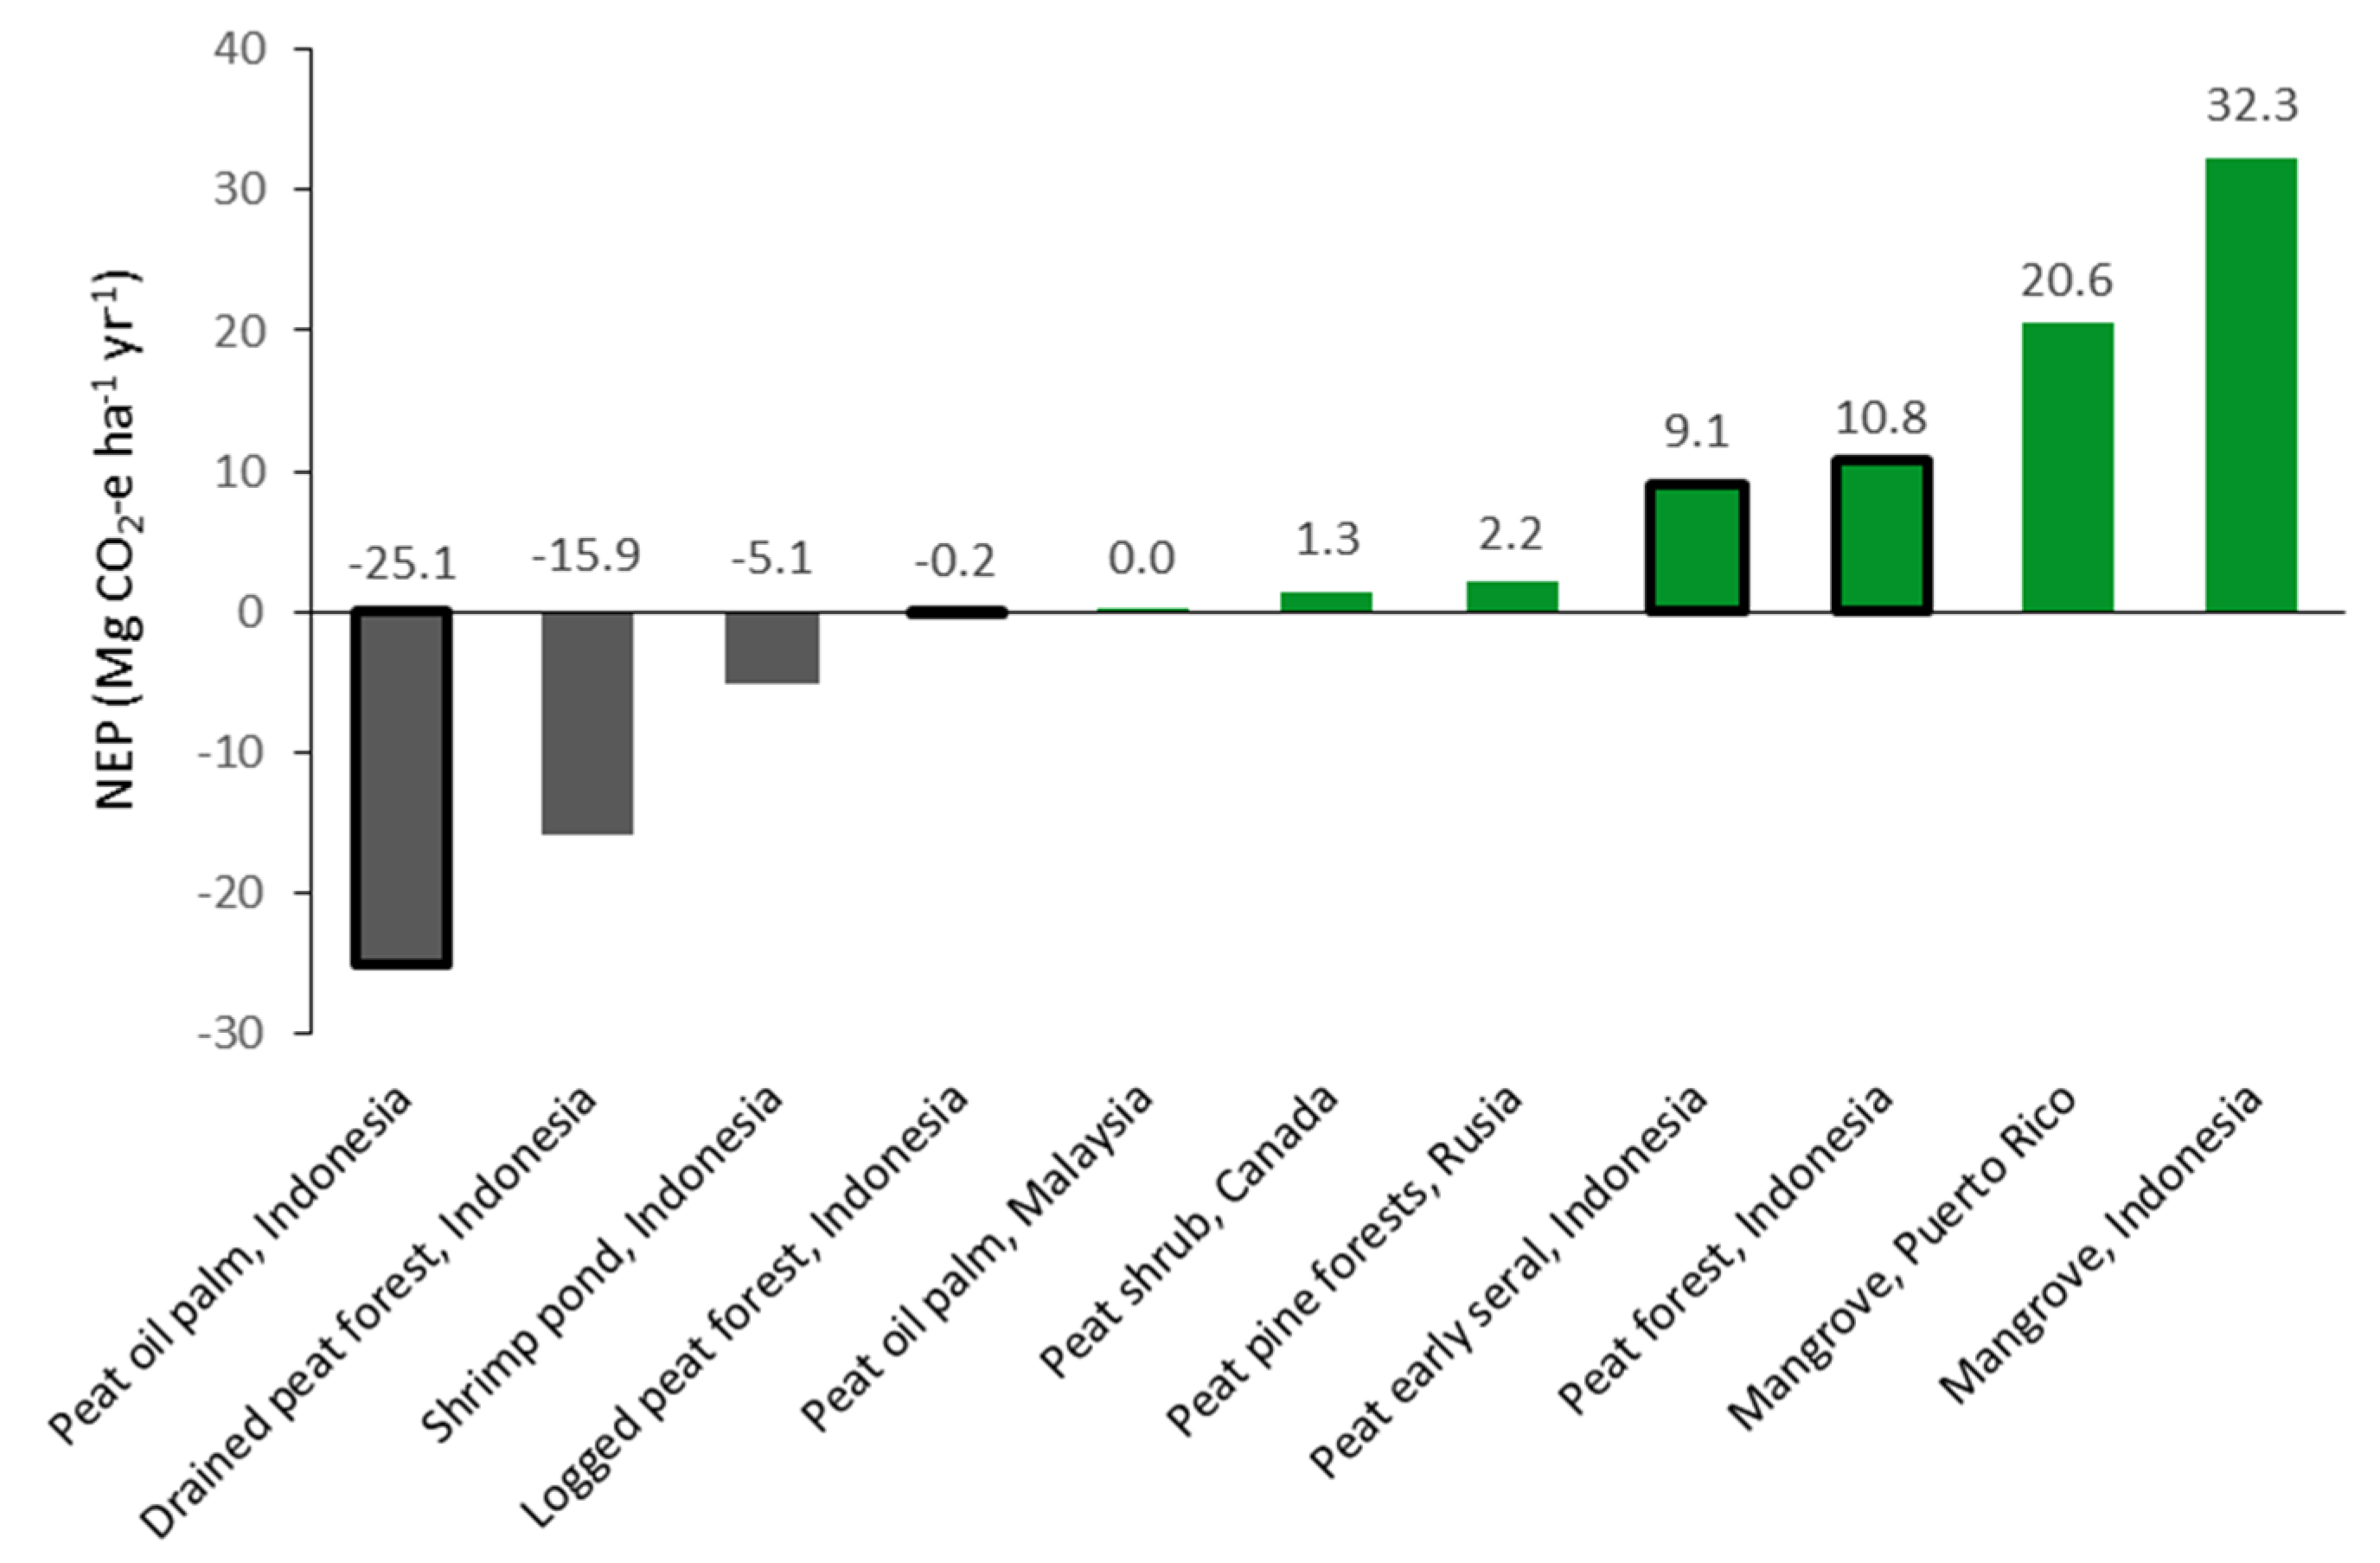
4.2. Effect of Land Use Change on Net Ecosystem Production

The relatively high NEP in the ES sites was related to lower heterotrophic respiration coupled with a relatively high belowground NPP (Table 4). We estimated the carbon losses from peat forest conversion to early seral may reach an estimated 4259 Mg CO2 e ha−1 over 25 years, which includes incidences of numerous peat fires [4]. Combining these data, early seral sites are significant net sources of greenhouse gasses (120 Mg CO2 e ha−1 yr−1).
Compared to other wetlands, the NEP of peat forests in this study was lower than that of tropical mangroves [50,51,52,53] but higher than the Siberian peat forests [54] (Figure 6). The high NEP of mangrove ecosystems has been attributed to its high NPP due to its nutrient-rich ecosystem and low heterotrophic respiration due to saturated soil within a tidal environment [17,53]. The low NEP of Siberian peat forests has been attributed to a limited growing season [55]. These findings are similar to our conclusion that the rate of NPP is the primary driver of NEP and that the changes in land use affect NPP to a greater extent than respiration.
In contrast with the NEP reported for peat oil palm estates in Malaysia [56], we found that oil palm estates of our study sites are significant sources of greenhouse gases NEP = −25.1 Mg CO2 e ha−1 yr−1). The palm estates of our study had a lower annual NPP (13.6 Mg CO2 e ha−1 yr−1) than that reported in [56] (44 Mg CO2 e ha−1 yr−1). This difference may be due to methodological differences.
We estimated that land cover change in peat forest landscapes to logged forests, early seral sites, and oil palm estates result in net emissions of about 10.9, 1.7, and 35.9 Mg CO2 e ha−1 yr−1, respectively. These results are lower than current IPCC default values for emission from drained peat on forest land, grassland, and oil palm estate (19.4, 35.2, and 36.7 Mg CO2 ha−1 yr−1) [57]. However, these differences are likely related to different methodologies since our NEP includes peat decomposition (respiration) and NPP. The IPCC values represent either historical (peat subsidence approach) or present (CO2 fluxes) sources, excluding peat fires’ impacts [57].

4.3. Implications for Tropical Peatland Management

Tropical peat swamp forests sequester carbon because their high annual NPP exceeds their respiration rates. Degradation and conversion (land-use changes) of peat swamp forests significantly affected NPP. [10] stated that tropical peatland landscapes in Indonesia are now net sources of carbon as there is four times more degraded peat forest than the intact forest. Intact peat swamp forests now only comprise <7% of all peatland areas in Indonesia’s main islands [7].
In 2015 there were more than three million hectares of oil palm estates and almost one million hectares of degraded grasslands/early seral (ES) in South East Asia [7]. Using our estimates of oil palm’s NEP (−25.1 Mg CO2 ha−1 yr−1), the 3 million ha of oil palm will emit significant amounts of CO2 into the atmosphere, as much as 75 Tg CO2 yr−1. In addition, our results from the NEP of early seral sites (9.1 Mg CO2 ha−1 yr−1) suggest that allowing grasses and ferns to regrow and cover the peat surface under 3 million ha of OP trees could reduce the emissions by about 27 Tg CO2 yr−1.
Most ignitions in peatland landscapes are from humans and in contrast to early seral sites and logged forests, rarely are fuels dry enough to burn in natural forests [60]. However, our results show that land-use change significantly lowered the water table and increased soil temperatures, thus increasing fire susceptibility [61]. Fire is a significant threat to the production of peatland ecosystems. A single event of uncontrolled peat fire may emit as much as 416 Mg CO2 ha−1 [62]. This is a value equivalent to the NEP of peat forests for almost four decades.
Logging and conversion to early seral communities and oil palm estate reduce potential carbon sequestration by 10.9, 1.7, and 35.9 Mg CO2 ha−1 yr−1, respectively. These are the differences in NEP between intact peat forest (10.8 Mg CO2 ha−1 yr−1) and each of logged peat forest (−0.1 Mg CO2 ha−1 yr−1), early seral (9.1 Mg CO2 ha−1 yr−1), and oil palm (−25.1 Mg CO2 ha−1 yr−1). Logging and conversion of peat swamp forests have shifted the ecosystem from a carbon sink to a carbon emitter. The large carbon stocks and emissions arising from the land cover change in tropical peat forests and other ecosystem services of intact peat forests suggest that their conservation and restoration are of local and global importance for mitigating climate change.

Author Contributions

Conceptualization, J.B.K., D.M., G.Z.A. and I.B.; methodology, J.B.K., D.M., I.B.; software, I.B.; validation, J.B.K., D.M., G.Z.A., J.T.P. and I.B. (all authors); formal analysis, I.B., J.B.K.; investigation, I.B., J.B.K.; resources, J.B.K.; data curation, I.B., J.B.K.; writing—original draft preparation, I.B.; writing—review and editing, all authors; visualization, I.B.; supervision, J.B.K., D.M., G.Z.A.; project administration, J.B.K.; funding acquisition, J.B.K. All authors have read and agreed to the published version of the manuscript.

Funding

This research was funded by the United States Agency for International Development (USAID).

Data Availability Statement

The data presented in this study are available on request from the corresponding author.

Acknowledgments

This study was part of the Kalimantan Wetlands Climate Change Study (KWACS) funded by the United States Agency for International Development (USAID). We wish to thank Randi Ade Candra, Samsudin, and the community of Sungai Pelang village for their assistance in the field, as well as Yudi Almanggari, M. Agus Salim, Rahayu Subekti, Beni Okarda, Sigit D. Sasmito, Meli F. Saragih and Erwin Tumengkol for their advice on spatial and statistical data. We also wish to thank Flora Fauna Indonesia, the United State Agency International Development—Indonesia Forest and Climate Support (USAID—IFAC), Yayasan Palung, and International Animal Rescue for their collaboration during the field research. We are grateful for the work of Iswandi Anas and Asih Karyati of Bogor Agricultural University’s Biotechnology Laboratory, who conducted the carbon analysis.

Conflicts of Interest

The authors declare no conflict of interest. The funders had no role in the study’s design, in the collection, analyses, or interpretation of data, in the writing of the manuscript, or in the decision to publish the results.

References

  1. Murdiyarso, D.; Hergoualćh, K.; Verchot, L.V. Opportunities for reducing greenhouse gas emissions in tropical peatlands. Proc. Natl. Acad. Sci. USA 2010, 107, 19655–19660. [Google Scholar] [CrossRef] [PubMed] [Green Version]
  2. Anda, M.; Ritung, S.; Suryani, E.; Hikmat, M.; Yatno, E.; Mulyani, A.; Subandiono, R.E. Revisiting tropical peatlands in Indonesia: Semi-detailed mapping, extent, and depth distribution assessment. Geoderma 2021, 402, 115235. [Google Scholar] [CrossRef]
  3. Hairiah, K.; Sitompul, S.M.; van Noordwijk, M.; Palm, C. Carbon Stocks of Tropical Land Use Systems as Part of the Global C Balance. Effects of Forest Conversion and Options for Clean Development Activities; International Centre for Research in Agroforestry, ICRAF: Bogor, Indonesia, 2001. [Google Scholar]
  4. Basuki, I.; Kauffman, J.B.; Murdiyarso, D.; Anshari, G. Carbon Stocks and Emissions from Degradation and Conversion of Tropical Peat Swamp Forests in West Kalimantan, Indonesia. In Proceedings of the 15th International Peat Congress, Kuching, Malaysia, 15–19 August 2016. [Google Scholar]
  5. Murdiyarso, D.; Donato, D.; Kauffman, J.B.; Kurnianto, S.; Stidham, M.; Kanninen, M. Carbon Storage in Mangrove and Peatland Ecosystems. A Preliminary Account from Plots in Indonesia; CIFOR: Bogor, Indonesia, 2009. [Google Scholar]
  6. Koh, L.P.; Miettinen, J.; Liew, S.C.; Ghazoul, J. Remotely sensed evidence of tropical peatland conversion to oil palm. Proc. Natl. Acad. Sci. USA 2011, 108, 5127–5132. [Google Scholar] [CrossRef] [PubMed] [Green Version]
  7. Miettinen, J.; Shi, C.; Liew, S.C. Land cover distribution in the peatlands of Peninsular Malaysia, Sumatera and Borneo in 2015 with changes since 1990. Glob. Ecol. Conserv. 2016, 6, 67–78. [Google Scholar] [CrossRef] [Green Version]
  8. Page, S.E.; Morrison, R.; Malins, C.; Hooijer, A.; Rieley, J.O.; Jauhiainen, J. Review of Peat Surface Greenhouse Gas Emissions from Oil Palm Estates in Southeast Asia; International Council on Clean Transportation: Washington, DC, USA, 2011. [Google Scholar]
  9. Verwer, C.; Van Der Meer, P. Carbon Pools in Tropical Peat Forest—Towards a Reference Value for Forest Biomass Carbon in Relatively Undisturbed Peat Swamp Forests in Southeast Asia; Alterra Wageningen, UR: Wageningen, The Netherlands, 2010. [Google Scholar]
  10. Dommain, R.; Couwenberg, J.; Glaser, P.H.; Joosten, H.; Suryadiputra, I.N.N. Carbon storage and release in Indonesian peatlands since the last deglaciation. Quat. Sci. Rev. 2014, 97, 1–32. [Google Scholar] [CrossRef]
  11. Anshari, G. Circularity and Singularity of Tropical Peat Swamp Forest Ecosystems. In Tropical Peatland Eco Management; Osaki, M., Tsuji, N., Foead, N., Eds.; Springer: Tokyo, Japan, 2021; pp. 463–475. [Google Scholar]
  12. Wösten, J.H.M.; Clymans, E.; Page, S.E.; Rieley, J.O.; Limin, S.H. Peat–water interrelationships in a tropical peatland ecosystem in Southeast Asia. Catena 2008, 73, 212–224. [Google Scholar] [CrossRef]
  13. Hooijer, A.; Page, S.; Jauhiainen, J.; Lee, W.A.; Lu, X.X.; Idris, A.; Anshari, G. Subsidence and carbon loss in drained tropical peatlands. Biogeosciences 2012, 9, 1053–1071. [Google Scholar] [CrossRef] [Green Version]
  14. Page, S.E.; Siegert, F.; Rieley, J.O.; Boehm, H.D.V.; Jaya, A.; Limin, S. The amount of carbon released from peat and forest fires in Indonesia during 1997. Nature 2002, 420, 61–65. [Google Scholar] [CrossRef]
  15. Basuki, I. Carbon Dynamics in Response to Land Cover Change in Tropical Peatlands, Kalimantan, Indonesia. Ph.D. Thesis, Oregon State University, Oregon, USA, 17 June 2017. [Google Scholar]
  16. Chapin, F.S.; Woodwell, G.M.; Randerson, J.T.; Rastetter, E.B.; Lovett, G.M.; Baldocchi, D.D.; Clark, D.A.; Harmon, M.E.; Schimel, D.S.; Valentini, R.; et al. Reconciling carbon-cycle concepts, terminology, and methods. Ecosystems 2006, 9, 1041–1050. [Google Scholar] [CrossRef] [Green Version]
  17. Komiyama, A.; Ong, J.E.; Poungparn, S. Allometry, biomass, and production of mangrove forests: A review. Aquat. Bot. 2008, 89, 128–137. [Google Scholar] [CrossRef]
  18. Clark, D.A.; Brown, S. Net primary production in tropical forests: An evaluation and synthesis of existing field data. Ecol. Appl. 2001, 11, 371–384. [Google Scholar] [CrossRef]
  19. Randerson, J.T.; Chapin, F.S., III; Harden, J.W.; Neff, J.C.; Harmon, M.E. Net ecosystem production: A comprehensive measure of net carbon accumulation by ecosystems. Ecol. Appl. 2002, 12, 937–947. [Google Scholar] [CrossRef]
  20. Woodwell, G.M.; Whittaker, R.H. Primary production in terrestrial ecosystems. Am. Zool. 1968, 8, 19–30. [Google Scholar] [CrossRef]
  21. Novita, N. Carbon Stocks and Soil Greenhouse Gas Emissions Associated with Forest Conversion to Oil Palm Estates in Tanjung Puting Tropical Peatlands, Indonesia. Ph.D. Thesis, Oregon State University, Corvallis, OR, USA, 2016. [Google Scholar]
  22. Chimner, R.A.; Ewel, K.C. A tropical freshwater wetland: II. Production, decomposition, and peat formation. Wetl. Ecol. Manag. 2005, 13, 671–684. [Google Scholar] [CrossRef]
  23. Basuki, I.; Kauffman, J.B.; Peterson, J.; Anshari, G.; Murdiyarso, D. Land cover changes reduce net primary production in tropical coastal peatlands of West Kalimantan, Indonesia. Mitig. Adapt. Strateg. Glob. Chang. 2019, 24, 557–573. [Google Scholar] [CrossRef] [Green Version]
  24. Melling, L.; Hatano, R.; Goh, K.J. Soil CO2 flux from three ecosystems in tropical peatland of Sarawak, Malaysia. Tellus B Chem. Phys. Meteorol. 2005, 57, 1–11. [Google Scholar] [CrossRef]
  25. Comeau, L.P.; Hergoualc’h, K.; Smith, J.U.; Verchot, L. Conversion of Intact Peat Swamp Forest to Oil Palm Estate: Effects on Soil CO2 Fluxes in Jambi, Sumatera; CIFOR: Bogor, Indonesia, 2013. [Google Scholar]
  26. Prananto, J.A.; Minasny, B.; Comeau, L.P.; Grace, P. Drainage increases CO2 and N2O emissions from tropical peat soils. Glob. Chang. Biol. 2020, 26, 4583–4600. [Google Scholar] [CrossRef] [PubMed]
  27. Astiani, D. Tropical peatland tree-species diversity altered by forest degradation. Biodiversitas 2016, 17, 102–109. [Google Scholar]
  28. Rusli, N.; Majid, M.R.; Din, A.H.M. A comparative accuracy of Google Earth height with MyGeoid, EGM96 and MSL. IOP Conf. Ser. Earth Environ. Sci. 2016, 37, 012003. [Google Scholar] [CrossRef] [Green Version]
  29. Carlson, K.M. Effects of Oil Palm Estate Development on Land Cover, Carbon Flux, and Streams in Indonesian Borneo. Ph.D. Thesis, Yale University, New Haven, CT, USA, 2012. [Google Scholar]
  30. Ritung, S.; Wahyunto; Nugroho, K.; Sukarman; Hikmatullah; Suparto; Tafakresnanto, C. Peta Lahan Gambut Indonesia; Ministry of Agriculture, Balai Besar Penelitian dan Pengembangan Sumberdaya Lahan Pertanian: Bogor, Indonesia, 2011.
  31. Hoscilo, A. Fire Regime, Vegetation Dynamics and Land Cover Change in Tropical Peatland, Indonesia. Ph.D. Thesis, University of Leicester, Leicester, UK, 2009. [Google Scholar]
  32. Bond, W.J.; Keane, R.E. Fires, Ecological Effects of. Ref. Modul. Life Sci. 2017, 1–11. [Google Scholar] [CrossRef]
  33. Hanson, P.J.; Edwards, N.T.; Garten, C.T.; Andrews, J.A. Separating root and soil microbial contributions to soil respiration: A review of methods and observations. Biogeochemistry 2000, 48, 115–146. [Google Scholar] [CrossRef]
  34. Jassal, R.S.; Black, T.A. Estimating heterotrophic and autotro-phic soil respiration using small-area trenched plot technique:theory and practice. Agric. For. Meteorol. 2006, 140, 193–202. [Google Scholar] [CrossRef]
  35. Jauhiainen, J.; Hidenori, T.; Juha, E.P.H.; Pertti, J.M.; Harri, V. Carbon fluxes from a tropical peat swamp forest floor. Glob. Chang. Biol. 2005, 11, 1788–1797. [Google Scholar] [CrossRef]
  36. Kauffman, J.B.; Virni, B.A.; Imam, B.; Sofyan, K.; Nisa, N.; Daniel, M.; Daniel, C.D.; Matthew, W.W. Protocols for the Measurement, Monitoring, and Reporting of Structure, Biomass, Carbon Stocks and Greenhouse Gas Emissions in Tropical Peat Swamp Forests; Center for International Forestry Research: Bogor, Indonesia, 2016. [Google Scholar]
  37. Moser, G.; Bernhard, S.; Dietrich, H.; Viviana, H.; Heinz, C.; Henry, B.; Christoph, L. Replicated throughfall exclusion experiment in an Indonesian perhumid rainforest: Wood production, litter fall and fine root growth under simulated drought. Glob. Chang. Biol. 2014, 20, 1481–1497. [Google Scholar] [CrossRef] [PubMed]
  38. Mokany, K.; Raison, R.; Prokushkin, A. Critical analysis of root: Shoot ratios in terrestrial biomes. Glob. Chang. Biol. 2006, 12, 84–96. [Google Scholar] [CrossRef]
  39. Dewi, S.; Khasanah, N.; Rahayu, S.; Ekadinata, A.; van Noordwijk, M. Carbon Footprint of Indonesian Palm Oil Production: A Pilot Study; World Agroforestry Center: Bogor, Indonesia, 2010; Available online: http://www.worldagroforestry.org/sea/Publications/files/poster/PO0236-10.PDF (accessed on 5 November 2021).
  40. Henson, I.E.; Dolmat, M.T. Physiological analysis of an oil palm density trial on a peat soil. J. Oil Palm. Res. 2003, 15, 1–27. [Google Scholar]
  41. Scurlock, J.; Olson, R. NPP Multi-Biome: Grassland, Boreal Forest, and Tropical Forest Sites, 1939–1996, [Revision] 1. Dataset, 2012. From Oak Ridge National Laboratory Distributed Active Archive Center, Oak Ridge, Tennessee. Available online: https://daac.ornl.gov/cgi-bin/dsviewer.pl?ds_id=653 (accessed on 5 November 2021).
  42. Hirano, T.; Kusin, K.; Limin, S.; Osaki, M. Carbon dioxide emissions through oxidative peat decomposition on a burnt tropical peatland. Glob. Chang. Biol. 2014, 20, 555–565. [Google Scholar] [CrossRef]
  43. Hergoualc’h, K.; Verchot, L.V. Stocks and fluxes of carbon associated with land use change in Southeast Asian tropical peatlands: A review. Glob. Biogeochem. Cycles 2011, 25, 1–13. [Google Scholar] [CrossRef] [Green Version]
  44. Husnain, H.; Wigena, I.G.P.; Dariah, A.; Marwanto, S.; Setyanto, P.; Agus, F. CO2 emissions from tropical drained peat in Sumatera, Indonesia. Mitig. Adapt. Strateg. Glob. Chang. 2014, 19, 845–862. [Google Scholar] [CrossRef]
  45. Zogg, G.P.; Zak, D.R.; Ringelberg, D.B.; Macdonald, N.W.; Pregitzer, K.S.; White, D.C. Compositional and Functional Shifts in Microbial Communities Due to Soil Warming. Soil Sci. Soc. Am. J. 1997, 61, 475–481. [Google Scholar] [CrossRef] [Green Version]
  46. Jaatinen, K.; Laiho, R.; Vuorenmaa, A.; Del Castillo, U.; Minkkinen, K.; Pennanen, T.; Penttilä, T.; Fritze, H. Responses of aerobic microbial communities and soil respiration to water-level drawdown in a northern boreal fen. Environ. Microbiol. 2008, 10, 339–353. [Google Scholar] [CrossRef] [PubMed]
  47. Novita, N.; Nurul, S.L.; Mega, L.; Tatang, T.; Imam, B.; Joni, J. Geographic Setting and Groundwater Table Control Carbon Emission from Indonesian Peatland: A Meta-Analysis. Forests 2021, 12, 832. [Google Scholar] [CrossRef]
  48. Valentini, R.; Matteucci, G.; Dolman, A.J.; Schulze, E.D.; Rebmann, C.; Moors, E.J.; Granier, A.; Gross, P.; Jensen, N.O.; Pilegaard, K.; et al. Respiration as the main determinant of carbon balance in European forests. Nature 2000, 404, 861–865. [Google Scholar] [CrossRef] [PubMed]
  49. Alongi, D.; Tirendi, F.; Clough, B. Belowground decomposition of organic matter in forests of the mangroves Rhizophora stylosa and Avicennia marina along the arid coast of Western Australia. Aquat. Bot. 2000, 68, 97–122. [Google Scholar] [CrossRef]
  50. Golley, F.; Odum, H.T.; Wilson, R.F. The Structure and Metabolism of a Puerto Rican Red Mangrove Forest in May. Ecology 1962, 43, 9–19. [Google Scholar] [CrossRef] [Green Version]
  51. Alongi, D.M.; Wattayakorn, G.; Pfitzner, J.; Tirendi, F.; Zagorskis, I.; Brunskill, G.J.; Davidson, A.; Clough, B.F. Organic carbon accumulation and metabolic pathways in sediments of mangrove forests in southern Thailand. Mar. Geol. 2001, 179, 85–103. [Google Scholar] [CrossRef]
  52. Alongi, D.M.; Mukhopadhyay, S.K. Contribution of mangroves to coastal carbon cycling in low latitude seas. Agric. For. Meteorol. 2015, 213, 266–272. [Google Scholar] [CrossRef]
  53. Arifanti, V.B. Influences of Land Use on Carbon Cycles in Mangrove Ecosystems of the Mahakam Delta, East Kalimantan, Indonesia. Ph.D. Thesis, Oregon State University, Corvallis, OR, USA, 2017. [Google Scholar]
  54. Schulze, E.D.; Prokuschkin, A.; Arneth, A.; Knorre, N.; Vaganov, E.A. Net ecosystem production and peat accumulation in a Siberian Aapa mire. Tellus B Chem. Phys. Meteorol. 2002, 54, 531–536. [Google Scholar] [CrossRef]
  55. Waring, R.H.; Law, B.; Bond, B. NPP Temperate Forest: OTTER Project Sites, Oregon, USA, 1989–1991. 2013. Available online: https://daac.ornl.gov/cgi-bin/dsviewer.pl?ds_id=472 (accessed on 5 November 2021).
  56. Melling, L.; Kah, J.G.; Beauvais, C.; Hatano, R. Carbon Flow and Budget in a Young Mature Oil Palm Agroecosystem on Deep Tropical Peat. Plant 2008, 84, 21–25. [Google Scholar]
  57. Hiraishi, T.; Krug, T.; Tanabe, K.; Srivastava, N.; Baasansuren, J.; Fukuda, M.; Troxler, T.G. 2013 Supplement to the 2006 IPCC Guidelines for National Greenhouse Gas Inventories: Wetlands; IPCC: Geneva, Switzerland, 2014. [Google Scholar]
  58. Hirano, T.; Segah, H.; Harada, T.; Limin, S.; June, T.; Hirata, R.; Osaki, M. Carbon dioxide balance of a tropical peat swamp forest in Kalimantan, Indonesia. Glob. Chang. Biol. 2007, 13, 412–425. [Google Scholar] [CrossRef]
  59. Bubier, J.L.; Frolking, S.; Crill, P.M.; Linder, E. Net ecosystem production and its uncertainty in a diverse boreal peatland. J. Geophys. Res. Atmos. 1999, 104, 27683–27692. [Google Scholar] [CrossRef]
  60. Uhl, C.; Kauffman, J.B. Deforestation effects on fire susceptibility and the potential response of the tree species to fire in the rainforest of the eastern Amazon. Ecology 1990, 71, 437–449. [Google Scholar] [CrossRef]
  61. Usup, A.; Hashimoto, Y.; Takahashi, H.; Hayasaka, H. Combustion and thermal characteristics of peat fire in tropical peatland in Central Kalimantan, Indonesia. Tropics 2004, 14, 1–19. [Google Scholar] [CrossRef] [Green Version]
  62. Konecny, K.; Ballhorn, U.W.E.; Navratil, P.; Jubanski, J.; Page, S.E.; Tansey, K.; Siegert, F. Variable carbon losses from recurrent fires in drained tropical peatlands. Glob. Chang. Biol. 2016, 22, 1469–1480. [Google Scholar] [CrossRef] [PubMed] [Green Version]
Figure 1. Study sites (white markers) within a deep peat dome near Ketapang, West Kalimantan, Indonesia. Roads (black line) cross-cutting the deep peat dome (dark brown). The peat area was delineated by [30] to represent a dome-shaped peatland between Pawan River on the north and Pesaguhan River on the south. Grey areas represent the non-peat areas. Adapted by permission from [Springer Nature Customer Service Centre GmbH]: [Springer Nature] [Mitigation & Adaptation Strategies for Global Change] (Land cover changes reduce net primary production in tropical coastal peatlands of West Kalimantan, Indonesia, Imam Basuki et al.), [COPYRIGHT] (2018) [23].
Forests 12 01587 g001
Figure 2. Plot design to measure CO2 fluxes, soil total (hollow; 18) and heterotrophic (black; 6) respirations in two transects of 38.5 m undisturbed peat swamp forests (PSF; n = 3), partially logged peat forests (LPSF; n = 3), oil palm estate (OP; 3 plots) and early seral (ES; 3 plot) sites.
Forests 12 01587 g002
Figure 3. Heterotrophic respiration trend from August 2014 to December 2015 in PSF (black circle), LPSF (square hollow), ES (cross), and OP (hollow circle). Dry months are represented by data from August, September, and October (5 months). Wet months are represented by data from February to July and November to December (7 months). Error bars show ± standard error (SE) of the heterotrophic respiration data.
Forests 12 01587 g003
Figure 4. Primary production of belowground biomass, aboveground biomass and litterfall (NPP) in intact and logged peat forest, early seral sites (ES), and oil palm estates (OP). Production of biomass and litterfall (NPP) reported as a mean value. Error bars show ± standard error (SE) of the production. PSF represents intact peat forests, and LPSF means partially logged forests. Lower case letters represent statistical significance in production. Adapted by permission from [Springer Nature Customer Service Centre GmbH]: [Springer Nature)] [Mitigation & Adaptation Strategies for Global Change] (Land cover changes reduce net primary production in tropical coastal peatlands of West Kalimantan, Indonesia, Imam Basuki et al.), [COPYRIGHT] (2018) [23].
Forests 12 01587 g004
Figure 5. The net primary production and heterotrophic respiration rates in intact (PSF), logged peat forests (LPSF), early seral communities (ES), and oil palm estates (OP). Vertical bars are one standard error of NPP and respiration.
Forests 12 01587 g005
Figure 6. Net ecosystem production among wetland ecosystems. Data for mangrove are from [51,53]. Shrimp pond is from [53]. Peat oil palm is from [56] and this study. Peat pine forest and drained peat forests are from [54,58]. Peat shrub is from [59]. Peat forest, logged peat forest, oil palm, and early seral are from this study (bordered with black line).
Forests 12 01587 g006
Table 1. Process of historical land use/land cover change in time series that had started since 1988 around the study area.
YearPre-1988198819942010
ProcessSubsistent useRoad and loggingClearing/deforestationClearing + burning
Land use/land coverIntact peat swamp forests (PSF)Logged peat swamp forests (LPSF)Early seral (ES)Smallholder and industrial oil palm estate (OP)
Photos Forests 12 01587 i001 Forests 12 01587 i002 Forests 12 01587 i003 Forests 12 01587 i004
Table 2. Heterotrophic, autotrophic, and total respiration, water table depth, and mean soil temperature in intact forest, logged peat forest, early seral, and oil palm estate are reported as mean ± one standard error. Different lower-case letters represent the statistically significant difference (p < 0.05) on a variable among land use types.
SchemeHeterotrophic RespirationAutotrophic RespirationTotal Soil RespirationWater Table DepthSoil Temperature
-----------------Mg CO2 ha−1 yr−1--------------- cm°C
Peat swamp forest 140.0 ± 5.85.9 ± 2.945.9 ± 5.544.3 ± 10.427.1 ± 0.1
Peat swamp forest 240.1 ± 5.313.9 ± 4.154.0 ± 5.748.4 ± 10.427.3 ± 0.2
Peat swamp forest 332.9 ± 4.512.8 ± 2.345.6 ± 4.345.3 ± 10.127.2 ± 0.3
Peat swamp forest mean (n = 3)37.7 ± 2.4 a10.8 ± 2.5 a48.5 ± 2.7 a46 ± 20.1 a27.2 ± 0.4 a
Logged peat swamp forest 143.0 ± 5.410.9 ± 4.653.9 ± 5.339.9 ± 10.527 ± 0.2
Logged peat swamp forest 239.6 ± 5.16.1 ± 4.245.6 ± 4.934.0 ± 9.926.8 ± 0.2
Logged peat swamp forest 339.4 ± 4.311.6 ± 3.451.0 ± 5.445.1 ± 10.627.3 ± 0.3
Logged peat swamp forest mean (n = 3)40.7 ± 1.2 a9.5 ± 1.7 a50.2 ± 2.4 a39.7 ± 20.3 a27 ± 0.5 a
Early seral 126.0 ± 2.514.9 ± 4.139.6 ± 4.359.8 ± 1330.5 ± 0.5
Early seral 231.3 ± 4.06.1 ± 1.237.5 ± 4.240.4 ± 12.529.1 ± 0.3
Early seral 334.6 ± 2.010.7 ± 5.845.3 ± 5.850.7 ± 9.928.9 ± 0.3
Early seral mean (n = 3)30.7 ± 2.5 b10.6 ± 2.5 a40.8 ± 2.3 b50.3 ± 23.5 a29.5 ± 0.8 b
Oil palm estate 142.2 ± 7.08.6 ± 5.449.3 ± 4.388.4 ± 10.331.5 ± 0.3
Oil palm estate 238.5 ± 3.35.9 ± 3.244.4 ± 3.574.4 ± 9.130 ± 0.3
Oil palm estate 3 35.4 ± 3.613.3 ± 6.048.7 ± 4.972.2 ± 9.330 ± 0.4
Oil palm estate mean (n = 3)38.7 ± 2.0 a9.3 ± 2.2 a47.5 ± 1.6 a78.3 ± 19.1 b30.5 ± 0.8 b
Table 3. Heterotrophic, autotrophic, and total respiration during dry and wet months in intact forest, logged peat forest, early seral, and oil palm estate. Data are mean ± one standard error.
SiteSoil Respiration
Dry Months (August to October)Wet Months (November to July)
HeterotrophicAutotrophicTotalHeterotrophicAutotrophicTotal
----------------------------------Mg CO2 ha−1 yr−1-----------------------------------
Peat swamp forest 141.2 ± 6.39.9 ± 4.251.1 ± 6.539.2 ± 5.93.0 ± 1.142.2 ± 5.0
Peat swamp forest 240.2 ± 5.318.9 ± 5.159.2 ± 7.440.1 ± 5.610.2 ± 3.250.3 ± 4.6
Peat swamp forest 335.5 ± 4.214.5 ± 3.550.0 ± 3.531.0 ± 4.911.5 ± 1.242.5 ± 4.9
Peat swamp forest mean39.0 ± 10.114.4 ± 8.353.4 ± 11.536.7 ± 10.88.3 ± 4.545.0 ± 9.4
Logged peat swamp forest 142.4 ± 2.917.9 ± 6.360.2 ± 5.343.5 ± 7.05.9 ± 2.549.4 ± 5.3
Logged peat swamp forest 236.7 ± 2.414.3 ± 4.551.0 ± 5.741.6 ± 6.60.2 ± 3.241.8 ± 4.4
Logged peat swamp forest 336.2 ± 2.116.8 ± 5.053.0 ± 6.841.7 ± 5.47.9 ± 1.149.5 ± 4.7
Logged peat swamp forest mean38.4 ± 4.916.3 ± 9.954.7 ± 11.342.2 ± 12.14.7 ± 5.046.9 ± 9.4
Early seral 127.5 ± 3.313.6 ± 6.237.9 ± 5.825.0 ± 2.115.9 ± 2.140.9 ± 3.4
Early seral 230.8 ± 4.88.4 ± 1.239.2 ± 4.931.8 ± 3.64.5 ± 1.136.2 ± 4.1
Early seral 337.6 ± 2.115.8 ± 9.153.4 ± 8.332.4 ± 1.97.0 ± 2.039.4 ± 2.7
Early seral mean31.9 ± 7.112.6 ± 1243.5 ± 12.729.7 ± 5.49.1 ± 4.538.8 ± 6.6
Oil palm estate 130.1 ± 2.118.7 ± 4.345.3 ± 3.650.8 ± 8.31.4 ± 5.452.2 ± 4.8
Oil palm estate 231.1 ± 3.010.4 ± 4.341.5 ± 4.743.8 ± 2.62.7 ± 2.046.5 ± 2.5
Oil palm estate 325.3 ± 2.924.4 ± 7.049.7 ± 7.842.6 ± 2.55.4 ± 4.248.0 ± 2.1
Oil palm estate mean 28.8 ± 5.217.8 ± 10.545.5 ± 10.645.7 ± 10.13.2 ± 7.948.9 ± 6.5
Table 4. Net primary production (NPP), net ecosystem production (NEP), and heterotrophic respiration in intact and logged peat forest, early seral, and oil palm estate were reported as mean ± SE whenever possible.
SiteTotal NPPHeterotrophic RespirationNEP
-----------------Mg CO2 ha−1 yr−1-------------------
Peat swamp forest 150.440.0 ± 5.810.4
Peat swamp forest 242.440.1 ± 5.32.3
Peat swamp forest 352.832.9 ± 4.519.9
Peat swamp forest mean48.5 ± 2.837.7 ± 2.410.8 ± 5.1
Logged peat swamp forest 138.843.0 ± 5.4−4.2
Logged peat swamp forest 240.739.6 ± 5.11.1
Logged peat swamp forest 342.239.4 ± 4.32.8
Logged peat swamp forest mean40.6 ± 1.040.7 ± 1.2−0.1 ± 2.1
Early seral 131.3 ± 12.826 ± 2.55.3
Early seral 248.1 ± 19.731.3 ± 4.016.8
Early seral 339.9 ± 16.334.6 ± 2.05.3
Early seral mean39.8 ± 4.930.7 ± 2.59.1 ± 3.8
Oil palm estate 114.1 ± 1.442.2 ± 7.0−28.1
Oil palm estate 213.4 ± 3.538.5 ± 3.3−25.1
Oil palm estate 313.4 ± 1.035.4 ± 3.6−22.0
Oil palm estate mean13.6 ± 0.238.7 ± 2.0−25.1 ± 1.8
Table 5. Water table depth and soil temperature (means± SE) of intact peat forest (PSF), logged peat forest (LPSF), early seral (ES), and oil palm (OP) during wet and dry months and annually. Superscripted letters denote a significant difference (p < 0.05) when testing between land cover types.
SiteWater Table Depth Level (cm)Soil Temperature (°C)
Dry MonthsWet MonthsAnnualDry MonthsWet MonthsAnnual
Peat swamp forest81 ± 1321 ± 846 ± 6 a27.3 ± 0.527.1 ± 0.327.2 ± 0.1 a
Logged peat swamp forest74 ± 1315 ± 940 ± 6 a27.0 ± 0.527.1 ± 0.627.0 ± 0.1 a
Early seral84 ± 2126 ± 1350 ± 7 a30.0 ± 0.828.8 ± 0.829.5 ± 0.2 b
Oil palm estate105 ± 1560 ± 1378 ± 6 b30.6 ± 0.830.3 ± 0.830.5 ± 1.6 c
Publisher’s Note: MDPI stays neutral with regard to jurisdictional claims in published maps and institutional affiliations.

