Article

Growth and Nitrogen Retranslocation of Nutrient-Loaded Clonal Betulaalnoides Transplanted with or without Fertilization

1
Experimental Center of Tropical Forestry, Chinese Academy of Forestry, Pingxiang 532600, China
2
Youyiguan Forest Ecosystem Research Station, Pingxiang 532600, China
3
Agriculture and Forest Sciences, South Street Campus, Murdoch University, Murdoch 6150, Australia
4
Chinese Academy of Forestry, Beijing 100091, China
*
Author to whom correspondence should be addressed.
Submission received: 9 October 2021 / Revised: 9 November 2021 / Accepted: 17 November 2021 / Published: 20 November 2021
(This article belongs to the Section Forest Ecology and Management)

Abstract

:
Nutrient loading can improve the growth and nutrient content of nursery-grown Betula alnoides Buch.-Ham. ex D. Don, but it is unknown whether nutrient loading enhances growth and nutrient uptake after transplanting. Plants were grown with three nutrient loading treatments (N100, N200, and N400; 100, 200, and 400 mg N per plant as 15N-urea) in nursery containers and then transplanted into plastic pots, with or without controlled-release fertilizer (F0 and F10, 0 and 10 g per plant). The N400 plants had a smaller size but higher nitrogen concentration relative to the N100 and N200 plants before transplanting. However, 180 days after transplanting, the N200 and N400 plants had superior root collar diameter, root length, and root area compared to the N100 plants, due to an increase in 15N retranslocation to new stems and new leaves. Moreover, transplant fertilization (F10) enhanced the height, root collar diameter, root length, and plant dry mass, but not nitrogen concentration or retranslocation, relative to F0. We recommend that medium- and high-dose nutrient loading is implemented in B. alnoides nurseries to optimize growth after transplanting. Additional fertilizer at transplanting may be advantageous in supporting growth, owing to the rapid depletion of nutrient reserves after planting out in the field.

1. Introduction

Until the root system of transplanted tree seedlings is fully developed and essential nutrients can be readily obtained from the soil, the growth of seedlings may depend on the retranslocation of stored nutrients [1,2]. Nutrient loading can build nutrient reserves in nursery stock, which are then utilized to support early growth after planting into nutrient-deficient soils [3,4,5,6]. For example, nutrient loading increased seedling survival and total plant biomass of Chinese fir (Cunninghamia lanceolata (Lamb) Hook), red oak (Quercus rubra L.), and white oak (Q. alba L.) after out-planting [5,7]. Moreover, Oliet et al. found that nutrient loading promoted holm oak (Q. ilex L.) post-transplant root growth relative to shoot growth under simulated soil fertility gradients, allowing nutrient-loaded seedlings to exploit more of the soil profile [4]. Furthermore, although exponential nutrient loading increased the internal nutrient reserves in trembling aspen (Populus tremuloides Michx.) and white spruce (Picea glauca (Moench) Voss) seedlings in the nursery, only aspen seedlings showed increased new leaf, new stem, and old stem biomass and nitrogen retranslocation rates after transplantation [1]. These results indicate that the impact of nutrient loading on field growth performance may be species specific.
In addition to nutrient loading, soil fertility also affects the field growth performance of seedlings [1,8,9]. However, it is a challenge to distinguish the contributions of plant nitrogen reserves and soil nitrogen to new seedling growth under field conditions unless 15N labeling is used. Some 15N labeling studies showed that the seedling growth of forest tree species was strongly determined by nitrogen storage, rather than soil nitrogen supply, at the early stage after transplanting [10,11]. However, the extent to which nitrogen storage contributes to new growth can be influenced by the climate zone, tree type (e.g., conifers or angiosperms, evergreen or deciduous), plant age, availability of soil nutrients, and other factors [8,12,13]. Thus, it is necessary to determine the relative contributions of nutrients from different internal and external sources that can sustain the new growth of each forest plantation species after planting.
Betulaalnoides Buch.-Ham. ex D. Don is a valuable subtropical timber tree species and has a high economic and ecological value [14]. Its plantation area in China exceeds 133,000 ha [15]. Many high-quality containerized plants are required to supply further expansion of B. alnoides plantations. However, soil fertility is often limiting for the reforestation and site productivity of B. alnoides in China [16]. In this situation, nutrient loading technology may be helpful to build nutrient reserves in nursery stock prior to out-planting in the field. Chen et al. (2018) established that the optimal amount of nitrogen for cultivating high quality B. alnoides seedlings was 100–400 mg N per plant, and nutrient loading significantly increased seedling nutrient content, without affecting growth in nursery containers [14]. However, the benefit of nutrient loading has not been fully evaluated after transplanting. Therefore, we investigated the effect of nutrient loading on the growth, nitrogen concentration, and 15N retranslocation of a B. alnoides clone, with and without fertilization, at transplanting, simulating two soil fertilities. The specific objectives were to (1) evaluate the interaction effect of nutrient loading and fertilization at transplanting on seedling performance, nitrogen concentration, and retranslocation; and (2) identify the contribution of plant nutrient reserves on seedling performance after transplanting using the 15N labeling method.
We hypothesized that (1) high-dose nutrient loading enhances early transplanting growth, due to increased nitrogen retranslocation, and (2) fertilization at transplanting increases nitrogen accumulation but reduces nitrogen retranslocation to the new growth.

2. Materials and Methods

2.1. Nursery Culture Phase

We selected the clone FB4 for the study because it has superior growth attributes and is being used in commercial plantations in south China [17]. Clone FB4 was collected from a mother tree in Fubo Farm, Pingxiang, China (106°44′ E and 22°07′ N) in October 2018. Leaf buds were taken from the mother tree and sterilized, then processed through the induction, proliferation, and rooting stages of tissue culture performed in bottles. When ready, tissue culture bottles were removed from the culture room to outdoors under natural day-length and temperature for 10 days and covered with 30% shade cloth [18].
On 8 December 2019, clonal plants with an average height of 5.0 cm were carefully removed from the tissue bottles, the medium was removed with water, and they were transplanted into polypropylene bags (4 cm in width, 10 cm in height, and 125 cm3 in volume) filled with a mixture of 60% composted bark, 30% composted sawdust, and 10% yellow soil. This is the common practice for the nursery production of B. alnoides plants in south China. Plastic containers were placed under each polypropylene bag to prevent the leaching of water and nutrients. All plants were grown on a greenhouse bench in the Experimental Center of Tropical Forestry, CAF, Pingxiang, China, at 23 °C average temperature and 80% relative humidity. Plants were shaded with 30% shade cloth for the first two weeks after transplanting and then 70% shade cloth thereafter.
A randomized complete block design experiment was set up with three blocks, each consisting of three nutrient loading treatments (100, 200, and 400 mg N per plant, N100, N200, and N400), 360 plants in each treatment (in total 1080 plants). These nutrient loading rates were used because, in a previous study, N100–N400 (100–400 mg N per plant) significantly increased the nutrient content of B. alnoides without changing seedling growth, and N100 (100 mg N per plant) was the standard operating procedure in the nursery [14]. Fertilizer was applied at exponentially increasing addition rates, as described in detail by Birge et al. [19]. Fertilization was performed once a week for 16 weeks, from 22 December 2019 to 10 April 2020 (Table 1 and Table 2). Care was taken to ensure the nutrient solutions were applied only to the rooting medium. The containers were watered by weight to 70–80% of field capacity. Watering was undertaken in small amounts and multiple times to prevent waterlogging. After nutrient loading was completed, the plants were hardened off by stopping fertilization and reducing watering for 15 days prior to transplanting.

2.2. Transplanting Phase

After hardening off, the growth performance of the nutrient-loaded plants, with or without fertilization, was assessed outdoors in a container experiment. The transplant experiment comprised a split-plot design with a 2 × 3 factorial treatment structure, which was replicated in three blocks. The main plots were two transplant fertilization treatments (unfertilized, F0; fertilized with 10 g controlled-release fertilizer per plant, F10), and the subplots were the three nutrient loading treatments (N100, N200, and N400), as described earlier. On 25 April 2020, a total of 486 plants (two transplant fertilization treatments × three nutrient loading treatments × 27 15N-labeled plants per subplot × three blocks) were transplanted into plastic pots (18 cm upper diameter, 13 cm bottom diameter, and 16 cm height) filled with yellow soil. The controlled-release fertilizer (18N:6P2O5:12K2O:4S, 8–9 months, APEX Co. Ltd., Boise, ID, USA) was mixed with yellow soil before transplanting. The yellow soil had 9.94 g·kg1 C, 0.57 g·kg1 total N, 0.25 g·kg1 total P, 8.31 g·kg1 total K, 0.98 g·cm−3 bulk density, and a pH of 5.00.

2.3. Plant Sampling and Measurement

The root collar diameter and shoot height of plants were measured before transplanting, and at 30, 60, and 180 days after transplanting. Five 15N-labeled and five unlabeled plants were randomly selected from each plot before transplanting, and five 15N-labeled plants from each subplot at each sampling time after transplanting. The substrate was gently shaken from the roots which were then washed with distilled water. The plants within the same subplot were combined and separated into roots, stems, and leaves (prior to transplanting), or divided into new roots, new stems, new leaves, old roots, old stems, and old leaves (after transplanting). We distinguished by thickness and color the new (thin and white) and old (thick and brown) roots. As the plants grew in height they produced new leaves and new stems. The 3 to 4 young leaves from the top were new leaves, and the corresponding stems were new stems. The remaining leaves and stems were the old leaves and old stems that were present at the time of transplanting root samples, which were scanned and analyzed for root length and root area using a Wanshen LA-S series plant image analysis system (Wanshen Testing Technology Co., Ltd. Hangzhou, China). Plant components were dried in an oven at 65 °C for 48 h, and then weighed. They were ground in a MM400 ball mill (Retsch, Haan, Germany) and analyzed for N concentration (mg·g−1) and 15N (atom %) using a PDZ Europa 20–20 isotope mass spectrometer (Sercon Ltd., Cheshire, UK). The atom % of 15N in different organs of B. alnoides plants at four sampling times are shown in Appendix A, Table A1.

2.4. Statistical Analyses and Calculations

A mixed-model ANOVA was performed using SPSS 16.0 software to identify differences in plant growth, nitrogen concentration, and 15N retranslocated among treatments for each harvesting period. In the nursery culture phase, a mixed-model ANOVA with nutrient loading as a fixed factor, and block as a random term was used to evaluate differences among the nutrient loading treatments. In the transplanting phase, a mixed-model ANOVA with nutrient loading and transplant fertilization as fixed factors and block as a random term was conducted to determine the main and interaction effects of nutrient loading and fertilization at transplanting. Where there was a significant effect, Duncan’s multiple range test was carried out to compare treatments. Prior to ANOVA, data were tested for normality of distribution (Shapiro–Wilk test), and all data were found to be normally distributed. 15N retranslocated (%) was calculated using the following equation:
15N retranslocated (%) = (A − B) / (C − B) × 100
where A is the atom % 15N in new roots, new stems, and new leaves of labeled plants at each sampling time after transplanting; and B and C are the weighted means of atom % 15N in roots, stems, and leaves of non-labeled (control) and labeled plants before transplanting, respectively. This formula was modified from the equation used in the study of Pokharel and Chang [20].

3. Results

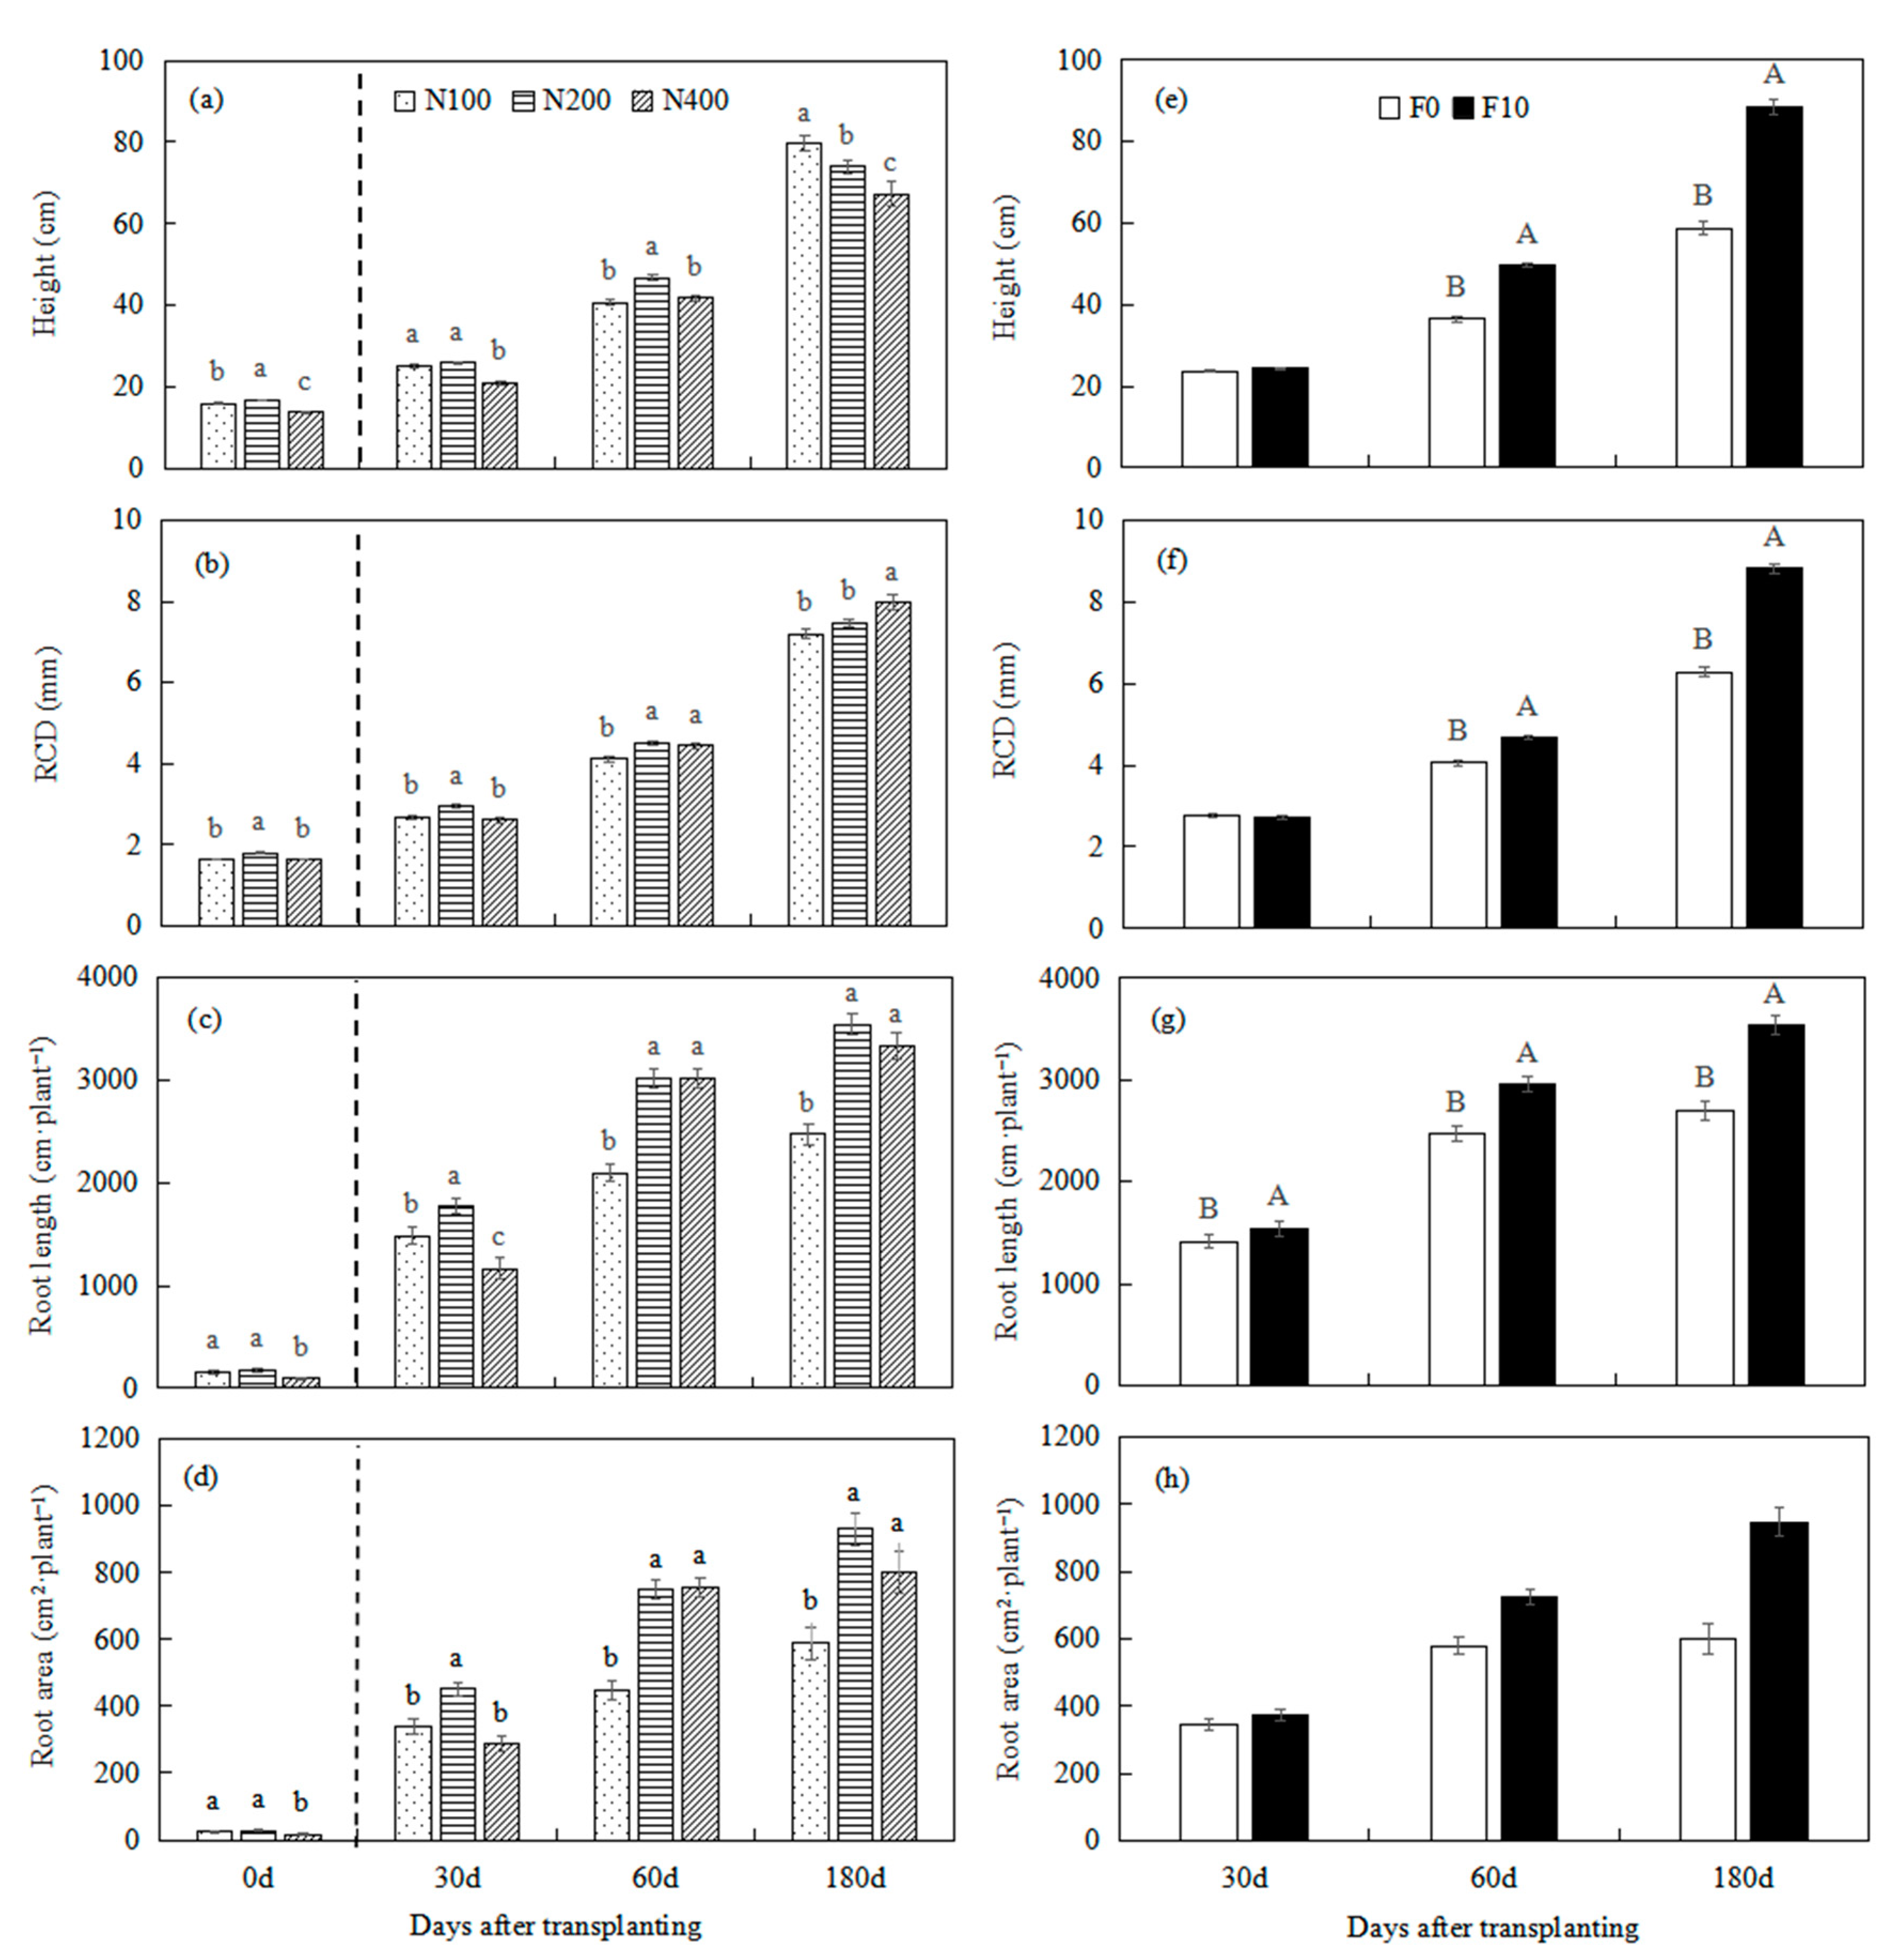
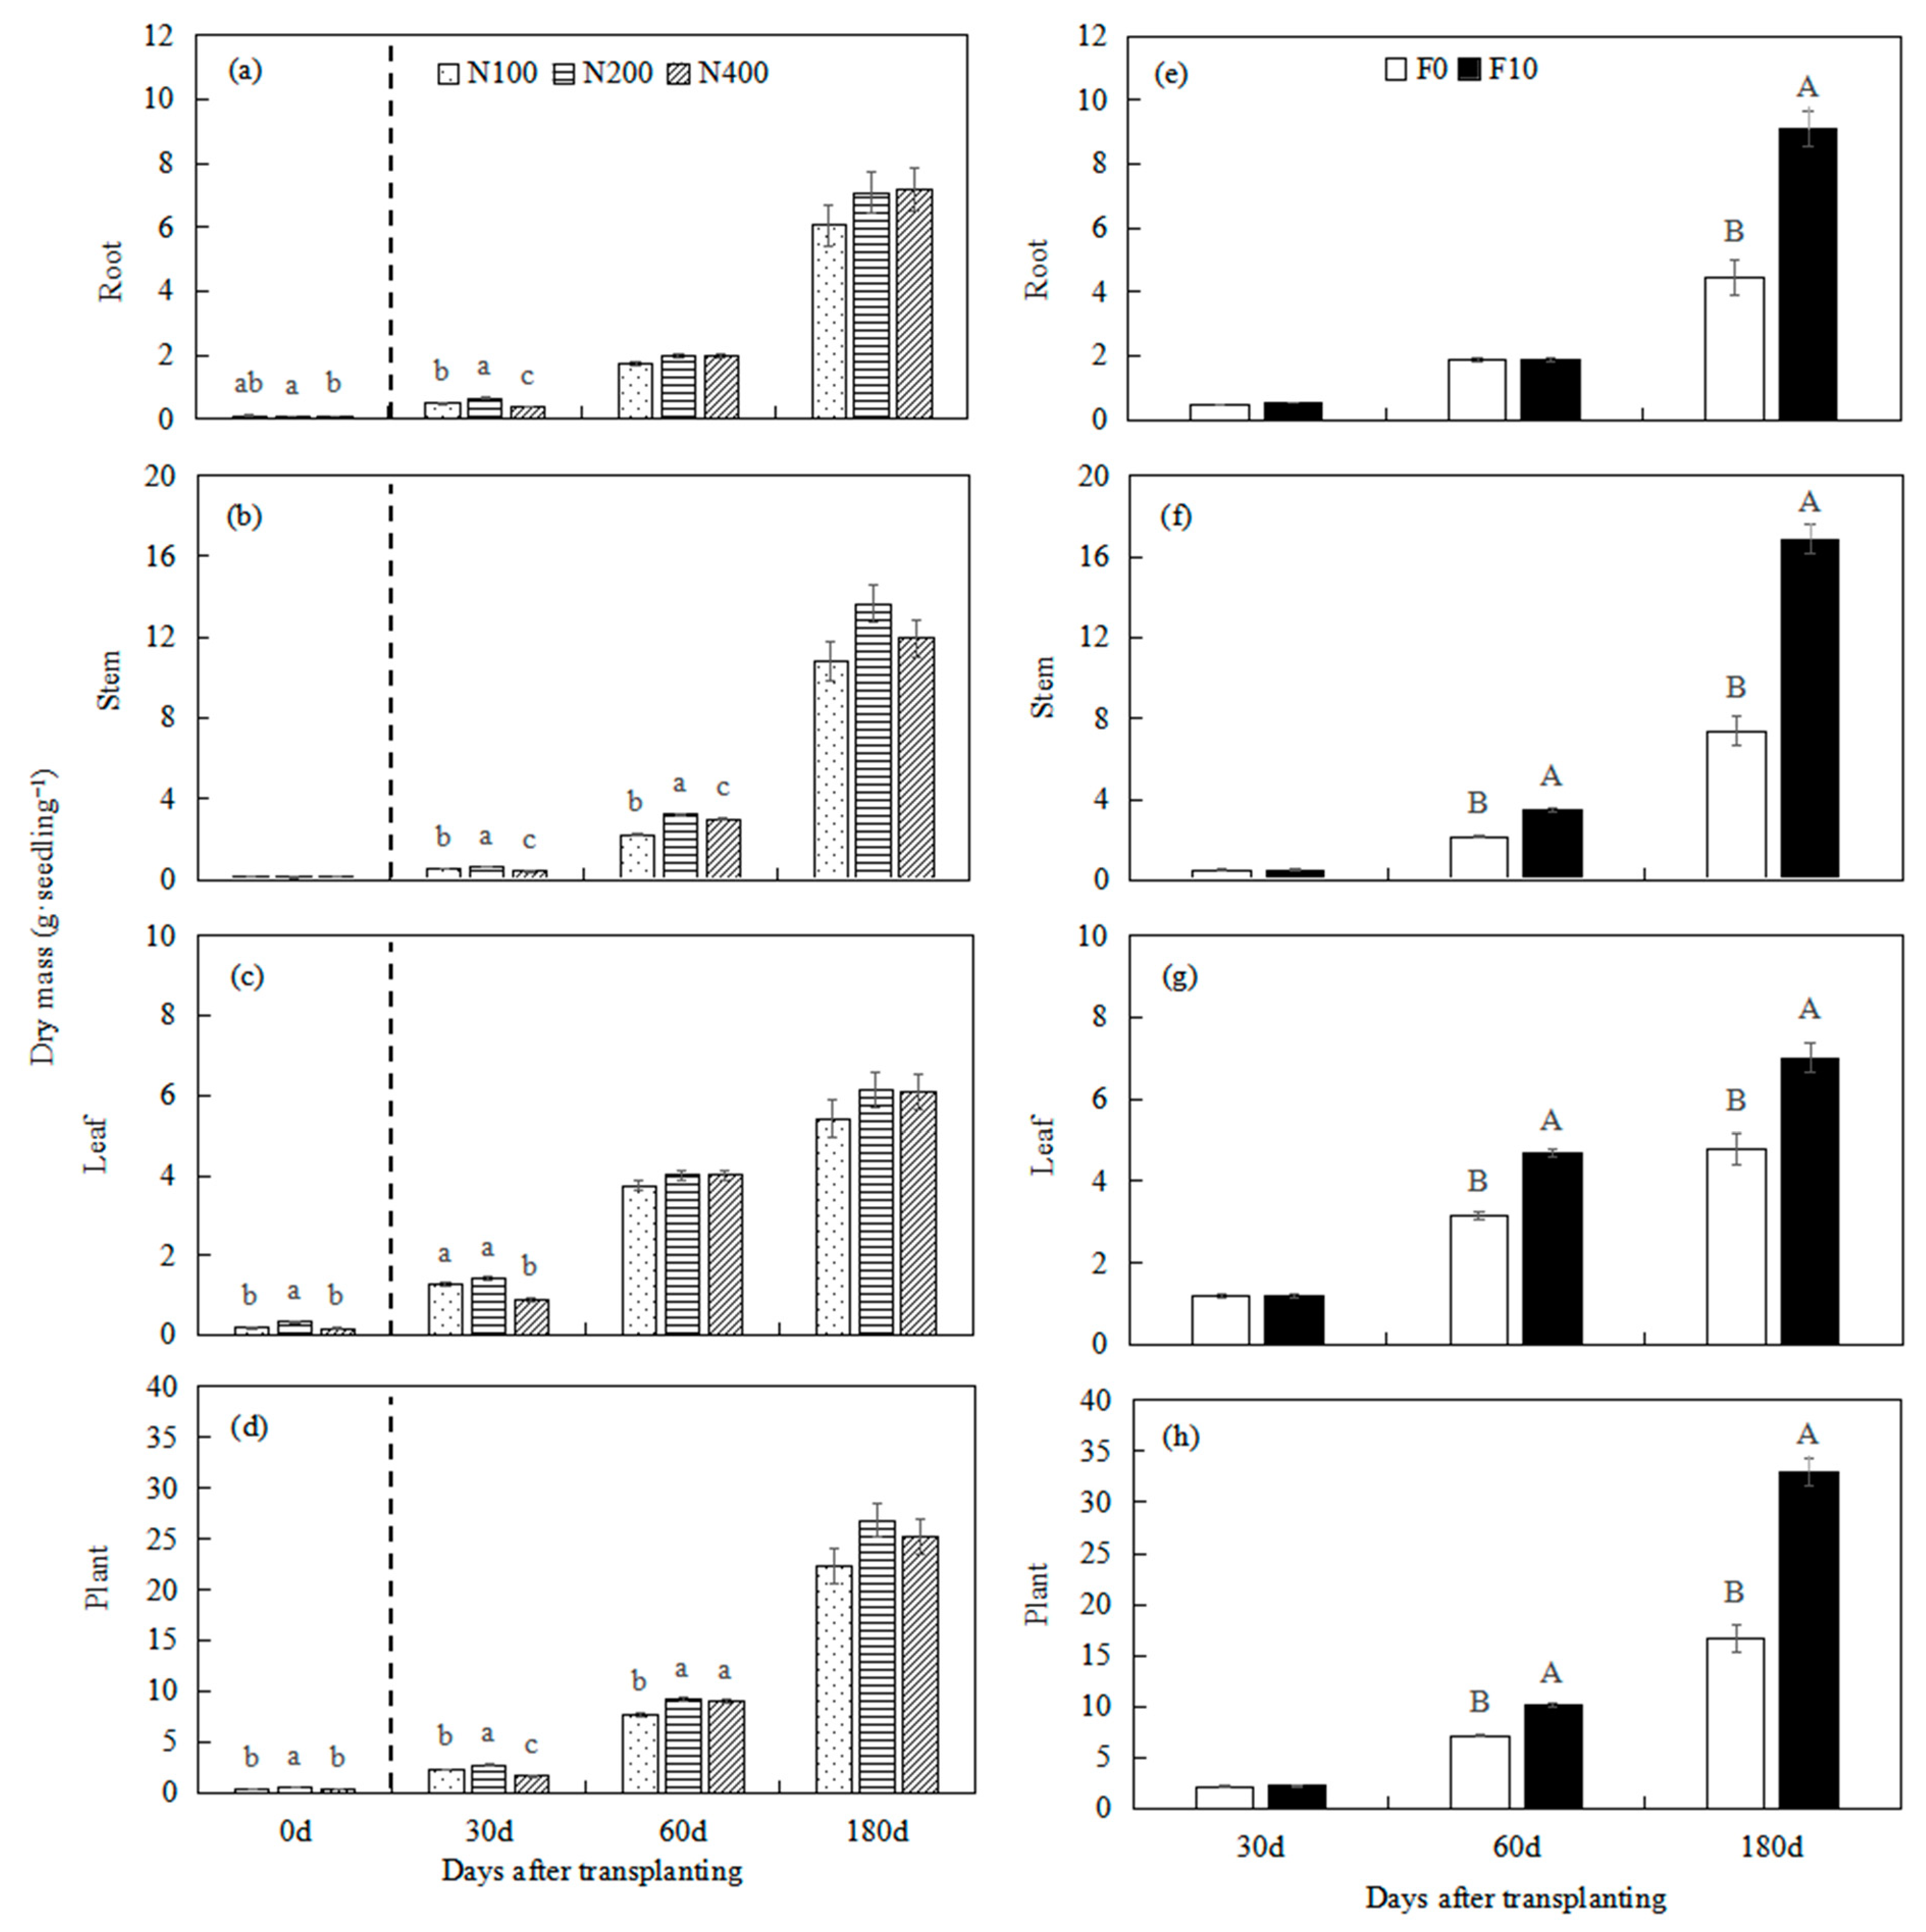
3.1. Growth Response

Except for the stem dry mass, nutrient loading significantly affected the growth parameters before transplanting (p < 0.05, Table 3). The N200 plants had the greatest height, root collar diameter, and dry mass in leaves and plants, while the N100 and N200 plants had the greatest root length, root area, and root dry mass among the three nutrient loading treatments (p < 0.05, Figure 1 and Figure 2).
In the transplanting phase, nutrient loading significantly affected the plant height, root collar diameter, root length, and root area at each sampling time; the dry mass in different plant organs at 30 days after transplanting; and the dry mass in stems and plants at 60 days after transplanting (p < 0.01, Table 3). At 180 days after transplanting, the root collar diameter, root length, and root area were 7%, 39%, and 47% higher, respectively, in the N200 and N400 treatments than the N100 treatment (p < 0.01, Figure 1). However, the height of the N100 plants was 8% and 18% taller than the N200 and N400 plants, respectively (p < 0.01, Figure 1). The application of controlled-release fertilizer at transplanting promoted the plant height, root collar diameter, root length, and dry mass at 60 and 180 days after transplanting (p < 0.05), but not at 30 days after transplanting (p > 0.05, Table 3). In comparison to the F0 treatment, the F10 treatment increased plant height by 51%, root collar diameter by 40%, root length by 31%, root mass by 104%, stem mass by 129%, and leaf mass by 47% at 180 days after transplanting (p < 0.05, Figure 1 and Figure 2). Furthermore, there was an interaction effect between nutrient loading and fertilization at transplanting on plant height, root length, root area, and root dry mass, depending on the sampling time (p < 0.05, Table 3). Regardless of transplant fertilization, the N200 plants had the largest root biomass at 30 days after transplanting and height at 60 days after transplanting (p < 0.01, Table 4). Furthermore, the N200 and N400 plants had the highest root length and root area at 60 and 180 days after transplanting (p < 0.01), except for root area at 180 days after transplanting in plants without transplant fertilization (F0) (p > 0.05, Table 4).

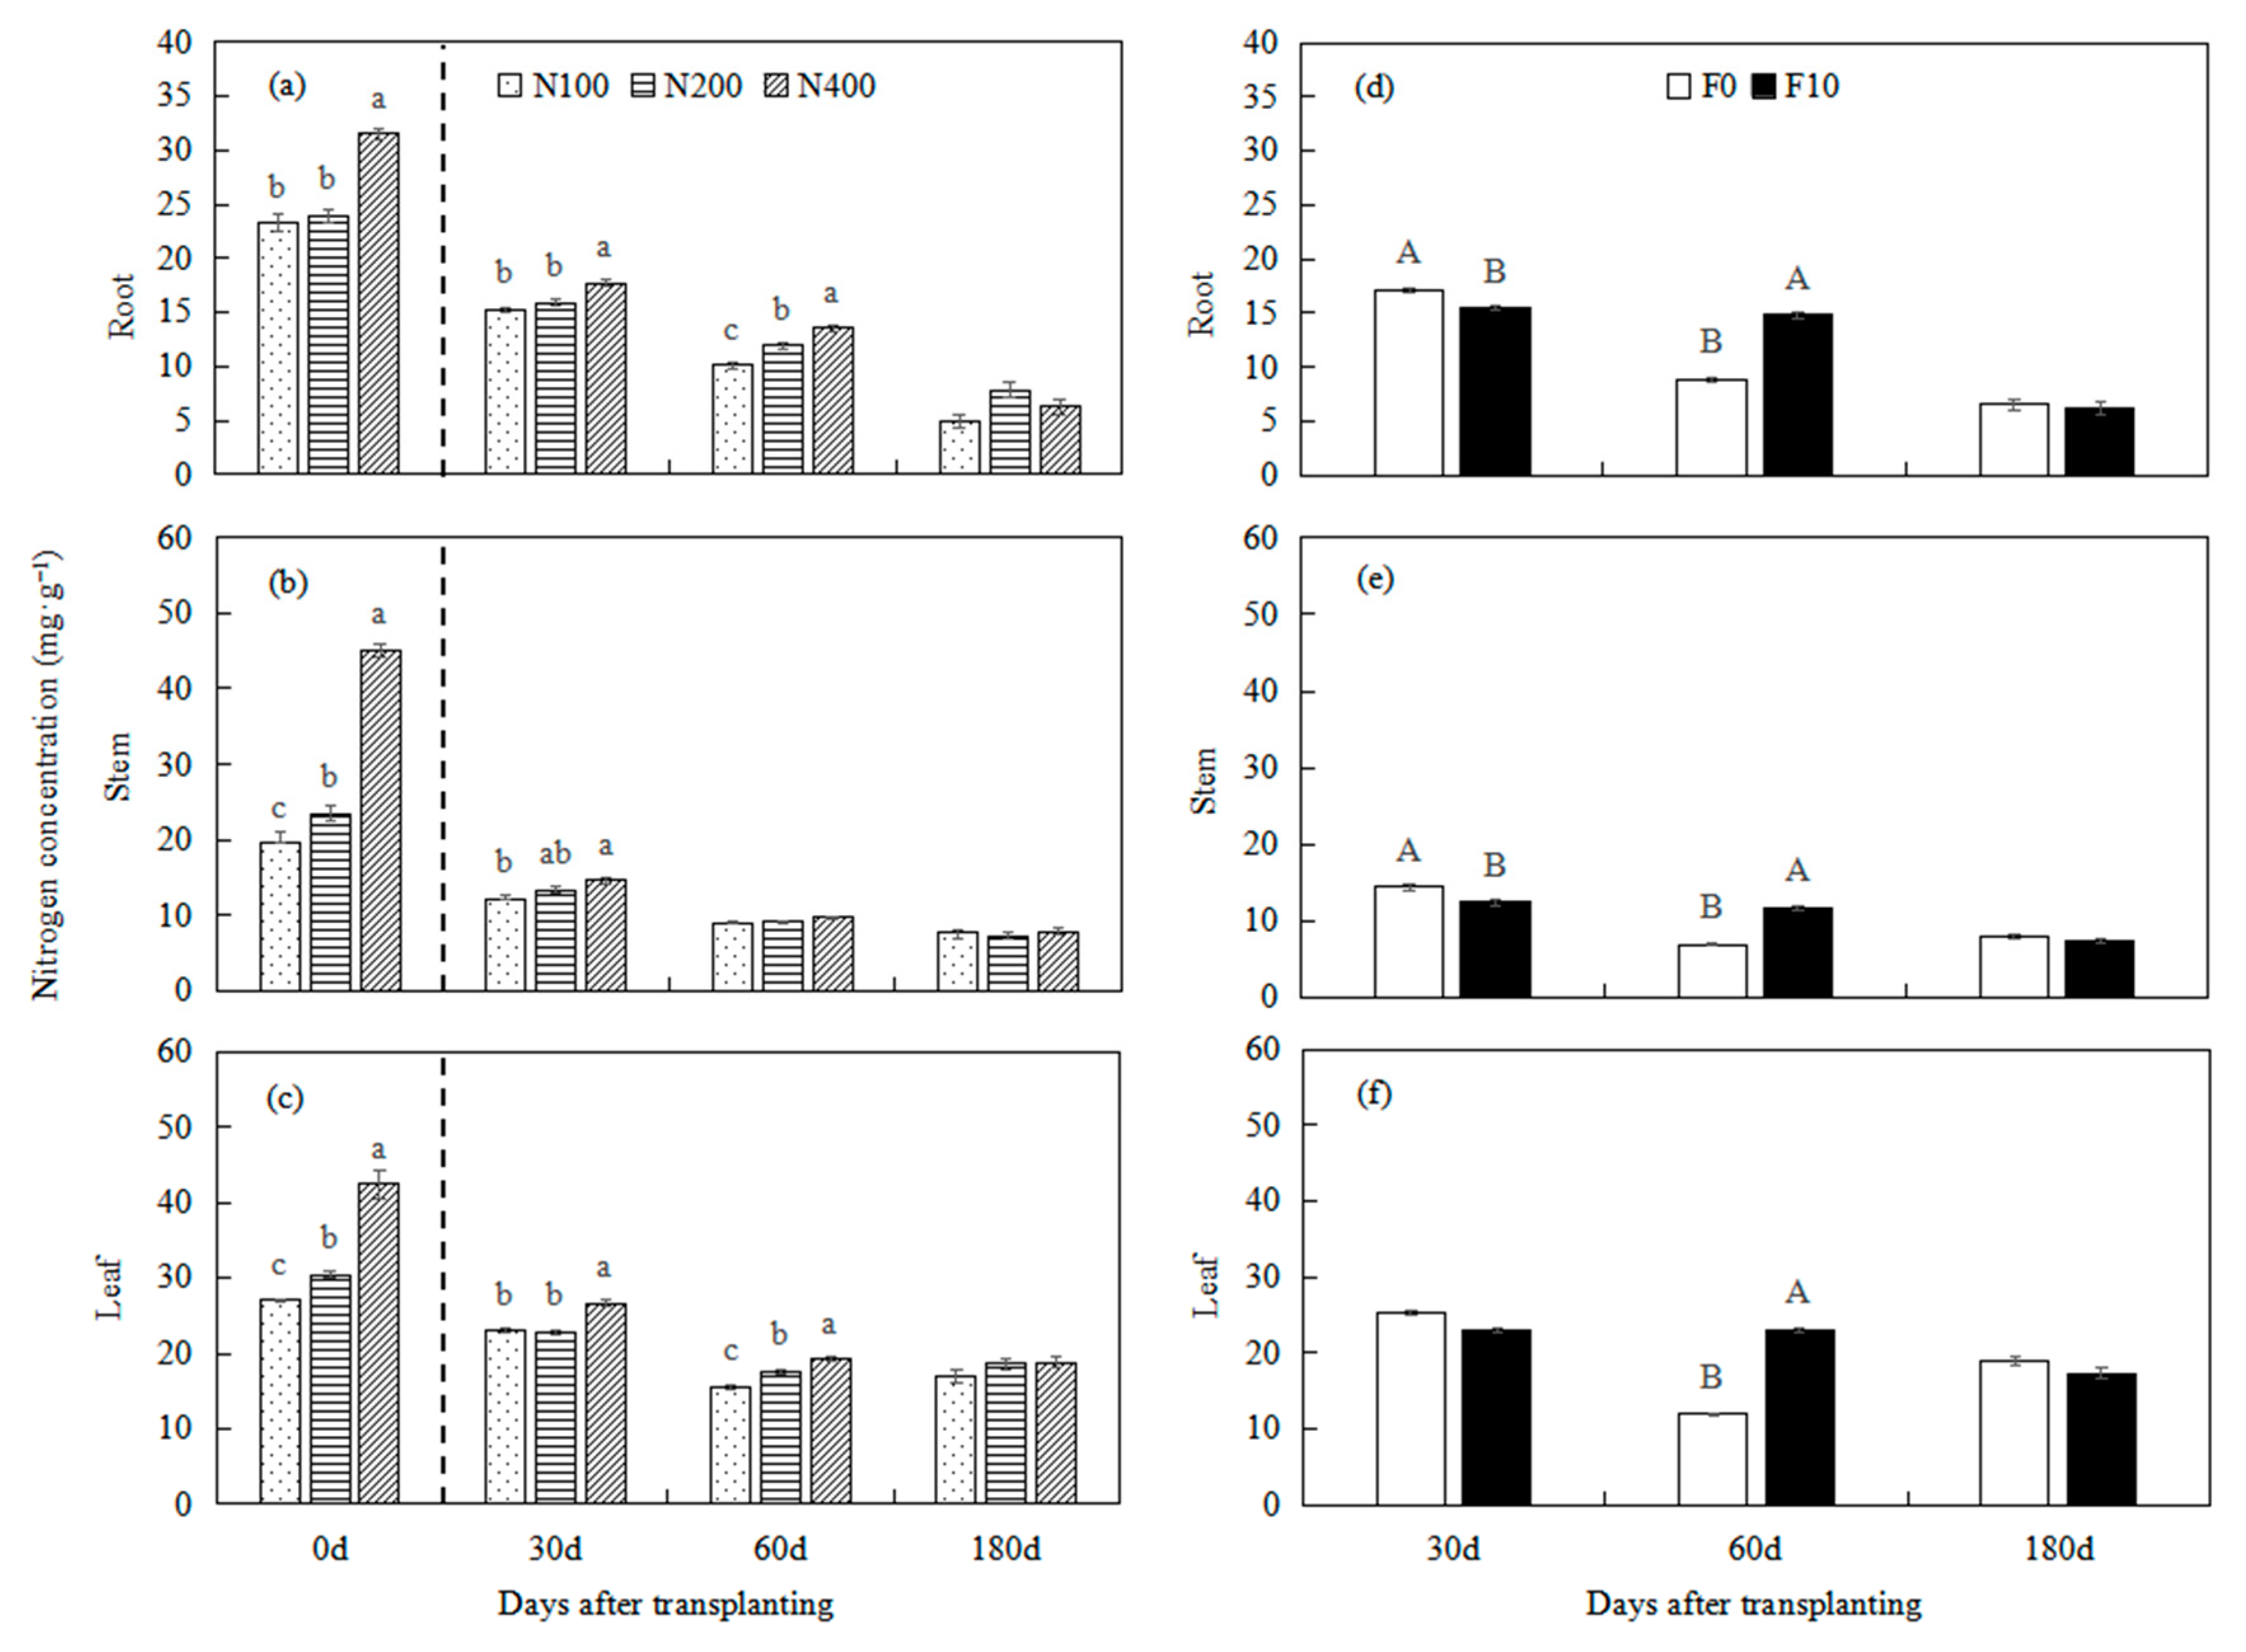
3.2. Nitrogen Concentration

Nutrient loading significantly affected the nitrogen concentrations in roots, stems, and leaves before transplanting (p < 0.001, Table 3). The nitrogen concentrations in roots, stems, and leaves were 34%, 109%, and 48% higher, respectively, in the N400 plants than in the N100 and N200 plants (p < 0.001, Figure 3).
Nutrient loading, transplant fertilization, and their interaction affected the nitrogen concentrations in different plant organs at 30 and 60 days after transplanting (p < 0.05) but not at 180 days after transplanting (p > 0.05, Table 3). In the case of F0, the nitrogen concentrations were either unchanged or they were significantly lower at 30 days after transplanting. They then increased with the increase in nutrient loading at 60 days after transplanting. In the case of F10, the nitrogen concentrations were either increased or unchanged with the increase in nutrient loading in the first two months after transplanting (Table 4). However, the F10 treatment decreased the nitrogen concentrations in roots by 10% and in stems by 14% at 30 days after transplanting, but it increased the nitrogen concentrations in roots by 66%, in stems by 69%, and in leaves by 9% at 60 days after transplanting compared to the F0 treatment (p < 0.05, Figure 3).

3.3. 15N Retranslocation

The nitrogen retranslocation from old organs to new organs declined with time. On average, 79%, 50%, and 6% of stored nitrogen was retranslocated to the new organs at 30, 60, and 180 days after transplanting, respectively (Figure 4).
Nutrient loading significantly affected the 15N retranslocated to new roots, new stems, and new leaves at each sampling time (p < 0.05), except for the 15N retranslocated to new roots at 180 days after transplanting (p > 0.05, Table 3). Compared to the N100 and N200 treatments, the N400 plants increased the redistribution of 15N by 84%, 81%, and 92%, at 30, 60, and 180 days after transplanting, respectively (p < 0.05, Figure 4). In addition, transplant fertilization affected 15N retranslocated at 30 and 60 days after transplanting (p < 0.05) but not at 180 days after transplanting (p > 0.05, Table 1). Compared to the F0 treatment, the F10 plants increased the proportion of 15N retranslocated by 20%, 23%, and 31%, respectively, to the new roots, new stems, and new leaves at 30 days after transplanting, but decreased the 15N retranslocated by 64%, 73%, and 75% at 60 days after transplanting (p < 0.05, Figure 4). Furthermore, there was a significant interaction effect between nutrient loading and fertilization at transplanting on the 15N retranslocated to new organs at 30 and 60 days after transplanting (p < 0.01, Table 1). In summary, the 15N retranslocated to all the new organs increased with the increased nutrient loading, regardless of any transplant fertilization (Table 4).

4. Discussion

4.1. Nutrient Loading

Our previous research established that B. alnoides can be nutrient loaded in the nursery using exponential regimes, and the optimal nitrogen application amount for this species was in the range 100–400 mg N per plant [14]. In this study, we further found that a medium- to high-dose nutrient loading (200 and 400 mg N per plant) resulted in superior root collar diameter, root length, root area, and 15N retranslocated to new stem and leaf organs at 180 days after transplanting compared to low-dose nutrient loading (100 mg N per plant). Thus, there is a benefit in appropriate nitrogen management prior to transplanting. The results support our first hypothesis that high-dose nutrient loading in the nursery can enhance new growth after transplanting, due to increased nitrogen retranslocation to growing organs. The benefit of nutrient loading for enhancing the establishment of tree seedlings has been well documented in temperate trees such as Q. ilex, Q. rubra, Q. alba, and Norway spruce (P. abies (L.) Karsten) [4,5,21]. In our study, nutrient loading enhanced the dry mass in roots, stems, and leaves in the first two months after transplanting, but not at 180 days after transplanting. Two factors may have contributed to the relatively short-term benefit of nutrient loading in our study. First, the nutrient reserves were quickly consumed, due to the rapid growth of B. alnoides after transplanting [22,23]. Second, several studies have shown that the combined effect of fertilization method and rate of fertilizer after planting in the field was greater than the fertilization rate [1,24]. Overall, nutrient loading is an efficient nursery practice to improve the early field growth of B. alnoides plants, in terms of root collar diameter, root length, and root area, but our results need to be confirmed in field trials.
Nitrogen storage and remobilization is important for tree growth and stress tolerance [1,8,25]. Nutrient reserves, current growth, nutrient uptake, and nutrient supply are key variables determining tissue nutrient concentration and the extent of retranslocation of phloem-mobile nutrients, such as nitrogen [9,13]. In this study, regardless of transplant fertilization (F0, F10), the nitrogen concentrations in plant tissues remained stable or they increased in the first two months after transplanting, suggesting there are short-term benefits of nursery nutrient loading, in terms of tissue nitrogen concentration. These results support the findings in other studies [4,5,11]. In our study, the leaf nitrogen concentration was reduced with higher nutrient loading (N200 and N400 treatments) at 30 days after transplanting in plants not given fertilizer at transplanting. This is likely to have been due to nitrogen dilution during growth [20,21]. In addition, the 15N retranslocated to new organs increased with nutrient loading in both transplant fertilization treatments. However, Hu et al. [1] found that nutrient loading increased nitrogen retranslocation rates in P. tremuloides, but not in P. glauca seedlings, after transplantation, despite enhanced internal nitrogen reserves in both tree species. The species-specific responses of nitrogen retranslocation to nutrient loading may be related to the different leaf traits and growth strategies of trees [8,9,26].
On average, 79%, 50%, and 6% of stored nitrogen was retranslocated to new organs at 30, 60, and 180 days after transplanting, respectively, indicating that nitrogen retranslocation declined with time as the root system expanded, improving nitrogen uptake and reducing the reliance on nitrogen redistribution [9,27]. We found that the new growth of B. alnoides plants was dependent on internal nitrogen cycling (50–79%) in the first two months after transplanting. High rates of nitrogen retranslocation were also reported in black walnut (Juglans nigra L.) (68–83%) in sand culture for 90 days [10] and P. tremuloides (73–80%) on two reconstructed soils during the first growing season [20]. However, only 32% of nitrogen was remobilized to new growth sinks in Q. rubra [28] over 90 days in a greenhouse, indicating tree species vary widely in terms of the contribution of nitrogen retranslocation required to meet the total sink demand [8,9,26]. As the nitrogen retranslocation capacity might be species dependent and change over time [10,13] (we only explored one B. alnoides clone for six months after transplanting), long-term field experiments on tree species should be conducted to further test the utility of nursery nutrient loading.

4.2. Transplant Fertilization

We found that fertilization at the time of planting significantly enhanced the growth of B. alnoides plants at 60 and 180 days after transplanting, indicating the importance of early field fertilization on nutrient responsive afforestation sites [4,24]. Some studies concluded that nutrient loading cannot replace field fertilization, as nutrient loading promoted the growth of roots and stems in the first year of afforestation, but had less or no effect in the second year [4,23]. Furthermore, there were interaction effects of nutrient loading and transplant fertilization on plant height, root length, root area, and root dry mass, suggesting that B. alnoides showed an additive response to nutrient loading and field fertilization [11,28].
Supplementary fertilization may be crucial to facilitating nutrient uptake, but it can inhibit the internal nutrient retranslocation of nutrient-loaded plants in nutrient-limited sites [4,9,27,28]. However, we found that application of controlled-release fertilizer at transplanting enhanced 15N retranslocation but lowered nitrogen concentrations at 30 days after transplanting, and depressed 15N retranslocation but increased nitrogen concentrations at 60 days after transplanting, compared to no fertilization, indicating that nitrogen retranslocation was negatively correlated with nitrogen concentration [13]. In addition, we observed that nitrogen retranslocation was less important in the growth of fertilized plants than in unfertilized plants at 60 days after transplanting. Similar nitrogen utilization strategies were reported in other tree species, such as Q. rubra [28], C. lanceolata [7], and black spruce (Pinus mariana (Mill.) BSP) [27].

5. Conclusions

Plants loaded either with 200 or 400 mg N per plant in the nursery had superior growth after transplanting compared to those loaded with 100 mg N per plant. 15N isotope analysis revealed that 79%, 50%, and 6% of the nitrogen that had accumulated in plant parts at the time of planting were mobilized to the new growth at 30, 60, and 180 days after transplanting, respectively. This highlights the importance of nutrient reserves built up in the nursery for new growth in the field. However, transplant fertilization may be necessary to supplement nursery loading, where nutrient reserves are rapidly depleted in infertile soils.

Author Contributions

L.C. designed the experiments; Y.M., H.L., and J.Z. carried out the experiments; L.C. and Z.L. analyzed the experimental results; and L.C. and B.D. wrote and edited the manuscript. All authors have read and agreed to the published version of the manuscript.

Funding

This study was jointly funded by the Central Research Institute of Basic Research and Public Service Special Operations, Chinese Academy of Forestry (grant number CAFYBB2019MA003) and National Natural Science Foundation of China (grant number 31800533).

Data Availability Statement

Not applicable.

Acknowledgments

We would like to thank Guangxi University for their support of sample processing and the Stable Isotope Facility of the University of California for performing the isotope analysis of samples. We appreciate Zhilong Liu and Xuguang Huang for their assistance with the field work. We also thank the two anonymous reviewers for their helpful comments and suggestions.

Conflicts of Interest

The authors declare no conflict of interest.

Appendix A

Table A1. Atom % of 15N in different organs of Betula alnoides plants at four sampling times.
Sampling TimeOrgansF0 TreatmentF10 Treatment
N100N200N400N100N200N400
before transplantingRoot3.31 ± 0.113.85 ± 0.033.47 ± 0.203.31 ± 0.113.85 ± 0.033.47 ± 0.20
Stem3.67 ± 0.083.72 ± 0.112.90 ± 0.093.67 ± 0.083.72 ± 0.112.90 ± 0.09
Leaf3.48 ± 0.033.27 ± 0.132.98 ± 0.123.48 ± 0.033.27 ± 0.132.98 ± 0.12
30 days after transplantingRootnew1.46 ± 0.121.88 ± 0.193.78 ± 0.012.29 ± 0.043.36 ± 0.032.88 ± 0.07
Stemnew1.48 ± 0.091.81 ± 0.054.00 ± 0.032.65 ± 0.083.50 ± 0.042.87 ± 0.03
Leafnew1.37 ± 0.081.60 ± 0.023.88 ± 0.102.64 ± 0.093.49 ± 0.022.75 ± 0.03
Rootold1.86 ± 0.042.09 ± 0.013.78 ± 0.072.58 ± 0.083.31 ± 0.163.01 ± 0.08
Stemold1.93 ± 0.082.12 ± 0.014.00 ± 0.062.85 ± 0.073.55 ± 0.053.12 ± 0.04
Leafold2.39 ± 0.072.61 ± 0.014.16 ± 0.023.17 ± 0.063.76 ± 0.023.48 ± 0.01
60 days after transplantingRootnew1.93 ± 0.142.44 ± 0.053.01 ± 0.100.85 ± 0.071.16 ± 0.061.48 ± 0.09
Stemnew2.03 ± 0.112.67 ± 0.043.19 ± 0.100.76 ± 0.011.02 ± 0.021.35 ± 0.08
Leafnew2.05 ± 0.092.65 ± 0.063.27 ± 0.110.73 ± 0.010.99 ± 0.021.28 ± 0.08
Rootold2.06 ± 0.112.49 ± 0.113.12 ± 0.171.21 ± 0.131.40 ± 0.031.56 ± 0.06
Stemold2.26 ± 0.092.62 ± 0.093.20 ± 0.260.98 ± 0.031.30 ± 0.041.63 ± 0.08
Leafold2.50 ± 0.112.96 ± 0.013.50 ± 0.111.00 ± 0.031.24 ± 0.031.62 ± 0.05
180 days after transplantingRootnew0.62 ± 0.070.61 ± 0.050.62 ± 0.020.48 ± 0.010.66 ± 0.050.60 ± 0.07
Stemnew0.60 ± 0.070.61 ± 0.050.77 ± 0.060.52 ± 0.010.65 ± 0.020.77 ± 0.07
Leafnew0.59 ± 0.110.61 ± 0.040.74 ± 0.050.50 ± 0.010.66 ± 0.020.75 ± 0.09
Rootold1.04 ± 0.091.20 ± 0.151.54 ± 0.150.65 ± 0.020.82 ± 0.020.98 ± 0.11
Stemold0.90 ± 0.091.14 ± 0.131.42 ± 0.190.58 ± 0.000.78 ± 0.061.04 ± 0.07
Leafold0.63 ± 0.070.74 ± 0.060.91 ± 0.070.52 ± 0.010.67 ± 0.030.85 ± 0.09
Rootnew, Stemnew, Leafnew, Rootold, Stemold and Leafold refer to new root, new stem, new leaf, old root, old stem, and old leaf, respectively. Values are mean (n = 3) ± standard errors.

References

  1. Hu, Y.L.; Hu, Y.; Zeng, D.H.; Tan, X.; Chang, S.X. Exponential fertilization and plant competition effects on the growth and N nutrition of trembling aspen and white spruce seedlings. Can. J. For. Res. 2015, 45, 78–86. [Google Scholar] [CrossRef]
  2. Pokharel, P.; Kwak, J.H.; Chang, S.X. Growth and nitrogen uptake of jack pine seedlings in response to exponential fertilization and weed control in reclaimed soil. Biol. Fert. Soils 2017, 53, 701–713. [Google Scholar] [CrossRef]
  3. Salifu, K.F.; Timmer, V.R. Nitrogen retranslocation response of young Picea mariana to nitrogen-15 supply. Soil Sci. Soc. Am. J. 2003, 67, 309–317. [Google Scholar] [CrossRef]
  4. Oliet, J.A.; Tejada, M.; Salifu, K.F.; Collazos, A.; Jacobs, D.F. Performance and nutrient dynamics of holm oak (Quercus ilex L.) seedlings in relation to nursery nutrient loading and post-transplant fertility. Eur. J. For. Res. 2009, 128, 253–263. [Google Scholar] [CrossRef]
  5. Salifu, K.F.; Jacobs, D.F.; Birge, Z.K. Nursery nitrogen loading improves field performance of bareroot oak seedlings planted on abandoned mine lands. Restor. Ecol. 2009, 17, 339–349. [Google Scholar] [CrossRef]
  6. Hong, Z.; Guo, J.; Zhang, N.; Yang, Z.J.; Liu, X.J.; Cui, Z.Y.; Xu, D.P. Polysaccharide, proline, and anti-oxidation enzyme activities of Thailand rosewood (Dalbergia cochinchinensis) seedlings exposed to exponential fertilization. J. For. Res. 2021, 1–13. [Google Scholar] [CrossRef]
  7. Xu, X.; Timmer, V.R. Growth and nitrogen nutrition of Chinese fir seedlings exposed to nutrient loading and fertilization. Plant Soil 1999, 216, 83–91. [Google Scholar] [CrossRef]
  8. Millard, P.; Grelet, G.-A. Nitrogen storage and remobilization by trees: Ecophysiological relevance in a changing world. Tree Physiol. 2010, 30, 1083–1095. [Google Scholar] [CrossRef] [PubMed] [Green Version]
  9. Wei, H.X.; Xu, C.Y.; Ma, L.Y.; Duan, J.; Jia, L.N.; Ren, J. Nitrogen retranslocation, allocation, and utilization in bare root Larix olgensis seedlings. J. For. Res. 2012, 23, 87–94. [Google Scholar] [CrossRef]
  10. Salifu, K.F.; Islam, M.A.; Jacobs, D.F. Retranslocation, plant, and soil recovery of Nitrogen-15 applied to bareroot black walnut seedlings. Commun. Soil Sci. Plan. 2009, 40, 1408–1417. [Google Scholar] [CrossRef]
  11. Jonsdottir, R.J.; Sigurdsson, B.D.; Lindström, A. Effects of nutrient loading and fertilization at planting on growth and nutrient status of Lutz spruce (Picea x lutzii) seedlings during the first growing season in Iceland. Scan. J. For. Res. 2013, 28, 631–641. [Google Scholar] [CrossRef] [Green Version]
  12. Saur, E.; Nambiar, E.; Fife, D.N. Foliar nutrient retranslocation in Eucalyptus globulus. Tree Physiol. 2000, 20, 1105–1112. [Google Scholar] [CrossRef] [PubMed]
  13. Villar-Salvador, P.; Uscola, M.; Jacobs, D.F. The role of stored carbohydrates and nitrogen in the growth and stress tolerance of planted forest trees. New For. 2015, 46, 813–839. [Google Scholar] [CrossRef]
  14. Chen, L.; Wang, C.S.; Dell, B.; Zhao, Z.G.; Guo, J.J.; Xu, D.P.; Zeng, J. Growth and nutrient dynamics of Betula alnoides seedlings under exponential fertilization. J. For. Res. 2018, 29, 111–119. [Google Scholar] [CrossRef]
  15. Wang, C.; Zhao, Z.; Zeng, J.; Guo, J.; Sha, E.; Guo, W.; Zeng, J.; Zheng, H. Relationship between planting density and tree growth process of Betula alnoides mid-young plantations in Pingxiang, Guangxi. For. Res. 2013, 26, 257–262. (In Chinese) [Google Scholar]
  16. Tang, C.; Wang, C.S.; Pang, S.J.; Wang, H.; Zeng, J. Assessing soil nutrient status and its relationship with site productivity of Betula alnoides plantations in Daqingshan Mountains, Guangxi. For. Res. 2018, 31, 164–169. (In Chinese) [Google Scholar]
  17. Wang, H.; Zeng, J.X.; Luo, B.G.; Guo, J.J.; Wang, C.S.; Zhao, Z.G.; Zeng, J. Multiple-trait combined selection of superior Betula alnoides clones in eastern Guangdong. J. Cent. South Univ. For. Technol. 2017, 37, 72–75, 84. (In Chinese) [Google Scholar]
  18. Chen, H.H.; Cai, D.X.; Jia, H.H.; Wang, X.N.; Guo, W.F.; Liu, Z.L.; Nong, S.X.; Meng, C.L.; Ma, Y. Technical Regulation for Betula alnoides Clones Propagation via Tissue Culture. LY/T 2620-2016; Chinese Academy of Forestry: Beijing, China, 2016; pp. 2–3. (In Chinese) [Google Scholar]
  19. Birge, Z.K.D.; Salifu, F.; Jacobs, D.F. Modified exponential nitrogen loading to promote morphological quality and nutrient storage of bareroot-cultured Quercus rubra and Quercus alba seedlings. Scan. J. For. Res. 2006, 21, 306–316. [Google Scholar] [CrossRef]
  20. Pokharel, P.; Chang, S.X. Exponential fertilization promotes seedling growth by increasing nitrogen retranslocation in trembling aspen planted for oil sands reclamation. For. Ecol. Manag. 2016, 372, 35–43. [Google Scholar] [CrossRef]
  21. Luoranen, J.; Rikala, R. Nutrient loading of Norway spruce seedlings hastens bud burst and enhances root growth after outplanting. Silva Fenn. 2011, 45, 319–329. [Google Scholar] [CrossRef] [Green Version]
  22. Everett, K.T.; Hawkins, B.J.; Kiiskila, S. Growth and nutrient dynamics of Douglas-fir seedlings raised with exponential or conventional fertilization and planted with or without fertilizer. Can. J. For. Res. 2007, 37, 2552–2562. [Google Scholar] [CrossRef]
  23. Way, D.A.; Seegobin, S.D.; Sage, R.F. The effect of carbon and nutrient loading during nursery culture on the growth of black spruce seedlings: A six-year field study. New For. 2007, 34, 307–312. [Google Scholar] [CrossRef]
  24. Heiskanen, J.; Lahti, M.; Luoranen, J.; Rikala, R. Nutrient loading has a transitory effect on the nitrogen status and growth of outplanted Norway spruce seedlings. Silva Fenn. 2009, 43, 249–260. [Google Scholar] [CrossRef] [Green Version]
  25. Close, D.C.; Bail, I.; Hunter, S.; Beadle, C.L. Effects of exponential nutrient-loading on morphological and nitrogen characteristics and on after-planting performance of Eucalyptus globulus seedlings. For. Ecol. Manag. 2005, 205, 397–403. [Google Scholar] [CrossRef]
  26. Hawkins, B.J.; Burgess, D.; Mitchell, A.K. Growth and nutrient dynamics of western hemlock with conventional or exponential greenhouse fertilization and planting in different fertility conditions. Can. J. For. Res. 2005, 35, 1002–1016. [Google Scholar] [CrossRef]
  27. Salifu, K.F.; Timmer, V.R. Nutrient retranslocation response of seedlings to nitrogen supply. Soil Sci. Soc. Am. J. 2001, 65, 905–913. [Google Scholar] [CrossRef]
  28. Salifu, K.F.; Apostol, K.G.; Jacobs, D.F.; Islam, M.A. Growth, physiology, and nutrient retranslocation in 15N fertilized Quercus rubra seedlings. Ann. For. Sci. 2008, 65, 101. [Google Scholar] [CrossRef] [Green Version]
Figure 1. The main effects of nutrient loading (N) and fertilization at transplanting (F) on Betula alnoides height, root collar diameter (RCD), root length, and root area. Different lowercase (a, b, c) and uppercase (A, B) letters represent significant differences among nutrient loading and between transplant fertilization treatments, respectively, within each sampling time at p < 0.05 according to the Duncan’s multiple range test. Vertical bars are standard errors of the means (n = 6 in (ad) or n = 9 in (eh)). See Table 3 for ANOVA summary.
Forests 12 01603 g001
Figure 2. The main effects of nutrient loading (N) and fertilization at transplanting (F) on Betula alnoides dry mass in plant tissues. Different lowercase (a, b, c) and uppercase (A, B) letters represent significant differences among nutrient loading and between transplanting fertilization treatments, respectively, within each sampling time at p < 0.05, according to Duncan’s multiple range test. Vertical bars are standard errors of the means (n = 6 in (ad) or n = 9 in (eh)). See Table 3 for ANOVA summary.
Forests 12 01603 g002
Figure 3. The main effects of nutrient loading (N) and fertilization at transplanting (F) on Betula alnoides nitrogen concentrations in plant tissues. Different lowercase (a, b, c) and uppercase (A, B) letters represent significant differences among nutrient loading and between transplanting fertilization treatments, respectively, within each sampling time at p < 0.05 according to Duncan’s multiple range test. Vertical bars are standard errors of the means (n = 6 in (ad) or n = 9 in (eh)). See Table 3 for ANOVA summary.
Forests 12 01603 g003
Figure 4. The main effects of nutrient loading (N) and fertilization at transplanting (F) on Betula alnoides 15N retranslocated into new roots (a,d), new stems (b,e) and new leaves (c,f). Different letters represent significant differences among treatments within each sampling time at p < 0.05 according to Duncan’s multiple range test. Vertical bars are standard errors of the means (n = 6 or 9). See Table 3 for ANOVA summary.
Forests 12 01603 g004
Table 1. Weekly exponential nitrogen application amount (mg N/plant), including 15N-urea during nursery production.
Treatment1st Week2nd Week3rd Week4th Week5th Week6th Week7th Week8th Week
N1000.180.280.420.650.991.512.323.55
N2000.210.340.550.891.452.353.816.18
N4000.240.420.721.232.113.626.2210.69
Treatment9th Week10th Week11th Week12th Week13th Week14th Week15th Week16th Week
N1005.438.3112.7312.7312.7312.7312.7312.73
N20010.0216.2426.3326.3326.3326.3326.3326.33
N40018.3631.5354.1454.1454.1454.1454.1454.14
Table 2. Fertilization schedule for nutrient-loaded Betula alnoides plants in the nursery.
Week of FertilizationType of Fertilizer AppliedDose of Fertilizer Applied
1–10th weekAll plants received a water-soluble nutrient solution (Plant Products 20:20:20 (N:P2O5:K2O) plus micro-nutrients, Co. Ltd., Brampton, Ontario, Canada).The weekly amount of fertilizer applied per plant was calculated according to the weekly nitrogen applied amount (Table 1) and nitrogen proportion (20%) of the fertilizer. The concentration of fertilizer ranged from 0.01% to 0.25% as the plants grew.
11–16th weekHalf of the plants (540 plants) were supplied with a solution of 0.50% 15N-urea (atom 5.17%, Shanghai Stable Isotope Engineering Technology Research Center) and 0.44% KH2PO4 (52% P2O5). The remaining unlabeled plants (540 plants) were given the same amount and concentration of normal urea and KH2PO4 as the labeled plants.The weekly amounts of 15N-urea and urea applied per plant were calculated according to the amount of nitrogen applied weekly (Table 1) and the nitrogen proportion (46.4%) of the fertilizer.
The weekly potassium dihydrogen phosphate applied per plant was calculated based on the amount of nitrogen applied weekly (Table 1), N:P2O5 ratio (20:20), and P2O5 proportion (52%) of the fertilizer.
Table 3. ANOVA results of nutrient loading (N) and subsequent effects of N and fertilization at transplanting (F) on Betula alnoides growth, nitrogen concentration, and 15N retranslocated into new organs.
SourceHeightRCDRoot
Length
Root
Area
Dry MassNitrogen
Concentration
15N Retranslocated
RootStemLeafPlantRootStemLeafNew RootNew StemNew Leaf
Nursery culture phase
N<0.001<0.0010.0020.0200.0230.054<0.0010.001<0.001<0.001<0.001---
Transplanting phase
30 days
N<0.001<0.001<0.001<0.001<0.0010.001<0.001<0.001<0.0010.010<0.001<0.001<0.001<0.001
F0.1700.4980.3380.9850.1330.9110.8910.7730.0500.0300.0580.0240.0130.027
N × F0.2180.7740.5230.4980.0040.7650.4990.361<0.001<0.001<0.001<0.001<0.001<0.001
60 days
N<0.001<0.001<0.001<0.0010.070<0.0010.2490.003<0.0010.185<0.001<0.001<0.001<0.001
F<0.001<0.0010.0030.1240.8150.0170.0160.031<0.0010.0070.0020.0020.0020.002
N × F0.0390.1380.0110.0120.2730.4600.6720.9270.5410.009<0.0010.0430.0090.006
180 days
N0.0010.004<0.001<0.0010.4490.1610.4740.2190.0510.5300.2440.3760.0050.005
F<0.001<0.0010.0420.0770.0100.0130.0440.0150.5000.6320.1420.8190.7560.554
N × F0.0930.193<0.0010.0120.4900.1410.7960.2560.9780.8880.4220.4360.5840.480
RCD = root collar diameter. Bold indicates that the analysis of variance is significant.
Table 4. Interaction effects of nutrient loading (N) and fertilization at transplanting (F) on Betula alnoides growth, nitrogen concentration, and 15N retranslocated into new organs at three sampling times.
TreatmentF0F10F0F10F0F10
30d root dry mass (g·plant−1)60d root length (cm·plant−1)60d root area (cm2·plant−1)
N1000.43 ± 0.00 b0.55 ± 0.03 b2147 ± 92 b2043 ± 72 b427 ± 19 b471 ± 19 b
N2000.55 ± 0.05 a0.74 ± 0.02 a2689 ± 114 a3339 ± 175 a692 ± 43 a802 ± 50 a
N4000.42 ± 0.01 b0.33 ± 0.04 c2562 ± 145 a3475 ± 139 a617 ± 46 a896 ± 48 a
60d height (cm)180d root length (cm·plant−1)180d root area (cm2·plant−1)
N10034.7 ± 0.7 b46.6 ± 0.9 b2437 ± 97 b2502 ± 193 b516 ± 31662 ± 63 b
N20038.6 ± 0.7 a54.8 ± 1.2 a2999 ± 120 a4079 ± 181 a664 ± 551198 ± 126 a
N40035.8 ± 1.1 b47.5 ± 1.7 b2654 ± 165 ab4007 ± 131 a620 ± 44982 ± 54 a
30d root N concentration (mg·g−1)30d stem N concentration (mg·g−1)30d leaf N concentration (mg·g−1)
N10017.74 ± 0.3712.79 ± 0.46 c15.35 ± 0.358.97 ± 0.47 c27.30 ± 0.15 a18.80 ± 0.29 b
N20016.07 ± 0.4415.74 ± 0.37 b14.38 ± 0.6612.36 ± 0.45 b24.34 ± 0.12 b21.20 ± 0.16 b
N40017.77 ± 0.7817.67 ± 0.20 a13.45 ± 0.5115.82 ± 0.77 a24.40 ± 0.33 b28.86 ± 1.40 a
60d root N concentration (mg·g−1)60d stem N concentration (mg·g−1)60d leaf N concentration (mg·g−1)
N100--5.92 ± 0.30 b12.21 ± 0.209.14 ± 0.22 c21.90 ± 0.32 b
N200--6.80 ± 0.21 b11.46 ± 0.3011.08 ± 0.35 b24.04 ± 0.34 a
N400--8.04 ± 0.40 a11.38 ± 0.7315.37 ± 0.57 a22.98 ± 0.64 ab
30d 15N retranslocted into new roots (%)30d 15N retranslocted into new stems (%)30d 15N retranslocted into new leaves (%)
N10034 ± 4 b61 ± 2 b34 ± 4 b73 ± 4 b30 ± 3 b72 ± 4 c
N20049 ± 6 b99 ± 3 a47 ± 0 b103 ± 3 a39 ± 1 b104 ± 3 a
N400131 ± 5 a95 ± 5 a139 ± 6 a95 ± 4 a134 ± 5 a90 ± 3 b
60d 15N retranslocted into new roots (%)60d 15N retranslocted into new stems (%)60d 15N retranslocted into new leaves (%)
N10049 ± 5 c13 ± 2 c52 ± 4 c10 ± 0 c53 ± 4 c9 ± 0 c
N20068 ± 4 b24 ± 3 b76 ± 4 b19 ± 1 b75 ± 5 b18 ± 1 b
N400100 ± 6 a40 ± 2 a107 ± 5 a35 ± 2 a110 ± 6 a32 ± 2 a
Data are means ± standard errors (n = 3 in root dry mass, N concentration, and 15N retranslocated; n = 15 in root length and root area; n = 45 in height). Different lowercase (a, b, c) letters represent significant differences among nutrient loading treatments within each transplanting fertilization at p < 0.05, according to Duncan’s multiple range test. “-” represents no significant interaction effect of nutrient loading and transplanting fertilization. See Table 3 for ANOVA summary.
Publisher’s Note: MDPI stays neutral with regard to jurisdictional claims in published maps and institutional affiliations.

