Article

Exploring the Determinants of Urban Green Space Utilization Based on Microblog Check-In Data in Shanghai, China

1
Department of Landscape Architecture, School of Design, Shanghai Jiao Tong University, Shanghai 200240, China
2
Department of Urban Planning, School of Architectural and Artistic Design, Henan Polytechnic University, Jiaozuo 454000, China
3
School of Sustainability, College of Global Futures, Arizona State University, Tempe, AZ 85281, USA
*
Author to whom correspondence should be addressed.
Submission received: 13 November 2021 / Revised: 12 December 2021 / Accepted: 14 December 2021 / Published: 16 December 2021
(This article belongs to the Special Issue Urban Forests and Landscape Ecology)

Abstract

:
Urban green space has significant social, ecological, cultural and economic value. This study uses social media data to examine the spatiotemporal utilization of major parks in Shanghai and explore the determinants of their recreational attraction. Methods: Based on microblog check-in data between 2012 and 2018 across 17 parks in Shanghai, we investigated the patterns at different temporal scales (weekly, seasonal and annual) and across workdays and weekends by using log-linear regression models. Results: Our findings indicate that both internal and external factors affect park utilization. In particular, the presence of sports facilities significantly contributes to higher visit frequency. Factors such as the number of subway stations nearby, scenic quality and popularity have a positive impact on check-in numbers, while negative factors affecting park use are number of roads, ticket price and average surrounding housing price. Across different temporal scales, the use patterns of visitors have obvious seasonal and monthly tendencies, and the differences of workday and weekend models lie in external factors’ impacts. Conclusions: In order to achieve the goal of better serving the visitors, renewal of urban green spaces in megacities should consider these influential factors, increase sports facilities, subway stations nearby and improve scenic quality, popularity and water quality. This study on spatiotemporal utilization of urban parks can help enhance comprehensive functions of urban parks and be helpful for urban renewal strategies.

1. Introduction

Urban green space plays a crucial role in urban residents’ leisure and recreational activities [1]. Services provided by urban green space contribute to both physical and mental health of park users [2,3,4], enhance the value of surrounding real property [5] and mitigate the effect of urban heat islands [6,7]. For megacities such as Shanghai, there are few opportunities to create new urban green space in its core urban area due to high building density. In order to maximize the benefits of urban green space, it is crucial for urban planners and decision makers to improve the existing parks to better serve citizens and encourage park utilization. To achieve this goal, it is necessary to understand the current situation of park utilization and its determinants.
Previous studies have taken both qualitative and quantitative approaches to investigate urban green space utilization. Qualitative studies such as interviews, observations and records often involve purposeful sampling of participants and settings [2] and convert the interpretations from language and actions to data and conclusions. Surveys are the most popular approach used in quantitative studies to acquire park use data [8,9]. A combination of behavior mapping and GIS (Geographic Information System) techniques can be used to help generate park use patterns by using spatial analysis and visualization [10]. These methods can be used for in-depth evaluation of recreation space, recreation type and behavior in urban parks. Senetra et al. (2018) analyzed spatial distribution, influence and quality of urban green space, finding that green spaces were unevenly distributed and not all residents have equal access to high-quality public greens [11]. However, it is difficult to conduct comprehensive evaluation of multiple urban parks at a broader scale due to intensive labor requirements and the short time span of the survey data.
Based on findings from previous studies, major factors that influence urban green space utilization include both internal and external characteristics of the parks. The internal characteristics of urban parks reflect the quality of parks, which is related to the planning and design, construction quality and maintenance management of parks. A review study by McCormack et al. (2010) indicates that safety, aesthetics, amenities and maintenance are important for encouraging park use. Several studies found that well-designed public open space can promote physical activity in the community and may contribute to the health of local residents [10,12]. Research has shown that the quality of paths in parks, the allocation of infrastructure, the proportion of water in green space and the surrounding environment, among many other factors, have impacts on the population’s physical activity. Meanwhile, aesthetic value, safety and other indicators also have positive impacts [13,14]. Besenyi et al.’s research has shown that there is a positive correlation between the environmental elements of urban parks and residents’ outdoor physical exercise; that is, parks and green spaces that are high quality of larger scales have a positive impact on people’s physical activity [8].
The external factors of a park are mainly related to the location, traffic convenience, economic development status and population density as well as land use types in the surrounding areas. Accessibility of parks is a very influential determinant [2]. Besenyi et al., based on an online survey, concluded that higher accessibility would encourage people to engage in physical activity [8]. Research has shown perceptions of park availability and usage by friends are associated with greater park use [8]. Few studies have reported on the impact of external factors of parks use in addition to accessibility; however, subjective outdoor thermal comfort has been found to impact urban park utilization in Hong Kong [15].
Over the past decade, a considerable amount of data on peoples’ location and movement have been collected due to mobile communication devices, position perception technologies and social media. Social media data are widely used, including that from platforms such as Twitter [16,17], Foursquare, Sina microblog [18,19,20], Flickr [21] and Panoramio [22]. Compared with data obtained through surveys, digital data include the advantage of having a larger amount of information that is highly accurate and richer. This provides opportunities for innovation in urban research. Existing studies have identified the practical significance of using social media data analysis in urban residents’ activities. Social media data can be used as a valuable data source for urban space research and analysis of residents’ activities and, thus, address shortcomings such as small sample size and short time span in survey research.
Recent research conducted spatiotemporal analysis on urban park recreation verified the feasibility of using Big Data. Most relevant applications of social media data mainly explore the spatial pattern of urban residents’ gathering, dispersion and flow relating with time, space, activities and several other aspects [23,24]. The applications of social media data in urban areas are mainly based on GIS platforms, using cluster analysis, kernel density analysis and other spatial analysis and calculation methods to identify the spatial structure and characteristics [25]. The hourly real-time Tencent user density (RTUD) data from social media are used to analyze the spatiotemporal distribution of urban park users in the study by Chen et al., and the factors that may be associated with the user density in urban parks were studied by a group of linear regression models in Shenzhen, China [5]. Roberts proposed a method of crowdsourcing in urban green space using Twitter data and identified the events in urban green space that bring cultural benefits, such as individual and community identity, as well as cultural activities participation [26]. In Spain, popular public spaces in the urban fabric of the city of Murcia were studied, with data sources from Foursquare and Twitter [27]. Roberts et al. used Twitter data to assess the variance of physical activity engagement between summer and winter seasons [28]. Another study analyzed mobile phone data derived from 10 million daily active users to explore spatiotemporal activity patterns of users in Central Park, New York, USA, and found that regions with established amenities and points of interest demonstrate a higher record of shared experience [29].
However, most previous social media studies focused on spatiotemporal analysis and city-scale issues rather than exploring the determinants of urban parks utilization. Using social media data, this paper explores the determinants of urban park utilization. Based on our findings, we propose optimization countermeasures, suggestions for the planning and design of the parks in terms of each determinant and the advantages and shortcomings of social media data in research of urban public space service functions.
The purpose of this study is to take advantage of social media data to indicate the internal and external characteristic influencing factors of urban parks on park utilization. Based on the interactive relationship between recreation space and environmental behavior, influencing factors of the use of public green space in a high-density metropolis can be identified. This puts forward the corresponding urban renewal optimization countermeasures, which also has reference significance for planning and design of urban green space in other megacities.

2. Materials and Methods
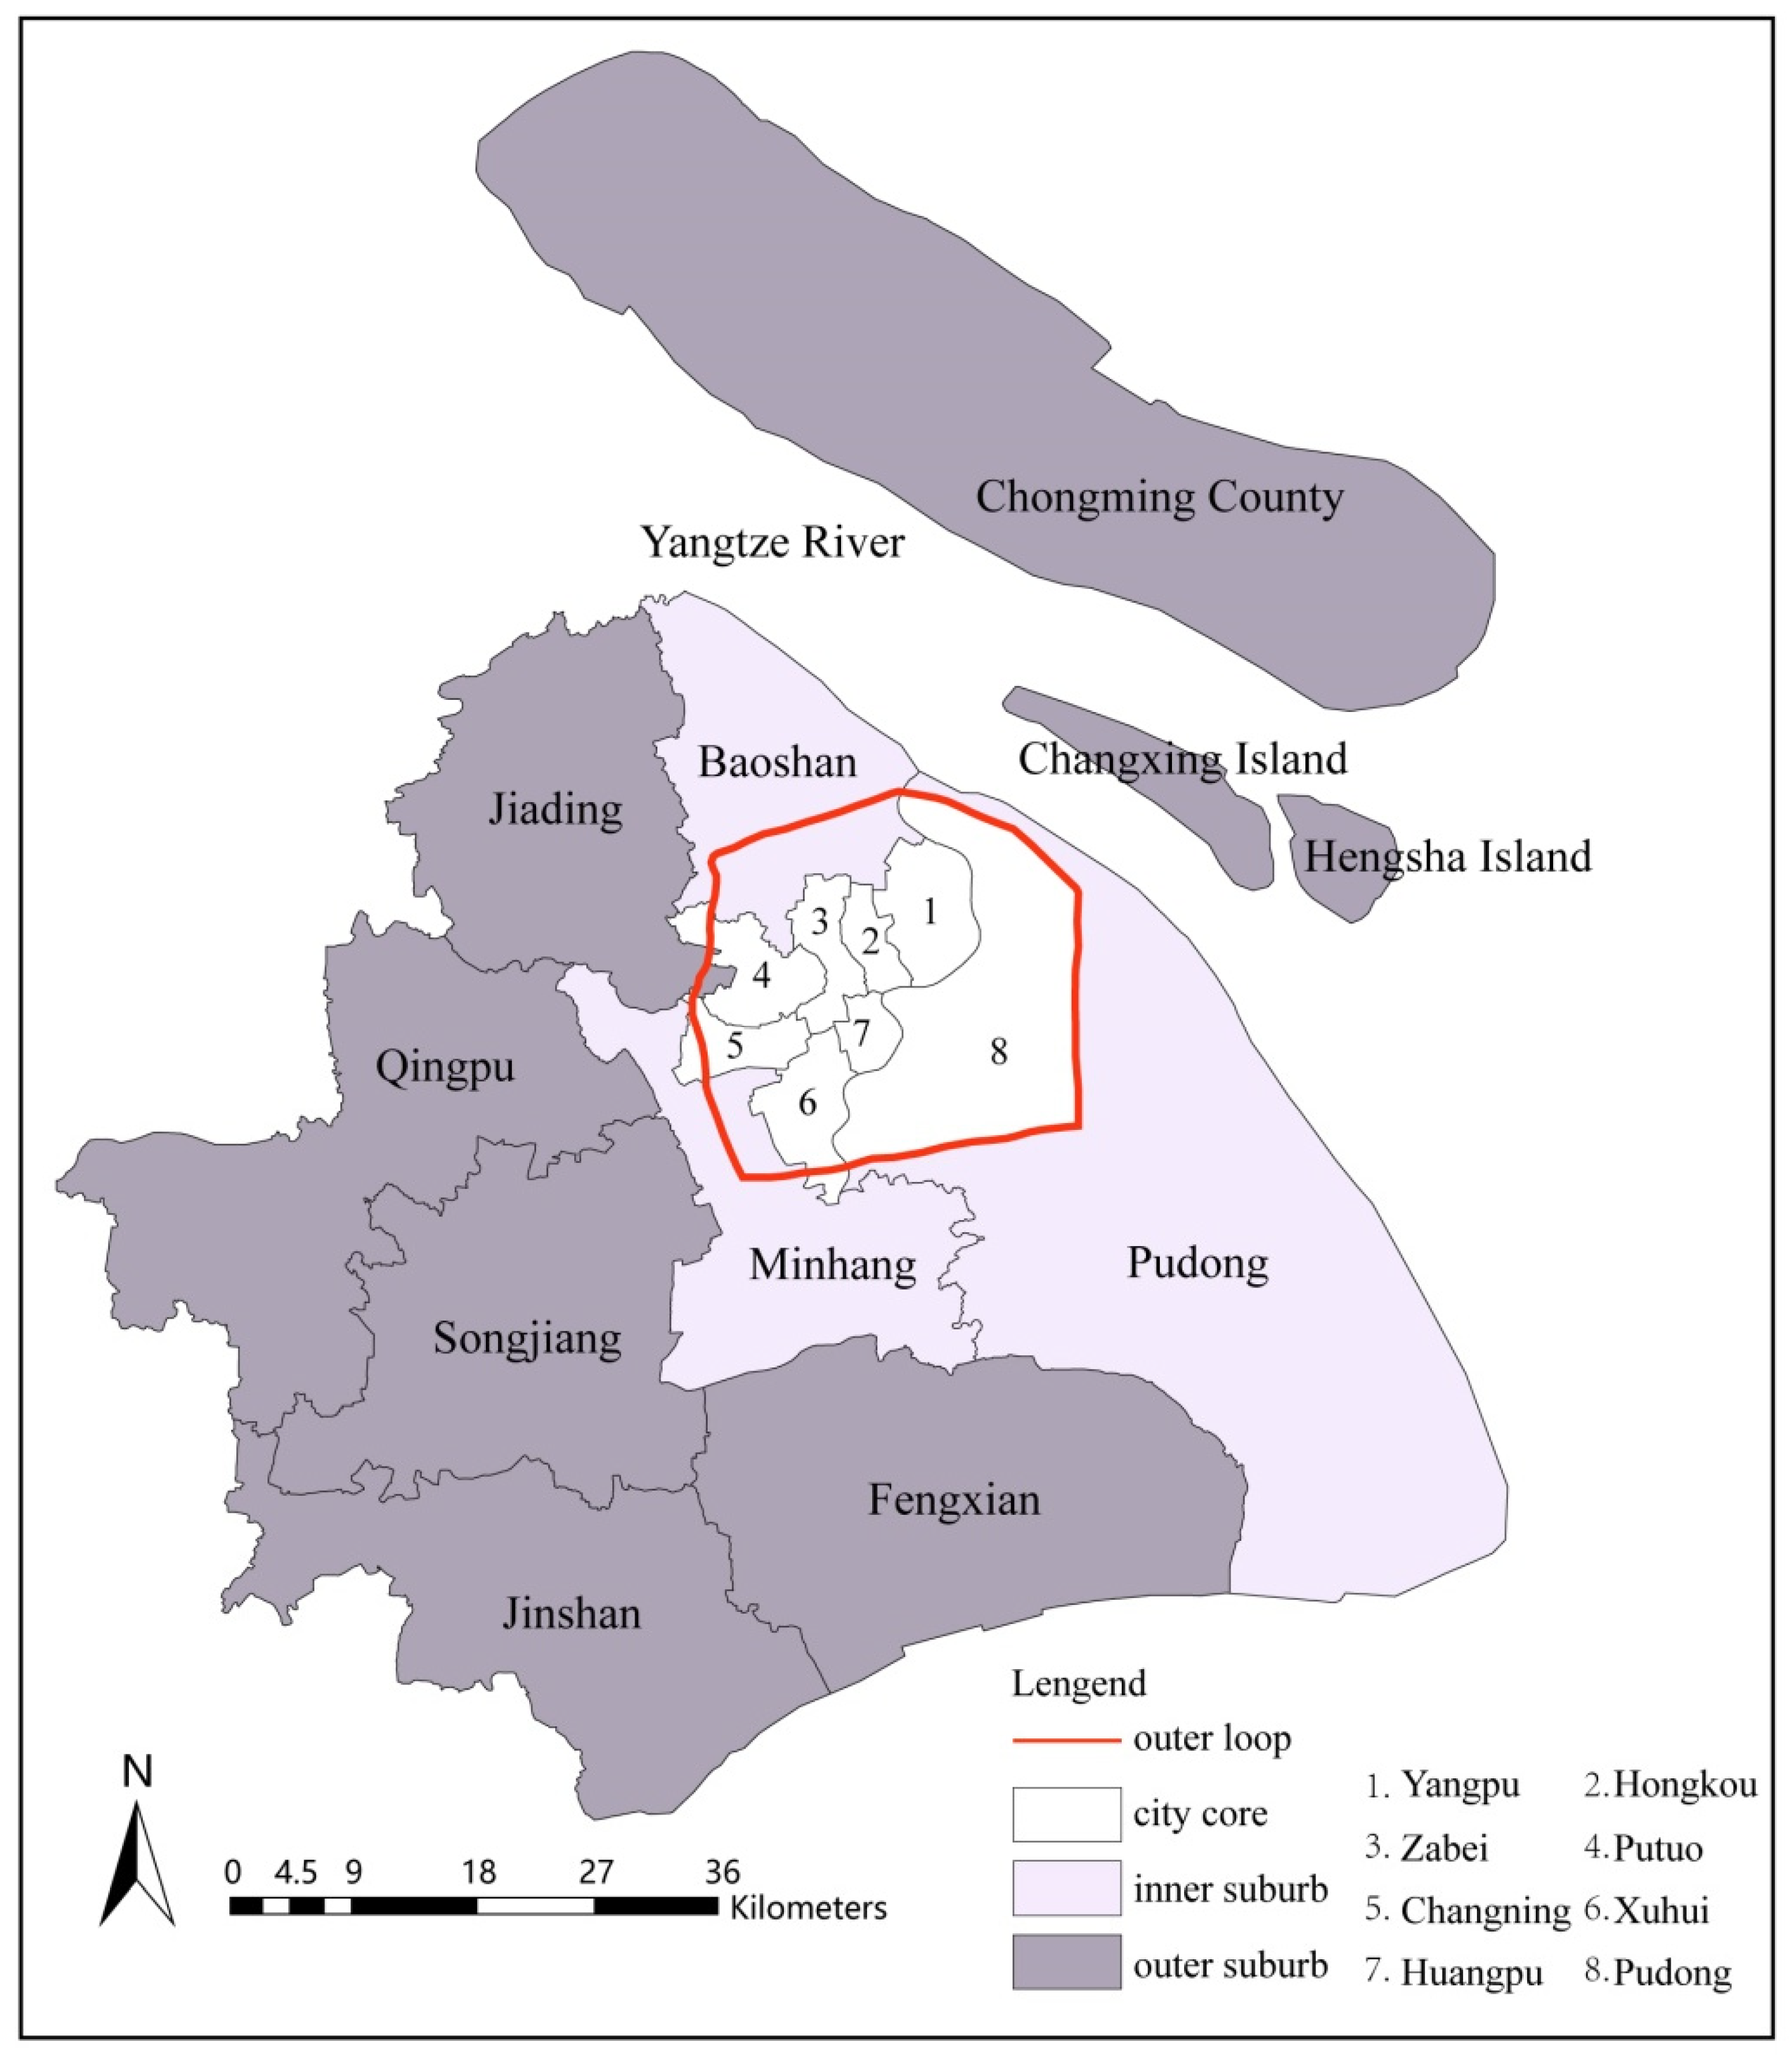
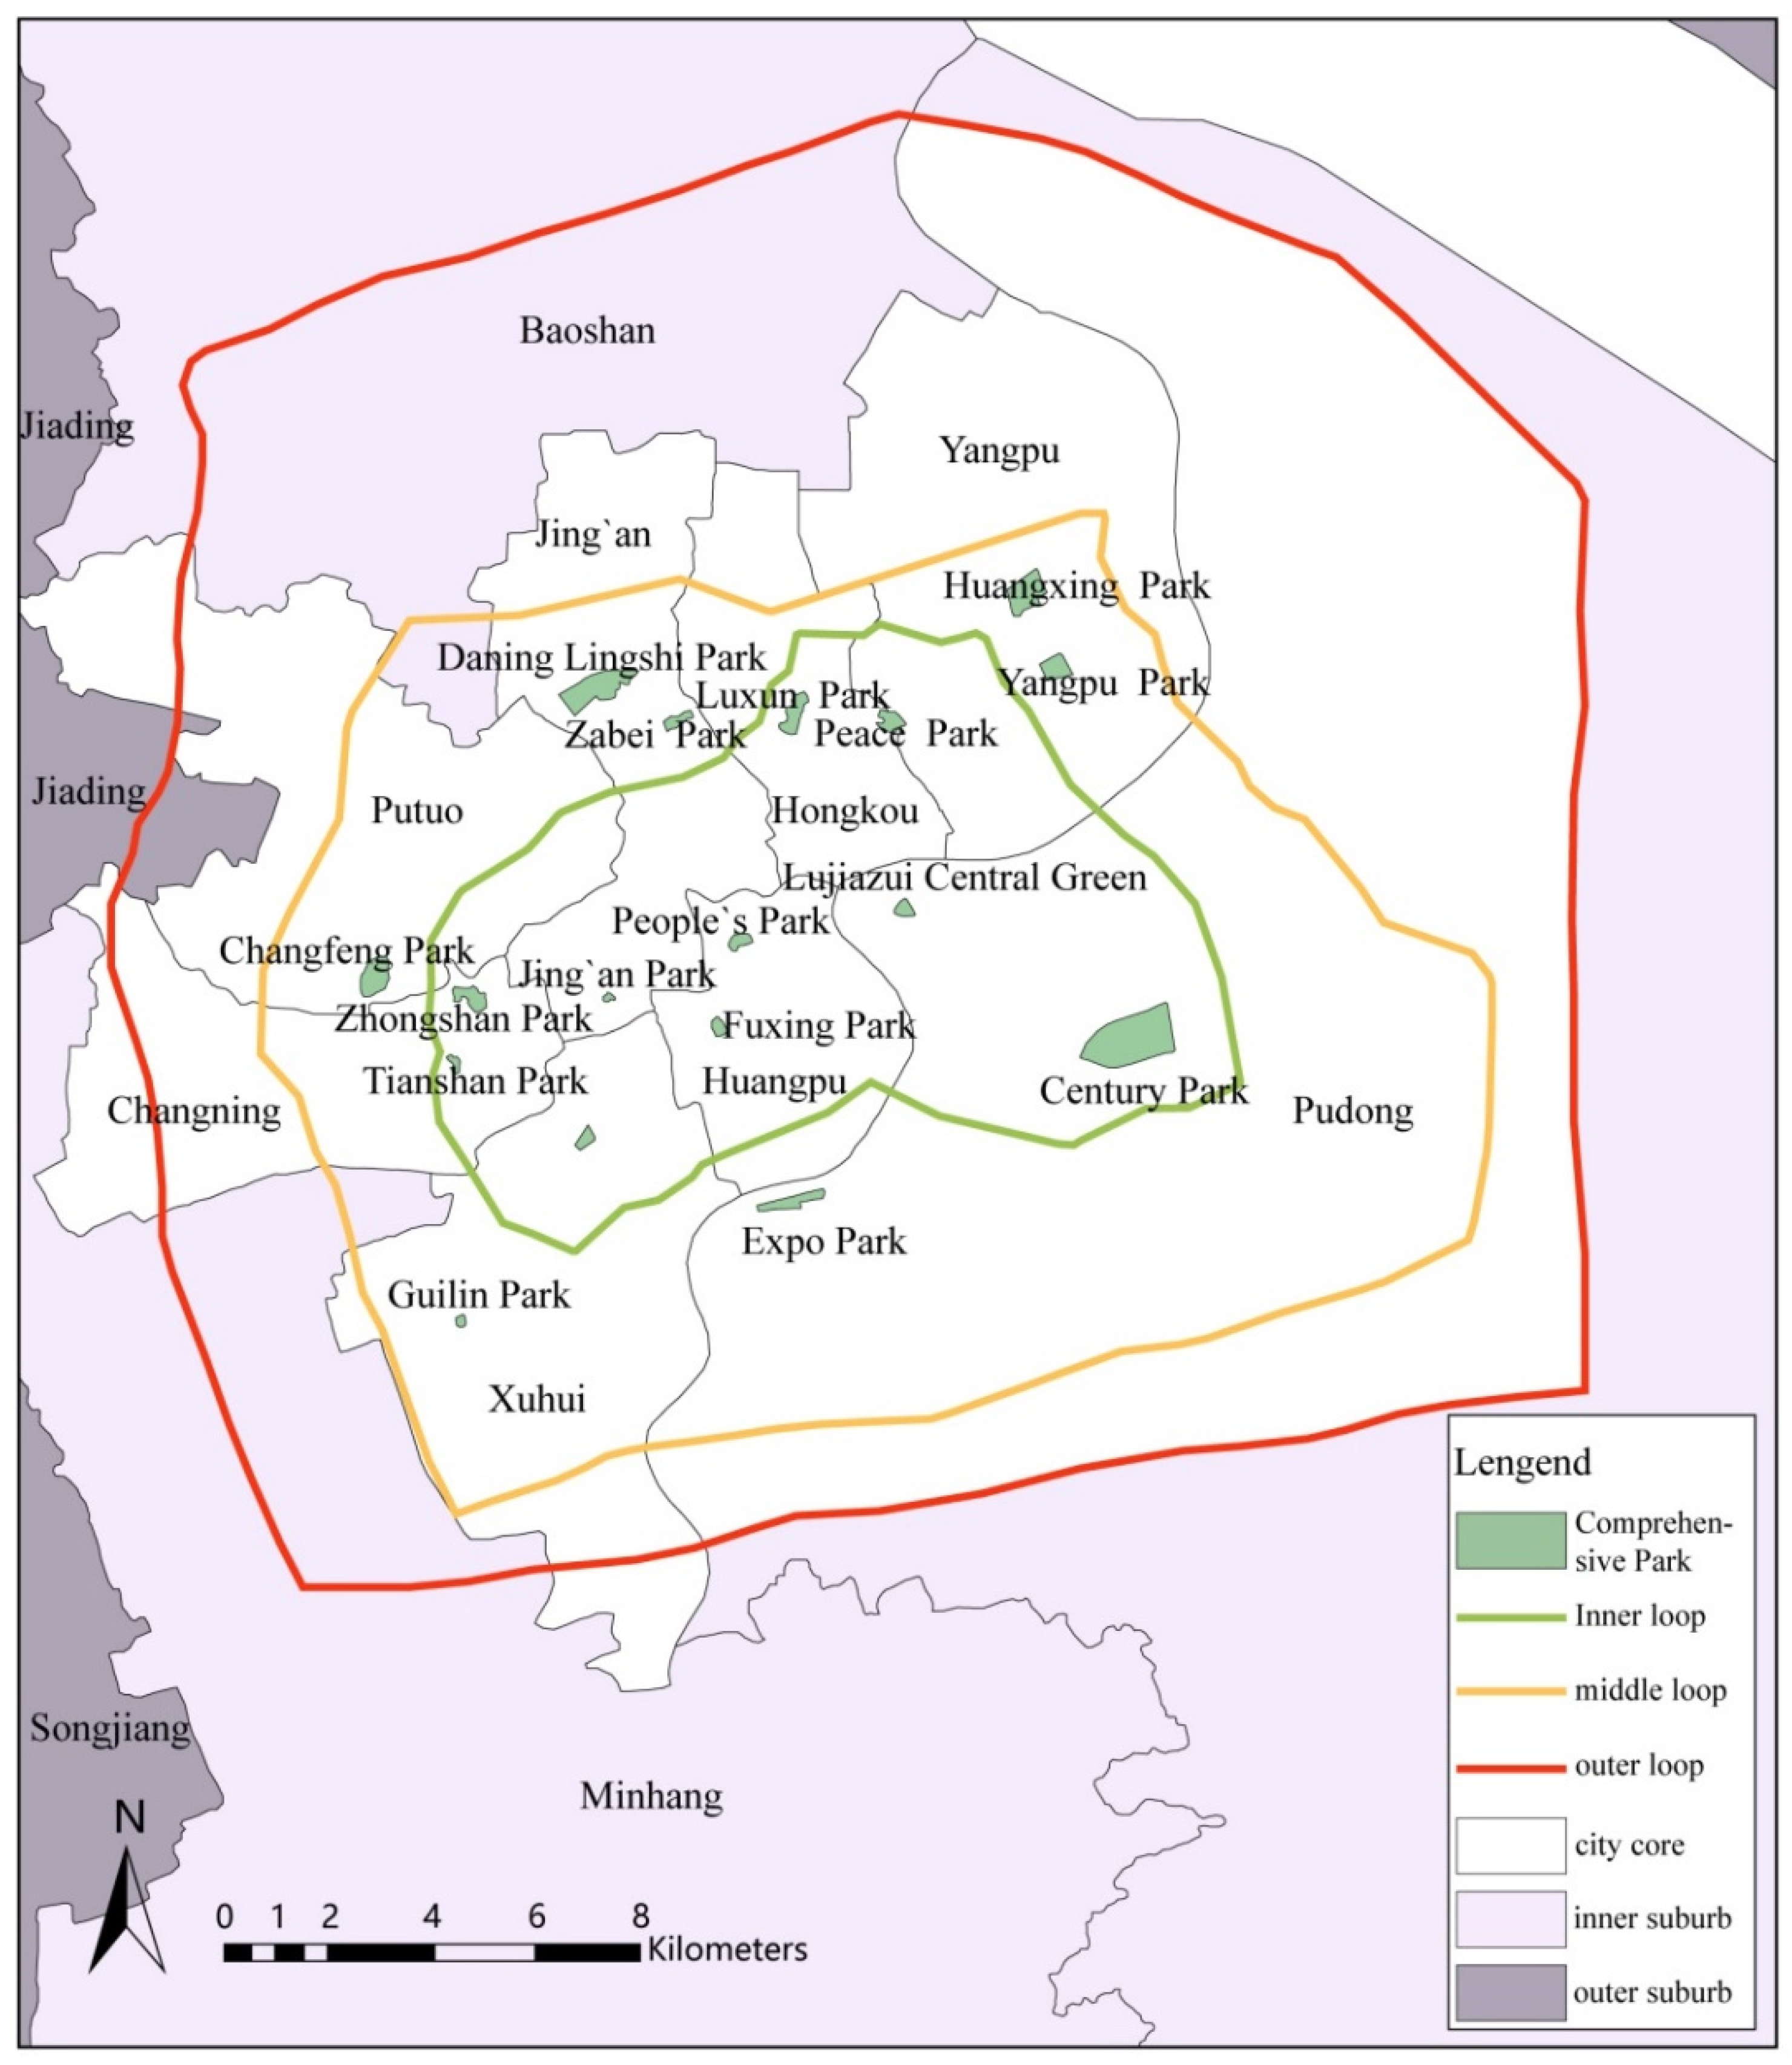
2.1. Study Area

In 2020, Shanghai had a total population of 24 million, and the per capita area of park green space was 8.5 square meters. Urban public green space is a scarce commodity in the high-density urban center of Shanghai. There are at least 2–5 comprehensive parks in each administration district, which mainly serve the residents of the district and attract visitors from other districts as well. These parks generally cover an area of more than 5 hectares and have a large number of visitors. They have very important social, ecological and recreational services. Previous studies related to urban green spaces focused on spatial layout and accessibility [8]. However, the urban layout of Shanghai has been basically stable and green space is in the stage of slow growth. We should review green spaces from the perspective of urban renewal and micro design. Social media data provide a wide range and high amount of data for the study of public space in a high-density metropolis such as Shanghai and help to scientifically analyze the influencing factors of urban park green space use.
In this research, we studied the central area of Shanghai, China. According to the “Master Urban Planning of Shanghai,” the central area of Shanghai is within the outer ring road, with an area of about 660 square kilometers (as shown in Figure 1, including Zone 1 to Zone 8, and Table 1).
Using the “Regulations on Administration of Parks in Shanghai,” “Guidance on the Implementation of Classification and Grading of Urban Parks in Shanghai (trial)” and “Classification Standards of Urban Green Space (by central government),” we assessed the urban parks in the central area of Shanghai from 3 aspects, namely park type, park area and park influence. For park type, we chose comprehensive parks rather than rural parks; for park area, most of parks we chose had an area large than 5 ha; and for park influence, parks with diverse facilities for recreation and with a certain number of user in terms of microblog check-in data were used. We then identified 17 comprehensive parks as our research subjects (Figure 2).

2.2. Selection of Dependent Variable

Sina microblog is one of the social network platforms with the largest number of users in China. According to the 2017 microblog user development report released by the microblog data center, the number of monthly active users on the microblog totaled at 376 million as of September 2017 (https://data.weibo.com/report/reportDetail?id=404, last accessed date (10 December 2021)). The check-ins in the microblog are used as dependent variable and completely records the relevant contents, including geographic information (latitude and longitude coordinates), time, texts and sex of microblog users, reflecting part of the spatiotemporal behavior of users in the city. From the texts of microblog users, it can be found that most of them visited parks for recreation, socialization and relaxation.

2.3. Data Collection

This paper uses Sina microblog check-in data (from the time period 1 January 2012 to 30 June 2018), obtained through the Sina microblog API (Application Programming Interface Application Data Interface); Shanghai downtown comprehensive park data and house price transaction data used in this study were obtained by using web crawler; Shanghai administrative boundary and Shanghai central comprehensive parks data were from the official website of Shanghai Greening and Urban Management Bureau. Parks are classified into two-star, three-star, four-star and five-star by Shanghai Greening and Appearance Bureau, which is the meaning of Park Ranking in Table 1. Number of Sports Venues was counted as number of sports and fitness venues in each park, including trails, basketball courts, tennis courts, football courts and other sports venues (1 point per item). Popularity is the average number of internet users searching park names by using Baidu over a certain period of time. Scores of Scenic Quality given for the landscape effect of the comprehensive park can be divided into 5 levels: extremely poor (1 point), poor (2 points), general (3 points), good (4 points) and great (5 points). Water area (ha) means the area of water bodies in each park. Green Coverage Ratio (%) means the vertical projection area of vegetation in each park.

Quantification of Variables

A total of 13 independent variables were selected to quantify the check-ins. Summary statistics of the variables are included in Table 2.

2.4. Research Design

In this study, we collected 214,068 Sina microblog check-in points in 17 comprehensive parks of central Shanghai from 2012 to 2018, among which 210,993 of points are valid (removing those with missing values). Workday and weekend data are separately analyzed to determine differences of park utilization.
The spatiotemporal distribution of microblog checked-ins were analyzed at various temporal scales, such as annual, monthly and intra-day scales, to help identify potential determinants of park use. The spatial and vector data in 17 studied comprehensive parks, the geographic coordinate information in the Sina microblog check-ins and the data on road density, public transportation number and housing price around the parks were input into GIS 10.6 and analyzed by using spatial analysis methods.
In this study, Sina microblog check-ins in comprehensive parks were used as the quantitative indicator of park use, while green coverage ratios, ticket price, area of park, area of water, popularity (Baidu Index), number of bus stations, average housing prices, area of commercial lands, scenic quality, parking ranking, number of sports venues and number of roads were used as the independent variables for analysis with multivariate regression models.
The urban parks utilization data were classified into weekday use data and weekend use data, and the check-ins were divided into yearly, seasonal and monthly groups, which served as the dependent variables of the subsequent stepwise regression model.

2.5. Model Selection

In this study, four linear regression models were considered, which included linear form, logarithmic form, logarithmic linear form and semi-logarithmic form, with the selected variables to test which is the most suitable model. Since some independent variables were coded to have a value of 0 to 1, only linear form and log-linear form were tested. Table 3 indicates that the log-linear model has the highest degree of fitting and the strongest explanatory power. Therefore, log-linear regression was chosen to carry out the multivariate linear regression analysis of comprehensive parks utilization.

Dummy Variables

From descriptive spatiotemporal distribution of visitors’ analysis, we found that year, season and month contributed to the total check-ins of visitors to comprehensive parks. Therefore, dummy variables were created to identify the influences by yearly, seasonal and monthly factors.

3. Results

Table 4 shows yearly, seasonal and monthly regression results of comprehensive park utilization models using Microblog check-ins from 2012 to 2018.

3.1. Yearly Comprehensive Park Utilization Model Results

A total of 102 independent variables were calculated in the yearly comprehensive park utilization model. The correlation coefficient R is 0.777, the judgment coefficient R2 is 0.604 and the adjusted R2 is 0.558.
According to Table 4, the most influential determinant is the number of sports venues, followed by average housing price, number of roads, area of commercial lands, number of subway stations and area of water. The regression results shows that yearly average check-ins will increase 124% for every increase in the number of sports venues; with every CNY 1000 increase in average house price around the parks, park utilization will increase 4.8%. For each hectare increase in commercial land area, the check-ins will increase 2.3%. For every one station increase in the number of subway stations, park use will increase by 69%. Regarding negative impacts, one more road around the park will contribute to a 6.2% decrease in check-ins, and a per hectare water area increase will result in a 3.5% decrease in park use.
In the yearly workday and weekend models, variables such as the number of sports venues, average housing price and area of commercial land had positive influences on check-ins, while the number of roads had negative impacts.

3.2. Seasonal Comprehensive Park Utilization Model Results

For the seasonal comprehensive park usage model, correlation coefficient R was 0.818, the judgment coefficient R2 was 0.669 and the adjusted R2 was 0.656.
According to Table 4, seasonal check-ins will increase by 139% for every increase in the number of sports venues. With every CNY 1000 increase in average house price around the park, check-ins will increase by 9.2%, and for each hectare increase in commercial property, park use will increase by 5.1%. With every one increase in the number of metro stations, check-ins will increase by 91%. A 0.01 increase in scenic quality was associated with an 8.62% increase in check-ins. In contrast, some studied variables had negative impacts: One more road in the area around the park will cause a 7.7% decrease in check-in numbers. Ticket price also has a negative influence on park use, with a 40.5% decrease per CNY increase, and every bus station contributes to a 49% decrease in check-ins. Furthermore, seasonality is a factor in check-ins, with summer and winter having fewer negative effects on check-ins.
For seasonal workday and weekend models, determinants such as number of sports venues, park ranking, Baidu Index, scenic quality and number of subway stations all have positive influences on park use, while the number of roads and green coverage ratio induce negative impacts. In addition, spring and autumn are positive for check-ins in the workday model, and summer and winter seasons are negative for park use in the weekend model. Average housing price is positive in the workday model, and area of commercial lands is positive in the weekend model.

3.3. Monthly Comprehensive Park Utilization Model Results

After removing outliers, a total of 1320 observations were used in the monthly comprehensive park utilization models. The correlation coefficient R was 0.840, the judgment coefficient R2 was 0.705 and the adjusted R2 was 0.699.
The regression results show that monthly microblog check-ins will increase 486% for every increase in the number of sports venues. With each hectare increase in commercial land area, park utilization will increase by 1.1%, and every one increase in the number of Metro stations, park use will increase by 448%. The check-ins with a 0.01 increase in scenic quality will increase by 14.11% more and a value of 0.01 increases in park ranking will contribute to 5.33% more check-ins. The check-ins will increase by 1.2% with each increase in Baidu Index; every bus station brings a 41.9% decrease in park utilization. For negative impacts, one additional road around the park will cause a 25.7% decrease in check-ins, and each hectare increase in water area will result in a 72.8% decrease in park use. Ticket price also has a negative influence on check-ins with a 32.4% decrease for CNY 1 increase. Lastly for every CNY 1000 increase in average house price around the parks, the check-ins will decrease by 2.7%.
Monthly workday and weekend models indicate that variables such as the number of sports venues, park ranking, scenic quality, Baidu Index, number of bus stations, number of subway stations and month have positive influences on park use, while ticket price, area of water and number of roads have negative impacts. In addition, spring and autumn were found to be correlated with park use in the workday model, while summer and winter seasons were correlated with use in the weekend model. Average housing price had a positive correlation in the workday model, while the green coverage ratio had a negative correlation. Area of commercial lands had a positive correlation in the weekend model.

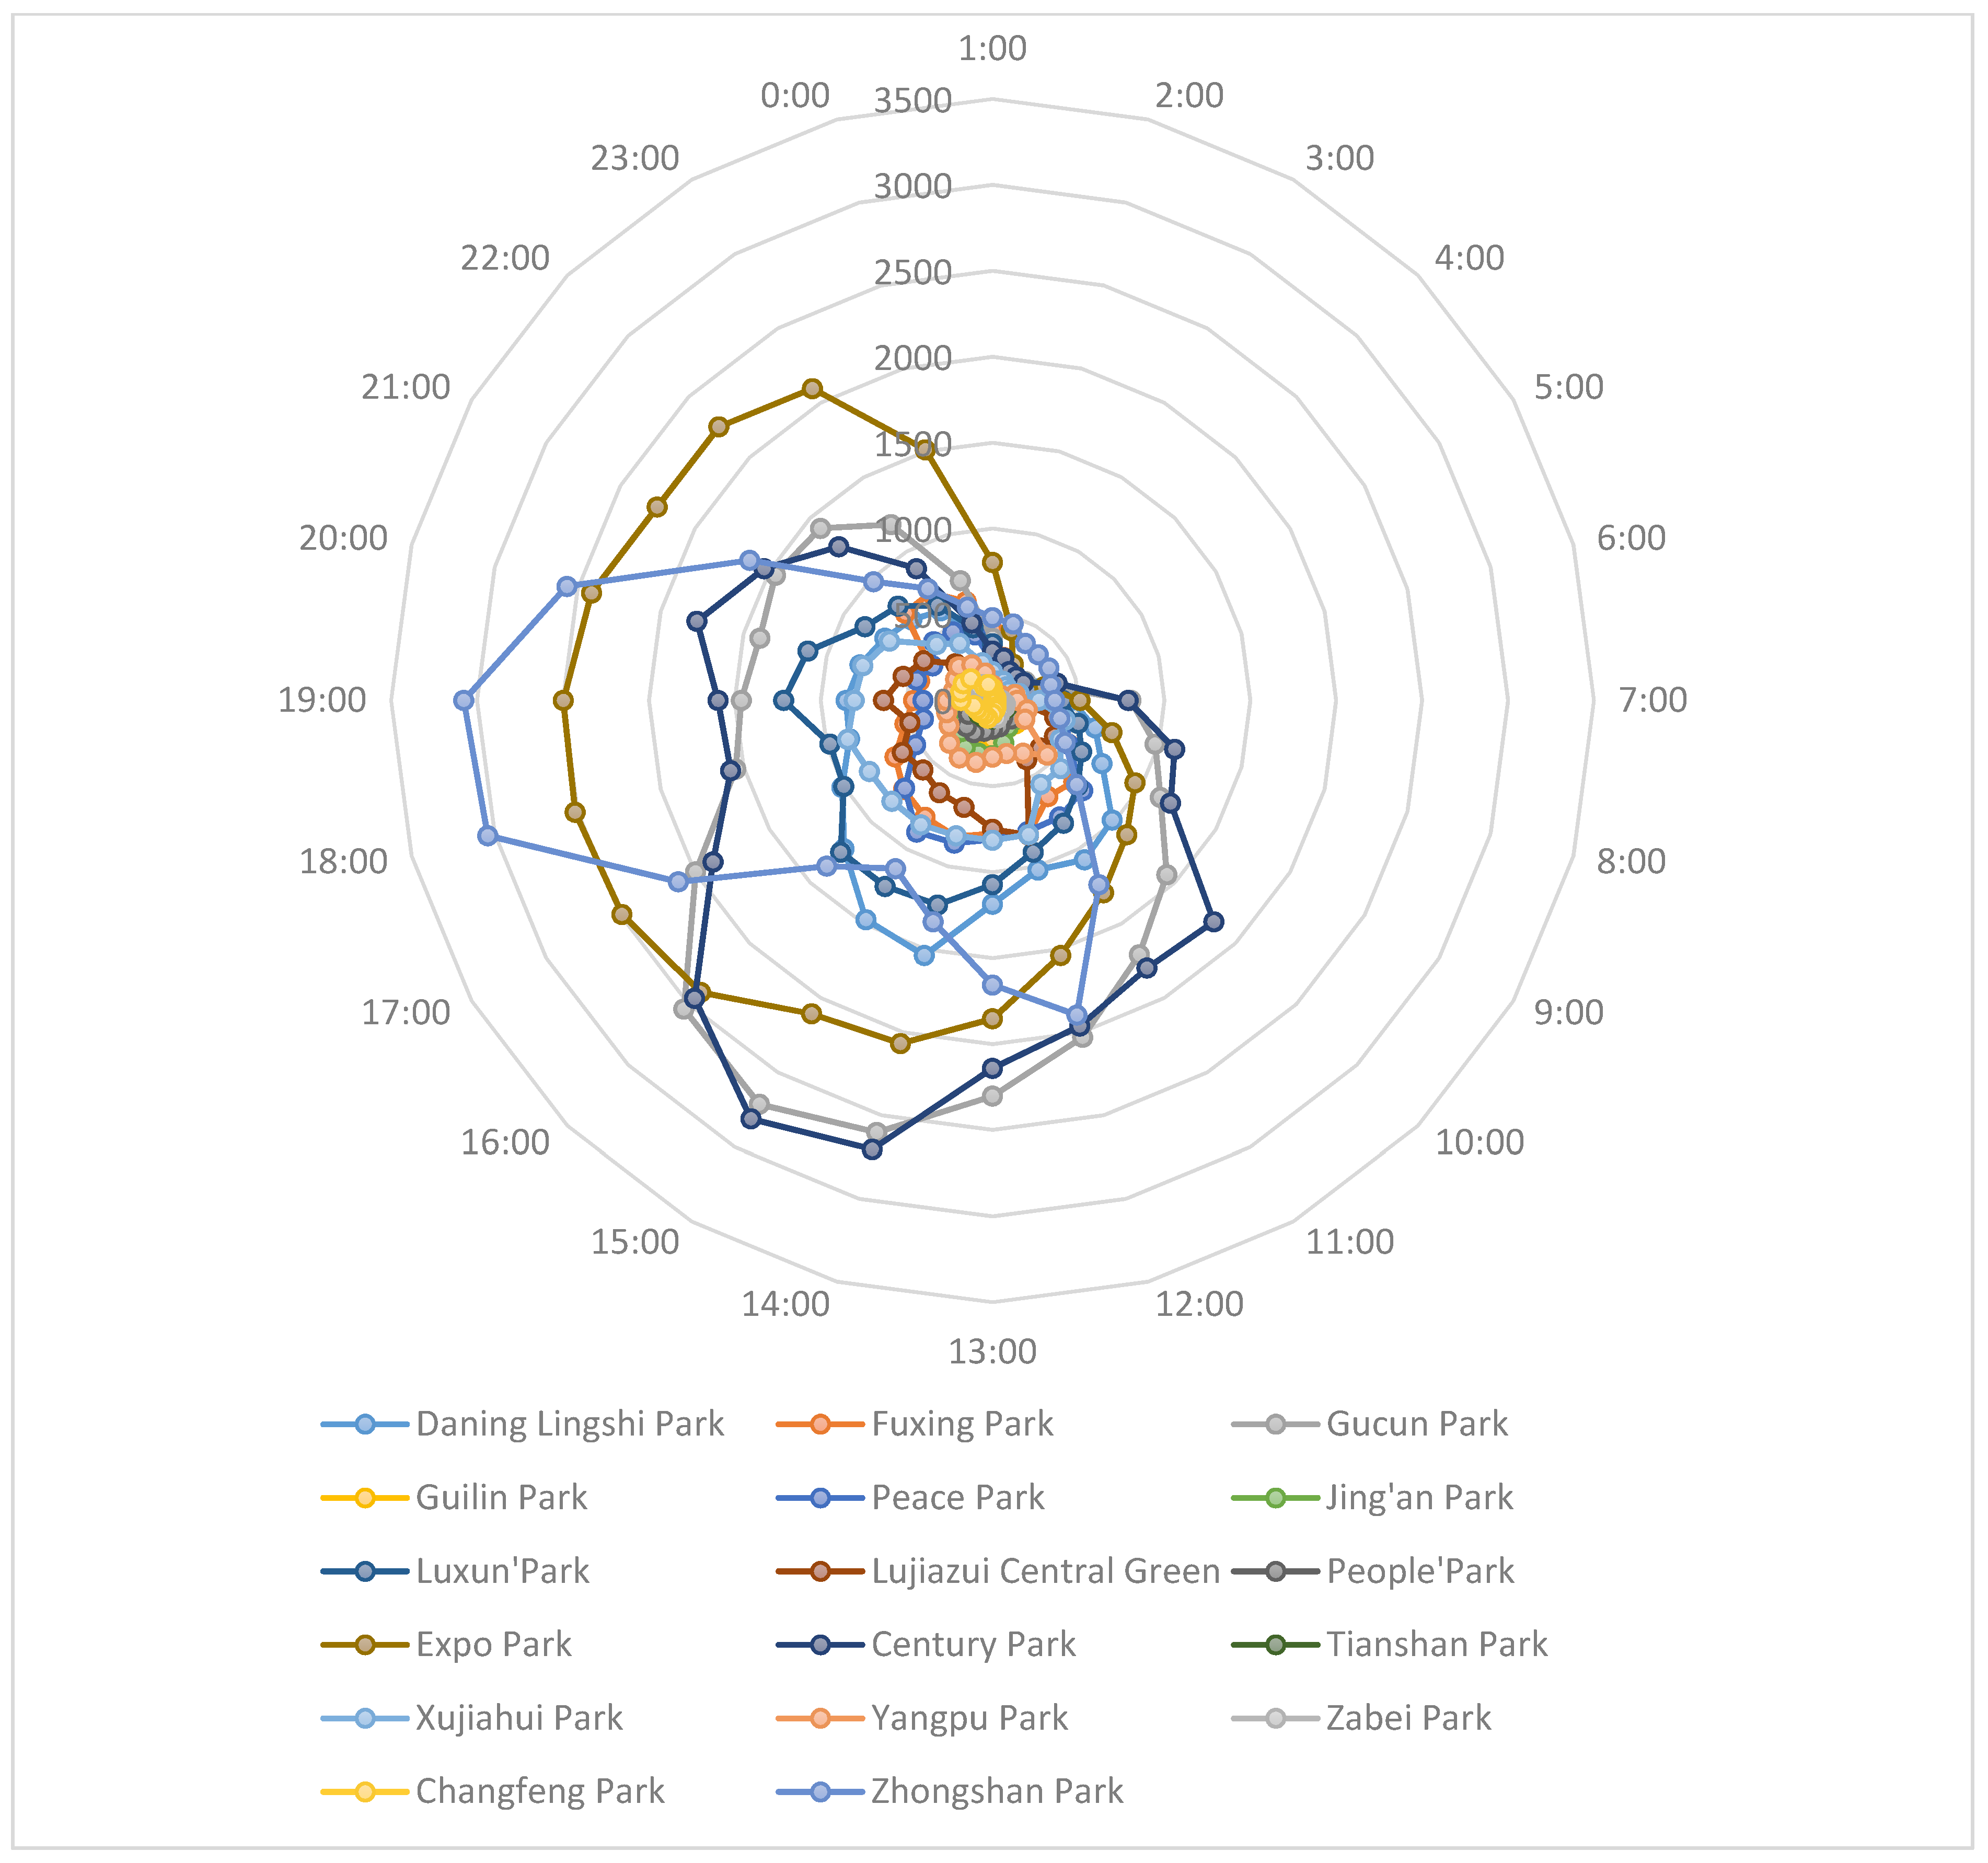
3.4. Daily Comprehensive Park Utilization Model Results

According to Figure 3, the time of 1:00–6:00 a.m. is the sleeping time. Numbers of visitors to comprehensive parks increases from 7:00 a.m. to 23:00 p.m. and peaks around 14:00–15:00 p.m., followed by another small check-in peak from 19:00 to 21:00 p.m.
The comparison of check-in time between weekdays and weekends is shown in Figure 4. The graphs indicate that recreational time for visitors was generally between 9:00 and 21:00. The check-in peak on weekdays appeared at 19:00, while the peak on weekends was around 15:00, and the number of average daily visitors on weekends significantly increased compared with that on weekdays.

4. Discussion

Both internal and external factors of urban parks play significant roles in determining park utilization. The number of sports venues is the most influential determinant, followed by the number of subway stations, scenic quality, park ranking, Baidu Index, number of bus stations and area of commercial lands. Factors with the most negative influence on park check-ins are number of roads, area of water, ticket price and average housing price. Seasons, such as spring and autumn, had a positive influence on park use, while check-ins during January and February decreased.
Number of sport venues is the most influential element and had a positive impact on check-ins, while number of roads adjacent to the park had the most negative impact. The demand for sports venues is in line with the health motivation of visitors. The more sports venues there are, the more attractive urban green space will be to visitors.
In general, the number of subway stations, the area of commercial zones and the average housing price were associated with more urban parks utilization. The number of subway stations makes parks more accessible. A larger area of commercial lands around the park creates more attractions for visitors’ recreation. This type of mixed land use has been used more for adapted land use planning in recent years and is viewed as a healthier and dynamic land use pattern [30]. At present, conventional commercial facilities, such as restaurants, teahouses, bookstores and snack shops, in parks are insufficient to meet the needs of park visitors, and the commercial office space around the park can make up for this defect. A large number of studies have shown that urban parks have a value-added effect on housing prices [31]. Housing close to urban parks with high access to green space and scenery is more expensive. Dunse et al. (2007) quantified the economic benefits of open space on households in Aberdeen, Scotland, and confirmed the positive influence of public parks on housing price [32]. Therefore, urban parks attract urban residents to gather while simultaneously promoting the value of the surrounding property.
The size of the park is not statistically significant, and the area of water is not always significant; if it is, its impact is negative. Previous studies believe that visitors prefer an urban green space with water body to spaces without any water elements [13,33]. Data from this study indicate that it having more water does not result in more utilization. There are two probable reasons: (1) more water means less space for other use or a large area of water separating the use of the park; (2) water quality is another consideration. The decline in water quality in urban parks in Shanghai [34] may result in less utilization, which is consistent with the study in London [35]. There is a correlation between a park’s area and water area and check-ins and, more specifically, in the internal diversity of sites, infrastructure diversity and spatial diversity [11,36].
For seasonal and monthly models, additional variables had influences. Scenic quality always plays an important positive role; park ranking and Baidu Index have positive functions as well, while ticket price and green coverage ratio have a negative effect on attendance. The variable “scenic quality” properly reflects the quantitative relationship with recreational attraction; it had a positive effect on park use. Previous research indicates that landscape naturalness, landscape characteristics, plant collocation and plant richness are all related to aesthetic degree [37]. Therefore, the aesthetic design of the landscape should pay more attention to the visual attraction of the site in order to optimize visitor satisfaction.
Park rankings are related to management quality. The results of Gui (2016) proposed that Shanghai residents place more value on the number of recreational spaces and facilities, the degree of maintenance of the facilities, environmental quality and the functional complexity of recreational space [38]. Urban residents have certain requirements for the management quality of parks, and park rankings help to summarize this management quality. The cost of park tickets is an obstacle to visitors’ recreation. Zeng (2015) studied visitor data released by the Shanghai Municipal Administration of Greening and Appearance, and the findings suggest that the rapid growth of the number of visitors after parks offered free admission increased the difficulty of park management. Thus, there is still a balance to be considered on park admission fees.
For seasonal and monthly models, spring and autumn exerted positive influences on the workday model, while summer and winter caused negative influences. This result is consistent with simple descriptive spatiotemporal distribution analysis; that is, visitors prefer to attend parks in the spring and autumn seasons when the weather is nice. For the monthly models, October was found to have a significant positive influence, which is also reasonable because of the National Holiday in China and typically nice weather. The weather in spring and autumn is suitable for recreation, and autumn coincides with the National Day holiday, resulting in higher check-ins; therefore, outstanding seasonal features and improvements to summer and winter landscapes in urban parks may help balance park utilization.
In terms of the seasonal and monthly workday models, spring, autumn seasons and October showed positive influences on check-ins. According to the seasonal and monthly weekends models, the area of commercial land is significant and positive; summer and winter exert negative influences; and for the monthly weekend model, March, October and December are positive. On workdays, nice weather has a significant positive effect on park visitation. The number of bus stations is also important. During weekends, bad weather has significant negative effects, and the area of commercial lands is important. Therefore, we conclude that the differences of workday and weekend models lie in external factors, and the surrounding commercial conditions and good weather are important for park weekend utilization.
Regarding monthly characteristics of visitors’ use in comprehensive parks, the peak is in October, which may be related to the impact of collective travel of urban residents during the National Day Golden Week. The check-ins are typically the highest in autumn, leading us to the suggestion that autumn has suitable weather and coincides with the National Day holiday, when people have more leisure time to spend in parks. The climate conditions during spring and autumn encourage park use, while winter and summer have fewer ideal conditions and limit visitors.
Daily analysis provides some interesting findings regarding visitors’ behaviors. More people chose to visit the park in the afternoon, and some people visited parks after dinner (Figure 4). Check-ins at 12:00 and 18:00 formed two troughs, indicating that parks have fewer visitors during lunch and dinner hours. We also find that visiting time tendencies are predictable. Restricted by work, the leisure time of visitors is constrained. Overall, park recreation time is concentrated on weekends and golden week holidays. The average number of visitors on weekends is nearly twice compared with that of weekdays. The peak of park use on weekdays is at 19:00 after dinner, and the peak of recreation on weekends is around 15:00 p.m. On weekends, visitors have a higher demand for the recreational landscape environments.
An interesting finding is that the intraday check-in curve of Shanghai Expo Park is significantly different from that of other parks (Figure 3). Check-ins to the park were mainly distributed between 16:00 and 23:00 p.m. because Shanghai Expo Park often holds outdoor activities, such as the Strawberry Music Festival, Jazz Festival and Shanghai Magic Lantern Carnival, which attracts a large number of people from inside and outside Shanghai. As a result, the park had a low local visitor rate.
Social media use is growing fast with technological innovation and subsequent data collection. These large, efficient and growing datasets bring massive information to researchers, which help to inspire research questions and methods. Spatiotemporal datasets from social media allow researchers to study travel behaviors, assess location characteristics, identify tourist spots, assess attractiveness and reveal land use patterns via approaches that were impossible with traditional methods of data collection [39]. In this study, social media data, such as Microblog check-ins, provide researchers a large volume data to analyze yearly, seasonal, monthly and daily utilization situations for several parks in Shanghai, which is difficult to fulfill by using traditional questionnaires and observation methods. It is believed that social media data benefit spatiotemporal studies, especially when the studies include more than one location.
However, it is important to keep in mind the shortcomings of social media. First, the location information may not be exact, resulting in incorrect locational check-ins, especially for the check-ins at the boundary of different land use types. Second, social media users are not evenly distributed between socioeconomic and demographic groups. For instance, Microblog users comprise mostly younger generations; thus, children and the elderly may be excluded from the study. Third, compared to traditional methods such as questionnaires and interviews, it is hard to obtain personal and subjective views from social media data. Ries et al. (2009) indicated that efforts to promote park use should increase awareness of park availability, improve perceptions of park quality and utilize social networks [9]. Social media data are lacking on the “awareness” part. Fourth, social media data generate results on overall trend or patterns while ignoring individual differences. Qualitative methods (e.g., in-depth individual interviews, focus group interviews, direct observation and participant observation) rely heavily on interpretations from participant language and actions and involve purposeful sampling of participants and settings. The contextualization in qualitative research helps to show such individual attributes. Data such as the Baidu vocabulary cloud may help overcome this weakness. Qualitative research may also be less amenable to standardized research procedures and more difficult to synthesize.

5. Conclusions

Urban parks are essential to the wellbeing of humans and are important places for the public to interact with nature. The use of urban parks is a dynamic process. For a single space, various activities may take place in different times of day, month, season and year. Exploring the determinants of urban parks utilization is helpful for improving the renewal strategy of urban parks, providing elastic space design schemes, promoting citizens’ recreation, improving public physical and mental health and encouraging comprehensive benefits of urban parks. The use of new technique, new data and new analysis methods provide guidance for future renewal planning of urban parks, transportation and land use. The proposed methodology can be applied in similar high-density urban areas all over the world to enhance social, ecological, cultural and economic service functions of urban parks.
This study explores the determinants of urban parks utilization using microblog check-in data. Logarithmic linear regression models are constructed based on social media data, park basic data and social life data. Taking 17 comprehensive parks in central Shanghai as the research objects, this paper examines determinants affecting park utilization and puts forward corresponding optimization countermeasures from design and planning perspectives based on the results from regression models.
Our findings suggest that spring and autumn are peak seasons, while summer and winter are slack seasons. Seasonal climate has an apparent impact on park utilization. The frequency of visitors’ park recreational activities is high in spring and autumn and low in summer and winter. When planning and designing recreational space for visitors, more emphasis should be placed on the design of various green outdoor recreational spaces, and the planning and allocation of sufficient recreational facilities to satisfy the peak demands.
Regarding the determinants of urban parks utilization, we find that both internal and external factors of parks contribute to urban park utilization. Participation in physical exercise is in high demand by visitors as a result of the social advocacy for a healthy life. In addition to sports venues, more elastic spaces should be designed to encourage diverse healthy activities, such as square dancing, Tai Chi, walking and even sitting. In addition, the inner quality of a park should be improved by adding attractive views such as water bodies, thoughtfully arranged plant scenes, comfortable sitting areas and social events in order to make parks more popular and improve their ranking. For external factors, we suggest enhancing surrounding transportation facilities and promoting mixed land use (residential areas, parks, commercial areas, other public service lands, etc.) for better urban parks utilization. Breaking the boundary between the city and parks, as well as increasing subway stations and bus stations to parks, can make parks more accessible and perceived as nice choices.

Author Contributions

Conceptualization, D.C.; methodology, Z.L. and D.C.; formal analysis, X.L.; writing—original draft preparation, D.C. and X.L.; writing—review and editing, C.L., D.C. and C.X.; supervision, S.C. and Z.L.; funding acquisition, S.C. and D.C. All authors have read and agreed to the published version of the manuscript.

Funding

This research was funded by National Natural Science Foundation of China, grant number 32001361.

Institutional Review Board Statement

Not applicable.

Informed Consent Statement

Informed consent was obtained from all subjects involved in the study.

Data Availability Statement

The data presented in this study are available on request from the corresponding author. The data are not publicly available due to privacy.

Conflicts of Interest

The authors declare no conflict of interest.

References

  1. Woolley, H. Urban Open Spaces; Spon Press: London, UK; New York, NY, USA, 2003; pp. 25–36. [Google Scholar]
  2. Mccormack, G.R.; Rock, M.; Toohey, A.M.; Hignell, D. Characteristics of urban parks associated with park use and physical activity: A review of qualitative research. Health Place 2010, 16, 712–726. [Google Scholar] [CrossRef]
  3. Akpinar, A. How is quality of urban green spaces associated with physical activity and health? Urban For. Urban Green. 2016, 16, 76–83. [Google Scholar] [CrossRef]
  4. Moreira, T.C.L.; Polizel, J.L.; Santos, I.; Fiilho, D.F.; Bensenor, I.; Lotufo, P.A.; Mauad, T. Green Spaces, Land Cover, Street Trees and Hypertension in the Megacity of Saõ Paulo. Int. J. Environ. Res. Public Health 2020, 17, 725. [Google Scholar] [CrossRef] [Green Version]
  5. Chen, Y.; Liu, X.; Gao, W.; Wang, R.Y.; Li, Y.; Tu, W. Emerging social media data on measuring urban park use and their relationship with surrounding areas—A case study of shenzhen. Urban For. Urban Green. 2018, 31, 130–141. [Google Scholar] [CrossRef]
  6. Waits, J. Urban green space: Is it the next financial frontier? Bus. Perspect. 2008, 19, 36–39. [Google Scholar]
  7. Garvin, A.; Brands, R.M. Public Parks: The Key to Livable Communities, 1st ed.; W.W. Norton & Co.: New York, NY, USA, 2011; pp. 112–124. [Google Scholar]
  8. Besenyi, G.M.; Kaczynski, A.T.; Stanis, S.A.; Bergstrom, R.D.; Lightner, J.S.; Hipp, J.A. Planning for health: A community-based spatial analysis of park availability and chronic disease across the lifespan. Health Place 2014, 27, 102–105. [Google Scholar] [CrossRef]
  9. Ries, A.V.; Voorhees, C.C.; Roche, K.M.; Gittelsohn, J.; Yan, A.F.; Astone, N.M. A quantitative examination of park characteristics related to park use and physical activity among urban youth. J. Adolesc. Health 2009, 45 (Suppl. S3), S64–S70. [Google Scholar] [CrossRef] [PubMed]
  10. Golicnik, B.; Ward Thompson, C. Emerging relationships between design and use of urban park spaces. Landsc. Urban Plan. 2010, 94, 38–53. [Google Scholar] [CrossRef]
  11. Senetra, A.; Krzywnicka, I.; Mielke, M. An analysis of the spatial distribution, influence and quality of urban green space—A case study of the Polish city of Tcze. Bull. Geogr. Socio-Econ. Ser. 2018, 42, 129–149. [Google Scholar] [CrossRef] [Green Version]
  12. Giles-Corti, B.; Broomhall, M.H.; Knuiman, M.; Collins, C.; Douglas, K.; Ng, K.; Lange, A.; Donovan, R.J. Increasing walking: How important is distance to, attractiveness, and size of public open space? Am. J. Prev. Med. 2005, 28 (Suppl. S2), 176. [Google Scholar]
  13. Whyte, W.H. The Social Life of Small Urban Spaces; Conservation Foundation: Washington, DC, USA, 1980; pp. 42–56. [Google Scholar]
  14. Mccormack, G.R.; Rock, M.; Swanson, K.; Burton, L.; Massolo, A. Physical activity patterns in urban neighborhood parks: Insights from a multiple case study. BMC Public Health 2014, 14, 962. [Google Scholar] [CrossRef] [PubMed] [Green Version]
  15. Kwan, C.P.; Jim, C.Y. Subjective outdoor thermal comfort and urban green space usage in humid-subtropical hong kong. Energy Build. 2018, 173, 150–162. [Google Scholar]
  16. Hawelka, B.; Sitko, I.; Beinat, E.; Sobolevsky, S.; Kazakopoulos, P.; Ratti, C. Geo-located twitter as proxy for global mobility patterns. Cartogr. Geogr. Inf. Sci. 2014, 41, 260–271. [Google Scholar] [CrossRef] [PubMed] [Green Version]
  17. Steiger, E.; de Albuquerque, J.P.; Zipf, A. An advanced systematic literature review on spatiotemporal analyses of twitter data. Trans. GIS 2015, 19, 809–834. [Google Scholar] [CrossRef]
  18. Jendryke, M.; Balz, T.; Mcclure, S.C.; Liao, M. Putting people in the picture: Combining big location-based social media data and remote sensing imagery for enhanced contextual urban information in shanghai. Comput. Environ. Urban Syst. 2017, 62, 99–112. [Google Scholar] [CrossRef] [Green Version]
  19. Noulas, A.; Scellato, S.; Lambiotte, R.; Pontil, M.; Mascolo, C. A tale of many cities: Universal patterns in human urban mobility. PLoS ONE 2011, 7, e37027. [Google Scholar]
  20. Zhai, S.; Xu, X.; Yang, L. Mapping the popularity of urban restaurants using social media data. Appl. Geogr. 2015, 63, 113–120. [Google Scholar] [CrossRef]
  21. Livia, H.; Ross, P. Exploring place through user-generated content: Using Flickr to describe city cores. J. Spat. Inf. Sci. 2010, 1, 21–48. [Google Scholar]
  22. García-Palomares, J.; Gutiérrez, J.; Mínguez, C. Identification of tourist hot spots based on social networks: A comparative analysis of European metropolises using photo-sharing services and gis. Appl. Geogr. 2015, 63, 408–417. [Google Scholar] [CrossRef]
  23. Fujisaka, T.; Lee, R.; Sumiya, K. Exploring urban characteristics using movement history of mass mobile microbloggers. Elev. Workshop Mob. Comput. Syst. Appl. 2010, 10, 13–18. [Google Scholar]
  24. Kennedy, L.; Naaman, M.; Ahern, S.; Nair, R.; Rattenbury, T. How flickr helps us make sense of the world: Context and content in community-contributed media collections. In Proceedings of the 15th ACM International Conference on Multimedia, Augsburg, Bavaria, Germany, 23–28 September 2007; pp. 631–640. [Google Scholar]
  25. Friasmartinez, V.; Soto, V.; Hohwald, H.; Friasmartinez, E. Characterizing Urban Landscapes Using Geolocated Tweets. In Proceedings of the 2012 International Conference on Privacy, Security, Risk and Trust and 2012 International Confernece on Social Computing, Amsterdam, The Netherlands, 3–5 September 2012. [Google Scholar]
  26. Roberts, H.V. Using twitter data in urban green space research: A case study and critical evaluation. Appl. Geogr. 2017, 81, 13–20. [Google Scholar] [CrossRef]
  27. Agryzkov, T.; Martí, P.; Nolasco-Cirugeda, A.; Serrano-Estrada, L.; Tortosa, L.; Vicent, J.F. Analysing successful public spaces in an urban street network using data from the social networks foursquare and twitter. Appl. Netw. Sci. 2016, 1, 12. [Google Scholar] [CrossRef] [Green Version]
  28. Roberts, H.; Sadler, J.; Chapman, L. Using twitter to investigate seasonal variation in physical activity in urban green space. Geo Geogr. Environ. 2017, 4, e00041. [Google Scholar] [CrossRef]
  29. Xu, W. Urban explorations: Analysis of public park usage using mobile GPS data. In Proceedings of the Bloomber Data for Good Exchange Conference, Chicago, IL, USA, 24 September 2017. [Google Scholar]
  30. Manaugh, K.; Kreider, T. What is mixed use? Presenting an interaction method for measuring land use mix. J. Transp. Land Use 2013, 6, 63–72. [Google Scholar] [CrossRef]
  31. Crompton, J.L. The impact of parks on property values: Empirical evidence from the past two decades in the United Sates. Manag. Leis. 2005, 10, 203–218. [Google Scholar] [CrossRef]
  32. Dunse, N.; White, M.; Dehring, C. Urban Parks, Open Space and Residential Property Values. RICS Res. Pap. Ser. 2007, 7, 9–36. [Google Scholar]
  33. Chen, C.; Luo, W.; Li, H.; Zhang, D.; Xia, Y. Impact of perception of green space for health promotion on willingness to use parks and actual use among young urban residents. Int. J. Environ. Res. Public Health 2020, 17, 5560. [Google Scholar] [CrossRef]
  34. Shen, B.L. Study on the eutrophication evaluation for small landscape waters in cities. J. Anhui Agric. Sci. 2011, 39, 14321–14325. [Google Scholar]
  35. Stoianov, I.; Chapra, S.; Maksimovic, C. A framework linking urban park land use with pond water quality. Urban Water 2000, 2, 47–62. [Google Scholar] [CrossRef]
  36. Wang, Y.C.; Lin, J.C.; Liu, W.Y.; Lin, C.C.; Ko, S.H. Investigation of visitors’ motivation, satisfaction and cognition on urban forest parks in taiwan. J. For. Res. 2016, 21, 261–270. [Google Scholar] [CrossRef]
  37. Frank, S.; Fürst, C.; Koschke, L.; Witt, A.; Makeschin, F. Assessment of landscape aesthetics—Validation of a landscape metrics-based assessment by visual estimation of the scenic beauty. Ecol. Indic. 2013, 32, 222–231. [Google Scholar] [CrossRef]
  38. Gui, Y. Recreation Demand Preference Research of Citizens in Shanghai. Shanghai Urban Plan. Rev. 2016, 3, 102–108. [Google Scholar]
  39. Liao, C.; Brown, D.; Fei, D.; Long, X.; Chen, D.; Che, S. Big data-enabled social sensing in spatial analysis: Potentials and pitfalls. Trans. GIS 2018, 22, 1351–1371. [Google Scholar] [CrossRef]
Figure 1. Scope of Central Shanghai.
Forests 12 01783 g001
Figure 2. Distribution of 17 comprehensive parks in central Shanghai.
Forests 12 01783 g002
Figure 3. Intraday distributions of check-in data.
Forests 12 01783 g003
Figure 4. Cumulative daily check-ins in comprehensive parks from 2012 to 2018. (a) Cummulative check-ins; (b) Average daily check-ins.
Forests 12 01783 g004
Table 1. List of 17 comprehensive parks in downtown Shanghai.
No.DistrictPark NameOpening TimeArea (ha)Park RankingNumber of Sports VenuesPopularityScenic QualityWater Area (ha)Green Coverage Ratio (%)
1Changning Zhongshan Park191421.42413784.41.2291
2Tian Shan Park19596.8041-4.31.6775
3HongkouLuxun’s Park189628.63423324.43.0085
4Peace Park195816.3431-4.51.8085
5HuangpuPeople’s Park195210.00414954.40.0890
6Fuxing Park19098.89402174.50.3088
7Jing’anJing’an Park19553.36501584.40.0990
8Daning Lingshi Park200268.00323234.67.0885
9Zhabei Park19466.67411664.30.8085
10PudongCentury Park1997140.30528454.727.0080
11Expo Park201023.00411964.40.7070
12Lujiazui Central Park199710.0041-4.60.4590
13PutuoChangfeng Park195936.40515994.514.355
14XuhuiXujiahui Park20018.66511854.40.490
15Guilin Park19313.55402004.50.0890
16YangpuYangpu Park195722.0041-4.31.985
17Huangxing Park200039.86322414.4875
Table 2. Summary statistic of variables used.
VariableVariable Name in ModelsQuantification of VariablesMean
(Std. Dev.)
Min.
(Max.)
Number of check-insCountSina microblog check-ins157.23
(262.29)
0
(4327)
Green coverage ratioGreenThe vertical projection area of vegetation in each park. (%)82.23
(9.011)
55
(90)
Ticket priceTicket feeTicket price (yuan)0.71
(2.37)
0
(10)
Area of parkAreaArea of each park. (ha)26.54
(32.70)
3.36
(140.3)
Area of waterWaterArea of water bodies in each park. (ha)4.05
(6.823)
0.08
(27)
Popularity (Baidu Index)BaiduOver a certain period of time, the average number of internet users searched park names through Baidu.333.63
(196.24)
158
(845)
Number of subway stations400 StationNumber of subway stations in the 400-metre buffer zone around the park.1.06
(0.540)
0
(2)
Number of bus stationsBusNumber of bus stops in the 400-metre buffer zone around the park.3.18
(1.724)
0
(6)
Average housing pricesAverage HP400Average housing prices in the 400-metre buffer zone around the park. (Yuan/m2)78,627.31
(12,563.05)
62,416
(103,308)
Area of commercial landComAreaThe area occupied by commercial office in the 400-m buffer zone around the park. (ha)20.94
(17.74)
4
(72)
Scenic qualityBeautyScores given for the landscape effect of the comprehensive park can be divided into 5 levels: extremely poor (1 point), poor (2 points), general (3 points), good (4 points) and great (5 points).4.447
(0.11)
4.3
(4.7)
Park rankingStarParks are classified into two-star, three-star, four-star and five-star by Shanghai Greening and Appearance Bureau.4.06
(0.64)
3
(5)
Number of sports venuesSports
Number
The number of sports and fitness venues in each park, including trails, basketball courts, tennis courts, football courts and other sports venues (1 point per item).1.06
(0.64)
0
(2)
Number of roadsRoadThe number of roads in the 400-metre buffer zone around each park.16
(6.78)
5
(34)
Table 3. Summary of four functional forms of linear regression models.
Model FormWithout Dummy VariableWith Dummy Variable
LinearLog-LinearLinearLog-Linear
Yearly modelTotalAdjusted R20.290.470.350.56
Residuals−117.860.12−117.86−0.05
Average1805.806.851805.806.85
WorkdayAdjusted R20.360.490.470.60
Residuals−46.67−0.22−47.14−0.22
Average748.325.921805.806.85
WeekendAdjusted R20.220.440.300.44
Residuals−65.570.65−65.570.65
Average1057.486.321805.806.85
Seasonal modelTotalAdjusted R20.250.650.340.65
Residuals0.000.00−23.830.18
Average478.925.43478.925.43
WorkdayAdjusted R20.190.640.290.71
Residuals−4.070.00−4.090.00
Average281.924.90281.924.90
WeekendAdjusted R20.280.620.380.72
Residuals−11.630.00−10.080.00
Average196.324.47196.324.47
Monthly modelTotalAdjusted R20.230.600.320.70
Residuals0.000.000.000.00
Average157.234.24157.234.24
WorkdayAdjusted R20.160.560.210.67
Residuals0.000.00−1.510.00
Average92.763.7292.763.72
WeekendAdjusted R20.240.550.320.68
Residuals0.000.000.000.00
Average64.353.3164.353.31
Table 4. Regression results of comprehensive park utilization models.
ModelYearlySeasonalMonthly
Non-Std. Coeff.Standard Coeff.tSig.Non-Std. Coeff.Standard Coeff.tSig.Non-Std. Coeff.Standard Coeff.tSig.
BβBβBβ
(constant)1.982-2.4200.018−39.368-−7.7680.000−85.494-−22.0270.000
SportsNumber1.2400.6906.2440.0001.3940.72714.7460.0004.8612.52823.7560.000
AverageHP4000.0000480.4764.3830.0000.0000920.75412.7290.000−0.000027−0.254−3.4460.001
Park Ranking--------5.3342.49517.2940.000
Road−0.062−0.359−3.9640.000−0.077−0.418−9.8580.000−0.257−1.376−21.5670.000
2015−0.774−0.220−2.8440.006−0.924−0.234−6.8720.000−1.037−0.262−13.4460.000
2014−0.755−0.215−2.7740.007−0.788−0.200−5.8630.000−0.936−0.238−12.1840.000
ComArea0.0230.2983.4290.0010.0510.62611.0130.0000.0110.1292.7840.005
Bus ---−0.491−0.631−8.5210.0000.4190.5336.4390.000
400Station0.6910.3243.9140.0000.9140.40210.6480.0004.4831.93821.3210.000
2016----−0.551−0.140−4.0980.000−0.552−0.140−7.1850.000
October---- 0.4760.0864.1830.000
Beauty----8.6280.6227.7570.00014.1101.00920.0760.000
Ticketfee----−0.405−0.774−8.7170.000−0.324−0.617−8.4090.000
Water−0.035−0.203−2.0910.040----−0.728−3.919−17.5060.000
Baidu Index--------0.0121.59515.9140.000
Spring--------0.2690.0824.0250.000
2012--------−0.277−0.070−3.5820.000
Autumn--------0.2270.0652.8610.004
January--------−0.305−0.079−3.2210.001
2018- - 0.2790.0552.9020.004
February--------−0.214−0.041−2.1980.028
Winter----−0.427−0.122−3.5600.000----
Summer----−0.343−0.104−3.0700.002----
Publisher’s Note: MDPI stays neutral with regard to jurisdictional claims in published maps and institutional affiliations.

