Article

Data Mining Methods to Detect Airborne Pollen of Spring Flowering Arboreal Taxa

by
Estefanía González-Fernández
*,
Sabela Álvarez-López
,
Alba Piña-Rey
,
María Fernández-González
and
Francisco Javier Rodríguez-Rajo
Department of Plant Biology and Soil Sciences, Faculty of Sciences, University of Vigo, 32004 Ourense, Spain
*
Author to whom correspondence should be addressed.
Submission received: 8 October 2021 / Revised: 9 December 2021 / Accepted: 16 December 2021 / Published: 18 December 2021
(This article belongs to the Special Issue Tree Pollen and Floral Biology)

Abstract

:
Variations in the airborne pollen load are among the current and expected impacts on plant pollination driven by climate change. Due to the potential risk for pollen-allergy sufferers, this study aimed to analyze the trends of the three most abundant spring-tree pollen types, Pinus, Platanus and Quercus, and to evaluate the possible influence of meteorological conditions. An aerobiological study was performed during the 1993–2020 period in the Ourense city (NW Spain) by means of a Hirst-type volumetric sampler. Meteorological data were obtained from the ‘Ourense’ meteorological station of METEOGALICIA. We found statistically significant trends for the Total Pollen in all cases. The positive slope values indicated an increase in pollen grains over the pollen season along the studied years, ranging from an increase of 107 to 442 pollen grains. The resulting C5.0 Decision Trees and Rule-Based Models coincided with the Spearman’s correlations since both statistical analyses showed a strong and positive influence of temperature and sunlight on pollen release and dispersal, as well as a negative influence of rainfall due to washout processes. Specifically, we found that slight rainfall and moderate temperatures promote the presence of Pinus pollen in the atmosphere and a marked effect of the daily thermal amplitude on the presence of high Platanus pollen levels. The percentage of successful predictions of the C5.0 models ranged between 62.23–74.28%. The analysis of long-term datasets of pollen and meteorological information provides valuable models that can be used as an indicator of potential allergy risk in the short term by feeding the obtained models with weather prognostics.

1. Introduction

Airborne pollen can be used for the study of the structure of plant communities in a determined area, mainly defining the presence of taxa characterized by a predominant anemophilous pollination mechanism. Based on this, we can monitor the transformations in plant communities through aerobiological studies due to their adaptation to changing climatic conditions or marked anthropogenic impacts, such as forest fires, timber exploitations or important ecosystem retrogressions [1]. The construction of pollen calendars with long-term aerobiological data reflects the influence of climatic characteristics of the area on the species of a given geographical region, obtaining valuable information about the adaptation of plant communities to the changing climatic conditions and possible variations in duration and intensity of pollination [2]. Plants are effective bioindicators of climate change impacts since the displacement of phenological events is widely considered for the study of global climate change [3,4].
Although the heterogeneity found on plant responses depends on the season of the year and the considered species, a uniform advance of spring phenological stage occurrence has been detected in different species and regions [3]. The advances found were 1 to 3 days per decade on average in spring phenological events during the last decades in temperate regions of the northern hemisphere [5,6,7,8]. Moreover, climate change may trigger shifts in spatial and temporal airborne pollen loads since pollen concentrations are usually highly temperature-sensitive, leading to increases in pollen concentrations and/or lengthening of pollen seasons [9,10,11,12,13]. This issue acquires remarkable importance in urban areas since at least 50% of the world´s population currently inhabits this kind of settlement, contrasting with rural zones [14]. Urban environments are potential sources of allergenic pollen particles, with highly abundant airborne pollen from a number of tree and shrub species, despite the fact that floral diversity is reduced and pollen sources are relatively scarce in towns [15].
According to the World Health Organization, 30% of the world population suffers some form of allergy to pollen emissions [16]. Pollen discharges from urban vegetation can lead to high socio-economic, environmental and health costs, negatively affecting the life quality of local populations [17,18]. Comparatively longer pollen seasons were previously found in urban areas relative to rural areas for various pollen types. Pollen seasons started earlier and ended later in urban areas. This fact noted that the conditions for pollen production and release are achieved earlier in the urban areas and therefore last for a longer period [15,19,20]. In addition, the ‘heat island’ effect in urban areas—with higher temperatures than in surrounding areas due to the accumulated heat irradiation—results in reduced relative humidity and specific thermal winds, leading to specific pollen deposition and dispersal patterns, giving rise to longer vegetative periods [14,21,22]. Since pollen production is sensitive to environmental variability [23,24,25], pollen monitoring from different taxa can be a useful tool to evaluate local and/or global environmental changes [26], as meteorological factors, mainly air temperature, have notable environmental impacts both at macro-and microscales [27,28].
Due to the geographical location of Galicia, Spain, in which different biogeographical regions converge, this region is an extraordinary laboratory for the study of biodiversity and climate change effects. This characteristic is especially marked in the Ourense region, where this study was carried out, due to its transitional character between the Mediterranean and Atlantic biogeographical regions. Due to the potential risk for allergy sufferers, especially for urban inhabitants, and the influence of current and expected impacts caused by climate change on plant behavior, the aim of this study was to analyze the trends of the main spring tree pollen taxa recorded in the Ourense city atmosphere, located in NW Spain. The possible influence of meteorological conditions on airborne pollen concentrations was assessed for the first time by means of new tools, such as Data Mining algorithms, applied on long-term datasets to evaluate the possible impacts caused by climate change on plant pollination and dispersal mechanisms.

2. Materials and Methods

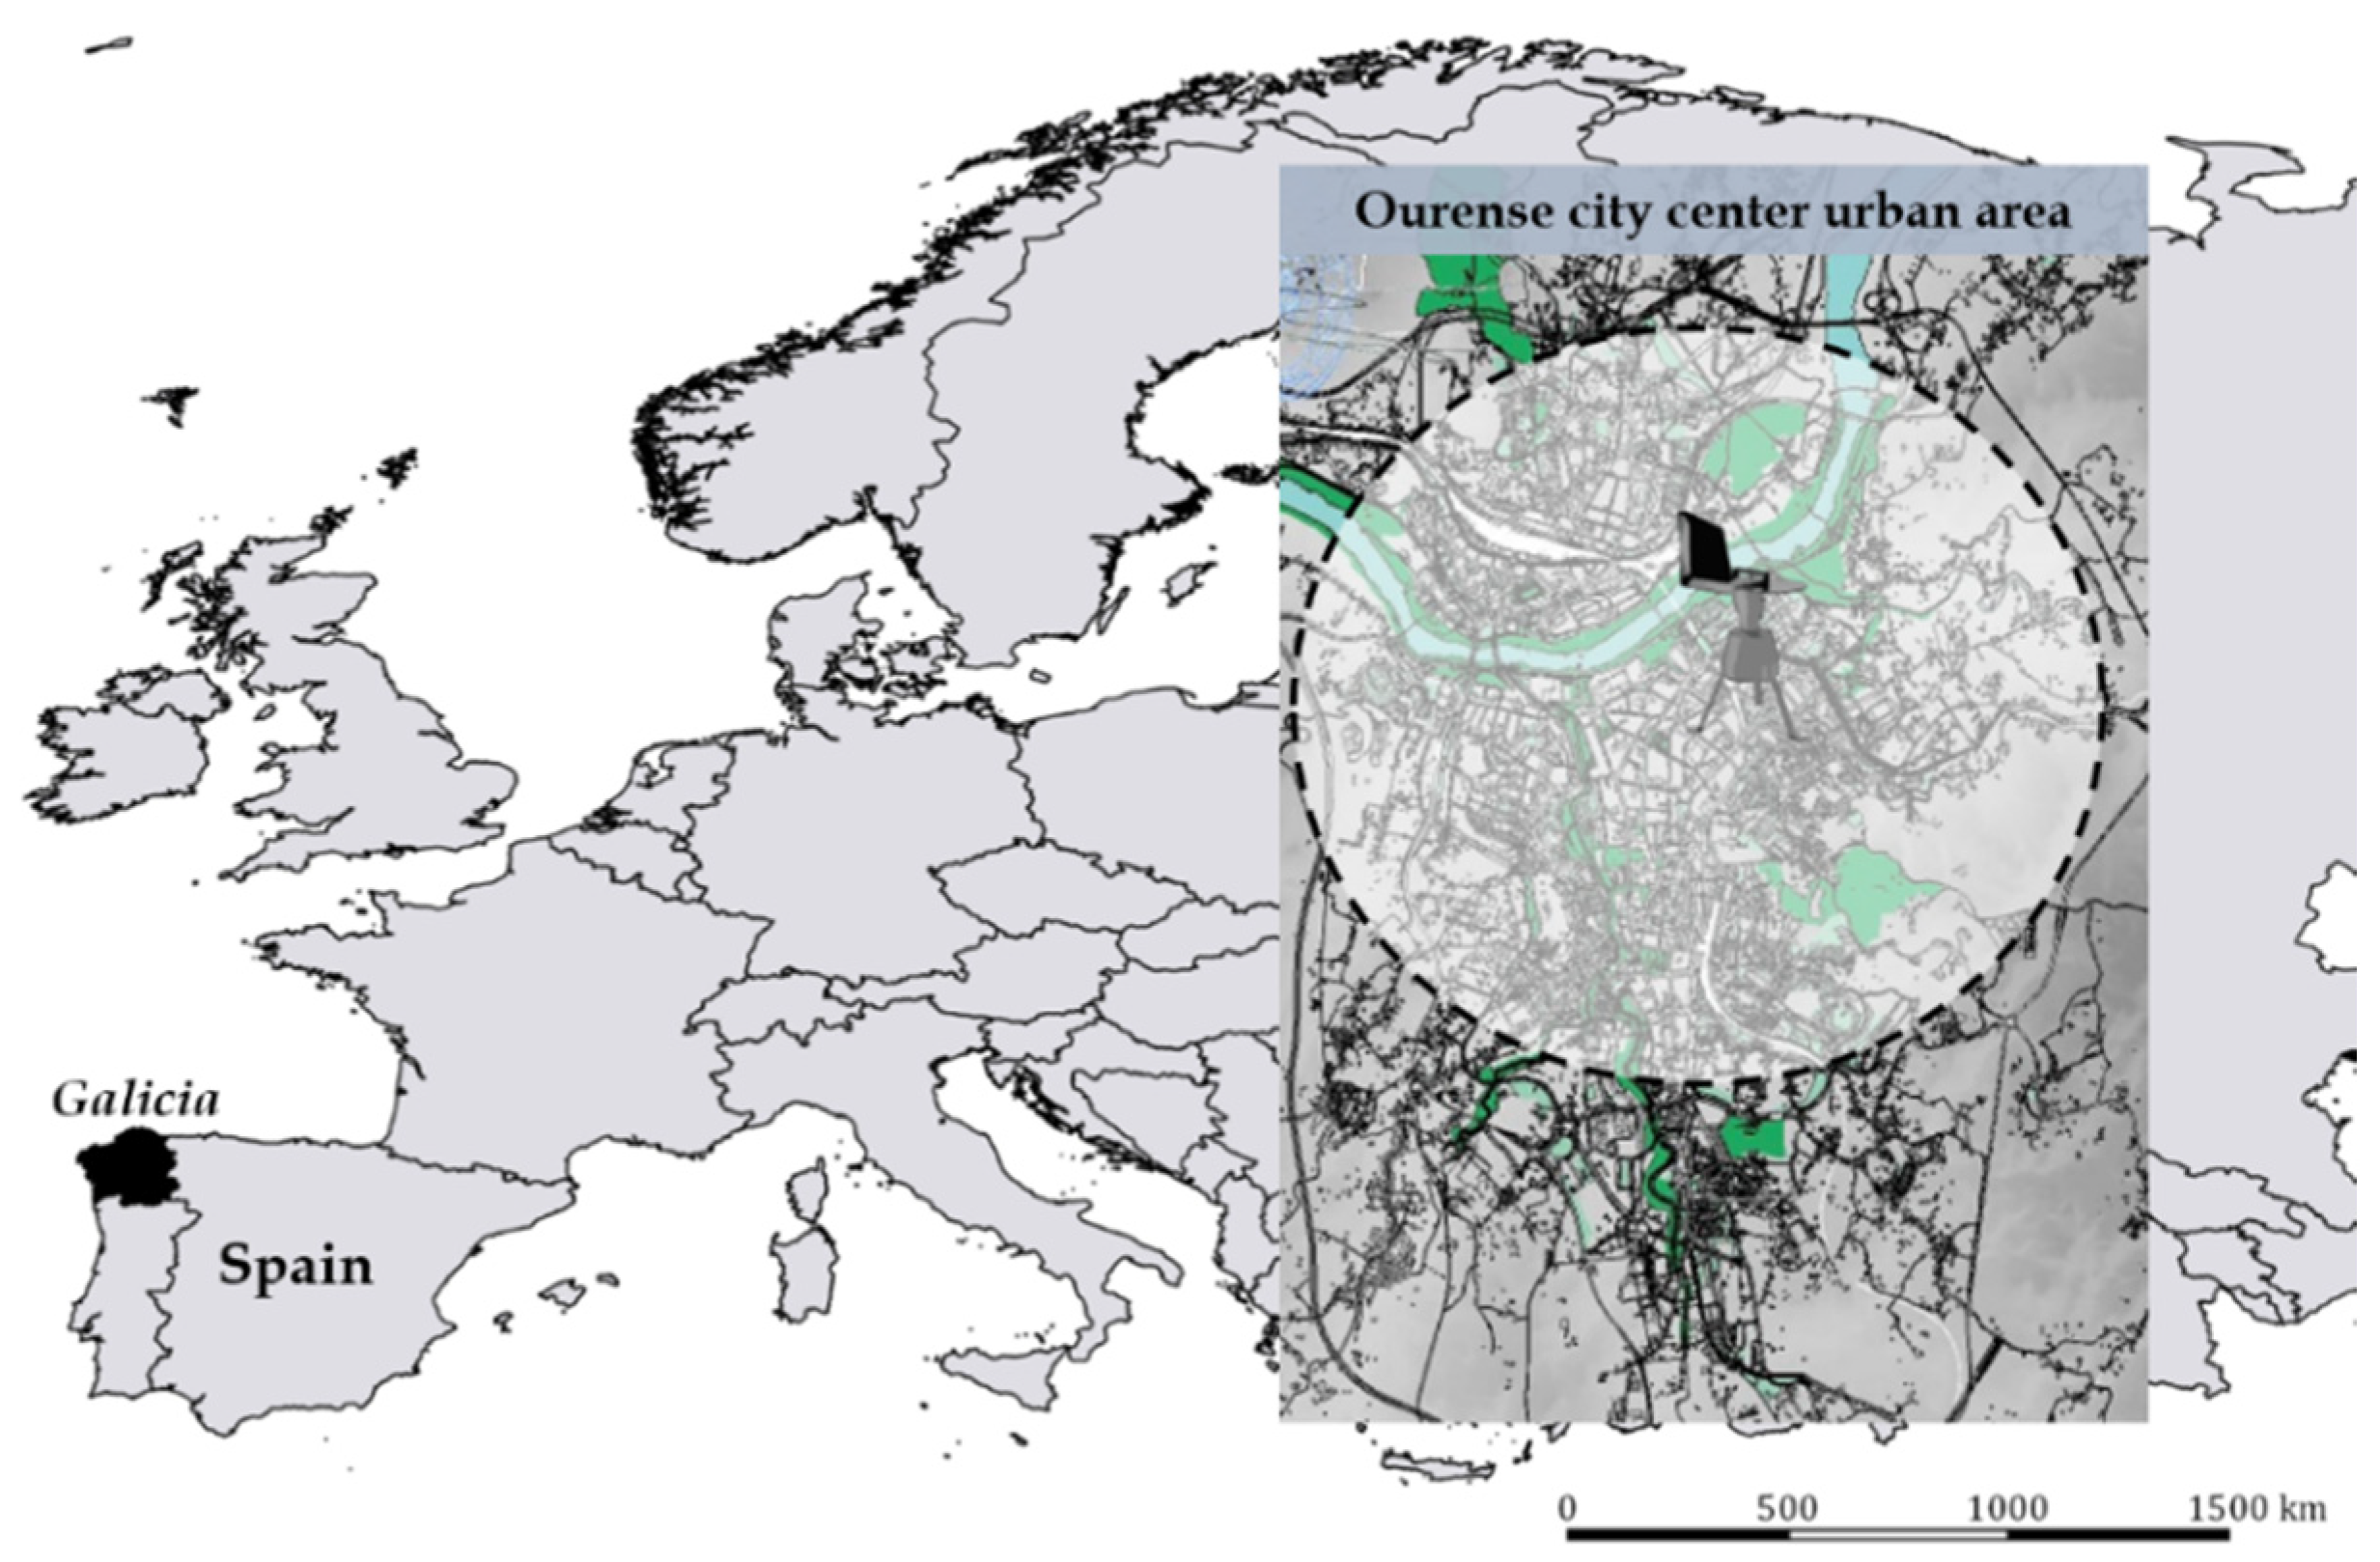
2.1. Study Area and Meteorological Data

The study was performed in the Ourense city (Galicia, Spain), geographically located at 42°20′ N–7°52′ W, during the 1993–2020 period. This urban area is situated in the northwest Iberian Peninsula, in southern Europe (Figure 1). The studied area belongs to the ‘Oceanic-Euoceanic’ bioclimate, related to the tempering effect that seawater masses exert on the climate of landmasses, generating a continentality gradient [29]. Meteorological data were obtained from the ‘Ourense’ meteorological station (ID 10148) of the Galician Institute for Meteorology and Oceanography–METEOGALICIA. The considered parameters were daily maximum, mean and minimum temperatures (°C), rainfall (L/m2) and sunlight hours (hours) [30].

2.2. Aerobiological Data

Aerobiological monitoring was conducted during the 1993–2020 period following the Spanish Aerobiology Network (REA) protocol [32]. For the aerobiological study, a volumetric Hirst-type sampler [33], model Lanzoni VPPS-2000 (Lanzoni s.r.l., Bologna, Italy), was used on the roof of the Science Faculty building of the University of Vigo, in the Ourense campus, at approximately 15 m above ground level near the city center. The volumetric trap was calibrated to input a constant airflow of 10 L/min, similar to human breathing. Melinex tape coated with a 20 g/L (2%) silicone solution was used for the trapping surface, which was changed weekly and cut into seven pieces corresponding to daily samples. Four longitudinal transects were applied to each slide under a light optical microscope at 400× magnification for the determination of daily airborne pollen concentrations applying a correction factor [32]. The obtained results were expressed as total values of pollen/m3 referring to daily mean values. Based on the obtained pollen/m3 concentrations, we calculated the Main Pollen Season (MPS) for each considered pollen taxa following the Andersen [34] method, which accounts for 95% of the total annual pollen, starting when the accumulated sum of pollen reaches the 2.5 percentile of total pollen and ending when it reaches the 97.5 percentile. The Seasonal Pollen Integral (SPIn) was calculated as the sum of daily pollen concentrations/m3 over the MPS [35].
Some data gaps in the pollen dataset were detected during the study period, mainly caused by sampling failures due to weather conditions, since thunderstorms are frequent in this area in the autumn and winter months and sometimes in the spring. However, sample failure during the spring months could also be due to faults in the electrical system of the building where the collector is located, or mechanical failure of the aerobiological sampler. Over the 28-years study period (1993 to 2020), the detected gaps were most common in the main pollen season of the considered taxa. There was a total of six gaps, belonging to four different years, coinciding with the pollen season of spring taxa (from the end of February to mid-May), and 21 gaps belonging to 15 years not included in the pollen season of spring taxa (mainly in September, October, November and December). Regarding the gaps within the pollen season of the considered taxa in this study, they showed a maximum range of seven days, a minimum of one day and a median of two days. Meanwhile, the gaps located out of the pollen seasons showed a maximum range of seven days, a minimum of one day and a median of four days.

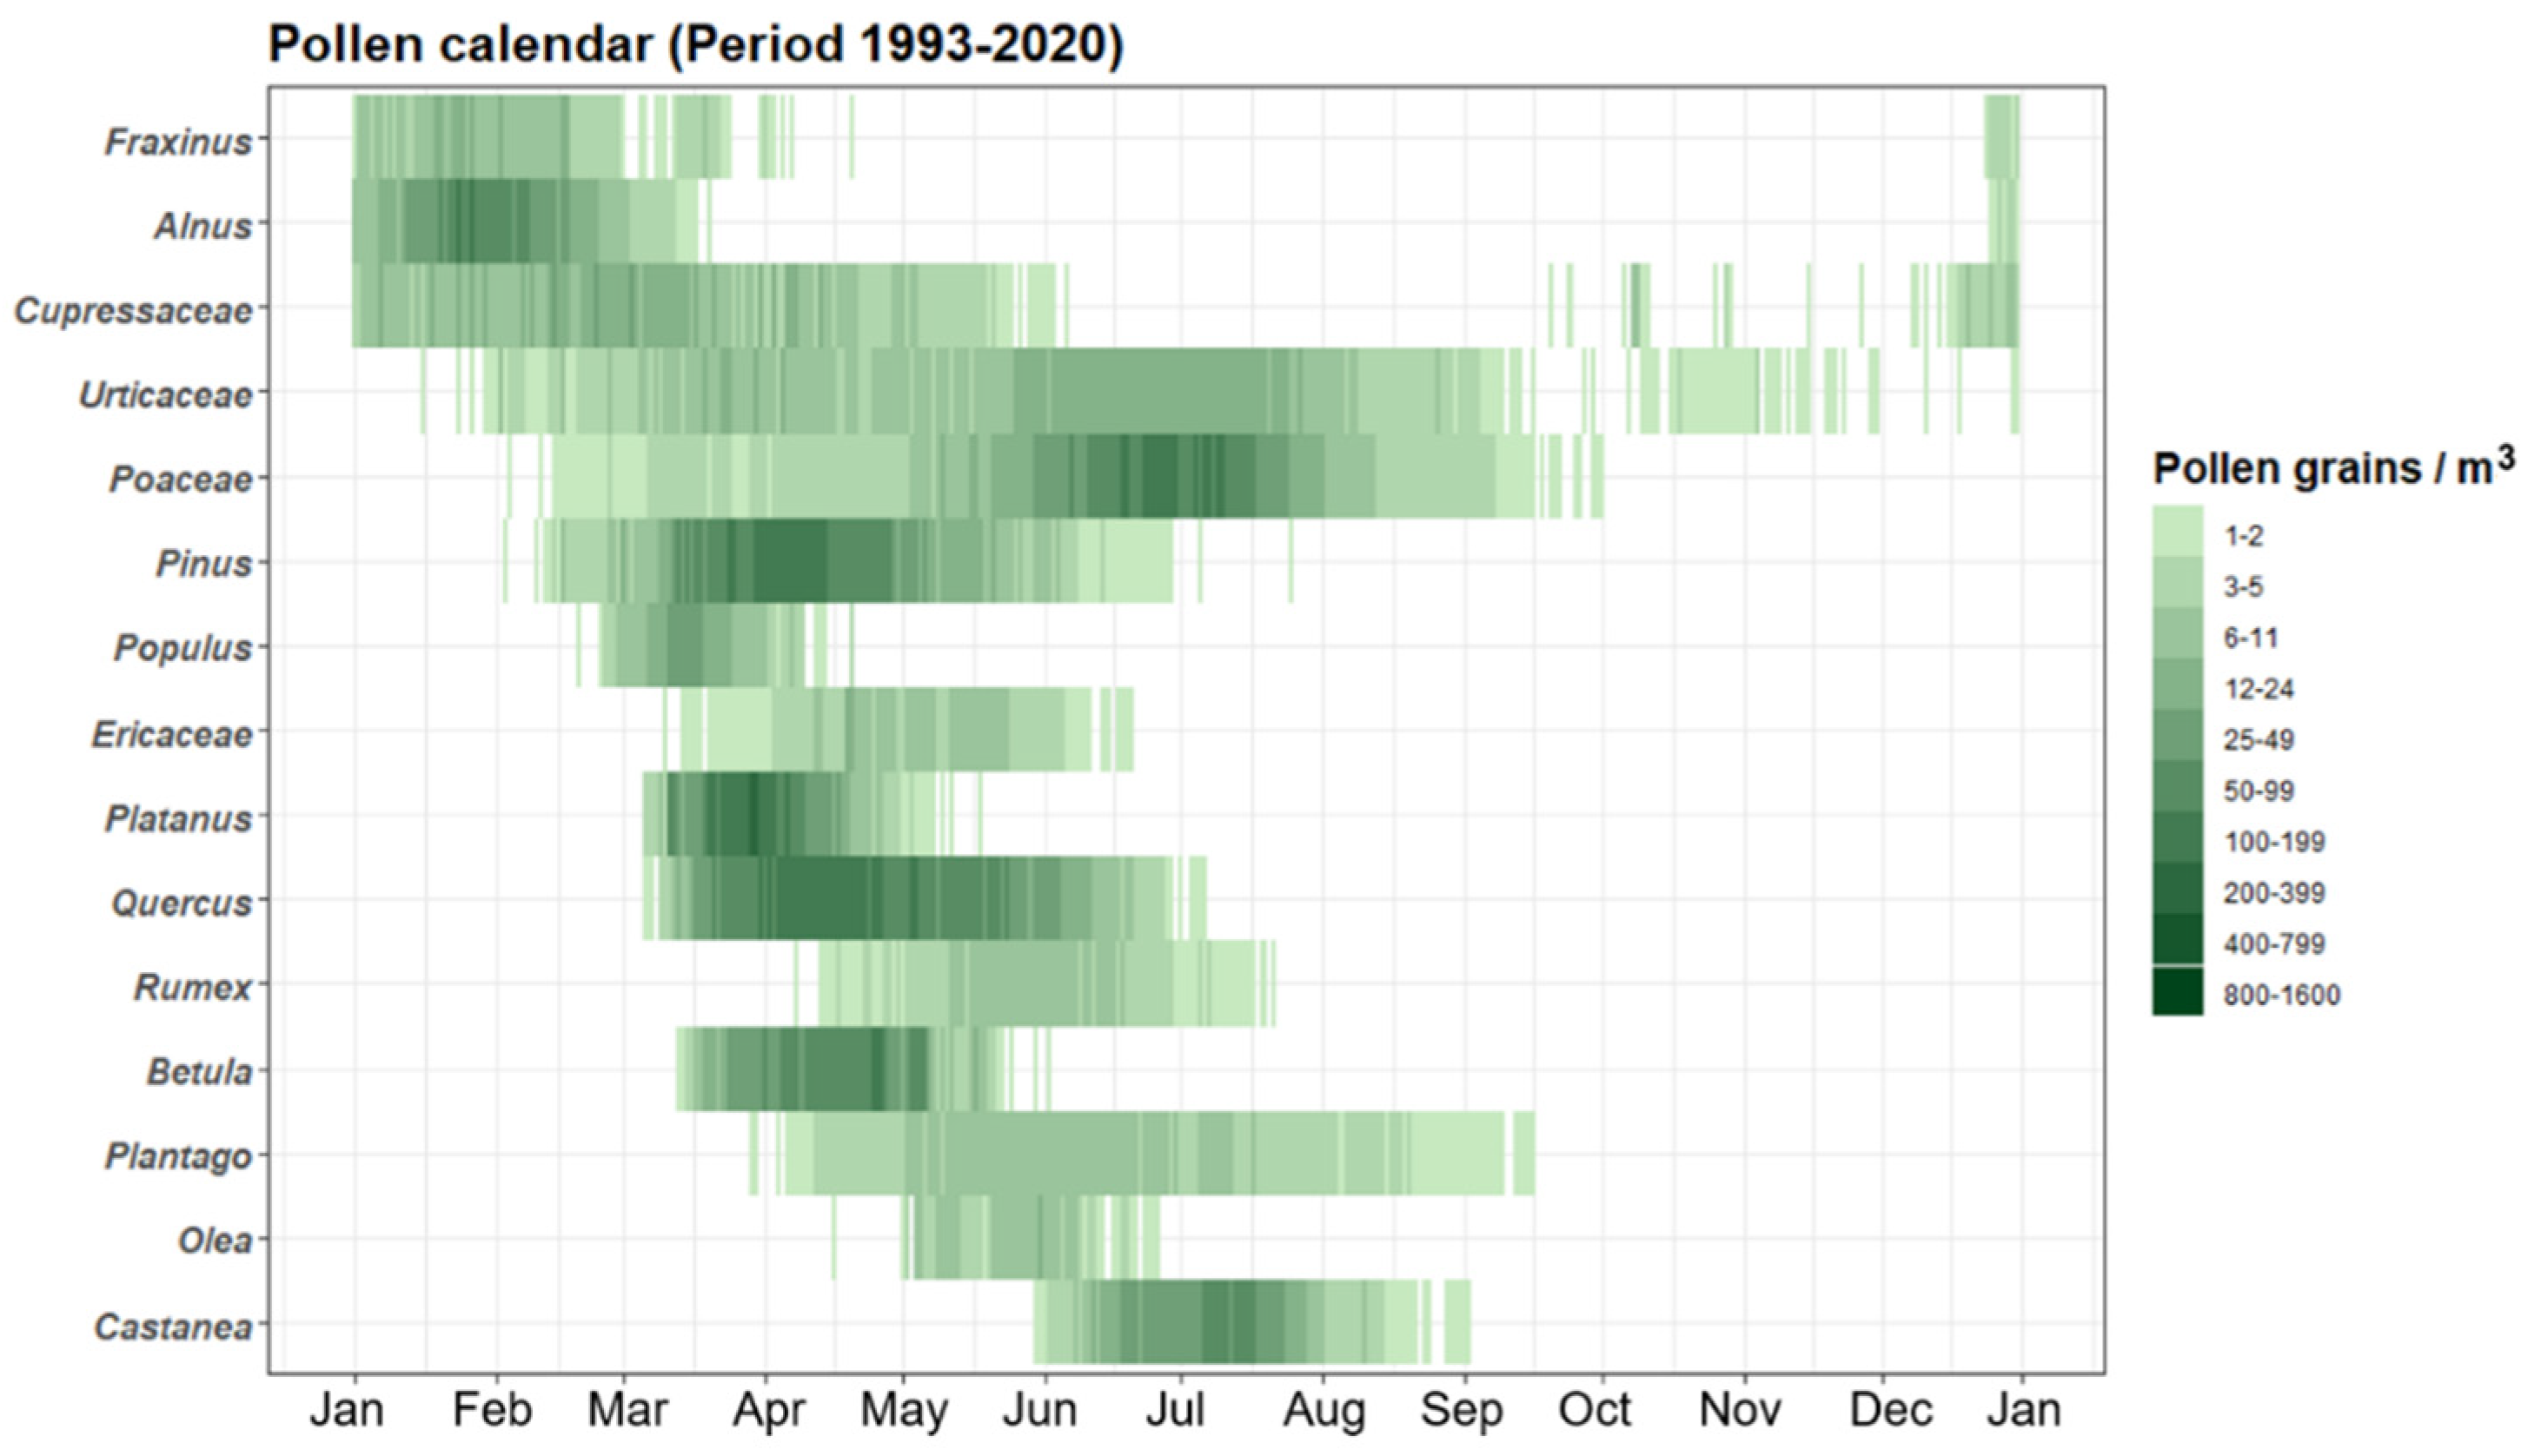
2.3. Pollen Calendar and Pollen Trends

A pollen calendar was built based on the 28-year dataset covering the 1993–2020 period, with the objective to determine pollen diversity, quantity and seasonal distribution over the studied period. These characteristics define the intensity and duration of pollination for each plant species. The ‘AeRobiology’ package [36] for R version 4.0.2 [37] was used for this purpose. The function ‘pollen_calendar’ was applied to the considered database, and a linear interpolation was used to fill the gaps before the generation of the pollen calendar [38]. The selected pollen taxa for this study were the most abundant spring tree species recorded in the Ourense city atmosphere, including Pinus, Platanus and Quercus. These plant species showed the highest total pollen values during the considered period and exceeded 100,000 pollen grains (Figure 2).
The function ‘plot_trend’ from the AeRobiology package [36] was applied to the selected plant species for the calculation and plot of the main pollen trends. This function calculates the main indexes of the pollen season of each considered species and applies a linear regression trend, showing the seasonal distribution of the considered parameters over the years. The considered seasonal indexes were the start and end date of the MPS (Start Date and End Date), the peak date or the date with the maximum airborne pollen concentrations over the MPS (Peak Date), and the total pollen integral over the MPS (Total Pollen). A linear interpolation was used for filling the gaps in the input data [38].

2.4. Statistical Analysis

2.4.1. Correlation Analysis

We applied the non-parametric Spearman´s correlation test to assess the statistical influence of the meteorological conditions on daily pollen airborne concentrations over the entire 1993–2020 studied period, considering the maximum, mean and minimum temperatures, rainfall and sunlight hours. The correlation analysis was applied to the MPS period for each pollen type, along the 28-years study period. The correlations were considered as significant at 95% (p ≤ 0.05) and 99% (p ≤ 0.01) confidence level. The STATISTICA version 8.0 software (StatSoft Inc., Tulsa, OK, USA, 2007) was used for this purpose.

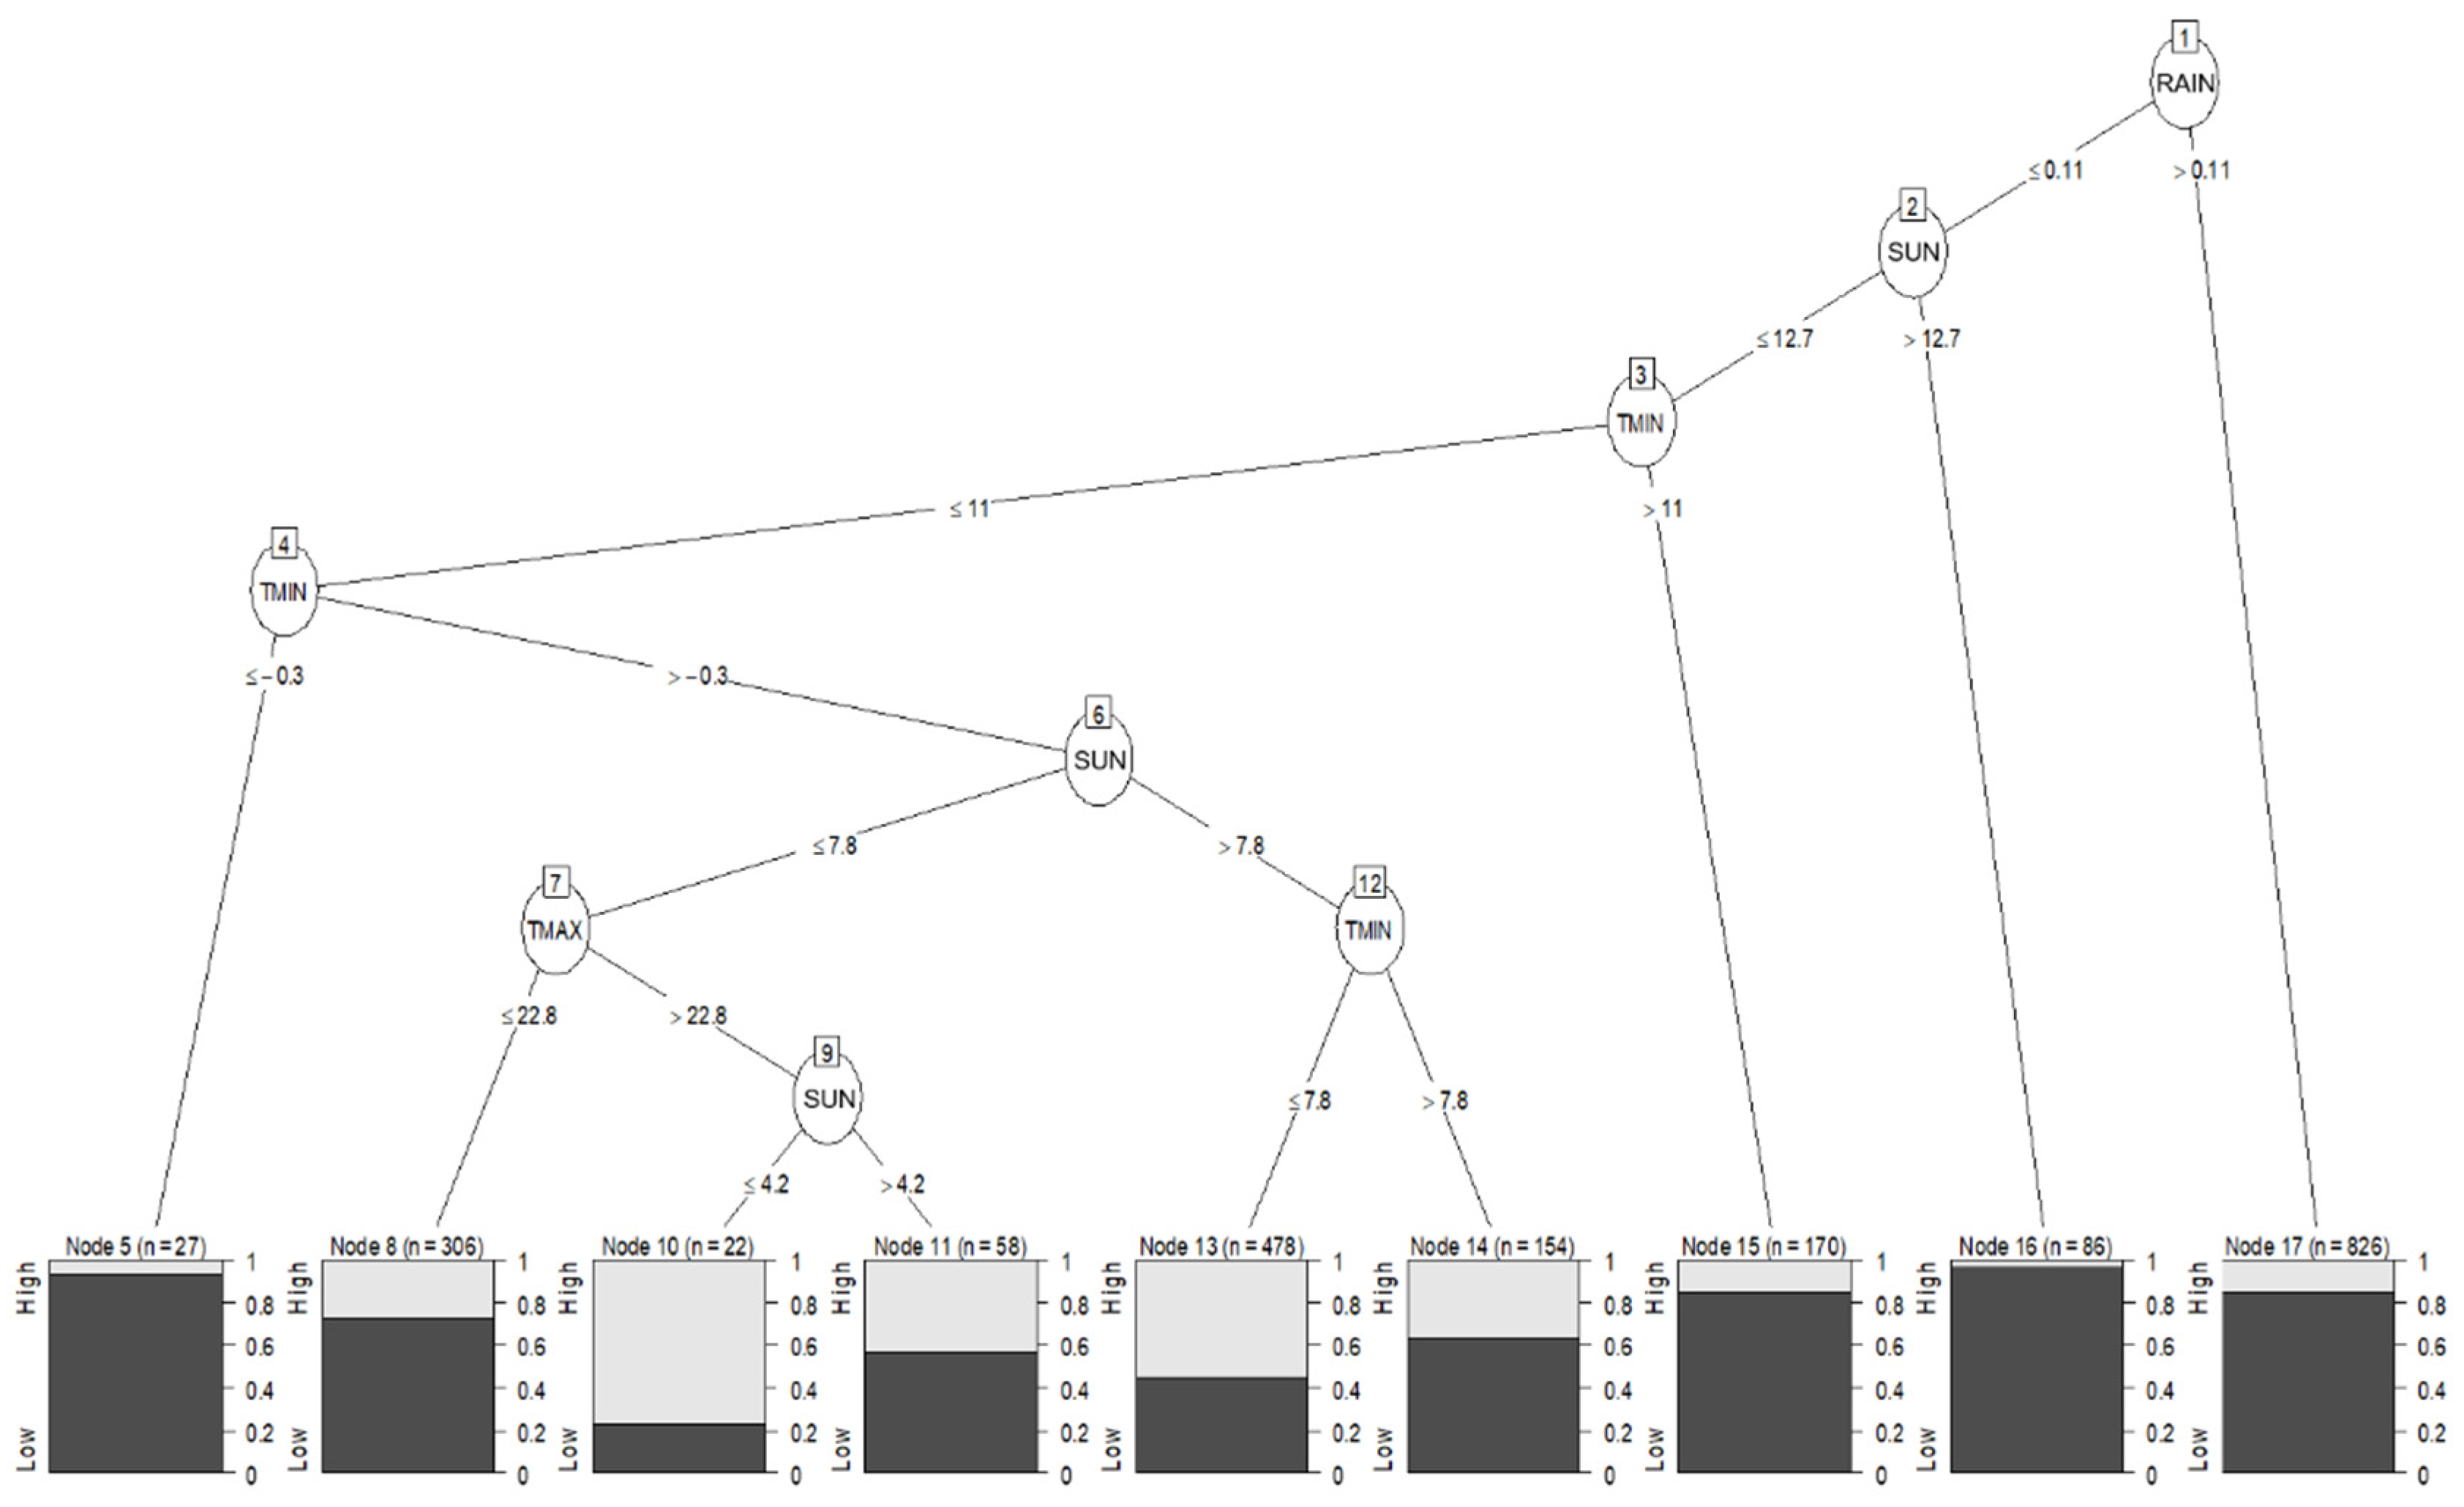
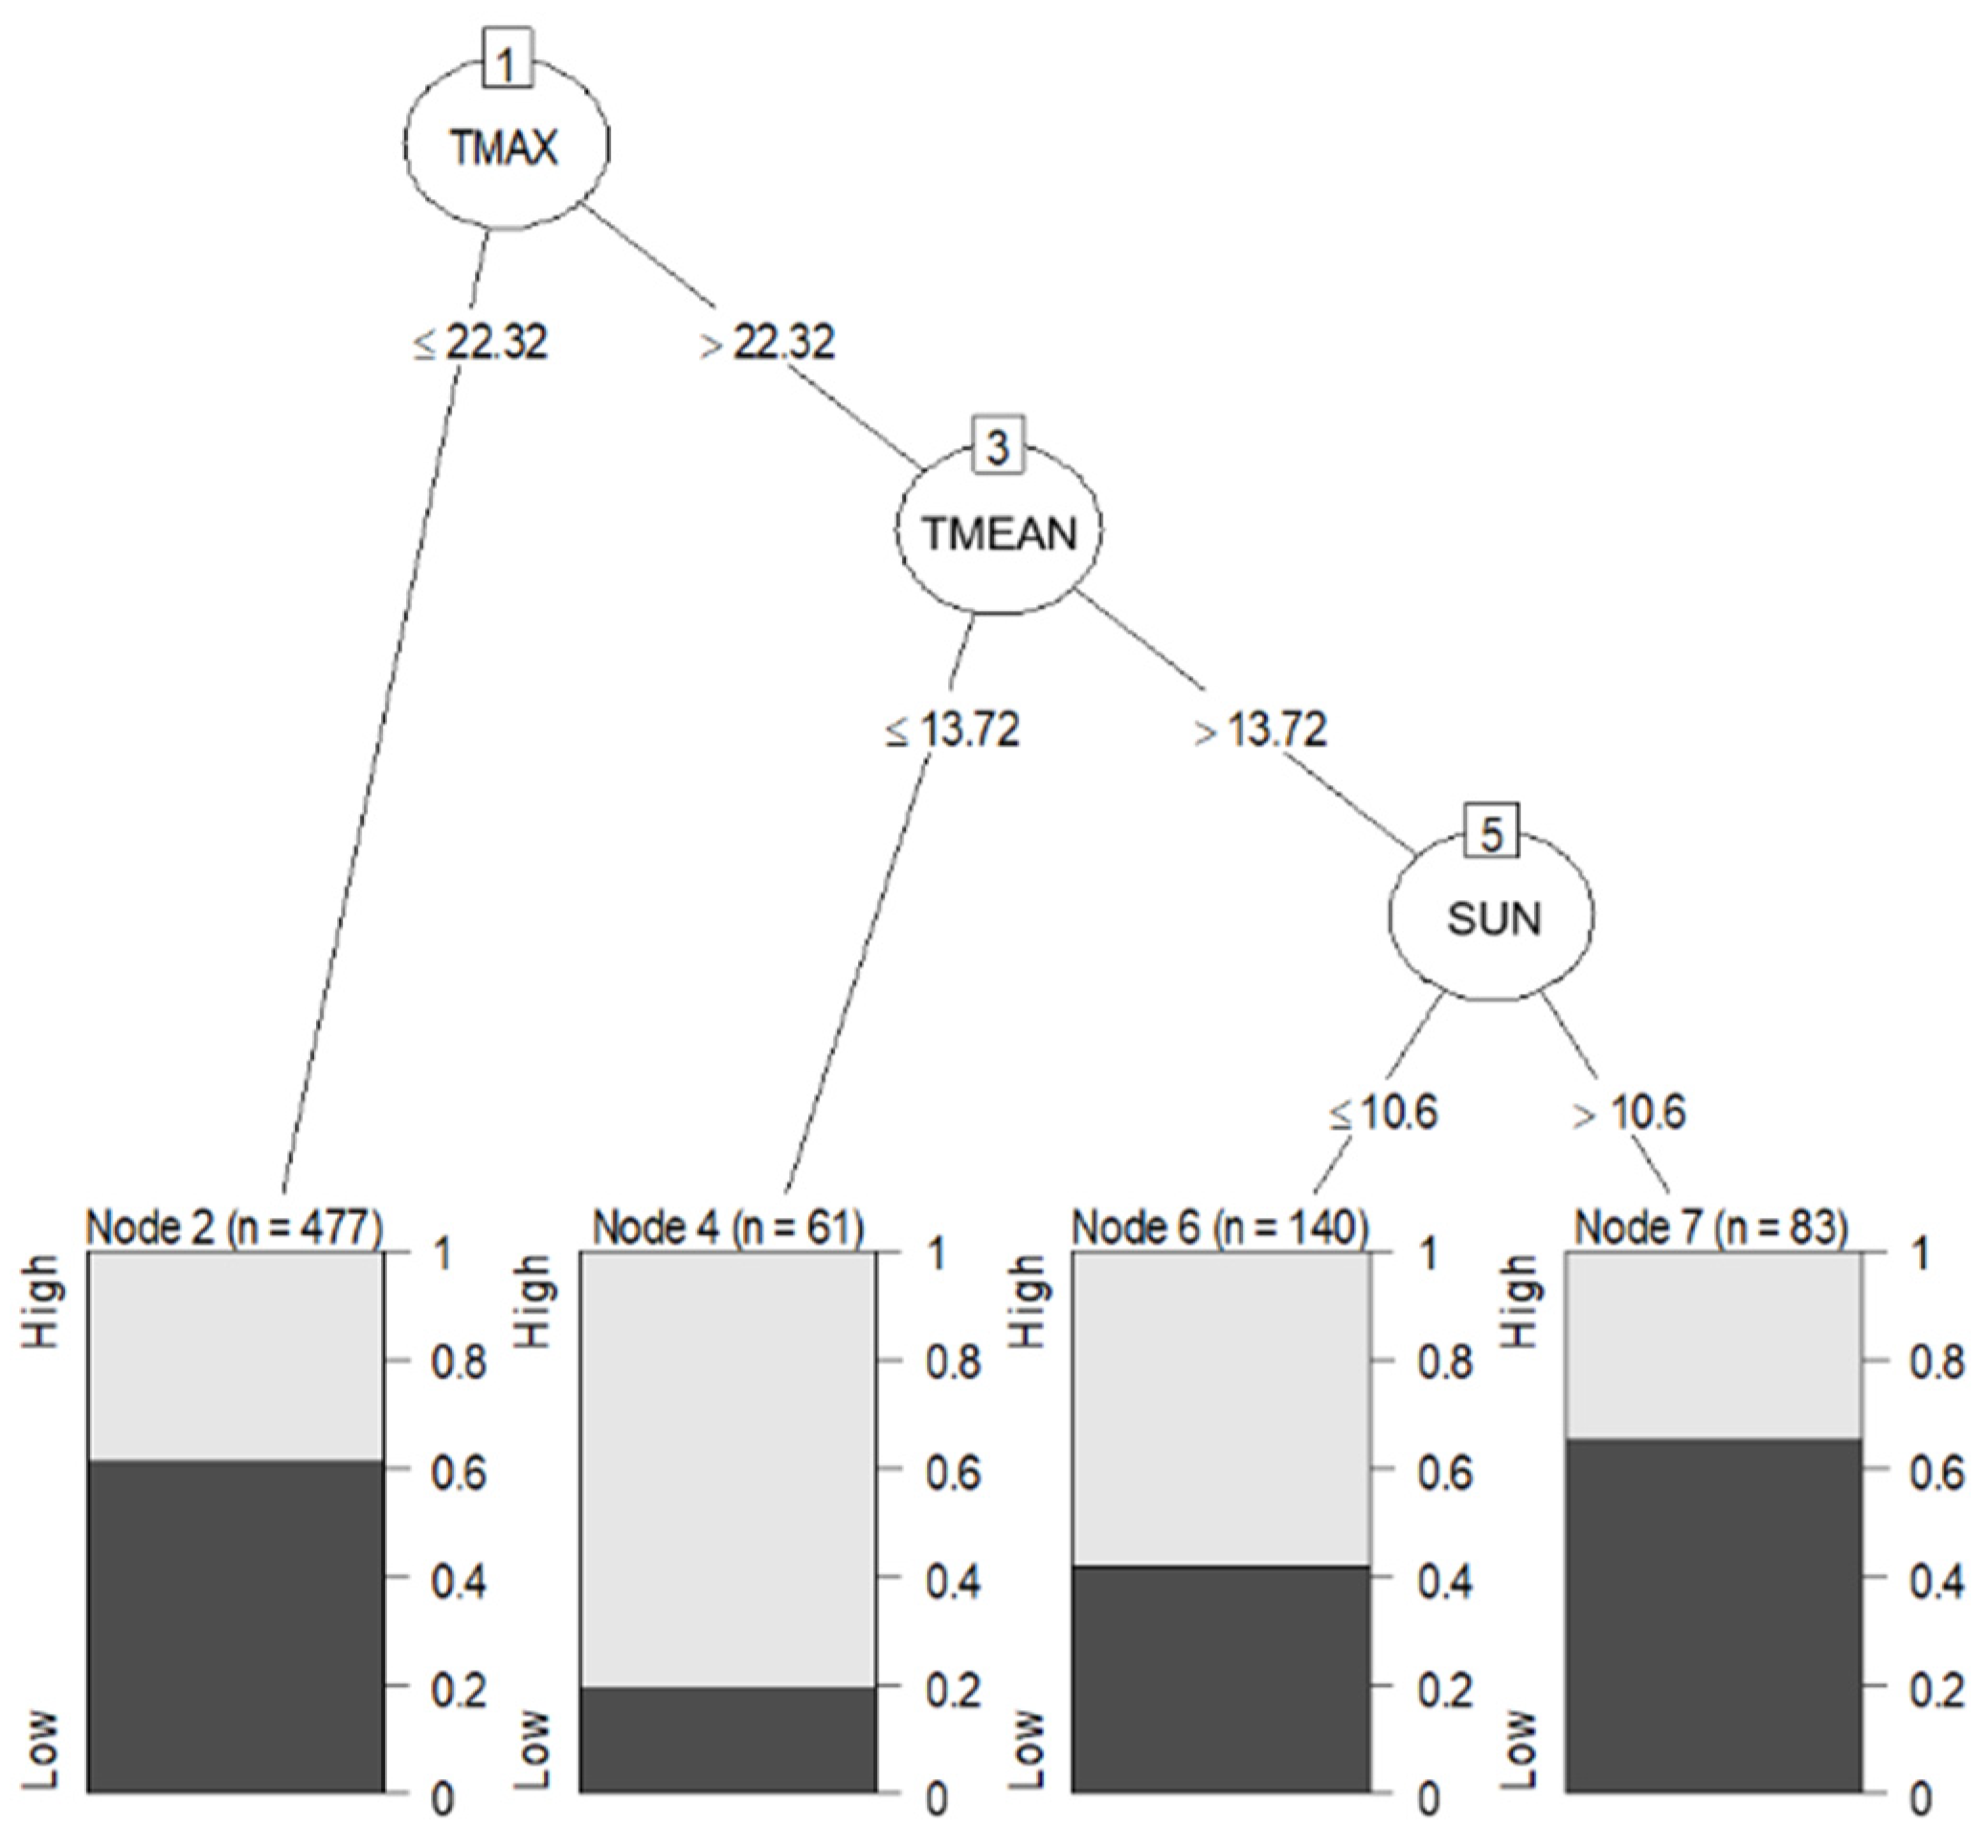
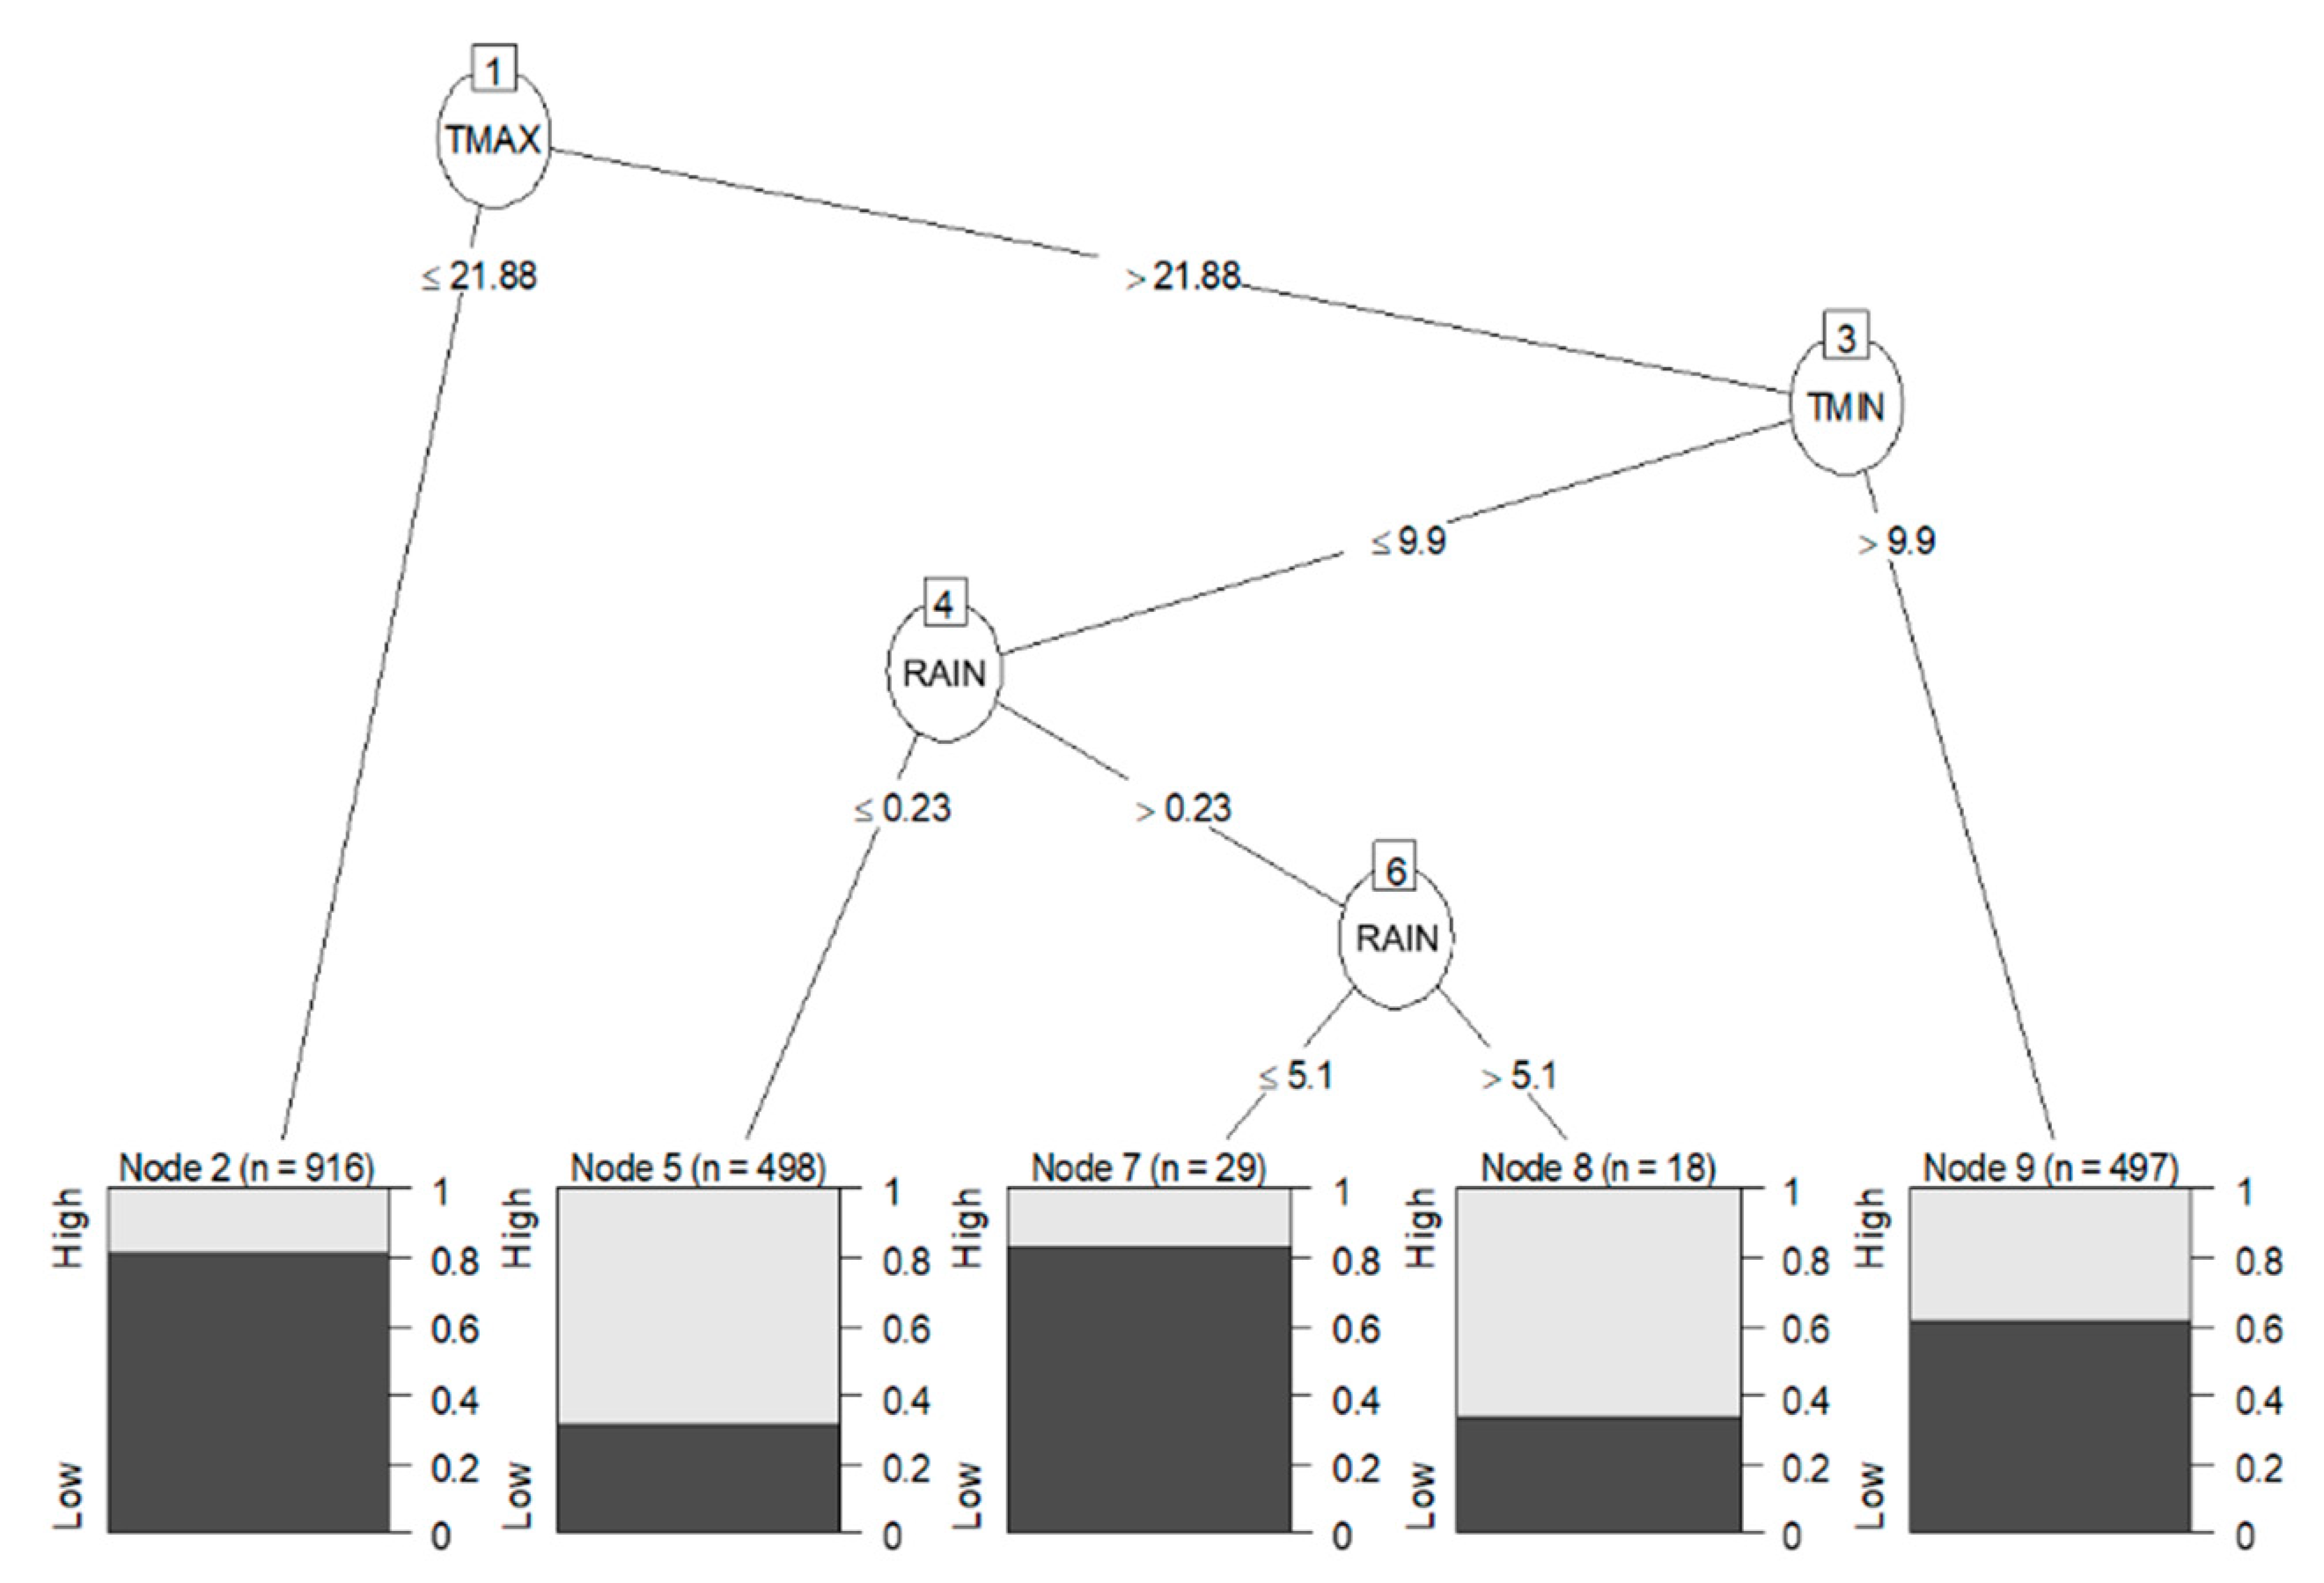
2.4.2. Data Mining Algorithm: C5.0 Decision Trees and Rule-Based Models

Data Mining supposes that the core of the KDD (Knowledge Discovery in Databases) process consists of automatic exploratory analysis and modeling of large datasets with the aim to detect previously unknown patterns. According to this, the obtained model can be used to understand phenomena in the data for the purpose of prediction or identification-classification [39]. Most Data Mining techniques are discovery-oriented, being based on inductive learning from the building of models generalized from a sufficient number of training cases. Among the numerous Data Mining methods, the C5.0 Decision Trees and Rule-Based Models belong to the supervised classification methods. Supervised methods attempt to determine the relationship between input attributes (independent or explanatory variables) and a target attribute (the dependent variable). This relationship is represented by a model structure. Models usually describe and explain hidden phenomena in the dataset and can be used to predict the value of the target attribute by knowing the values of the attributes or input variables [40].
For the statistical analysis of aerobiological and meteorological data, we applied the ‘C5.0 Decision Trees and Rule-Based Models’ algorithm (C50 package version 0.1.4.) for R software 4.0.2 [37], which is a Data Mining procedure for data exploration and the identification of previously unknown patterns [39]. The C5.0 algorithm is one of the most widely used methods among classification trees that allow the development of models to predict or identify the class or type to which an element belongs, based on the values of input or explanatory variables. The C5.0 uses the criterion of entropy or quantity of information (I) to assess the homogeneity of the classified groups, and the ‘winnowing’ mechanism to select the propitious predictors instead of using them all (1) [41]:
I = i [ p i   log 2 ( p i ) ]
where I: quantity of information; pi: proportion of values falling into the class level i.
Additionally, the C5.0 algorithm has an important improvement over the previous C4.5 version, including the boosting meta-algorithm that reduces bias and variance in a supervised machine-learning context. Boosting algorithms weigh the good and poorly classified cases differently in each iteration and give a greater weight to the poorly classified, thereby progressively modifying the decision rule. In C5.0, boosting generates a predetermined number of classifiers (decision trees) instead of just one, improving these ‘weak’ classifiers to achieve a higher degree of success, leading to a ‘strong’ classifier. Boosting in C5.0 raises the accuracy of the decision tree model [42].
Daily values of each pollen type were used as the dependent variable, and meteorological variables were used as independent explanatory variables. The airborne pollen values were transformed into a qualitative variable since the algorithm requires this condition for the dependent variable. For this data transformation, we followed the REA pollen categories for each plant species (Table 1), generating two categories of LOW when the pollen value is included in the Low REA category and HIGH when the pollen value is within the Moderate and High REA categories for each pollen type [32]. The obtained model classifies the provided cases into the two created classes, relating them with the meteorological parameters used as explanatory variables. In addition, the obtained model is also able to predict the category to which a new case will belong based on the explanatory variables.
Regardless of the length of the dataset for the different types, the training dataset was obtained as 80% of randomly selected cases by the ‘set.seed’ function for each pollen type. The remaining 20% of cases were used as a validation dataset to verify model functioning. Model accuracy was tested by a confusion matrix to obtain the percentage of successes of the prediction in comparison to the real classification of data, evaluating the performance of the classification model. Once the obtained percentage for the training dataset was demonstrated to be good enough (at least higher than 60%), the obtained model trained with the training dataset was applied to the validation dataset to verify that the obtained model was not over-fitted with the training data. When this condition is checked, a new model is obtained based on the entire available dataset for each pollen type during their MPS over the 1993–2020 studied period.

3. Results

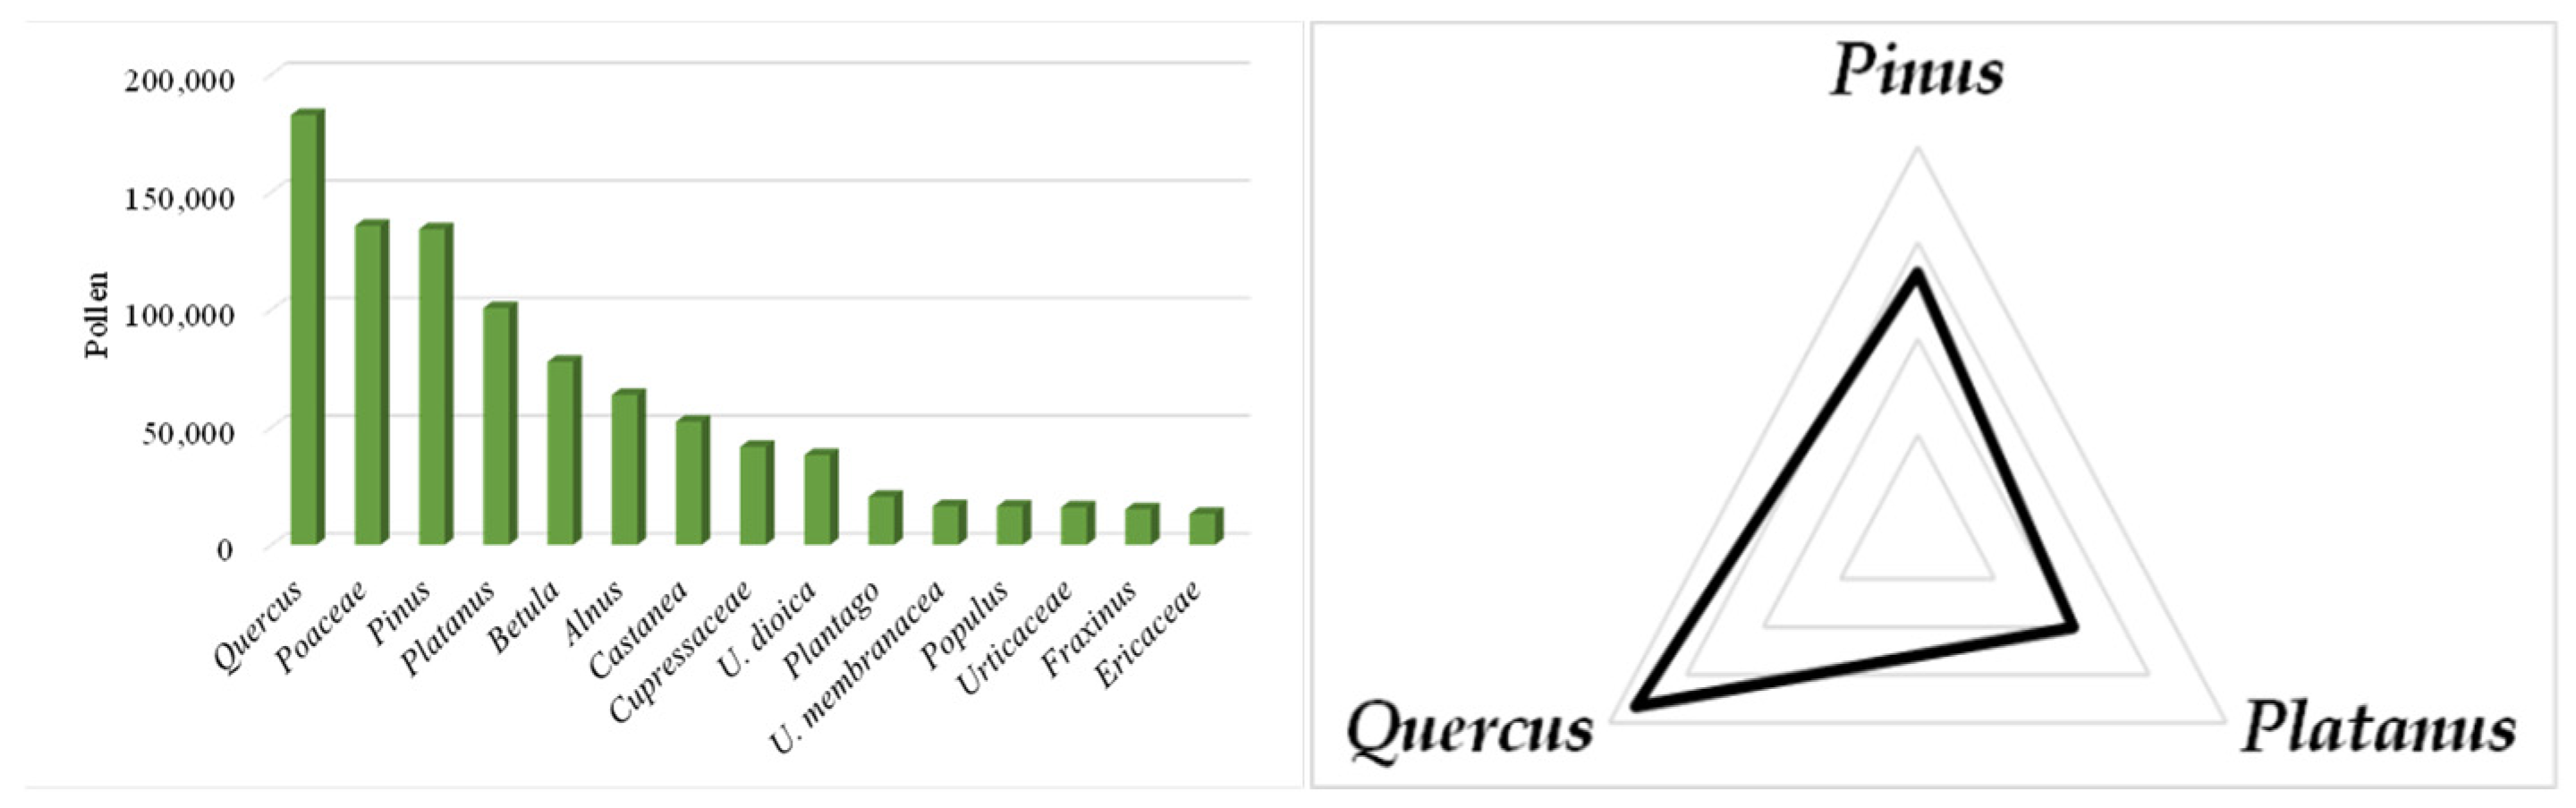
3.1. Pollen Seasonal Distribution

The seasonal distribution of the different pollen types recorded by the aerobiological sampler was assessed by means of a pollen calendar built for the main 15 pollen types during the 1993–2020 studied period, considering the highest values among the entire pollen types recorded (Figure 3). This representation describes the main airborne pollen content in the atmosphere of the plant species present in the area with a predominant anemophilous pollination mechanism.
Among the considered species in the obtained pollen calendar of the Ourense urban area, tree pollen is represented by a wide variety of plant species, some of them related to the bioclimatic characteristics of the area, such as the genus Pinus, Quercus, Castanea and species of the Ericaceae family mainly in shrub forms. Other tree pollen species are related to the riverbank areas such as Fraxinus, Alnus and Betula, or with the urban green areas in which these species are planted, as in the case of Cupressaceae, Populus and Platanus. The presence of Olea pollen in the Ourense city atmosphere mainly represents the ornamental use of some individuals, although there has been an increase in the cultivation of olive trees for farming exploitation near the urban nucleus. Regarding the herbaceous plant pollen, Rumex, Plantago and the families Urticaceae and Poaceae represent the main pollen types recorded in the Ourense atmosphere. Regarding the mean seasonal distribution obtained as an average of the 1993–2020 period, we observed airborne pollen grains over the entire year, although with different intensities depending on the plant species and season of the year. We found that the highest airborne pollen levels were recorded during two main periods, in April and May (mainly due to the Pinus, Platanus and Quercus, and also Betula pollen in lower importance), and in July (due to Poaceae and Castanea pollen). We also detected some high pollen levels during the winter months of January and February due to Alnus pollen (Figure 3).

3.2. Main Seasonal Indexes of the Considered Pollen Types
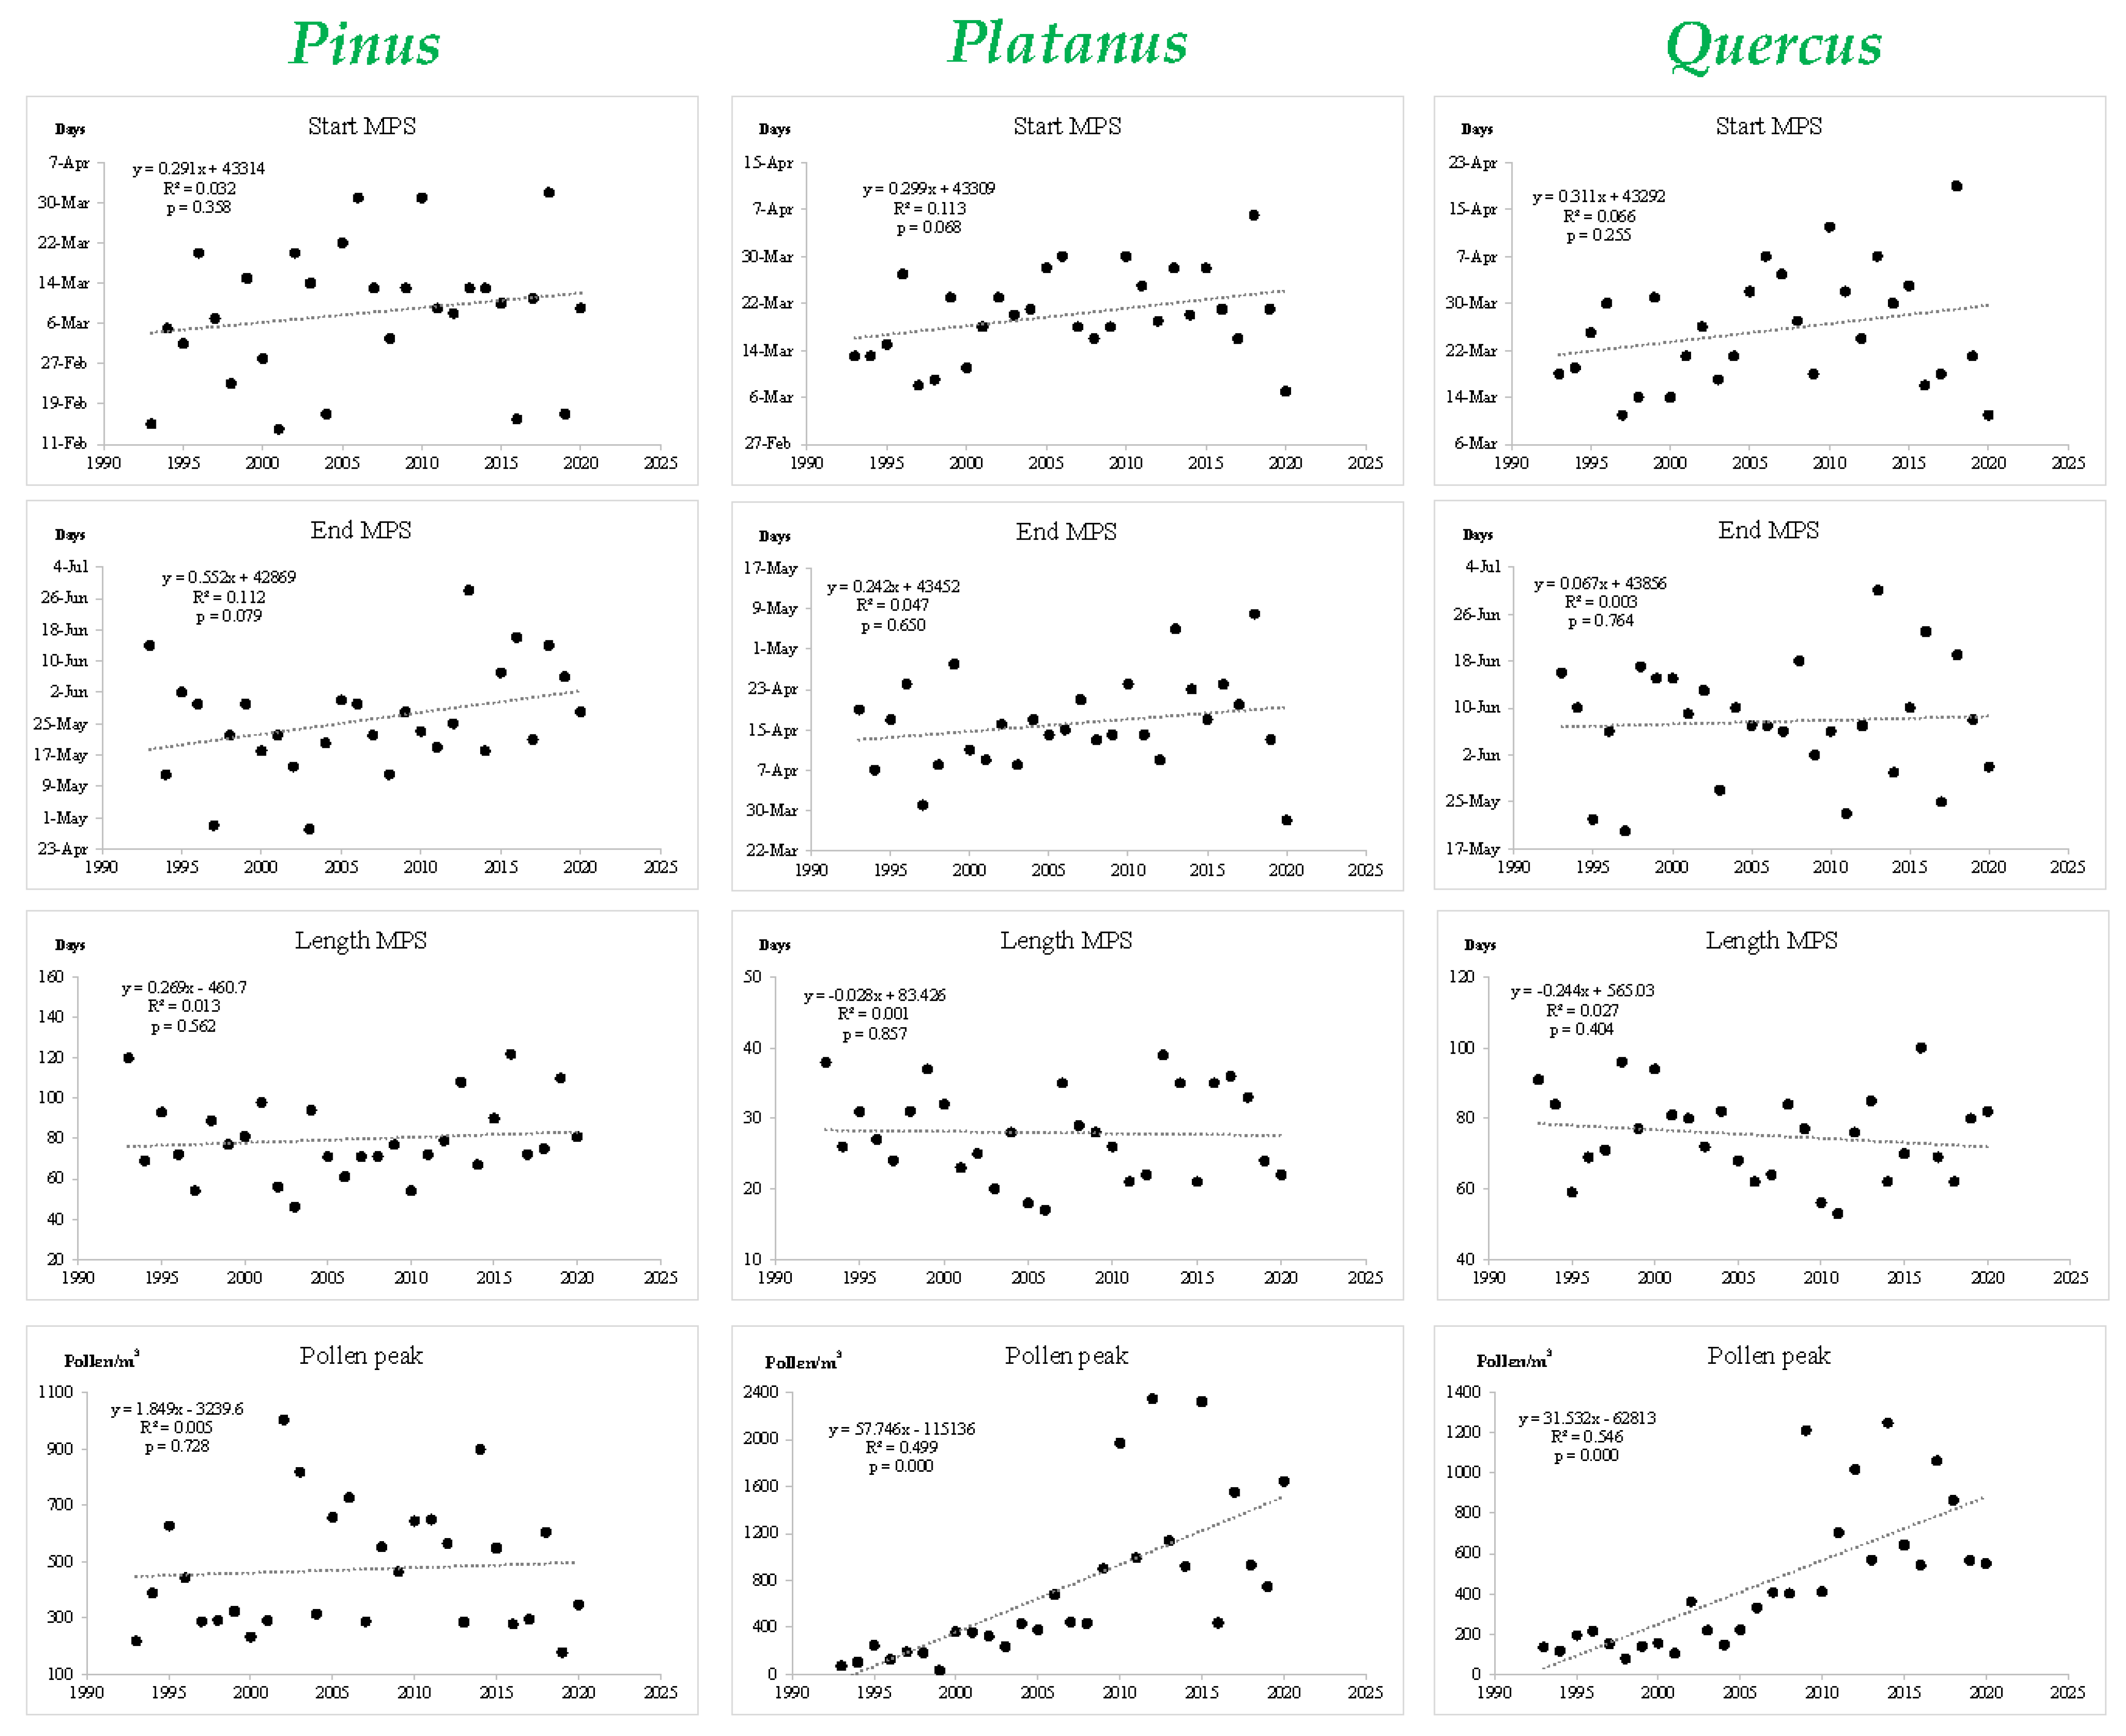
Considering the entire 1993–2020 studied period, the Pinus MPS had a duration of 80 days on average, ranging from 46 to 122 days. The earliest MPS start was detected on 14 February 2001, while the latest MPS start was observed on 1 April 2018, with a mean start date of 8 March. The MPS end date was 25 May on average, with the earliest end date on 28 April 2003 and the latest end date on 28 June 2013. The average SPIn was 4576 pollen grains for the Pinus pollen type, ranging from 1794 to 8871 pollen grains. The maximum pollen peak for this pollen type was 1003 pollen/m3 in 2002, while the average value of pollen peaks over the studied period was 472 pollen/m3. The date of the maximum pollen peak varied from 1 March to 27 April over the considered years, with a mean date of 2 April (Figure 4).
The Platanus MPS started on 20 March and ended 16 April, on average, with a mean length of 28 days ranging from 17 days in 2006 to 39 days in 2013. The earliest start date was recorded on 7 March 2020, while the latest start date was observed on 6 April 2018. Regarding the MPS end date, the earliest date was recorded on 28 March 2020, and the latest date was 8 May 2018. The mean value of SPIn was 3461 pollen grains, ranging from only 196 pollen grains in 1999 to 9848 pollen grains in 2015. The maximum daily pollen peak over the study period was recorded in 2012, with 2347 pollen/m3, while the mean value for the pollen peak was 732 pollen/m3. The mean peak date was 26 March considering all studied years, varying from the earliest peak date on 11 March 2020 to the latest peak date on 6 April 2010 and 2018 (Figure 4).
The Quercus MPS started 25 March on average, ranging from the earliest date on 11 March 1997 to the latest date on 19 April 2018. The mean MPS end date was on 7 June, varying from the earliest date on 20 May 1997 to the latest date on 30 June 2013. The length of the Quercus MPS was on average 75 days, ranging from 53 days in 2011 to 100 days in 2016. The mean SPIn over the studied period was 6247 pollen grains, markedly varying from 1296 pollen grains in 1998 to 18,269 pollen grains in 2017. The maximum daily pollen peak was recorded in 2014, with 1250 pollen/m3, while the mean value for the entire studied period was 456 pollen/m3. The peak date ranged from the earliest date on 21 March 1998 and 2009, to the latest date on 6 May 2018, with the mean peak date on 10 April (Figure 4).
Regarding the coefficient of variance (CV), which is a standardized measure of the dispersion of the data distribution relating the standard deviation to the mean, it showed similar and very low percentages for the MPS date-related variables (start, end and peak dates), ranging between 0.02% and 0.03% for all pollen types. Related to this, the CV of the MPS length showed markedly higher values, varying from 12.23–16.39%. The obtained results showed higher homogeneity among the date-related variables than the pollen-related variables, such as the SPIn ranging between 20.91–26.35%, and the pollen peak with values between 22.08–28.63%.
The obtained results from the linear regression trend analysis applied to the main seasonal indexes showed significant regressions for the pollen peak variable in Platanus (R2 = 0.499; p < 0.05) and Quercus (R2 = 0.546; p < 0.05) pollen taxa (Figure 4).

3.3. Pollen Trends

As a result of the applied ‘plot_trend’ function of the AeRobiology package for R [30], we calculated the main indexes of the pollen season of each considered pollen type obtaining a linear adjusted trend. We found statistically significant trends (p < 0.05) for the SPIn variable (Total Pollen) in all cases. The positive slope values indicated increased pollen grains over the MPS in the studied years; increases ranged from 107 pollen grains in the case of Pinus to 442 pollen grains in the case of Quercus (Table 2). The significant trends found from the ‘plot_trend’ function are shown in Figure 5. Further regression analysis with the STATISTICA package also detected positive significative trends for the oak start date of the pollen season and the oak and pines peak pollen amount.

3.4. Statistical Analysis: Influence of Meteorological Conditions

The Spearman’s correlation test applied to daily meteorological variables and the correspondent daily pollen concentrations over the MPS of each pollen type during the considered study period showed statistically significant correlations for the considered pollen types, with similar influences in some cases. We detected that rainfall negatively correlated with all studied pollen types. On the other hand, we found significant positive correlations between all pollen types and maximum temperature. Minimum temperature and sunlight hours also showed similar significant correlations except with Platanus pollen, which showed the lowest number of statistically significant correlations with the meteorological conditions. For the other considered pollen types, Pinus and Quercus, the minimum temperature exerted a negative influence on airborne pollen presence, while the daily sunlight hours had a positive influence (Table 3). The mean temperature showed a more dissimilar influence, with a significant and positive correlation only with Quercus. All significant correlations were found at the 99% confidence level (p ≤ 0.01). The highest Spearman´s correlation coefficients were found for Quercus with rain (R = −0.425) and maximum temperature (R = 0.408). The weakest correlations were found for Platanus with rain and maximum temperature and Quercus with minimum temperature (Table 3). The weakness of the Platanus correlations could be related to the variability in pollen records of this taxon, showing the highest coefficient of variation in MPS length, SPIn and pollen peak over the 1993–2020 period (Figure 4).
Regarding the obtained results by the applied Data Mining C5.0 decision tree algorithm, we found different complexity levels in the resulting decision tree model for each pollen type. For Pinus, the classification tree model was markedly more complex than for the other pollen types, with nine terminal nodes. The Platanus model identified four terminal nodes, and the Quercus model five terminal nodes. In each terminal node, the homogeneity in the classification of elements belonging to each class (High and Low pollen level) and the purity of each node is observable.
The Pinus C5.0 model obtained from the entire dataset used most of the available variables, except for mean temperature. The RAIN attribute was applied to 99.37% of cases, the SUN attribute to 59.45% of cases, the TMIN attribute to 57.64% of cases and the TMAX attribute to 19.89% of cases in the sample. The first variable and cut-off point in the classification tree was RAIN with a value of 0.11 L/m2, which divided the cases into node 2 and terminal node 17, with 83.90% of cases classified as Low-pollen. The SUN and TMIN variables were subsequently used by separating the terminal nodes 16, 15 and 5, with 95%, 84.71% and 92.59% of cases, respectively, classified as Low-pollen, which showed a high level of purity. From node 6, which uses the SUN variable with a cut-off point of 7.8 h, the model continues the classification, leading to more mixed Low-pollen terminal nodes (the nodes 8, 11 and 14, with 71.27%, 51.55% and 61.75% of cases, respectively, were classified in this group). This branching also led to the two terminal nodes classified as High-pollen in the decision tree, nodes 10 and 13, with 71.82% and 53.22% of cases classified in this group (Figure 6).
The Platanus C5.0 model developed from the entire dataset used three of the available variables. The TMAX attribute was applied to 100% of cases, the TMED to 37.64% of cases and the SUN to 28.55% of cases. The obtained decision tree was simpler than the Pinus model, with only four terminal nodes. Two of these terminal nodes were classified as Low-pollen, the nodes 2 and 7 with 59.96% and 64.22% of cases classified in this group, respectively. The other two terminal nodes were classified as High-pollen, with a higher purity degree in these nodes, showing values of 77.05% of cases classified in this group in node 4 and 56.5% of cases in node 6 (Figure 7).
In the case of Quercus, the obtained C5.0 model for the entire dataset used the TMAX variable, applying it to 100% of cases, the TMIN to 52.70% of cases and the RAIN to 27.98% of cases. The first variable used for the classification was the TMAX with a cut-off point of 21.88 °C, followed by the TMIN and RAIN with two successive cut-off points of 0.23 L/m2 and 5.1 L/m2. The resulting terminal nodes were classified as Low-pollen in three cases, in nodes 2, 7 and 9, and High-pollen in nodes 5 and 8. The Low-pollen nodes 2 and 7 showed a high purity, with 80.57% and 82.41%, respectively, of cases classified in this group, while terminal node 9 showed a more mixed distribution, with 59.96% of cases classified in the Low-pollen class. The High-pollen nodes 5 and 8 showed 65.70% and 66.11% of cases classified in this group (Figure 8).
In order to assess the accuracy of the obtained C5.0 decision tree models, we calculated the percentage of successful predictions in the classification of cases, comparing the real and forecast data in the confusion matrix. We observed that the validation dataset did not show any marked over-fit of data to the training dataset, exceeding 50% in all cases. The models developed from the entire dataset showed a high accuracy level, with a success percentage above 60% for all pollen types and 70% on average (Table 4).

4. Discussion

Pollen presence in the atmosphere is an effective indicator of vegetal diversity in a specific area, which can be used for the detection of species abundance and the determination of seasonal distribution. Airborne pollen concentrations in a given area are closely related to the local distribution of flora, meteorology and climate [2]. Moreover, airborne pollen can be used as a biosensor of the potential allergenic load in the atmosphere, being a complimentary resource for the prevention and mitigation of allergy disorders in sensitized populations [2]. In this sense, pollen calendars identify the main periods of potential allergy risk due to the location of the more probable pollination periods of the allergenic pollen types.
The tree pollen taxa considered in this study describe the vegetal communities of the surrounding area to the aerobiological sampler. Pinus forests are the predominant formation in boreal, subalpine, temperate and even arid bioclimates, covering an extensive area in the Northern Hemisphere [43,44]. The Pinus taxon is mainly represented by P. pinaster, as well as P. sylvestris and the introduced P. radiata in Northwest Spain [43]. The Pinus pollen is one of the most abundant airborne forest pollen taxa during spring and early summer in different regions of the Iberian Peninsula [45]. Although this genus belongs to the Mediterranean vegetation, it was used for land afforestation both in Eurosiberian and Mediterranean areas due to its fast growth and resistance, being used as recovery for deforested or fire-damaged areas and supporting ecosystem regeneration by acting as pioneer species [46,47,48]. Quercus spp. forests are the predominant vegetation in Galicia, with some differences in the main species representation depending on the specific climatic and biogeographic characteristics of each region. The Atlantic influence on this territory enables the presence of Q. robur in all its extensions, while the Mediterranean influence increases and intensifies the presence of Q. pyrenaica and Q. suber. The Quercus MPS has been described in Ourense (NW Spain) from the second fortnight of March to the end of May or beginning of June [49]. Finally, The Platanus genus belongs to the Platanaceae family, including eight known species, which are tall trees native to temperate and subtropical regions of the Northern Hemisphere [50]. In nature, they frequently develop on riverbanks and streams, being also planted as ornamental plants (hybrid Platanus x hispanica) in pedestrian areas of many cities from Europe and North America [51]. This species is fast growing and highly resistant to contamination, being able to accumulate pollutants in the cortex and capture particulate matter [52,53,54]. Plane trees are characterized by a short and intense flowering period from March to May [55,56,57], with an abundant production of pollen grains that have been described as allergenic [55,58]. The European Academy of Allergy and Clinical Immunology (EAACI) identified the Platanus pollen as an important allergen source responsible for respiratory symptoms such as allergic rhinitis or allergic rhino conjunctivitis [59,60].
The main seasonal indexes for the studied pollen types showed different results depending on the plant species. On average, the highest Seasonal Pollen Integral over the MPS was obtained for Quercus with 6247 pollen grains, although the maximum pollen peak was recorded for Platanus with 732 pollen/m3. The mean length of the Platanus pollen season was markedly lower than the Quercus type and shorter among the studied taxa; this value points out the explosive character of the bloom period of this taxon—very short and intense [58]. The highest CV values were found for Platanus, indicating a markedly higher variability for pollen-related variables in this pollen type over the studied years. The calculated trends based on the seasonal indexes showed statistically significant linear trends (p < 0.05) for Total Pollen (SPIn). The increase in pollen production is one of the expected climate change effects on plant behavior, leading to important health impacts [61,62]. In relation to pollen peak (pollen/m3), or the maximum amount of daily pollen recorded within the pollen season, we found statistically significant increasing trend results with linear regression analysis in Platanus and Quercus, with a slope of 58 pollen grains for Platanus and 32 pollen grains for Quercus over the considered years. In the case of SPIn, the increased airborne pollen levels due to the influence of climate change effects on plant phenology and pollination were also noticeable in the pollen peak of some species. Similarly, Anderegg et al. [9] found a substantial intensification of pollen seasons in North America over the 1990–2018 period, detecting significant temporal trends in some pollen metrics, including daily pollen extremes, pollen season start date and length, and seasonal and annual total pollen integral. They observed increases of 20.9% in annual pollen integrals and 21.5% in spring (February-May) pollen integrals for the considered period; among the studied taxa, they found that tree pollen showed the largest increases in spring and annual integrals. By contrast, Pinus pollen did not show any significant linear trend in pollen peak, even though it did in the SPIn. This result could be caused by the differential nature of this taxon since the optimum conditions for the anthesis of Pinus were previously described as moderate temperatures and low rainfall [63,64].
Meteorological conditions exert their influence on vegetal species with differentiating effects depending on the species, seasonality of its development and biogeographical area. To assess this influence, we applied different statistical analyses to the available dataset of 28 years of pollen and meteorological data. We obtained significant Spearman´s correlations for all pollen types with meteorological conditions, and we found similar results among the considered pollen taxa, such as the negative correlations with rainfall and positive correlations with maximum temperature, which were found in all cases. The negative correlations of atmospheric pollen load with rainfall could denote the particle-deposition effect driven by washout processes, in which raindrops attract the airborne particles by impaction, condensation and nucleation [65]. Previous studies also pointed out negative correlations of rainfall variables, as daily rainfall or the number of precipitation days, with pollen concentrations [66,67,68]. This negative correlation indicates that the presence of rain causes the decrease of airborne pollen grains. On the contrary, the positive correlations detected for maximum temperature with all pollen types could denote the influence of temperature on pollen release and dispersal processes implied in the presence of airborne pollen grains in the atmosphere [13,66,69,70,71]. The minimum temperature was significantly correlated with Pinus and Quercus, showing a negative influence. As Peternel et al. [72] indicated, associated with the relevance of temperature on the pollen release and its presence in the atmosphere, airborne pollen concentrations tend to decline as the temperature drops. This effect was also observed in our statistical results since the minimum temperature values showed a negative correlation with the airborne pollen load. The taxonomic characteristics of the considered plant groups could be related to the obtained results in relation to the influence of minimum temperature. According to these results, we found no significant correlation of minimum temperature and Platanus pollen, contrary to the other two studied pollen types, Pinus and Quercus, in which we found statistically significant negative correlations (Table 3). Furthermore, in the obtained Platanus C5.0 model, minimum temperature was not selected by the algorithm for the development of the model, while in the other taxa, this variable was applied to 57.64% of cases in the case of Pinus, and 52.70% in the case of Quercus (Figure 6, Figure 7 and Figure 8). This differentiating effect of minimum temperature could be due to the taxonomy of the considered taxa, since Pinus and Quercus pollen types encompass multiple pollen sources and multiple plant species in the study area, with prolonged pollen seasons partially explained by this condition, showing a negative correlation with the minimum temperature of the cooler, early spring days. By contrast, Platanus showed a shorter pollen season mean length over the studied pollen types, markedly lower than Pinus and Quercus pollen seasons, being mainly represented by the ornamental plane trees planted in the urban area. Considering the correlations found with sunlight hours, we found positive and significant influence in both Pinus and Quercus pollen types. Previous studies found that pollen production and release are favored by sunlight, affecting pollen production immediately in the upcoming days [73]. Furthermore, the anther dehiscence process is strongly linked to the properties of the atmospheric boundary layer, since sun exposure leads to an increase in temperature, and this means a higher resonant vibration in the anthers area. Thus, in combination with the accelerated anther desiccation due to sunlight, promotes a hastening of pollen abscission, since it has been demonstrated that slender stamens (as in the case of anemophilous angiosperm trees) requires a resonant vibration to sufficiently accelerate the anther for the pollen grains ejection [74].
The resulting classification of C5.0 decision tree models showed specific influence-models built especially for each pollen type, with different variables and key values for the classification into the proposed categories of High and Low pollen. In the Pinus C5.0 model, the predominant variables were rainfall, sunlight and minimum temperature, which were used at the beginning of the classification and along the development of the rest of the branching, in a different order. In the Pinus model, the terminal nodes classified as Low-pollen dominated the classification tree, with only two nodes of High-pollen among the nine terminal nodes obtained. This could denote a wider range of favorable conditions for Low-pollen and more restrictive conditions for the occurrence of high pollen for this taxon in the studied area. After the initial conditions described by the three first nodes, the High-pollen terminal nodes are defined by a minimum temperature between −0.3 and 11 °C, and then different sunlight hours. The High-pollen terminal node 10, which is the purest node of this type, requires a maximum temperature above 22.8 °C and less than 4.2 sunlight hours. The other High-pollen terminal node is 13, defined by more than 7.8 sunlight hours and a minimum temperature below 7.8 °C, narrowing even more the range of this variable from −0.3 to 7.8 °C for this node. These results seem to denote a non-homogeneous behavior of this pollen type in comparison with the rest of the considered taxa since the occurrence of High-pollen classification requires low rainfall, low sunlight hours and a minimum temperature from −0.3 to 7.8 °C, suggesting that mean temperature is not very elevated. However, these values are closely related to the hypothesis of Sharma et al. [63] and Khanduri and Sharma [64], who pointed out that temperature values near 20 °C and low rainfall are the optimum conditions during the anthesis of Pinus. Thus, in agreement with the findings of Green et al. [75], who detected that the Pinus season started four weeks after minimum temperature values of 5–9 °C. This chilling, together with low rainfall, were found to be required to overcome dormancy and promote male strobili maturation, as previously demonstrated for flowers of several dicotyledonous tree species such as oak, almond or peach [76,77,78].
The Platanus C5.0 model used as classifiers the maximum temperature, mean temperature and sunlight hours, with this order of relevance and a marked dominance of maximum temperature. This classification tree generated a balanced distribution, with two High-pollen and two Low-pollen terminal nodes. In the case of the High-pollen terminal nodes, the condition of maximum temperature above 22.32 °C was met for both, with differences in the successive classifying steps. The terminal node 4, which is the purest node in the decision tree and belongs to the High-pollen type, is defined by mean temperature below 13.72 °C. This condition, together with the previous classification step, denotes the positive impact of a marked daily thermal amplitude for the presence of high pollen levels in the atmosphere. The urban heat island effect, described in many cities and towns of different countries, modifies the physical properties and characteristics of the lower atmosphere layers, affecting temperature, wind and rainfall patterns [14]. The diurnal temperature range, defined as the difference between daily maximum and minimum temperature, is usually smaller in the town center than in the surrounding suburbs, in which there are horizontal surfaces that are damper or covered by vegetation [79]. The possible effect of the thermal amplitude on the concentrations of Platanus airborne pollen was observable in this study due to the range covered by the aerobiological sampler used in this research, placed near the city center. Mimet et al. [14] found a gradient of climatic variables over the urban heat island and small-scale urban structure that affect the flowering features of Platanus acerifolia and Prunus cerasus. They found that the diurnal temperature range influenced the flowering date and the end of the flowering cycle, acting during short periods of three days. The other High-pollen terminal node met the conditions of mean temperature above 13.72 °C and sunlight below 10.6 h. This statistical relation could be due to the conditions that usually accompany a higher number of sunlight hours, probably causing excessive temperature that negatively affected the Platanus pollination. Concerning the objective of this research, the analysis of airborne pollen levels and trends of their seasonal distribution, there are numerous studies on the impact of heat stress on pollen-pistil interactions and different steps of the pollination process in angiosperms, including abnormalities in anther morphology that limit anther dehiscence at anthesis [80]. This model showed the relevance of temperature and sunlight for the prediction of the occurrence of different levels of airborne pollen. As previously described, temperature and sunlight are among the most influencing factors on pollen generation and release processes, especially temperature, in the development of floral organs in tree species [73,81,82].
In the case of Quercus, the obtained C5.0 model classified the sample cases into five terminal nodes, using as classifying variables the maximum temperature with a marked predominance, followed by the minimum temperature and rainfall in the last place. The first division was applied with a maximum temperature of 21.88 °C, which generated one of the purest nodes of the classification of Low-pollen when maximum temperature is below this limit value. If this value is exceeded, the decision tree continues to branch, subsequently using the minimum temperature with a cut-off point of 9.9 °C, and rainfall with two different breakpoints of 0.23 L/m2 and 5.1 L/m2. If the minimum temperature is above 9.9 °C, the resulting terminal node is Low-pollen, with a 59.96% purity. On the contrary, if the minimum temperature is below 9.9 °C and rainfall is below 0.23 L/m2, near to absence of precipitation, the classification model predicts a High-pollen node, which is the terminal node 5. Considering the same minimum temperature threshold, if rainfall is between 0.23–5.1 L/m2, the classification ends on a Low-pollen terminal node, node 7. However, if rainfall is higher than 5.1 L/m2, the decision tree generates a High-pollen terminal node, node 8. The role of rain in the determination of the atmospheric pollen levels is probably related to the washout effect on airborne pollen since the High-pollen node 5 corresponded to rainfall below 0.23 L/m2 [65,68]. On the other hand, the terminal High-pollen node 8 used rainfall above 5.1 L/m2 for the classification. However, this relation could be due to the simultaneous occurrence of high pollen levels during the first days of rainy periods and not a predictable relation, since this terminal node was composed of only 18 cases, a notable lower value than the 498 cases that form terminal node 5. The rainfall variable was used for the classification of 27.98% of cases, while the minimum temperature was applied to 52.70% and maximum temperature to 100% of cases, which shows the stronger influence of this meteorological variable. As Jato et al. [49] previously described, warm and sunny days without rainfall during the flowering period enhance pollen release and dispersion in the atmosphere on wind-pollinated plants.
For further improvement of model accuracy and predictive ability, some methodological aspects may be considered, such as the delimitation of pollen thresholds per pollen type, the definition of the main pollen season, and the inclusion of real-life pollen allergic symptoms. The REA definitions of pollen categories and thresholds used in this study determine the limit values of atmospheric pollen content required for a small, medium or large percentage of the susceptible population to develop pollinosis symptomatology [32]. These pollen categories are based on pollination features of the considered species, such as their anemophilous/entomophilous character, Annual Pollen Integral (APIn) or sum of daily pollen concentrations over the whole year, daily pollen content in the atmosphere over the season, and their potential allergenic ability [32]. These proposed values are an approximation for the entire Spanish territory; however, modifications of type-specific classes and thresholds may be required at local or regional scale due to the influence of numerous factors involved in the appearance of pollen-allergy symptoms, such as the presence of species that might generate cross-reactions, atmospheric pollutants or specific weather conditions. The consideration of these factors would notably enhance the obtained results with more specific pollen thresholds adjusted to the analyzed area, with particular bioclimatic conditions and variations from the average national values. The definition of the main pollen season is another variable that could be of interest to consider for the improvement of the developed models. There is a wide variability regarding the criteria used to limit the pollen season. Jato et al. [83] tested ten different criteria to examine the resulting changes in pollen curves. They found that the results varied for the different pollen types and for the particular features of the sampling site, such as the number of species included in the pollen type, pollen transport ability, meteorological conditions or annual total pollen variability. These factors, affecting the presence of pollen in the air should be considered for the interpretation of the aerobiological results since they are variable in each area due to their particular characteristics. Furthermore, phenological observations should be made to select the best criteria according to local flowering behavior. This comparative study showed that the selected criteria for a determined study should not be universal in nature, but it should be adjusted as a function of the pollen type and the regional bioclimatic characteristics. Another limiting factor that may be considered for the improvement of the obtained models is the selected method for interpolating missing data in the aerobiological database. In this study, we selected the linear interpolation method for filling the pollen gaps. Linear interpolation is one of the most commonly used methods to complete missing data, although it is more extended in other disciplines than in Aerobiology [84]. Other interpolation methods, such as moving mean interpolation or using data of nearby locations, are rarely applied. These two methods, together with another three (i.e., linear, spline and temporal series interpolation), were tested by Picornell et al. [84] for the assessment of their accuracy and performance. These authors found that the moving mean interpolation method obtained the highest success rate on average. They also pointed out that errors in interpolation were greater when there were high oscillations in airborne concentrations during consecutive days, as occurs in the pre-peak and peak periods, with the highest interpolation errors. Errors in interpolation are also higher when gaps are longer than 5 days, in which other methodological approaches would be advisable for completing these periods of missing data.
The study of links between pollen and weather makes possible the detection of potential allergy risk periods based on projected meteorological forecasts, providing a pollen concentration prognosis for the coming days [66]. The presence of high pollen concentrations in the atmosphere directly affects human health, as seasonal pollen levels have been related to the appearance and worsening of respiratory diseases [73,85,86,87,88]. Furthermore, the proposed methodology is adaptable for the different biogeographical areas, by the modification of type-specific classes and thresholds at the local or regional scale, in accordance with the specific environmental conditions involved in the appearance of pollen-allergy symptoms [32].

5. Conclusions

In this research, the Machine Learning algorithm ‘C5.0 decision trees’ was applied for the classification and prediction of the occurrence of different atmospheric pollen loads depending on the meteorological conditions. The obtained results by these models coincided with those found by the Spearman´s correlation test since both statistical analyses showed the strong and positive influence of temperature and sunlight on pollen release and dispersal through the lower atmosphere layers, as well as the negative influence of rainfall due to washout of pollen grains. The developed models can be used as an indicator of potential allergy risk in the short term, feeding the obtained models with weather prognostics. This information complemented pollen calendars and pollen trends obtained from long-term study periods, which allow identifying the seasonal distribution, timing and potential concentration of different pollen taxa recorded in the atmosphere. Moreover, studies of the link between pollen levels and meteorology are of high interest in the current climate change context since they could be used as guidance for the assessment and adaptation to potential changes in plant behavior and atmospheric pollen loads driven by climate variations.

Author Contributions

Conceptualization, F.J.R.-R., E.G.-F. and M.F.-G.; methodology, S.Á.-L. and A.P.-R.; software, E.G.-F. and M.F.-G.; validation, E.G.-F., M.F.-G. and F.J.R.-R.; formal analysis, E.G.-F.; investigation, F.J.R.-R., S.Á.-L. and A.P.-R.; resources, M.F.-G. and F.J.R.-R.; writing—original draft preparation, E.G.-F.; writing—review and editing, E.G.-F., M.F.-G. and F.J.R.-R.; project administration, F.J.R.-R. and M.F.-G.; funding acquisition, M.F.-G. and F.J.R.-R. All authors have read and agreed to the published version of the manuscript.

Funding

This research was funded by INOU 2021, OUR1 131H 647 research project sponsored by Deputación Provincial de Ourense and University of Vigo. This research also received funding from the project “CONTROL AEROBIOLÓXICO DE GALICIA 2021–2024”, CO-0034-2021 00VT of Consellería de Sanidade, Xunta de Galicia.

Institutional Review Board Statement

Not applicable.

Informed Consent Statement

Not applicable.

Data Availability Statement

Not applicable.

Conflicts of Interest

The authors declare no conflict of interest.

References

  1. Fernández-González, F.; Loidi, J.; Moreno, J.C. Impacts on Plant Biodiversity. Impacts of Climatic Change in Spain; Cambio climático: Impactos, vulnerabilidad y adaptación. Ministerio para la Transición Ecológica y el Reto Demográfico. Gobierno de España. pp. 179–242. Available online: https://www.miteco.gob.es/es/cambio-climatico/temas/impactos-vulnerabilidad-y-adaptacion/05_Impacts%20on%20plant%20biodiversity_ing_tcm30-178519.pdf (accessed on 28 June 2021).
  2. Lo, F.; Bitz, C.M.; Battisti, D.S.; Hess, J.J. Pollen calendars and maps of allergenic pollen in North America. Aerobiologia 2019, 35, 613–633. [Google Scholar] [CrossRef] [Green Version]
  3. Bertin, R.I. Plant Phenology and Distribution in Relation to Recent Climate Change. J. Torrey Bot. 2008, 135, 126–146. [Google Scholar] [CrossRef] [Green Version]
  4. Gordo, O.; Sanz, J.J. Impact of climate change on plant phenology in Mediterranean ecosystems. Glob. Chang. Biol. 2010, 16, 1082–1106. [Google Scholar] [CrossRef]
  5. Menzel, A. Trends in phenological phases in Europe between 1951 and 1996. Int. J. Biometeorol. 2000, 44, 76–81. [Google Scholar] [CrossRef]
  6. Walther, G.R.; Post, E.; Convey, P.; Menzel, A.; Parmesan, C.; Beebee, T.J.C.; Fromentin, J.M.; Hoegh-Guldberg, O.; Bairlein, F. Ecological Responses to Recent Climate Change. Nature 2002, 416, 389–395. [Google Scholar] [CrossRef]
  7. Menzel, A.; Sparks, T.H.; Estrella, N.; Koch, E.; Aasa, A.; Ahas, R.; Alm-Kübler, K.; Bissolli, P.; Braslavská, O.G.; Briede, A.; et al. European phenological response to climate change matches the warming pattern. Glob. Chang. Biol. 2006, 12, 1969–1976. [Google Scholar] [CrossRef]
  8. Schwartz, M.D.; Ahas, R.; Aasa, A. Onset of spring starting earlier across the Northern Hemisphere. Glob. Chang. Biol. 2006, 12, 343–351. [Google Scholar] [CrossRef]
  9. Anderegg, W.R.L.; Abatzoglou, J.T.; Anderegg, L.D.L.; Bielory, L.; Kinney, P.L.; Ziska, L. Anthropogenic climate change is worsening North American pollen seasons. PNAS 2021, 118, e2013284118. [Google Scholar] [CrossRef]
  10. Ziska, L.; Knowlton, K.; Rogers, C.A.; Dalan, D.; Tierney, N.; Elder, M.A.; Filley, W.; Shropshire, J.; Ford, L.B.; Hedberg, C.; et al. Recent warming by latitude associated with increased length of ragweed pollen season in central North America. Proc. Natl. Acad. Sci. USA 2011, 108, 4248–4251. [Google Scholar] [CrossRef] [Green Version]
  11. Ziska, L.; Makra, L.; Harry, S.K.; Bruffaerts, N.; Hendrickx, M.; Coates, F.; Saarto, A.; Thibaudon, M.; Oliver, G.; Damialis, A.; et al. Temperature-related changes in airborne allergenic pollen abundance and seasonality across the northern hemisphere: A retrospective data analysis. Lancet Planet. Health 2019, 3, e124–e131. [Google Scholar] [CrossRef] [Green Version]
  12. Frei, T.; Gassner, E. Climate change and its impact on birch pollen quantities and the start of the pollen season an example from Switzerland for the period 1969–2006. Int. J. Biometeorol. 2008, 52, 667–674. [Google Scholar] [CrossRef]
  13. Ziello, C.; Sparks, T.H.; Estrella, N.; Belmonte, J.; Bergmann, K.C.; Bucher, E.; Brighetti, M.A.; Damialis, A.; Detandt, M.; Galán, C.; et al. Changes to Airborne Pollen Counts across Europe. PLoS ONE 2012, 7, e34076. [Google Scholar] [CrossRef]
  14. Mimet, A.; Pellsier, V.; Quénol, H.; Aguejdad, R.; Dubreuil, V.; Rozé, H. Urbanisation induces early flowering: Evidence from Platanus acerifolia and Prunus cerasus. Int. J. Biometeorol. 2009, 53, 287–298. [Google Scholar] [CrossRef]
  15. Rodríguez-Rajo, F.J.; Fdez-Sevilla, D.; Stach, A.; Jato, V. Assessment between pollen seasons in areas with different urbanization level related to local vegetation sources and differences in allergen exposure. Aerobiologia 2010, 26, 1–14. [Google Scholar] [CrossRef]
  16. Pawankar, R. Allergic diseases and asthma: A global public health concern and call to action. World Allergy Organ. J. 2014, 7, 12. [Google Scholar] [CrossRef] [Green Version]
  17. Cariñanos, P.; Casares-Porcel, M. Urban Green Zones and related pollen allergy: A Review. Some guidelines for designing spaces with low allergy impact. Landsc. Urban Plan. 2011, 101, 205–214. [Google Scholar] [CrossRef]
  18. Von Döhren, P.; Haase, D. Ecosystem disservices research: A review of the state of the art with a focus on cities. Ecol. Indic. 2015, 52, 490–497. [Google Scholar] [CrossRef]
  19. Cariñanos, P.; Sánchez-Mesa, J.A.; Prieto-Baena, J.C.; López, A.; Guerra, F.; Moreno, C.; Domínguez, E.; Galán, C. Pollen allergy related to the area of residence in the city of Córdoba, south-west Spain. J. Environ. Monit. 2002, 4, 734–738. [Google Scholar] [CrossRef] [Green Version]
  20. Kasprzyk, I. Comparative study of seasonal and intradiurnal variation of airborne herbaceous pollen in urban and rural areas. Aerobiologia 2006, 22, 185–195. [Google Scholar] [CrossRef]
  21. Ziska, L.; Bunce, J.A.; Goins, E.W. Characterization of an urban-rural CO2/temperature gradient and associated changes in initial plant productivity during secondary succession. Oecologia 2004, 139, 454–458. [Google Scholar] [CrossRef]
  22. Oliveira, M.; Ribeiro, H.; Delgado, J.L.; Abreu, I. Seasonal and intradiurnal variation of allergenic fungal spores in urban and rural areas of the North of Portugal. Aerobiologia 2009, 25, 85–98. [Google Scholar] [CrossRef]
  23. LaDeau, S.L.; Clark, J.S. Pollen production by Pinus taeda growing in elevated atmospheric CO2. Funct. Ecol. 2006, 20, 541–547. [Google Scholar] [CrossRef]
  24. Rogers, C.A.; Wayne, P.M.; Macklin, E.A.; Muilenberg, M.L.; Wagner, C.J.; Epstein, P.R.; Bazzaz, F.A. Interaction of the onset of spring and elevated atmospheric CO2 on ragweed (Ambrosia artemisiifolia L.) pollen production. Environ. Health Perspect. 2006, 114, 865–869. [Google Scholar] [CrossRef] [Green Version]
  25. Wan, S.; Yuan, T.; Bowdish, S.; Wallace, L.; Russell, S.D.; Luo, Y. Response of an allergenic species, Ambrosia psilostachya (Asteraceae), to experimental warming and clipping: Implications for public health. Am. J. Bot. 2002, 89, 1843–1846. [Google Scholar] [CrossRef] [Green Version]
  26. Damialis, A.; Fotiou, C.; Halley, J.M.; Vokou, D. Effects of environmental factors on pollen production in anemophilous woody species. Trees 2011, 25, 253–264. [Google Scholar] [CrossRef]
  27. Faegri, K.; Iversen, J. Textbook of Pollen Analysis, 4th ed.; Faegri, K., Kalland, P.E., Krzywinski, K., Eds.; Wiley: Chichester, UK, 1989. [Google Scholar]
  28. Moore, P.D.; Webb, J.A.; Collinson, M.E. Pollen Analysis, 2nd ed.; Blackwell Scientific Publications: London, UK, 1991; pp. 42–46, 181–182. [Google Scholar]
  29. Rodríguez-Guitián, M.A.; Ramil-Rego, P. Clasificaciones climáticas aplicadas a Galicia: Revisión desde una perspectiva biogeográfica. Recur. Rurais 2007, 1, 31–53. [Google Scholar] [CrossRef]
  30. MeteoGalicia 2021. Galician Institute for Meteorology and Oceanography, Santiago de Compostela, Spain. Environment, Territory and Infrastructure Department of Galician Regional Government. Available online: http://www.meteogalicia.gal/web/index.action (accessed on 12 July 2021).
  31. PXOM. Plan Xeral De Ordenación Municipal De Ourense; Concello de Ourense: Galicia, Spain, 2013. [Google Scholar]
  32. Galán, C.; Cariñanos, P.; Alcázar, P.; Domínguez, E. Spanish Aerobiology Network (REA): Management and Quality Manual; University of Córdoba Publication Service: Córdoba, Spain, 2007; p. 61. [Google Scholar]
  33. Hirst, J.M. An Automatic Volumetric Spore Trap. Ann. Appl. Biol. 1952, 39, 257–265. [Google Scholar] [CrossRef]
  34. Andersen, T.B. A model to predict the beginning of the pollen season. Grana 1991, 30, 269–275. [Google Scholar] [CrossRef] [Green Version]
  35. Galán, C.; Ariatti, A.; Bonini, M.; Clot, B.; Crouzy, B.; Dahl, A.; Fernandez-González, D.; Frenguelli, G.; Gehrig, R.; Isard, S.; et al. Recommended terminology for aerobiological studies. Aerobiologia 2017, 33, 293–295. [Google Scholar] [CrossRef]
  36. Rojo, J.; Picornell, A.; Oteros, J. AeRobiology: The computational tool for biological data in the air. Methods in Ecology and Evolution. Methods Ecol. Evol. 2019, 10, 1371–1376. [Google Scholar] [CrossRef] [Green Version]
  37. R Core Team 2020. R: A Language and Environment for Statistical Computing; R Foundation for Statistical Computing: Vienna, Austria; Available online: https://www.R-project.org/ (accessed on 15 July 2021).
  38. Rojo, J.; Picornell, A.; Oteros, J. Package ‘Aerobiology’. A Computational Tool for Aerobiological Data; Version 2.0.1; CRAN Repository: A Coruña, Spain, 2019; CRAN Mirror Spain (A Coruña). [Google Scholar]
  39. Maimon, O.; Rokach, L. Data Mining and Knowledge Discovery Handbook, 2nd ed.; Springer: Berlin/Heidelberg, Germany, 2010. [Google Scholar]
  40. Maimon, O.; Rokach, L. Introduction to Supervised Methods. In Data Mining and Knowledge Discovery Handbook; Maimon, O., Rokach, L., Eds.; Springer: Boston, MA, USA, 2005. [Google Scholar]
  41. Kuhn, M.; Wetson, S.; Culp, M.; Coulter, N.; Quinlan, R. Package ‘C50’. C5.0 Decision Trees and Rule-Based Models; Version 0.1.4; CRAN Repository: A Coruña, Spain, 2021; CRAN mirror Spain (A Coruña). [Google Scholar]
  42. Pang, S.-L.; Gong, J.-Z. C5.0 Classification Algorithm and Application on Individual Credit Evaluation of Banks. Syst. Eng. Theory Pract. 2009, 29, 94–104. [Google Scholar] [CrossRef]
  43. Fernández-González, M.; Lara, B.; González-Fernández, E.; Rojo, J.; Pérez-Badia, R.; Rodríguez-Rajo, F.J. Pinus Pollen Emission Patterns in Different Bioclimatic Areas of the Iberian Peninsula. Forests 2021, 12, 688. [Google Scholar] [CrossRef]
  44. Richardson, D.M.; Rundel, P.W. Ecology and biogeography of Pinus: An introduction. In Ecology and Biogeography of Pinus; Richardson, D.M., Ed.; Cambridge University Press: Cambridge, UK, 1998; pp. 3–49. [Google Scholar]
  45. De Linares, C.; Delgado, R.; Aira, M.J.; Alcázar, P.; Alonso-Pérez, S.; Boi, M.; Cariñanos, P.; Cuevas, E.; de la Guardia, C.D.; Elvira-Rendueles, B.; et al. Changes in the Mediterranean pine forest: Pollination patterns and annual trends of airborne pollen. Aerobiologia 2017, 33, 375–391. [Google Scholar] [CrossRef]
  46. San-Miguel-Ayanz, J.; De Rigo, D.; Caudullo, G.; Houston Durrant, T.; Mauri, A.; Tinner, W.; Ballian, D.; Beck, P.; Birks, H.J.B.; Eaton, E.; et al. European Atlas of Forest Tree Species; Publications Office of the European Union: Luxembourg, 2016. [Google Scholar]
  47. Barberó, M.; Loisel, R.; Quézel, P.; Richardson, D.M.; Romane, F. Pines of the Mediterranean basin. In Ecology and Biogeography of Pinus; Richardson, D.M., Ed.; Cambridge University Press: Cambridge, UK, 1998; pp. 153–170. [Google Scholar]
  48. Sheffer, E. A review of the development of Mediterranean pine–oak ecosystems after land abandonment and afforestation: Are they novel ecosystems? Ann. For. Sci. 2012, 69, 429–443. [Google Scholar] [CrossRef] [Green Version]
  49. Jato, V.; Rodríguez-Rajo, F.J.; Fernández-González, M.; Aira, M.J. Assessment of Quercus flowering trends in NW Spain. Int. J. Biometeorol. 2015, 59, 517–531. [Google Scholar] [CrossRef]
  50. Vrinceanu, D.; Berghi, O.N.; Cergan, R.; Dumitru, M.; Ciuluvica, R.C.; Giurcaneanu, C.; Neagos, A. Urban allergy review: Allergic rhinitis and asthma with plane tree sensitization (Review). Exp. Ther. Med. 2021, 21, 275. [Google Scholar] [CrossRef] [PubMed]
  51. Christenhusz, M.; Byng, J. The number of known plants species in the world and its annual increase. Phytotaxa 2016, 261, 201–217. [Google Scholar] [CrossRef] [Green Version]
  52. Cariñanos, P.; Ruiz Peñuela, S.; Valle, A.M.; de la Guardia, C.D. Assessing pollination disservices of urban street trees: The case of London plane tree (Platanus x hispanica Mill. ex Münchh). Sci. Total Environ. 2020, 737, 139722. [Google Scholar] [CrossRef]
  53. Willis, K.J.; Petrokofsky, G. The natural capital of city trees. Science 2017, 356, 374–376. [Google Scholar] [CrossRef]
  54. Baldachini, C.; Castanheiro, A.; Maghakyan, N.; Sgrigna, G.; Verhelst, J.; Alonso, R.; Amorim, J.H.; Bellan, P.; Bojović, D.Đ.; Breuste, J.; et al. How does the amount and composition of PM deposited on Platanus acerifolia leaves change across different cities in Europe? Environ. Sci. Technol. 2017, 51, 1147–1156. [Google Scholar] [CrossRef]
  55. Iglesias, I.; Rodríguez-Rajo, F.J.; Méndez, J. Behavior of Platanus hispanica Pollen, an Important Spring Aeroallergen in Northwestern Spain. J. Investig. Allergol. Clin. Immunol. 2007, 17, 145–156. [Google Scholar]
  56. Fernández-González, M.; Guedes, A.; Abreu, I.; Rodríguez-Rajo, F.J. Pla a_1 aeroallergen immunodetection related to the airborne Platanus pollen content. Sci. Total Environ. 2013, 463–464, 855–860. [Google Scholar] [CrossRef]
  57. Maya-Manzano, J.M.; Fernández-Rodríguez, S.; Monroy-Colín, A.; Silva-Palacios, I.; Tormo-Molina, R.; Gonzalo-Garijo, A. Allergenic pollen of ornamental plane trees in a Mediterranean environment and urban planning as a prevention tool. Urban For. Urban Gree. 2017, 27, 352–362. [Google Scholar] [CrossRef]
  58. Fernández-González, M.; Ribeiro, H.; Pereira, J.R.S.; Rodríguez-Rajo, F.J.; Abreu, I. Assessment between Platanus pollen and Pla a 1 allergen in two cities of North-western Iberian Peninsula. Aerobiologia 2019, 35, 463–475. [Google Scholar] [CrossRef]
  59. Bousquet, J.; Heinzerling, L.; Bachert, C.; Papadopoulos, N.G.; Bousquet, P.J.; Burney, P.G.; Canonica, G.W.; Carlsen, K.H.; Cox, L.; Haahtela, T.; et al. Practical guide to skin prick tests in allergy to aeroallergens. Allergy 2012, 67, 18–24. [Google Scholar] [CrossRef] [PubMed]
  60. Cipriani, F.; Tripodi, S.; Panetta, V.; Perna, S.; Potapova, E.; Dondi, A.; Bernardini, R.; Caffarelli, C.; Casani, A.; Cervone, R.; et al. Early molecular biomarkers predicting the evolution of allergic rhinitis and its comorbidities: A longitudinal multicenter study of a patient cohort. Pediatr. Allergy Immunol. 2019, 30, 325–334. [Google Scholar] [CrossRef] [PubMed]
  61. Kim, K.R.; Oh, J.-W.; Woo, S.-Y.; Seo, Y.A.; Choi, Y.-J.; Kim, H.S.; Lee, W.Y.; Kim, B.-J. Does the increase in ambient CO2 concentration elevate allergy risks posed by oak pollen? Int. J. Biometeorol. 2018, 62, 1587–1594. [Google Scholar] [CrossRef]
  62. Ziska, L.; Caulfield, F. Rising CO2 and pollen production of common ragweed (Ambrosia artemisiifolia L.), a known allergy-inducing species: Implications for public health. Funct. Plant Biol. 2000, 27, 893–898. [Google Scholar] [CrossRef]
  63. Sharma, C.M.; Khanduri, V.P.; Chamoli, N. The influence of air temperature and humidity on the anthesis and anther dehiscence in P. roxburghhi at three different altitudes. Curr. Sci. 1998, 75, 761–763. [Google Scholar]
  64. Khanduri, V.P.; Sharma, C.M. Development of groups of male strobili, anthesis and microsporangium dehiscence in Pinus roxburghii. Grana 2000, 39, 169–174. [Google Scholar] [CrossRef]
  65. Kluska, K.; Piotrowicz, K.; Kasprzyk, I. The impact of rainfall on the diurnal patterns of atmospheric pollen concentrations. Agric. For. Meteorol. 2020, 291, 108042. [Google Scholar] [CrossRef]
  66. Ribeiro, H.; Cunha, M.; Abreu, I. Airborne pollen concentration in the region of Braga, Portugal, and its relationship with meteorological parameters. Aerobiologia 2003, 19, 21–27. [Google Scholar] [CrossRef]
  67. Alan, Ş.; Şahin, A.A.; Sarışahin, T.; Şahin, S.; Kaplan, A.; Pinar, N.M. The effect of geographical and climatic properties on grass pollen and Phl p 5 allergen release. Int. J. Biometeorol. 2018, 62, 1325–1337. [Google Scholar] [CrossRef] [PubMed]
  68. Bruffaerts, N.; De Smedt, T.; Delcloo, A.; Simons, K.; Hoebeke, L.; Verstraeten, C.; Van Nieuwenhuyse, A.; Packeu, A.; Hendrickx, M. Comparative long-term trend analysis of daily weather conditions with daily pollen concentrations in Brussels, Belgium. Int. J. Biometeorol. 2018, 62 (Suppl. 1), 483–491. [Google Scholar] [CrossRef] [PubMed] [Green Version]
  69. Rasmussen, A. The effects of climate change on the birch pollen season in Denmark. Aerobiologia 2002, 18, 253–265. [Google Scholar] [CrossRef]
  70. Green, B.J.; Dettman, M.; Yli-Panula, E.; Rutherford, S.; Simpson, R. Atmospheric Poaceae pollen frequencies and associations with meteorological parameters in Brisbane, Australia: A 5-year record, 1994–1999. Int. J. Biometeorol. 2004, 48, 172–178. [Google Scholar] [CrossRef] [PubMed]
  71. Janati, A.; Bouziane, H.; Trigo, M.M.; Kadiri, M.; Kazzaz, M. Poaceae pollen in the atmosphere of Tetouan (NW Morocco): Effect of meteorological parameters and forecast of daily pollen concentration. Aerobiologia 2017, 33, 517–528. [Google Scholar] [CrossRef]
  72. Peternel, R.; Srnec, L.; Culig, J.; Zaninovic, K.; Mitic, B.; Vukusic, I. Atmospheric pollen season in Zagreb (Croatia) and its relationship with temperature and precipitation. Int. J. Biometeorol. 2004, 48, 186–191. [Google Scholar] [CrossRef]
  73. Majeed, H.T.; Periago, C.; Alarcón, M.; Belmonte, J. Airborne pollen parameters and their relationship with meteorological variables in NE Iberian Peninsula. Aerobiologia 2018, 34, 375–388. [Google Scholar] [CrossRef] [Green Version]
  74. Timerman, D.; Greene, D.F.; Urzay, J.; Ackerman, J.D. Turbulence-induced resonance vibrations cause pollen release in wind-pollinated Plantago lanceolata L. (Plantaginaceae). J. R. Soc. Interface 2014, 11, 20140866. [Google Scholar] [CrossRef] [Green Version]
  75. Green, B.J.; Yli-Panula, E.; Dettmann, M.; Rutherford, S.; Simpson, R. Airborne Pinus pollen in the atmosphere of Brisbane, Australia and relationships with meteorological parameters. Aerobiologia 2003, 19, 47–55. [Google Scholar] [CrossRef]
  76. García-Mozo, H.; Galán, C.; Gómez-Casero, M.T.; Domínguez, E. A comparative study of different temperature accumulation methods for predicting the start of the Quercus pollen season in Cordoba (South West Spain). Grana 2000, 39, 194–199. [Google Scholar] [CrossRef]
  77. Faust, M. Physiology of Temperate Zone Fruit Trees; John Wiley & Sons: New York, NY, USA, 1989; p. 338. [Google Scholar]
  78. Richardson, E.A.; Seeley, S.D.; Walker, D.R. A model for estimating the completion of rest for ‘Redhaven’ and ‘Elberta’ peach trees. HortScience 1974, 9, 331–332. [Google Scholar]
  79. Oke, T.R. Boundary Layer Climates, 2nd ed.; Routledge: London, UK, 1987; p. 464. [Google Scholar]
  80. Snider, J.L.; Oosterhuis, D.M. How does timing, duration and severity of heat stress influence pollen-pistil interactions in angiosperms? Plant Signal. Behav. 2011, 6, 930–933. [Google Scholar] [CrossRef] [Green Version]
  81. Galán, C.; García-Mozo, H.; Vázquez, L.; Ruiz-Valenzuela, L.; Díaz de la Guardia, C.; Trigo Pérez, M. Heat requirement for the onset of the Olea europaea L. pollen season in several places of Andalusia region and the effect of the expected future climate change. Int. J. Biometeorol. 2005, 49, 184–188. [Google Scholar] [CrossRef] [PubMed]
  82. Emberlin, J.; Jäeger, S.; Domínguez, E.; Galán, C.; Hodal, L.; Mandrioli, P.; Rantio-Lehtimäki, A.; Savage, M.; Spieksma, F.T.; Barlett, C. Temporal and geographical variations in grass pollen seasons in areas of western Europe: An analysis of season dates at sites of the European pollen information system. Aerobiologia 2000, 16, 373–379. [Google Scholar] [CrossRef]
  83. Jato, V.; Rodríguez-Rajo, F.J.; Alcázar, P.; De Nuntiis, P.; Galán, C.; Mandrioli, P. May the definition of pollen season influence aerobiological results? Aerobiologia 2006, 22, 13–25. [Google Scholar] [CrossRef] [Green Version]
  84. Picornell, A.; Oteros, J.; Ruiz-Mata, R.; Recio, M.; Trigo, M.M.; Martínez-Bracero, M.; Lara, B.; Serrano-García, A.; Galán, C.; García-Mozo, H.; et al. Methods for interpolating missing data in aerobiological databases. Environ. Res. 2021, 200, 111391. [Google Scholar] [CrossRef]
  85. Damialis, A.; Häring, F.; Gökkaya, M.; Rauer, D.; Reiger, M.; Bezold, S.; Bounas-Pyrros, N.; Eyerich, K.; Todorova, A.; Hammel, G.; et al. Human exposure to airborne pollen and relationships with symptoms and immune responses: Indoors versus outdoors, circadian patterns and meteorological effects in alpine and urban environments. STOTEN 2019, 653, 190–199. [Google Scholar] [CrossRef]
  86. Demain, J.G.; Choi, Y.-J.; Oh, J.-W. The Impact of Climate Change on the Pollen Allergy and Sporulation of Allergic Fungi. Curr. Treat. Options Allergy 2021, 8, 60–73. [Google Scholar] [CrossRef]
  87. Gilles, S.; Akdis, C.; Lauener, R.; Schmid-Grendelmeier, P.; Bieber, T.; Schäppi, G.; Traidl-Hoffmann, C. The role of environmental factors in allergy: A critical reappraisal. Exp. Dermatol. 2018, 27, 1193–1200. [Google Scholar] [CrossRef] [PubMed] [Green Version]
  88. Gökkaya, M.; Damialis, A.; Nussbaumer, T.; Beck, I.; Bounas-Pyrros, N.; Bezold, S.; Amisi, M.M.; Kolek, F.; Todorova, A.; Chaker, A.; et al. Defining biomarkers to predict symptoms in subjects with and without allergy under natural pollen exposure. J. Allergy Clin. Immunol. 2020, 146, 583–594.e6. [Google Scholar] [CrossRef] [PubMed]
Figure 1. Location of the Ourense city in Galicia, NW Spain, south Europe (QGIS version 2.18), and detail of the Ourense center urban area (the aerobiological sampler icon indicates its location) [31].
Forests 12 01801 g001
Figure 2. Histogram of accumulated Annual Pollen Integral APIn (sum of daily concentrations over the whole year) during the study period of the fifteen most abundant pollen types recorded in the studied atmosphere. Sum of pollen grains of the studied taxa Quercus, Pinus and Platanus pollen during the considered 1993–2020 period recorded in the Ourense city atmosphere. The triangular axis increases 50,000 units (pollen grains) from the central white space (value 0).
Forests 12 01801 g002
Figure 3. Pollen calendar showing the 15 main pollen types recorded by the aerobiological sampler placed in the Ourense city center, developed from the 1993–2020 studied period.
Forests 12 01801 g003
Figure 4. Trends of the studied airborne pollen types during their Main Pollen Season (MPS) from 1993 to 2000, considering the parameters of start date (date), end date (date), length of MPS (date) and pollen peak (pollen/m3).
Forests 12 01801 g004
Figure 5. Statistically significant trends found by the ‘plot_trend’ function of the AeRobiology software package for R, applied to the considered pollen types during the 1993–2020 studied period. Blue area and blue line represent the average value of data; red discontinuous line represents the linear regression trend.
Forests 12 01801 g005
Figure 6. C5.0 model for Pinus pollen developed from the entire dataset, composed of daily pollen and meteorological data over the MPS of each studied year, during the 1993–2020 period.
Forests 12 01801 g006
Figure 7. C5.0 model for Platanus pollen developed from the entire dataset, composed of daily pollen and meteorological data over the MPS of each studied year, during the 1993–2020 period.
Forests 12 01801 g007
Figure 8. C5.0 model for Quercus pollen developed from the entire dataset, composed of daily pollen and meteorological data over the MPS of each studied year, during the 1993–2020 period.
Forests 12 01801 g008
Table 1. Pollen thresholds proposed by the REA in pollen/m3 for the considered pollen types [32].
Pollen TypeGROUPLowModerateHigh
Pinus41–5051–200>200
Platanus41–5051–200>200
Quercus41–5051–200>200
Table 2. Calculated seasonal indexes over the studied years by the ‘plot_trend’ function of the AeRobiology R software package. S statistically significant trend line slopes displayed in bold. Significance level: * p < 0.05, ** p < 0.01.
Pollen TypePinusPlatanusQuercus
Start Date0.30.30.3
End Date0.60.30.1
Peak Date0.30.10.3
Total Pollen106.9 *269.4 **442 **
Table 3. Spearman´s correlation test coefficients (R) applied to daily meteorological and pollen concentration variables over the MPS in the 1993–2020 study period. Statistical significance was considered at the 95% and 99% (** p ≤ 0.01) confidence level.
VariablesPinusPlatanusQuercus
RAIN−0.338 **−0.114 **−0.425 **
TMAX0.224 **0.146 **0.408 **
TMIN−0.246 **−0.037−0.133 **
TMEAN0.0280.0560.208 **
SUN0.294 **0.0660.414 **
RAIN: daily rainfall in L/m2; TMAX: daily maximum temperature in °C; TMIN: daily minimum temperature in °C; TMED: daily mean temperature in °C; SUN: daily sunlight hours.
Table 4. Percentage of successful predictions obtained from the confusion matrix for each C5.0 model of the different pollen types and datasets.
DATASETPinusPlatanusQuercus
Training74.80264.16072.803
Validation71.26751.28273.684
Entire74.27762.22873.266
Publisher’s Note: MDPI stays neutral with regard to jurisdictional claims in published maps and institutional affiliations.

