
Mixed Visual and Machine Grading to Select Eucalyptus grandis Poles into High-Strength Classes


1
CNR IBE, Institute of Bioeconomy, 50019 Sesto Fiorentino, Italy
2
Department of Forest and Wood Science, Stellenbosch University, Stellenbosch 7599, South Africa
*
Author to whom correspondence should be addressed.
Forests 2021, 12(12), 1804; https://0-doi-org.brum.beds.ac.uk/10.3390/f12121804
Submission received: 30 November 2021
/
Revised: 15 December 2021
/
Accepted: 16 December 2021
/
Published: 18 December 2021
(This article belongs to the Special Issue Wood Production and Promotion)
Abstract
:Before round timber can be profitably used in construction, it needs structural characterization. The visual grading of Eucalyptus grandis poles was integrated with additional parameters developed by multivariate regression analysis. Acoustic velocity and dynamic modulus of elasticity were combined with density and pole diameter in the estimation of bending strength and stiffness. The best models achieved were used to group the visually graded material into qualitative structural classes. Overall, dynamic modulus of elasticity was the best single predictor; and adding density and diameter to the model improved the estimation of strength but not of stiffness. The developed parameters separated the material into two classes with very distinct mechanical properties. The models including velocity as a parameter did not perform as well. The strength grading of Eucalyptus grandis poles can be effectively improved by combining visual parameters and nondestructive measurements. The determination of the dynamic modulus of elasticity as a grading parameter should be preferred over that of acoustic velocity.
1. Introduction
Roundwood is used in construction with different functions, such as pillars, beams, or foundations [1], and has the advantage that it does not require intense processing. The use of round rather than sawn timber implies a gain in terms both of mechanical performance and energy savings [2]. However, to be employed safely and efficiently, it has to be fully characterized and graded.
Conceptually, the strength grading of structural timber is centered on the prediction of the material’s properties by nondestructive measurements. The better these determinations relate to the real properties of the material, the more efficient the grading could be, with the possibility of differentiation into more quality groups and the identification of higher strength classes.
Visual grading evaluates the characteristics visible to an operator who shall assess (and limit) their presence and dimension. For the prediction of the mechanical properties, one of the most important characteristics is the presence and dimension of knots, but also slope of grain, as well as checks and presence of biological or mechanical damage.
Several instruments may be used to measure other properties which usually have a more robust correlation with the mechanical performance of the structural element [3]. These instruments are often manufactured to developed the machine grading of timber, where the operator is substituted by the machine in the evaluation of each single structural piece [4].
Previously, researchers analyzed the visual grading of round timber and compared it with the use of other nondestructive parameters, coming to a common conclusion that a prediction of the mechanical properties could be successfully implemented by acoustic measurements [5,6,7,8,9,10]. Stress wave velocity, mostly in longitudinal direction, can be correlated with elasticity and strength properties of the material to develop a machine grading system, similar to what is commonly performed for sawn timber [11]. Or, more simply, a mixed grading system could be developed, integrating measurements made instrumentally and visual evaluations. This is exactly the aim of the present work: to implement the visual grading of Eucalyptus grandis poles by nondestructive measurements.
In South Africa, but also more generally in several countries, the interest in using Eucalyptus as a building material is growing due the rising demand of structural timber and the consequent expected shortage of softwood sawn assortments, currently predominantly used for construction [12]. Eucalyptus could be used as solid or glued products [13,14]. Some research has been conducted to assess its mechanical properties [12,15] and to evaluate the performance of its strength grading [16].
Concerning round poles, the South African standard specifies the main visual characteristics that can be accepted for the production and use of structural poles [17]. Besides knots, the standard requires a careful inspection of checks and end splitting, which often occur after felling as a consequence of the high levels of growth stresses present in mature trees of this genus [18,19,20,21].
Because of the importance of checks, warp and end splitting, which need to be assessed visually during production, it seems reasonable to consider a mixed grading system. The visual inspection in the South African standard provides only one grade (structural pole or reject), and it is associated with the characteristic value of 34 MPa bending strength (5th percentile) and a 10 GPa mean modulus of elasticity by the national standardization [22]. This could be the starting point from which to develop selection criteria for the material with subsequent dynamic measurements taken instrumentally.
Shortly, the aim of this research was to assess Eucalyptus grandis roundwood visually, and, with the addition of nondestructive parameters, to propose a mixed grading process in order to divide it more effectively into qualitative stress graded groups, and to improve the prediction of its mechanical properties. A better knowledge of the raw material will increase its potentiality and efficiency of use.
2. Materials and Methods
2.1. Material
The investigation described in the following section was performed on a total of 105 structural Eucalyptus grandis poles grown in timber plantations in the Mpumalanga region of South Africa. The area has a subtropical climate with an average temperature of 17.9 °C. Rainfall is predominant in summer, with an annual average of approximately 1132 mm per year. The trees were 6–8 years old for smaller and larger diameter classes, respectively.
The specimens had circular cross-sections, grouped in three diameter classes and with different lengths, as described in Table 1.
The diameter classes were defined according to the South Africa standard SANS 457-3 [17] by means of the permissible minimum and maximum values of the top diameter of the pole.
All the specimens were visually graded according to the rules reported in the SANS 457-3 [17] standard for structural poles, for which only one grade is defined, here named “S”. The rules provide limitations for the main strength reducing and geometrical characteristics: healthy knots should have a dimension lower than one-quarter of the circumference of the pole at the point where the knot occurs; loose knots lower than one-eighth of the circumference. End checks are limited in number (maximum 4), width (maximum 1/10 of the diameter of the pole) and length (200 mm at the top and 300 mm at the butt); face checks are limited only for width (one-eighth of the diameter) and length (three-quarters the length of the pole). The characteristics were measured and checked for compliance with the permissible limits of the standard.
2.2. Nondestructive Measurements
Nondestructive measurements were performed on each specimen to determine the dynamic modulus of elasticity. Two different instruments were used: a strength grading machine ViSCAN (technology by MiCROTEC), which measures the natural frequency of vibration in the longitudinal direction after a percussion, and combining it with the weight and the dimensions of the piece, the dynamic modulus of elasticity can be calculated (Equation (1)). The volume of each piece was computed as the volume of a cylinder with a diameter equal to the average of the two orthogonal diameters measured at half-length and length equal to that of the piece.
where: Edyn = dynamic modulus of elasticity; ρ = density calculated as the weight of the whole piece divided by its volume; l = length of the log; f = frequency; V = velocity.
At the same time, the acoustic velocity after percussion was determined by another commercial instrument used mostly as a tool to evaluate the quality of logs (HITMAN HM200 by Fibre-gen).
The measurements of velocity achieved by the two instruments were very similar (the correlation coefficient between the two was 0.97), therefore the following analysis are shown only for the ViSCAN determinations.
2.3. Destructive Tests
Four-point bending tests were performed according to the standard EN 14251 [23]. The test piece was symmetrically loaded over a span of 18 times its nominal diameter at the midspan, with the loading placed at the third points of the span. The central third was selected to include the weakest section, as evaluated by visual inspection. The deformation was measured in the central third on both faces at the neutral axis at the midpoint of a gauge 5 times the length of the nominal diameter. The average of the two measurements was used to calculate the slope of the straight section of the load–deformation curve. The modulus of elasticity was calculated as follows:
where: Em = static modulus of elasticity; (M1 − M2) = the increment of the bending moment; (w1 − w2) increment of the displacement; I = the smallest second moment of area along the gauge length; l1 = gauge length; d1 = smallest apparent diameter along the gauge length; d2 = biggest apparent diameter along the gauge length; apparent diameter = diameter of a circle with the same circumference as the actual circumference at the section of measurement.
After the determination of the modulus of elasticity, the test went on to failure and the maximum load was recorded. The bending strength was calculated as follows:
where: fm = bending strength; Fmax = maximum load; a = distance between the loading position and the support; dh = diameter perpendicular to the load direction at midspan (horizontal); dv = diameter in the direction of the load at midspan (vertical).
Following testing, density and moisture content were determined in accordance with ISO 13061-2 [24] and EN 13183-1 [25] (oven-dry method), respectively. For this purpose, a small specimen of the full cross-section, 7 cm-thick, was cut from each wooden element. The small pieces were weighed immediately after the destructive test and measured to calculate their volume. Then, they were oven-dried and weighed again to obtain the moisture content of wood at the time of testing.
2.4. Data Analysis
Data from bending tests were analyzed according to the European standard on structural grading. Both modulus of elasticity and density were adjusted to the reference conditions of moisture content (i.e., 12%) applying the correction factors provided by the EN 384 [26].
Multiple linear regressions were used to establish predictive models for bending strength and static modulus of elasticity. The nondestructive determinations were included as explanatory variables, namely dynamic modulus of elasticity, acoustic velocity, density, and pole diameter. To determine which variables were robust enough, the improvement in the explanation of the total variance when including additional variables in the model was verified. The models were compared by the coefficients of determination (R2) and the standard errors of the estimate (SE) achieved.
The predicted values by the best models were used to improve the visual strength grading as an additional parameter to be met for better-quality material. The characteristic values of the quality groups selected were then compared.
The characteristic values were calculated following the methods described in the standard EN 14358 [27]: the 5th percentile for bending strength and density and the mean for the modulus of elasticity. The assignment to the strength classes of EN 338 [28] (Table 2) was reported as a result of the following verifications: the 5th percentile of strength and density shall be equal to or higher than the values tabled for the class; the mean of the modulus of elasticity shall be equal to or higher than 95% of the value tabled.
The class C60 is an addition by the authors to the strength classes currently present in the technical standard, for better exploitation of the high mechanical performance of round timber.
For the aim of the present work, the reduction factor provided by the EN 384 [26] standard to adjust the characteristic values of the number of subsamples (kn) was not applied. Therefore, the assignments to the strength classes should be applied purely for comparative purposes.
3. Results and Discussion
3.1. Properties of the Visually Graded Structural Poles
The mechanical characterization of the structural poles visually graded according to the South African standard [17] is summarized in Table 3.
The material was characterized by relatively high mechanical properties. In comparing the results with similar data for sawn timber of Eucalyptus grandis from South Africa [12,15,16] and Argentina [29], the roundwood showed higher bending strength and stiffness, whereas density was similar (on average 545 kg/m3 in Table 3 in contrast with 535 kg/m3 for Argentinian provenance [29]) or slightly higher (508 kg/m3 for South African sawn material [16]).
In part, this could be explained by the sample analyzed: here the timber elements were visually graded and all of them complied with the South African standard; on the contrary, the other investigations worked on ungraded material. Furthermore, with regard to bending strength in particular, previous research has reported greater mechanical strength of roundwood than the corresponding sawn assortments [2,11,30,31,32], most likely due to the continuity of the fibers, which are uncut during the normal processing.
More specifically for stiffness, in the present work the local modulus was measured and reported, but in the other works cited it was the global modulus, which also includes a shear component, and it is usually lower than the local one [33].
Data on roundwood of Eucalyptus grandis of Brazilian origin report much higher density (751 kg/m3) and global modulus of elasticity (15.8 GPa), but no information was available about strength [34].
The variability of the properties (CV in Table 3) was also lower than that observed previously, again probably due to the material being already graded.
The characteristic values calculated for the entire sample allow the assignment of the visually graded Eucalyptus poles to the strength class C45 (Table 2). Even though the standard EN 338 [28] provides the classes named “D” for hardwoods, these have very high density requirements and may not be suitable for medium-density hardwoods, so the standard already allows species such as chestnut and poplar to be assigned to the C classes. C classes were more suitable for the timber of eucalyptus too, as already noticed in the past literature [29,35].
3.2. Mechanical Properties’ Estimation by NDT
The coefficients of determination between several properties are reported in Table 4. A simple linear regression was performed to evaluate, at first, the influence of a single property on the others.
The properties taken as a reference for the structural grading are strength, stiffness and density, which are generally medium–highly correlated to each other. To estimate them, nondestructive properties should be used.
The visual grading is based mostly on knots and/or slope of grain, none of which showed significant correlations with the physical or mechanical properties of the material (for the slope of grain the coefficient was close to zero, not reported in the table). Of course, the result is influenced by the low variability of these parameters in the sample analyzed, since both knots and slope of grain were limited by the visual grading, but a relatively poor relationship between knots (and slope of grain) and strength was also observed by Piter et al. [29] in Eucalyptus grandis.
Among the measurements made instrumentally, the dynamic modulus of elasticity showed the highest correlations with all the properties resulting from the destructive tests. The acoustic velocity, on the contrary, presented very low correlations (Table 4).
Similarly, dynamic modulus correlates better with strength and stiffness of oak round timber than velocity [11].
This is in contrast with previous observations which reported velocity and dynamic modulus as equivalent predictors of the mechanical properties of small-diameter hardwood logs (alder, ash, birch and sycamore [36] or chestnut [5]).
To improve the estimation of the material’s mechanical properties, several multivariable prediction models were compared, which included variables easy to measure nondestructively (Table 5 and Table 6). The models have been developed for two levels of complexity for both available equipment and field operations: In the first scenario, it is possible to weight each timber element and to calculate density by dividing it for the volume of the piece; with density the dynamic modulus of elasticity can also be determined (Table 5). In the second scenario, the field operations are faster, density is not measured and only the acoustic velocity can be used (Table 6).
The diameter of the pole was included as an additional variable, because it is easy to measure and it was observed that it has an influence on the evaluation of a log’s stress-wave properties [34,37].
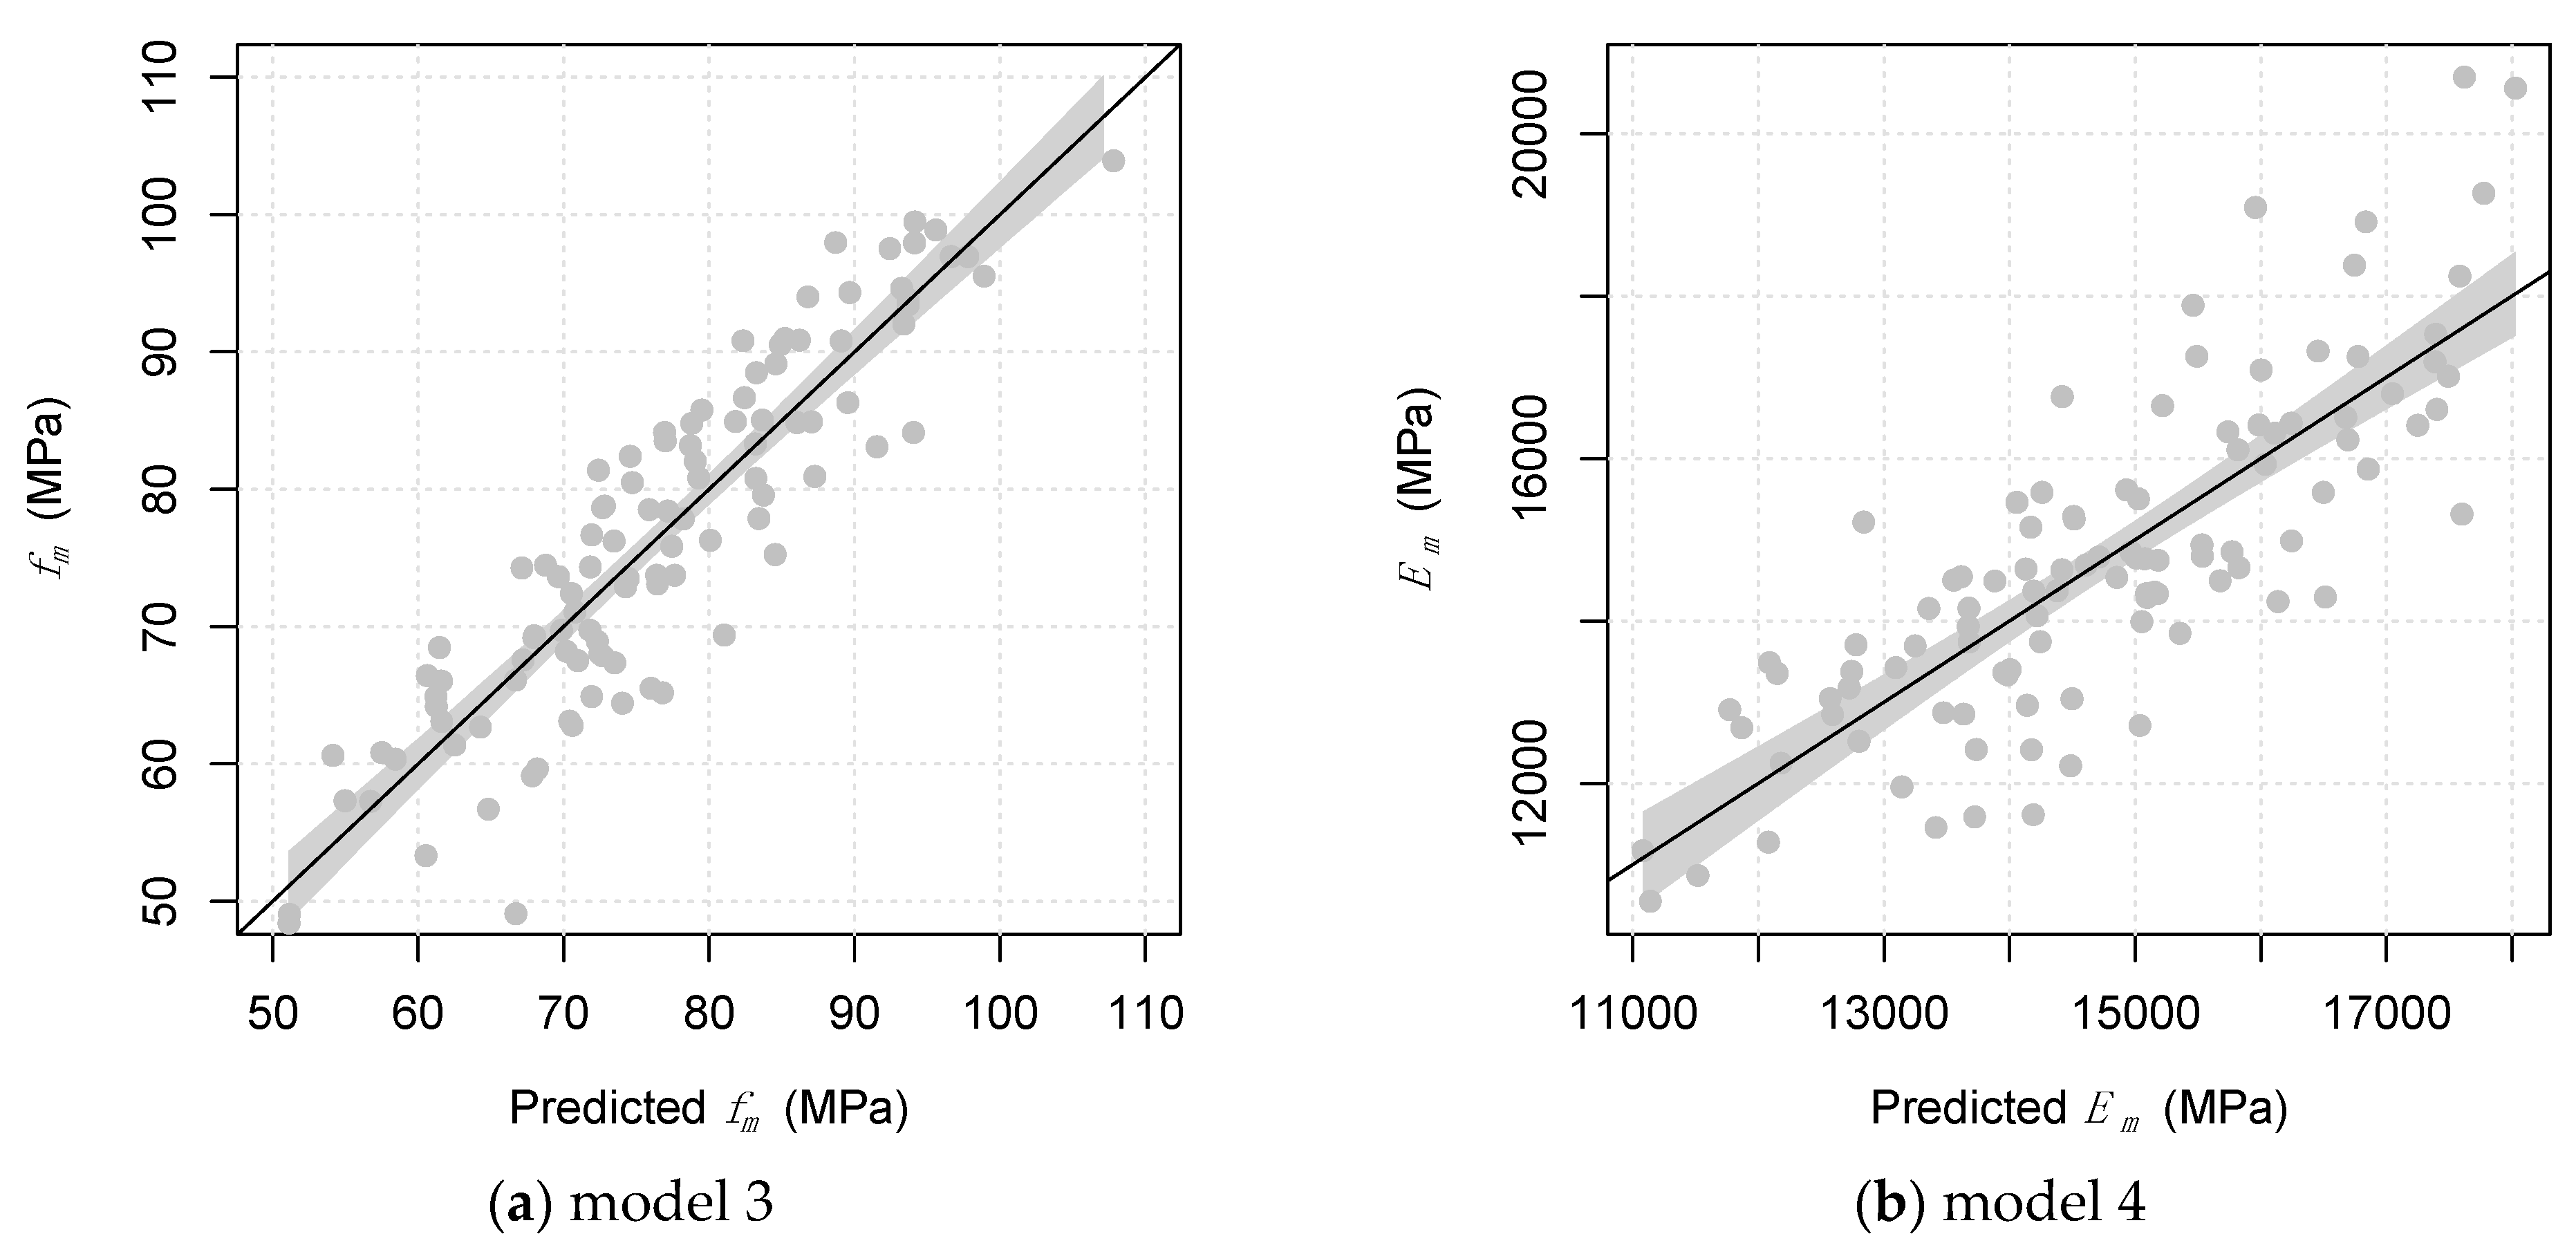
Considering the possibility of having the dynamic modulus of elasticity as an independent variable (Table 5), the best prediction of the bending strength was the model including the density and diameter (model three in Table 5 and Figure 1a). All three estimators were highly significant and the R2 was higher than the simpler models, with a significant improvement in the explanation of the total variance.
On the contrary, the best prediction of the static modulus of elasticity was obtained with the simple model, including only dynamic modulus of elasticity as an explanatory variable (model four in Table 5 and Figure 1b). The addition of other parameters did not lead to any improvement in the estimation. Neither density nor diameter were significant predictors of stiffness.
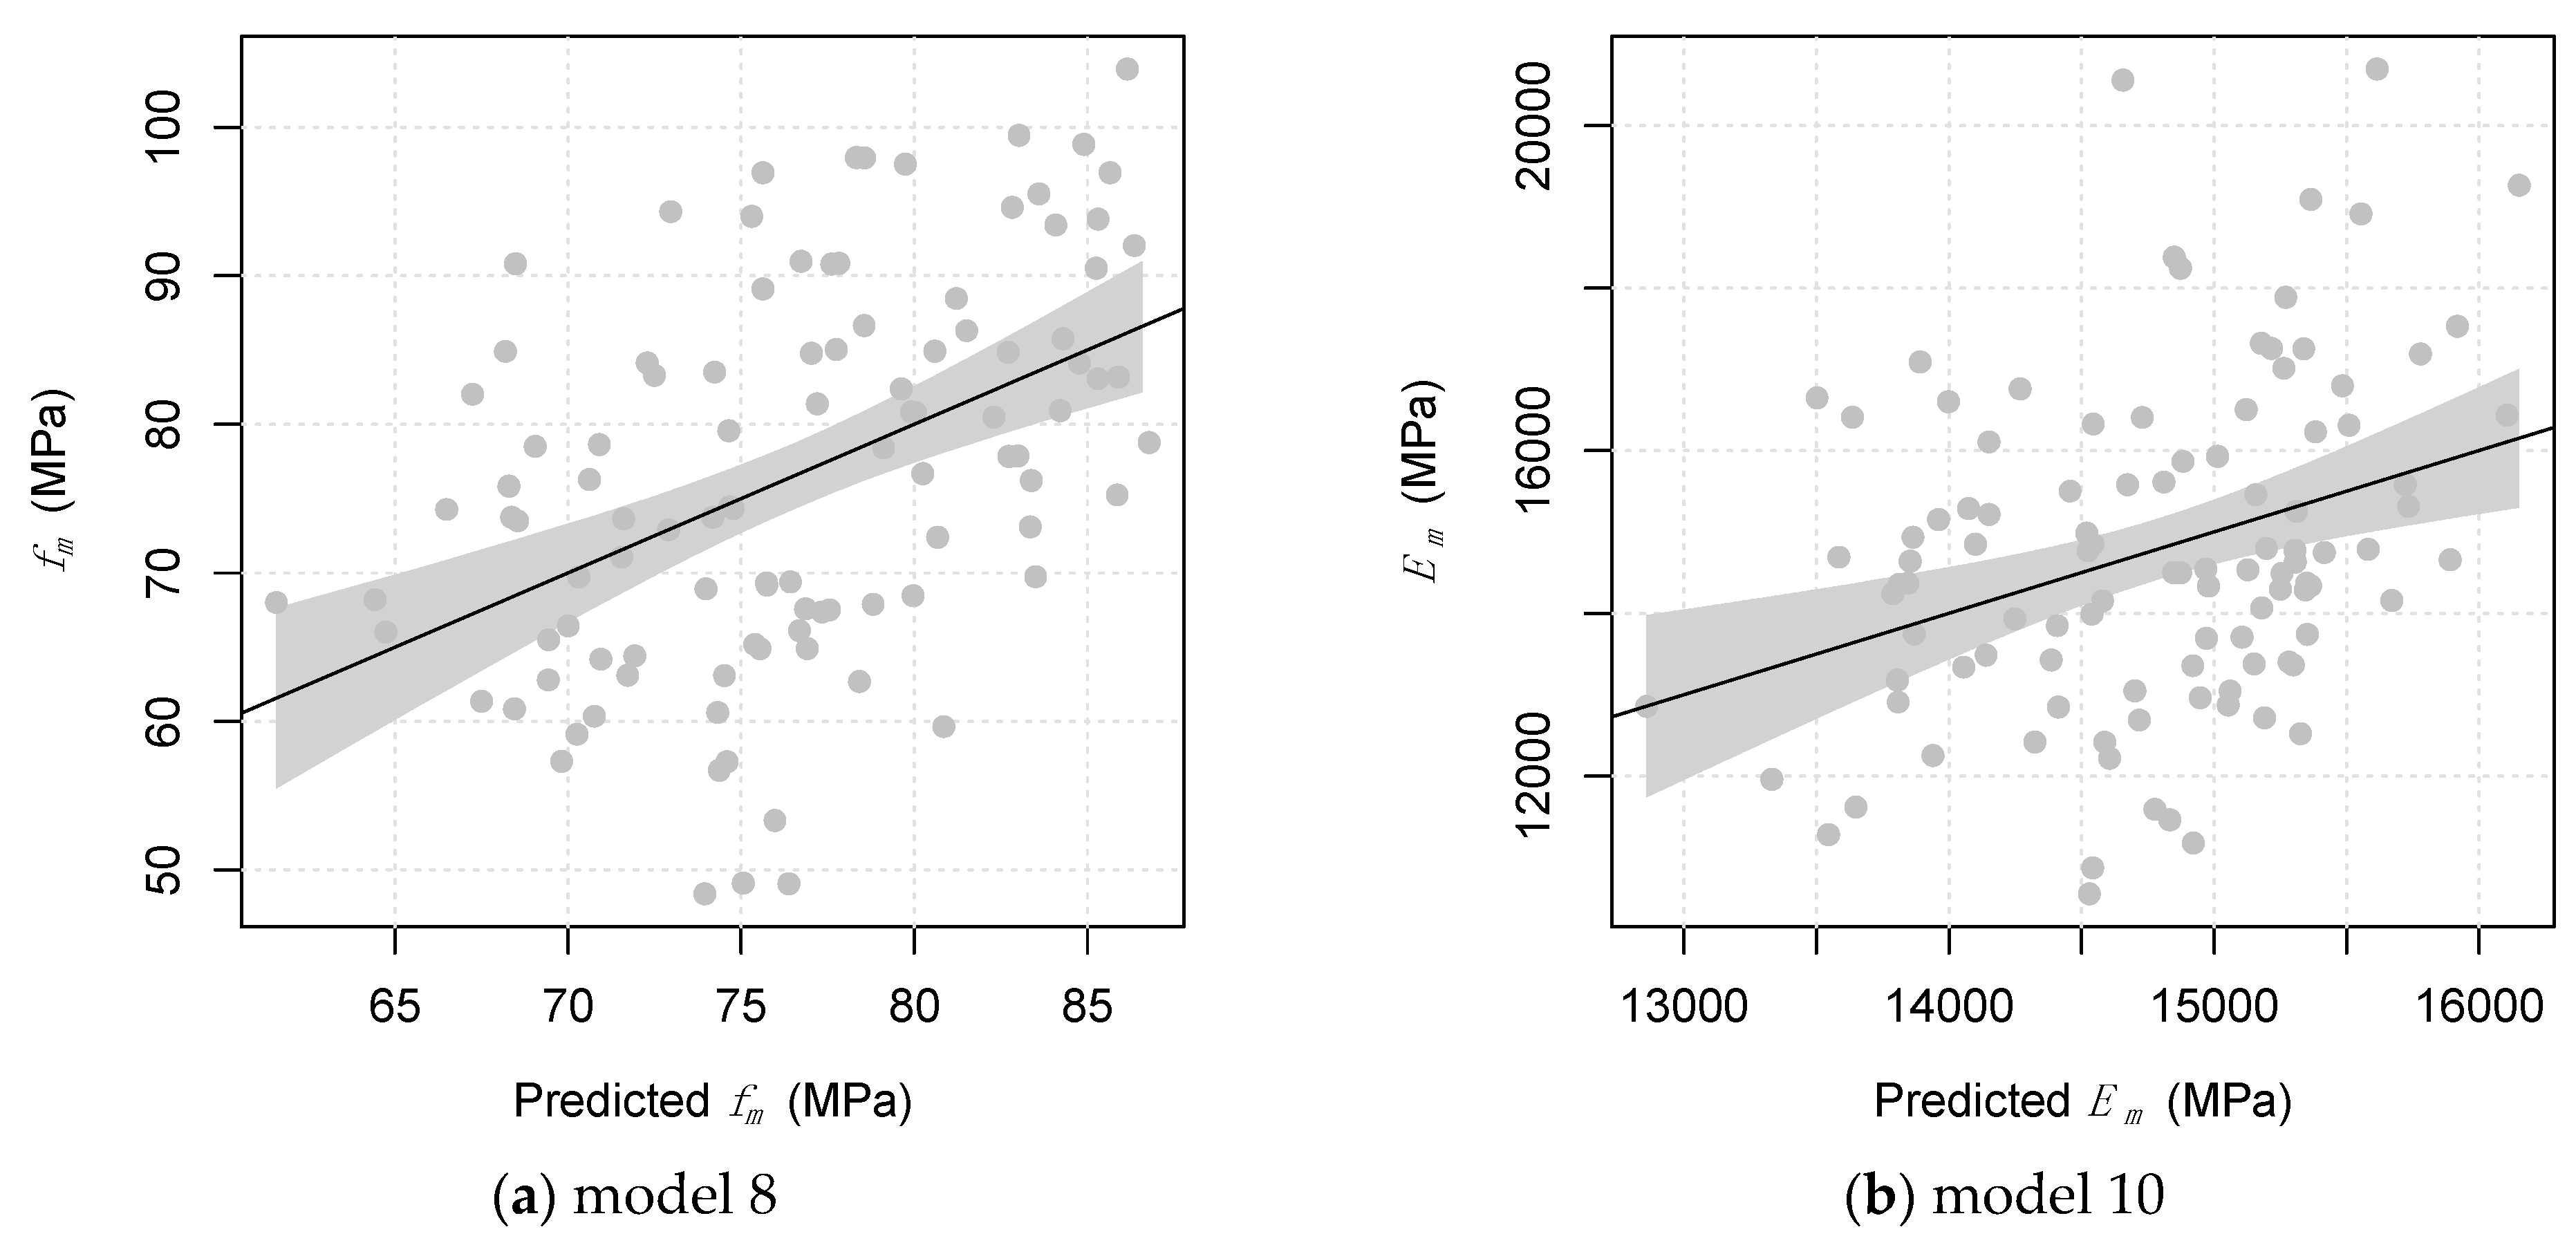
In the case where there would be no possibility of weighting the poles, and therefore, of determining density, the prediction models could include the acoustic velocity and the pole diameter only. The results of the regression analysis are summarized in Table 6.
Overall, the coefficient of determination was very low for all the models. The velocity as an explanatory variable was not significant for the prediction of strength or significant at a low level for stiffness, as already observed in Table 4. The inclusion of the diameter in the model improved the estimation significantly, but the R2 reached just 0.21 for the prediction of strength and 0.11 for the prediction of the modulus of elasticity. However, in this second scenario, model 8 (Figure 2a) and model 10 (Figure 2b) were the best achievable.
3.3. Improvement of the Visual Grading by Combining It with NDT Measurements
The Eucalyptus grandis poles were visually graded into one grade only. Further improvement in the selection of the raw material (e.g., to differentiate additional qualitative groups) might be difficult due to the relatively weak relationship between the mechanical properties and the visual characteristics (Table 4).
The same lack of correlation with the visual parameters was also noticed in the past for other hardwoods, such as chestnut [38,39], for which the visual grading allows the identification of a single grade [40,41], but the use of parameters measured by a machine (i.e., dynamic modulus of elasticity and/or stress wave velocity) allowed selection into multiple (and higher) strength classes [41].
With the aim of improving the strength grading of Eucalyptus grandis poles, an additional parameter could be added to the visual rule, so as to divide the single visual grade “S” into two further ones of different structural quality. The best models described in the previous paragraph were tested alternatively as additional parameters and compared on the basis of their suitability for differentiating the structural poles.
For the first scenario (including the possibility of determining the density, and consequently, the dynamic modulus of elasticity), model three was used for the prediction of strength, and for the stiffness, the dynamic modulus of elasticity was used instead of model four, since the two were equivalent (Table 5). Considering when the density was not available, model 8 and model 10 (Table 6) were tested.
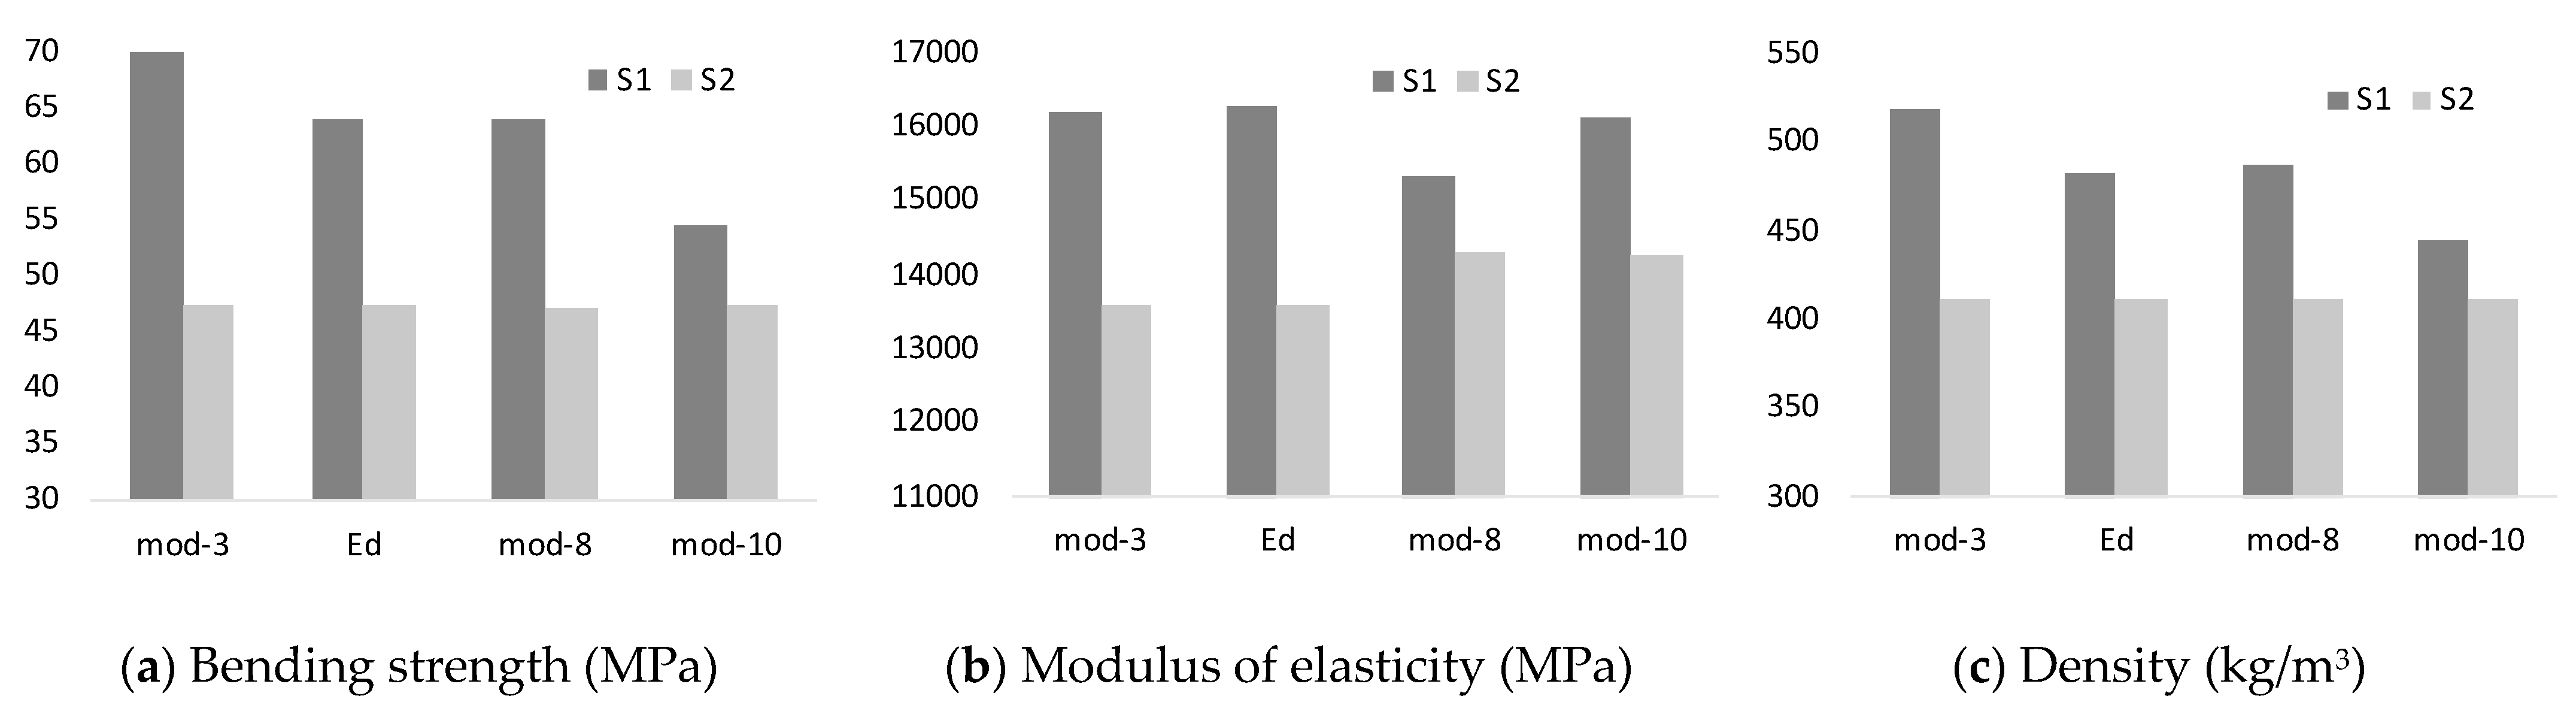
After a few attempts, a threshold was set for each parameter in order to separate the better-quality material (above the threshold) from the lower-quality material (below). The two groups formed, named S1 and S2, were used to calculate the characteristic values (Table 7 and Figure 3).
As expected, the grading parameters including the dynamic modulus of elasticity (model three and Ed) were more effective in selecting the material in two groups of different structural quality. Looking at the achievable strength classes in Table 7, the two grades obtained met the requirements of class C40 and C60. The latter, described in Table 2, is an addition of the authors to the strength classes reported in the EN 338 [28] to meet the higher mechanical properties of the material. Between the two, model three was more efficient in separating strength and density than simply Ed, while the results were very similar for the modulus of elasticity (Figure 3).
On the contrary, the grading parameters which included velocity and diameter (model 8 and model 10) did separate two groups, but the strength classes achieved were very close to each other (C45 and C50), indicating that the grouping was not as efficient in terms of structural quality. Observing the characteristic values (Table 7 and Figure 3), model eight worked satisfactorily for strength and density (the results were very similar to Ed), but poorly for stiffness. Model 10 did the opposite; it was more efficient to group by the modulus of elasticity (though not as effective as Ed), but was not adequate for strength and density.
In general, the models worked better for predicting the property for which they were developed: model three and model eight for strength, and Ed and model 10 for stiffness. However, the practical achievements (the strength classes met) were the same.
4. Conclusions
The use of roundwood in construction requires its structural qualification. This could be achieved by visual grading, which, for Eucalyptus from South Africa, can be obtained in just one quality class (structural pole or reject).
However, it is possible to add further evaluation parameters to those already assessed by the visual rules, which are measured nondestructively by suitable instruments. So, the timber material could be further grouped into two classes of different structural quality.
In the present research, new parameters have been developed by multivariable regression models in order to improve the prediction of strength and stiffness, compared to the characteristics of visual grading.
As a result, the models including the dynamic modulus of elasticity made it possible to separate the sample into very distinct classes (C40–C60), obtaining very high characteristic values in the highest class.
Adding density and diameter into the model allowed for a significant improvement in predicting strength but not stiffness. In the latter case, the best predictor was the dynamic modulus alone.
The models developed with acoustic velocity as the main explanatory variable did not yield satisfactory results, mainly due to the low correlation of this property with strength and stiffness. Two classes could be obtained, but they were not sufficiently different enough to justify the effort of additional measurements (C45–C50). Including diameter in the regression significantly improved the prediction of both strength and modulus of elasticity compared to using the velocity alone.
In conclusion, the acoustic velocity is not efficient enough to be recommended for improving the strength grading of Eucalyptus grandis poles, even though it is quick and easy to measure. The dynamic modulus of elasticity should be preferred.
It should be emphasized, however, that the characteristic values reported and the strength classes achieved should only be used for comparison purposes. They are to be considered as a potential, since the reduction factors due to small sampling, as required by the technical standardization, were not applied during the calculations. Further testing on a larger sample is needed to confirm the current results.
Author Contributions
Conceptualization, M.B.; methodology, M.B., M.N.; investigation, M.B., M.N. and G.A.; data curation, M.N.; writing—original draft preparation, M.N.; writing—review and editing, M.B., M.N., G.A., C.B.W.; funding acquisition, M.B. All authors have read and agreed to the published version of the manuscript.
Funding
Timber material and destructive tests were funded by the company Africa Style.
Institutional Review Board Statement
Not applicable.
Informed Consent Statement
Not applicable.
Data Availability Statement
Third-Party Data.
Acknowledgments
The presented achievements were possible thanks to the collaboration and the financing of the company Africa Style. The authors are thankful to Paolo Burato, Polo Pestelli and Graziano Sani for the invaluable help during the laboratory tests.
Conflicts of Interest
The authors declare no conflict of interest.
References
- Bukauskas, A.; Mayencourt, P.; Shepherd, P.; Sharma, B.; Mueller, C.; Walker, P.; Bregulla, J. Whole timber construction: A state of the art review. Constr. Build. Mater. 2019, 213, 748–769. [Google Scholar] [CrossRef]
- Wolfe, R.; Murphy, J. Strength of small diameter round and tapered bending members. For. Prod. J. 2005, 55, 50–55. [Google Scholar]
- Bacher, M. Comparison of different machine strength grading principles. In Proceedings of the Conference of COST Action E53, Delft, The Netherlands, 29–30 October 2008; pp. 183–193. [Google Scholar]
- Ridley-Ellis, D.; Stapel, P.; Baño, V. Strength grading of sawn timber in Europe: An explanation for engineers and researchers. Eur. J. Wood Wood Prod. 2016, 74, 291–306. [Google Scholar] [CrossRef]
- Vega, A.; González, L.; Fernández, I.; González, P. Grading and mechanical characterization of small-diameter round chestnut (Castanea sativa Mill.) timber from thinning operations. Wood Mater. Sci. Eng. 2019, 14, 81–87. [Google Scholar] [CrossRef]
- Aira, J.R.; Villanueva, J.L.; Lafuente, E. Visual and machine grading of small diameter machined round Pinus sylvestris and Pinus nigra subsp. salzmannii wood from mature Spanish forests. Mater. Struct. 2019, 52, 32. [Google Scholar] [CrossRef]
- Green, D.W.; Gorman, T.M.; Evans, J.W.; Murphy, J.F. Improved grading system for structural logs for log homes. For. Prod. J. 2004, 54, 52–62. [Google Scholar]
- Green, D.W.; Gorman, T.M.; Evans, J.W.; Murphy, J.F. Mechanical grading of round timber beams. J. Mater. Civ. Eng. 2006, 18, 1–10. [Google Scholar] [CrossRef]
- Morgado, T.F.; Saporiti Machado, J.; Dias, A.M.; Cruz, H.; Rodriges, J.N. Grading and testing of maritime pine roundwood. In Proceedings of the World Conference on Timber Engineering, WCTE, Riva del Garda, Italy, 20–24 June 2010. [Google Scholar]
- Fernández-Golfín, J.I.; Diez Barra, M.R.; Hermoso, E.; Mier, R. Mechanical characterization of visually classified, small-diameter laricio pine round timber. Span. J. Agric. Res. 2007, 5, 304–311. [Google Scholar] [CrossRef] [Green Version]
- Nocetti, M.; Aminti, G.; Wessels, C.B.; Brunetti, M. Applying Machine Strength Grading System to Round Timber Used in Hydraulic Engineering Works. Forests 2021, 12, 281. [Google Scholar] [CrossRef]
- Pagel, C.L.; Lenner, R.; Wessels, C.B. Investigation into material resistance factors and properties of young, engineered Eucalyptus grandis timber. Constr. Build. Mater. 2020, 230, 117059. [Google Scholar] [CrossRef]
- Wessels, C.B.; Nocetti, M.; Brunetti, M.; Crafford, P.L.; Pröller, M.; Dugmore, M.K.; Pagel, C.; Lenner, R.; Naghizadeh, Z. Green-glued engineered products from fast growing Eucalyptus trees: A review. Eur. J. Wood Wood Prod. 2020, 78, 933–940. [Google Scholar] [CrossRef]
- Dugmore, M.; Nocetti, M.; Brunetti, M.; Naghizadeh, Z.; Wessels, C.B. Bonding quality of cross-laminated timber: Evaluation of test methods on Eucalyptus grandis panels. Constr. Build. Mater. 2019, 211, 217–227. [Google Scholar] [CrossRef]
- Crafford, P.L.; Wessels, C.B. The potential of young, green finger-jointed Eucalyptus grandis lumber for roof truss manufacturing. South. For. J. For. Sci. 2016, 78, 61–71. [Google Scholar] [CrossRef]
- Nocetti, M.; Pröller, M.; Brunetti, M.; Dowse, G.P.; Wessels, C.B. Investigating the Potential of Strength Grading Green Eucalyptus grandis Lumber using Multi-Sensor Technology. BioResources 2017, 12, 9273–9286. [Google Scholar]
- SANS 457-3. In Wooden Poles, Droppers and Guardrail Posts. Part 3: Hardwood Species; South African Bureau of Standards: Pretoria, South Africa, 2019.
- Yang, J.-L.; Waugh, G. Growth stress, its measurement and effects. Aust. For. 2001, 64, 127–135. [Google Scholar] [CrossRef]
- Yang, J.L. The impact of log-end splits and spring on sawn recovery of 32-year-old plantation Eucalyptus globulus Labill. Holz Als Roh-Und Werkst. 2005, 63, 442–448. [Google Scholar] [CrossRef]
- Mugabi, P.; Rypstra, T.; Vermaas, H.F.; Nel, D.G. Relationships between drying defect parameters and some growth characteristics in kiln-dried South African grown Eucalyptus grandis poles. Eur. J. Wood Wood Prod. 2010, 68, 329–340. [Google Scholar] [CrossRef]
- Mugabi, P.; Rypstra, T.; Vermaas, H.F.; Nel, D.G. Effect of kiln drying schedule on the quality of South African grown Eucalyptus grandis poles. Eur. J. Wood Wood Prod. 2011, 69, 19–26. [Google Scholar] [CrossRef]
- SANS 10163-1. In South African National Standard. The Structural Use of Timber. Part 1: Limit-States Design; Standards South Africa: Pretoria, South Africa, 2003.
- EN 14251. In Structural Round Timber—Test Methods; CEN—European Committee for Standardization: Bruxelles, Brussels, 2003.
- ISO 13061-4. In Physical and Mechanical Properties of Wood. Test Methods for Small Clear Specimen. Part 4: Determination of Modulus of Elasticity in Static Bending; ISO—International Organization for Standardization: Geneva, Switzerland, 2014.
- EN 13183-1. In Moisture Content of a Piece of Sawn Timber. Determination by Oven Dry Method; CEN—European Committee for Standardization: Brussels, Belgium, 2002.
- EN 384. In Structural Timber. Determination of Characteristic Values of Mechanical Properties and Density; CEN—European Committee for Standardization: Bruxelles, Brussels, 2016.
- EN 14358. In Timber Structures. Calculation and Verification of Characteristic Values; CEN—European Committee for Standardization: Bruxelles, Belgium, 2016.
- EN 338. In Structural Timber. Strength Classes; CEN—European Committee for Standardization: Bruxelles, Belgium, 2016.
- Piter, J.C.; Zerbino, R.L.; Blass, H.J. Visual strength grading of Argentinean Eucalyptus grandis. Holz Als Roh-Und Werkst. 2004, 62, 1–8. [Google Scholar] [CrossRef] [Green Version]
- Sandoz, J. Form and treatment effects on conical roundwood tested in bending. Wood Sci. Technol. 1991, 25, 203–214. [Google Scholar] [CrossRef]
- Vestøl, G.I.; Høibø, O. Bending strength and modulus of elasticity of squares with wane as compared with round timber of Scots pine (Pinus sylvestris). For. Prod. J. 2010, 60, 40–47. [Google Scholar] [CrossRef]
- Wolfe, R. Research challenges for structural use of small-diameter round timbers. For. Prod. J. 2000, 50, 21–29. [Google Scholar]
- Nocetti, M.; Brancheriau, L.; Bacher, M.; Brunetti, M.; Crivellaro, A. Relationship between local and global modulus of elasticity in bending and its consequence on structural timber grading. Eur. J. Wood Wood Prod. 2013, 71, 297–308. [Google Scholar] [CrossRef]
- Ruy, M.; Gonçalves, R.; Pereira, D.M.; Lorensani, R.G.M.; Bertoldo, C. Ultrasound grading of round Eucalyptus timber using the Brazilian standard. Eur. J. Wood Wood Prod. 2018, 76, 889–898. [Google Scholar] [CrossRef]
- Piter, J.C.; Zerbino, R.L.; Blass, H.J. Machine strength grading of Argentinean Eucalyptus grandis. Holz Als Roh-Und Werkst. 2004, 62, 9–15. [Google Scholar] [CrossRef] [Green Version]
- Llana, D.F.; Short, I.; Harte, A.M. Use of non-destructive test methods on Irish hardwood standing trees and small-diameter round timber for prediction of mechanical properties. Ann. For. Sci. 2020, 77, 62. [Google Scholar] [CrossRef]
- Wang, X.; Ross, R.J.; Brashaw, B.K.; Punches, J.; Erickson, J.R.; Forsman, J.W.; Pellerin, R.F. Diameter effect on stress-wave evaluation of modulus of elasticity of logs. Wood Fiber Sci. 2004, 36, 368–377. [Google Scholar]
- Nocetti, M.; Bacher, M.; Brunetti, M.; Crivellaro, A.; van de Kuilen, J.W.G. Machine grading of Italian structural timber: Preliminary results on different wood species. In Proceedings of the World Conference on Timber Engineering, WCTE, Riva del Garda, Italy, 20–24 June 2010; pp. 285–292. [Google Scholar]
- Vega, A.; Dieste, A.; Guaita, M.; Majada, J.; Baño, V. Modelling of the mechanical properties of Castanea sativa Mill. structural timber by a combination of non-destructive variables and visual grading parameters. Eur. J. Wood Wood Prod. 2012, 70, 839–844. [Google Scholar] [CrossRef]
- Vega, A.; Arriaga, F.; Guaita, M.; Baño, V. Proposal for visual grading criteria of structural timber of sweet chestnut from Spain. Eur. J. Wood Wood Prod. 2013, 71, 529–532. [Google Scholar] [CrossRef]
- Nocetti, M.; Brunetti, M.; Bacher, M. Efficiency of the machine grading of chestnut structural timber: Prediction of strength classes by dry and wet measurements. Mater. Struct. 2016, 49, 4439–4450. [Google Scholar] [CrossRef]
Figure 1.
Observed vs. predicted values: (a) model three of Table 5 as the best model for the prediction of bending strength (fm); (b) model four of Table 5 as the best model for the prediction of static modulus of elasticity (Em). The grey shaded area represents the 95% confidence interval.

Figure 2.
Observed vs. predicted values: (a) model 8 of Table 6 as the best model for the prediction of bending strength (fm); (b) model 10 of Table 6 as the best model for the prediction of static modulus of elasticity (Em). The grey shaded area represents the 95% confidence interval.

Figure 3.
Characteristic values of grade S1 and S2 selected by the grading parameters developed with the regression models described in Table 5 and 6: (a) 5th percentile of bending strength; (b) mean values of modulus of elasticity; (c) 5th percentile of density.
Figure 3.
Characteristic values of grade S1 and S2 selected by the grading parameters developed with the regression models described in Table 5 and 6: (a) 5th percentile of bending strength; (b) mean values of modulus of elasticity; (c) 5th percentile of density.


Table 1.
Description of the sample: number of pieces for diameter class and length.
| Length | Diameter Class (mm) | TOT | ||
|---|---|---|---|---|
| (m) | 125–149 | 150–174 | 175–199 | |
| 3.6 | 10 | 15 | - | 25 |
| 4.2 | - | 10 | - | 10 |
| 4.8 | 10 | 10 | 10 | 30 |
| 5.4 | 10 | 5 | 5 | 20 |
| 6.6 | 10 | 5 | 5 | 20 |
| TOT | 40 | 45 | 20 | 105 |
Table 2.
Strength classes as described in EN 338 (fm,k = 5th percentile of bending strength; Em = mean modulus of elasticity; Em,REQ = requirement for the assignment to the class; ρk = 5th percentile of density). Class C60 is an addition by the authors.
Table 2.
Strength classes as described in EN 338 (fm,k = 5th percentile of bending strength; Em = mean modulus of elasticity; Em,REQ = requirement for the assignment to the class; ρk = 5th percentile of density). Class C60 is an addition by the authors.
| Strength Class | fm,k (MPa) | Em (GPa) | Em,REQ (GPa) | ρk (kg/m3) |
|---|---|---|---|---|
| C60 | 60 | 17.0 | 16.15 | 440 |
| C50 | 50 | 16.0 | 15.20 | 430 |
| C45 | 45 | 15.0 | 14.25 | 410 |
| C40 | 40 | 14.0 | 13.30 | 400 |
| C35 | 35 | 13.0 | 12.35 | 390 |
| C30 | 30 | 12.0 | 11.40 | 380 |
| C27 | 27 | 11.5 | 10.93 | 360 |
Table 3.
Mean values, coefficients of variation (CV) and 5th percentile of physical and mechanical properties. MC = moisture content, fm = bending strength; Em = static modulus of elasticity; ρ = density; Ed = dynamic modulus of elasticity; V = stress wave velocity.
Table 3.
Mean values, coefficients of variation (CV) and 5th percentile of physical and mechanical properties. MC = moisture content, fm = bending strength; Em = static modulus of elasticity; ρ = density; Ed = dynamic modulus of elasticity; V = stress wave velocity.
| Property | Unit | Mean | CV 1 | 5th Perc |
|---|---|---|---|---|
| MC | (%) | 13.2 | 11.9 | - |
| fm | (MPa) | 76.5 | 16.7 | 55.1 |
| Em | (GPa) | 14.8 | 13.7 | 11.2 |
| ρ | (kg/m3) | 545 | 10.9 | 431 |
| Ed | (GPa) | 15.0 | 10.8 | 12.0 |
| V | (km/s) | 5.3 | 3.9 | 4.9 |
1 Expressed as a percentage (%) for all properties.
Table 4.
Coefficients of determination between several material properties (fm = bending strength; Em = static modulus of elasticity; ρ = density; KN = knot parameter, visually measured; V = velocity; Edyn = dynamic modulus of elasticity).
Table 4.
Coefficients of determination between several material properties (fm = bending strength; Em = static modulus of elasticity; ρ = density; KN = knot parameter, visually measured; V = velocity; Edyn = dynamic modulus of elasticity).
| fm | Em | ρ | KN | V | |
|---|---|---|---|---|---|
| Em | 0.48 | ||||
| ρ | 0.65 | 0.47 | |||
| KN | 0.04 | 0.03 | 0.04 | ||
| V | 0.02 | 0.04 | 0.12 | 0.00 | |
| Edyn | 0.61 | 0.66 | 0.51 | 0.04 | 0.10 |
Table 5.
Coefficients of the regression model for bending strength (fm) and static modulus of elasticity (Em) estimation. Ed = dynamic modulus of elasticity; ρ = density; D = average diameter at midspan; R2 = coefficient of determination; SE = standard error of estimation; N = model number.
Table 5.
Coefficients of the regression model for bending strength (fm) and static modulus of elasticity (Em) estimation. Ed = dynamic modulus of elasticity; ρ = density; D = average diameter at midspan; R2 = coefficient of determination; SE = standard error of estimation; N = model number.
| Model Y = f(X) | ||||||||
|---|---|---|---|---|---|---|---|---|
| Y | X | a | b | c | d | R2 | SE | N |
| fm | a + b Ed | −15.60 * | 0.0061 *** | 0.61 | 8.0 | (1) | ||
| a + b Ed + c ρ | −31.61 *** | 0.0025 *** | 0.1297 *** | 0.77 | 6.2 | (2) | ||
| a + b Ed + c ρ + d D | −1.72 ns | 0.0024 *** | 0.1217 *** | −0.1393 *** | 0.82 | 5.5 | (3) | |
| Em | a + b Ed | −452.6 ns | 1.0134 *** | 0.66 | 1194 | (4) | ||
| a + b Ed + c ρ | −860.13 ns | 0.9220 *** | 3.3010 ns | 0.66 | 1193 | (5) | ||
| a + b Ed + c ρ + d D | −1015.08 ns | 0.9100 *** | 2.8019 ns | −8.7401 ns | 0.67 | 1185 | (6) | |
ns: not significant; * significant at 5% level; ** significant at 1% level; *** significant at 0.1% level.
Table 6.
Coefficients of the regression model for bending strength (fm) and static modulus of elasticity (Em) estimation. V = stress-wave velocity; D = average diameter at midspan; R2 = coefficient of determination; SE = standard error of estimation; N = number.
Table 6.
Coefficients of the regression model for bending strength (fm) and static modulus of elasticity (Em) estimation. V = stress-wave velocity; D = average diameter at midspan; R2 = coefficient of determination; SE = standard error of estimation; N = number.
| Y | X | a | b | c | R2 | SE | N |
|---|---|---|---|---|---|---|---|
| fm | a + b V | 120.70 *** | −0.0083 ns | 0.02 | 12.7 | (7) | |
| a + b V + c D | 167.52 *** | −0.0091 ns | −0.2650 *** | 0.21 | 11.4 | (8) | |
| Em | a + b V | 4623.42 ns | 1.9270 * | 0.04 | 2000 | (9) | |
| a + b V + c D | 9215.66 ns | 1.8605 * | −25.9950 ** | 0.11 | 1931 | (10) |
ns: not significant; * significant at 5% level; *** significant at 0.1% level.
Table 7.
Description of the two new grades divided by the threshold of the several grading parameters (GP). Ed = dynamic modulus of elasticity; N = number of poles in the grade; fm,k = 5th percentile of bending strength; Em = mean modulus of elasticity; ρk = 5th percentile of density.
Table 7.
Description of the two new grades divided by the threshold of the several grading parameters (GP). Ed = dynamic modulus of elasticity; N = number of poles in the grade; fm,k = 5th percentile of bending strength; Em = mean modulus of elasticity; ρk = 5th percentile of density.
| GP | Threshold | N | Characteristic Values | Class 1 | ||
|---|---|---|---|---|---|---|
| (MPa) | (-) | fm,k (MPa) | Em (GP) | ρk (kg/m3) | (-) | |
| model 3 | ≥77 | 47 | 72.3 | 16.2 | 518 | C60 |
| <77 | 58 | 47.5 | 13.6 | 412 | C40 | |
| Ed | ≥15,300 | 46 | 63.9 | 16.3 | 483 | C60 |
| <15,300 | 59 | 47.3 | 13.6 | 411 | C40 | |
| model 8 | ≥77.5 | 45 | 63.9 | 15.4 | 488 | C50 |
| <77.5 | 60 | 47.1 | 14.3 | 411 | C45 | |
| model 10 | ≥15,000 | 44 | 54.6 | 16.1 | 444 | C50 |
| <15,000 | 61 | 47.4 | 14.3 | 411 | C45 | |
1 Strength class achieved without considering the reduction in the test results due to the factor kn of the EN 384 [26] to adjust to the number of subsamples.
Publisher’s Note: MDPI stays neutral with regard to jurisdictional claims in published maps and institutional affiliations. |
© 2021 by the authors. Licensee MDPI, Basel, Switzerland. This article is an open access article distributed under the terms and conditions of the Creative Commons Attribution (CC BY) license (https://creativecommons.org/licenses/by/4.0/).
Share and Cite
MDPI and ACS Style
Brunetti, M.; Aminti, G.; Wessels, C.B.; Nocetti, M. Mixed Visual and Machine Grading to Select Eucalyptus grandis Poles into High-Strength Classes. Forests 2021, 12, 1804. https://0-doi-org.brum.beds.ac.uk/10.3390/f12121804
AMA Style
Brunetti M, Aminti G, Wessels CB, Nocetti M. Mixed Visual and Machine Grading to Select Eucalyptus grandis Poles into High-Strength Classes. Forests. 2021; 12(12):1804. https://0-doi-org.brum.beds.ac.uk/10.3390/f12121804
Chicago/Turabian StyleBrunetti, Michele, Giovanni Aminti, C. Brand Wessels, and Michela Nocetti. 2021. "Mixed Visual and Machine Grading to Select Eucalyptus grandis Poles into High-Strength Classes" Forests 12, no. 12: 1804. https://0-doi-org.brum.beds.ac.uk/10.3390/f12121804
Note that from the first issue of 2016, this journal uses article numbers instead of page numbers. See further details here.