Article

Variation of Soil Organic Carbon Density with Plantation Age and Initial Vegetation Types in the Liupan Mountains Areas of Northwest China

1
Key Laboratory of National Forestry and Grassland Administration on Soil and Water Conservation, Beijing Forestry University, Beijing 100083, China
2
Key Laboratory of Forest Ecology and Environment of National Forestry and Grassland Administration, Institute of Forest Ecology, Environment and Nature Conservation, Chinese Academy of Forestry, Beijing 100091, China
*
Author to whom correspondence should be addressed.
Submission received: 24 November 2021 / Revised: 15 December 2021 / Accepted: 16 December 2021 / Published: 20 December 2021

Abstract

:
Carbon sequestration of plantations formed by three kinds of forestation (natural forest to plantation (NP), grassland to plantation (GP), and cropland to plantation (CP)) greatly depends on the change of soil organic carbon density (SOCD) compared with its initial SOCD before forestation. However, this dependence was rarely studied, especially in semi-humid/arid regions with strong site variation. This limits the precise assessment and management of SOCD. Therefore, the SOCD variations of 0–100 cm soil layers in these three kinds of plantations were studied in the semi-humid/arid Liupan Mountains in northwestern China. The NP with high initial SOCD showed firstly a decrease and then an increase of SOCD up to 293.2 t·ha−1 at 40 years. The CP and GP with low and relatively high initial SOCD showed negligible and slight SOCD decrease after forestation, but then an increase up to 154.5 and 266.5 t·ha−1 at 40 years. After detecting the main factors influencing SOCD for each forestation mode, statistic relationships were fitted for predicting SOCD variation. This study indicates that besides forest age and biomass growth, the effects of initial vegetation, site-dependent initial SOCD, and SOCD capacity, also precipitation and air temperature in some cases, should be considered for more precise assessment and management of SOCD of plantations.

1. Introduction

Forestation is usually viewed as an important and effective approach to mitigating climate change by increasing the amount of carbon stored in vegetation and soil pools [1]. China has made a significant contribution to global carbon sequestration due to several large-scale forest restoration projects since 1978, and having the worldwide largest plantation area of about 80 million ha. In the period from 2000 to 2017, China showed the highest net increase of green leaf-covered area (1351 million km2) and the highest growth rate (17.8%), largely due to forestation [2]. Both the existing plantation area and future potential afforestation area are mainly located at the semi-humid/arid regions of northwestern and northern China, where complex land use, variable site quality, and low precipitation (mostly of 400–800 mm) are important influencing factors of the forest area increase [3], forest growth, and consequently carbon sequestration [4].
The total carbon stored in forests is mainly composed of soil organic carbon (SOC) [5,6]. The increase of soil carbon sequestration depends on the increase of both forest area and the SOC stock per unit of land area—we usually refer to the latter as soil organic carbon density (SOCD). Considering the limitations of suitable land area and water resources for further afforestation in future, the increase of SOCD through site-specific forestation and precise management is the key to achieving higher carbon sequestration. The impact of forestation on SOCD is complex. Firstly, it is not simply equal to the inverse process of deforestation, which no doubt leads to the decreases of SOCD [7,8]. Secondly, the forestation impact on SOCD varies greatly, due to the differences in forestation modes (i.e., afforestation, reforestation, and tree species conversion) [9], initial SOCD before forestation [10], site-dependent tree growth, management measures, and forest age (growth stage) [11,12]. For example, a study carried out in Australia [13] showed that the afforestation on rangeland caused a continuous decrease of SOC over 18 years; while a continuous increase of SOC after afforestation was reported in a study on the Loess Plateau of China [14]. In recent years, many attempts were made to establish the quantitative relationships of SOC dynamics after forestation. For example, the relationship between SOC and net primary productivity was established to obtain a global-scale model of SOC change for grassland afforestation [15]. A two-level mixed model to reflect the relative change rate of SOC with time was established [9]. For an accurate assessment and prediction of soil carbon sequestration, it is necessary to predict the SOCD dynamics of different forestation modes at variously qualified sites. An increasing number of studies have attempted to clarify the large-scale variation of SOCD by a meta-analysis of collected literature data or using remote sensing data [10,11,12]. These studies can only describe SOCD changes on a large regional scale, but cannot distinguish more detailed stand differences and thus enhance the mechanism understanding of the SOCD change of plantations. Therefore, we need to expand these studies by including more detailed data from regional field studies. Moreover, the accurate estimates of SOCD dynamics after forestation in the climate-sensitive semi-humid/arid regions were rare, especially due to the lack of data from regional field surveys, and thus remain a major challenge.
The diverse conditions of climate, landform, soil, and forest/vegetation in the semi-humid/arid climate transition zone on the Loess Plateau in northwestern China provide a rare platform to study the SOCD variation after forestation under different environmental conditions. This study was carried out based on a field investigation of sample plots (of plantations and compared initial vegetation types), with the objectives of clarifying the temporal variation of SOCD after forestation and the effects of the main influencing factors under different forestation modes. That is, how did SOC change over the 40 years after forestation? How were the changes in SOC affected by the environment and initial vegetation types before forestation? Such a study can help us to understand and quantify the SOCD variation under various forestation modes and sites, to strengthen the scientifically based decisions of forest SOCD management in semi-humid/arid regions.

2. Materials and Methods
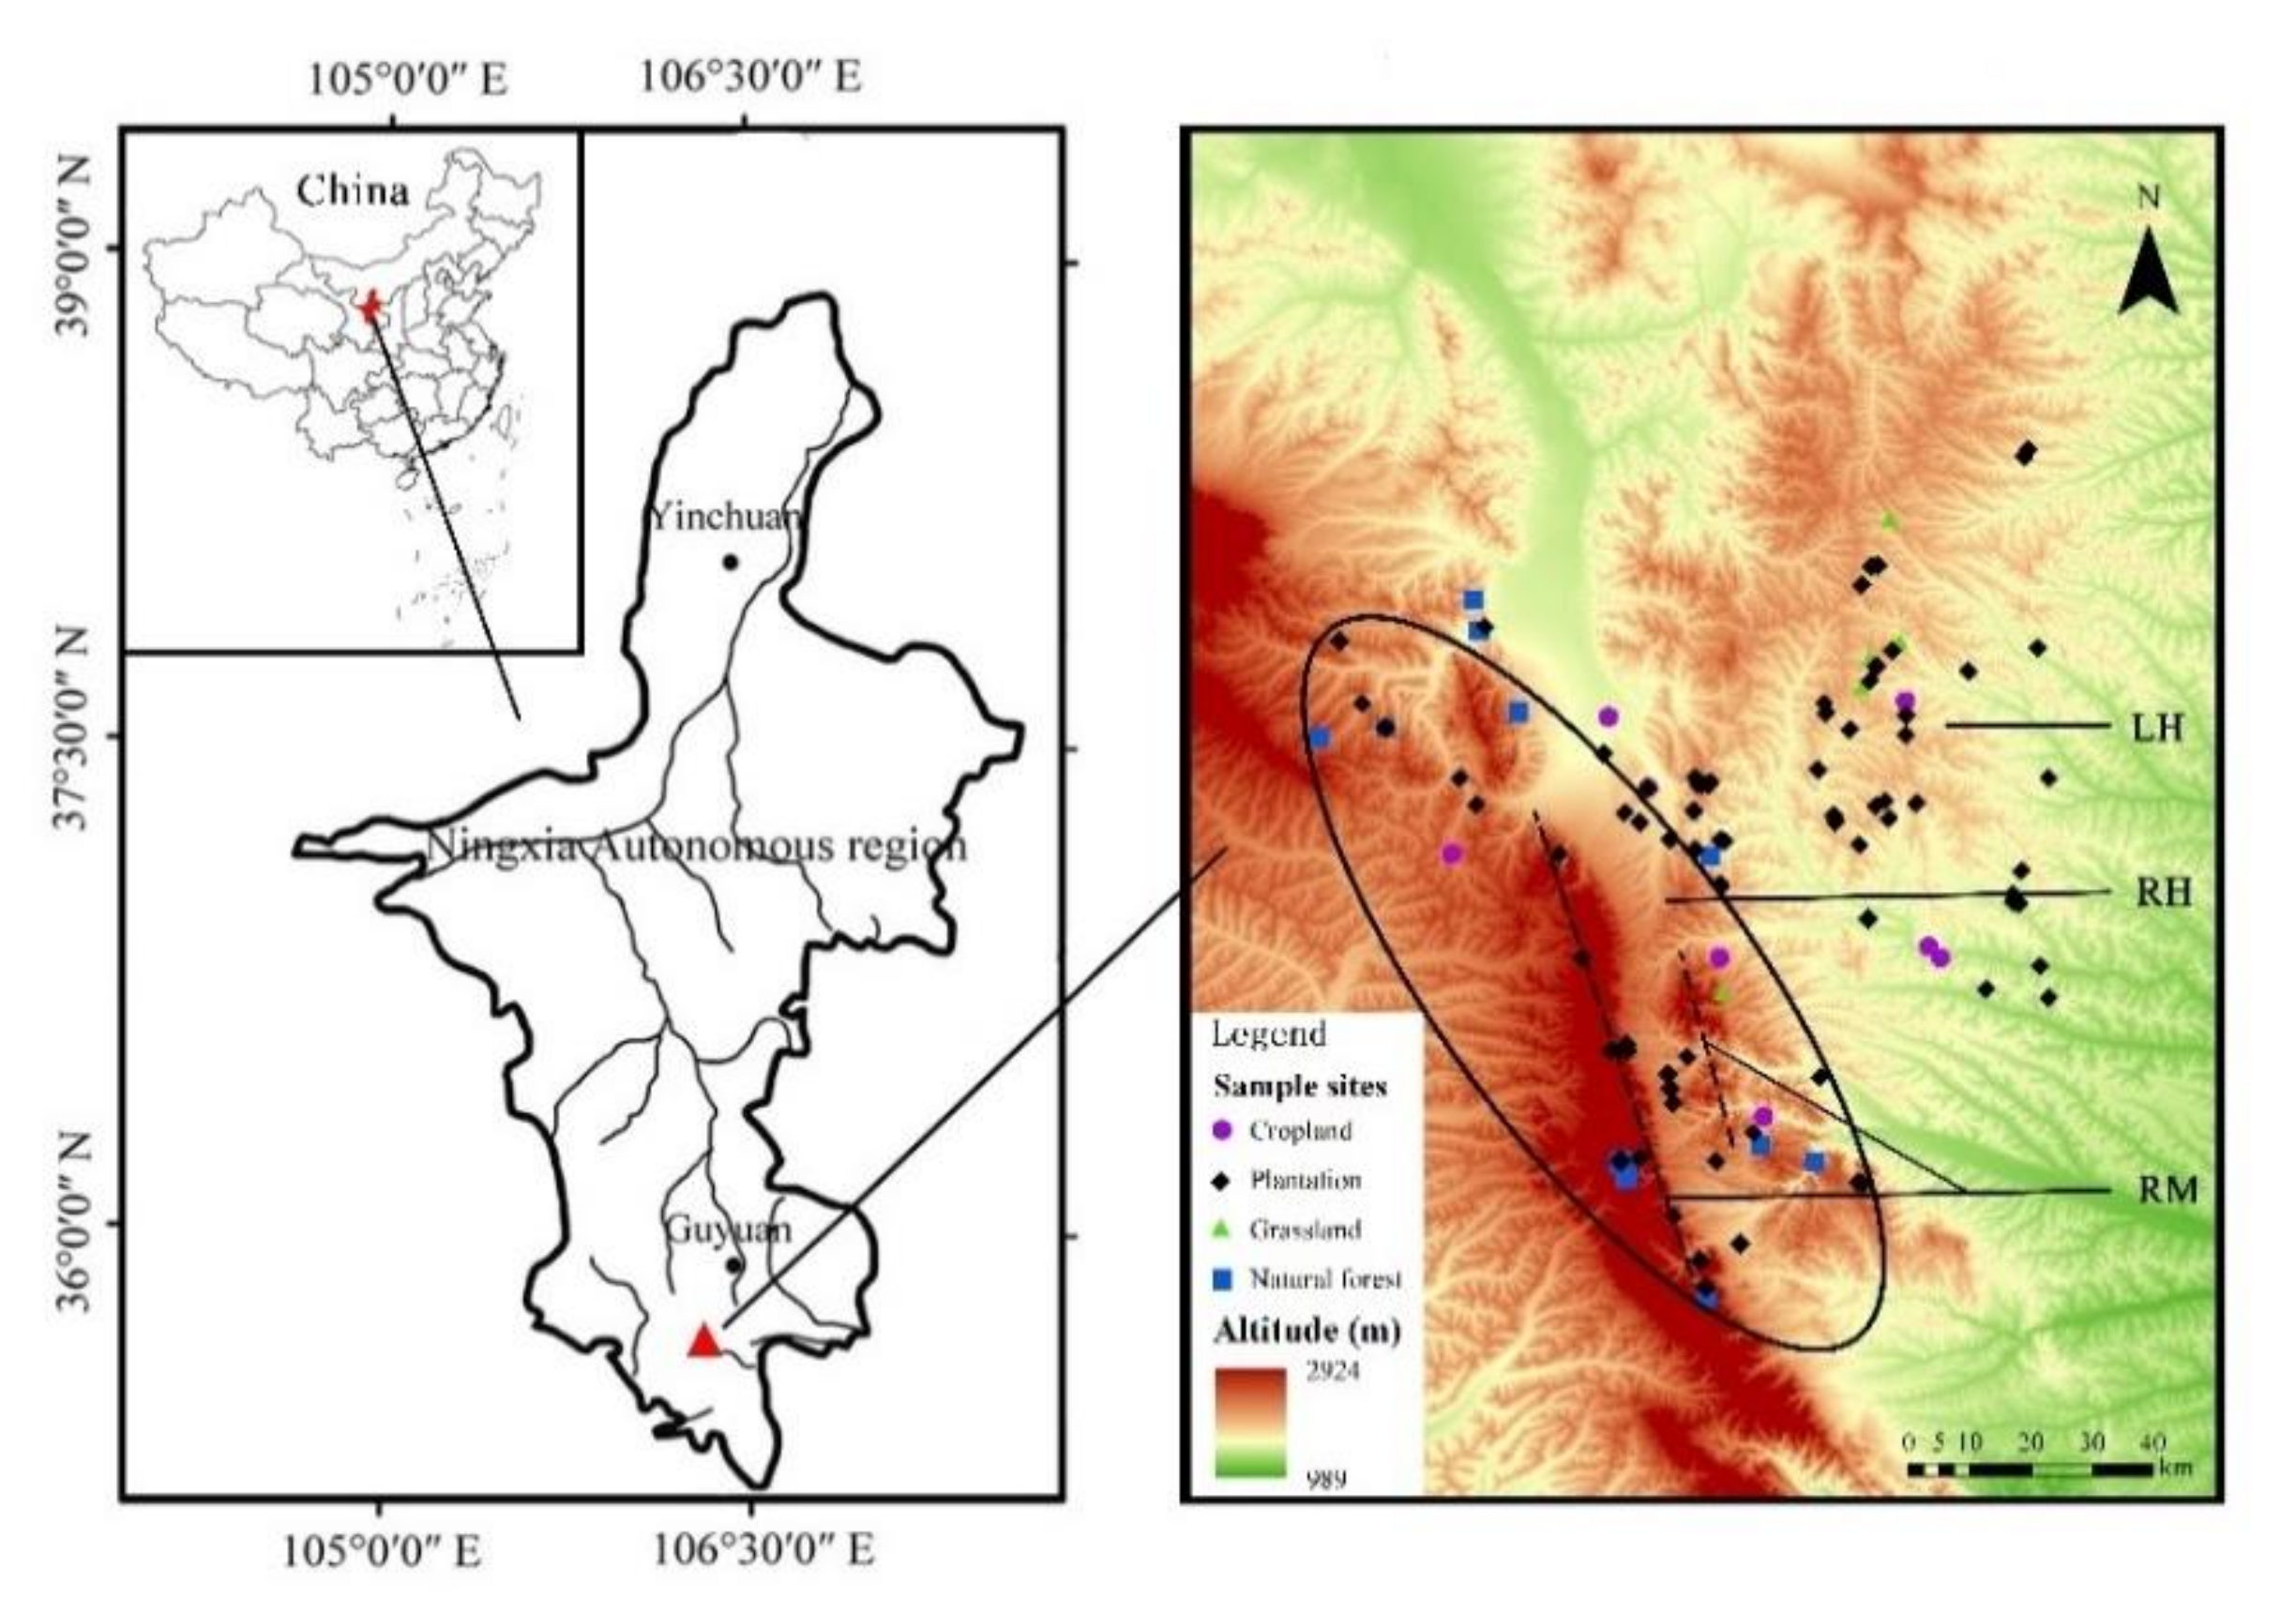
2.1. Study Area

This study was conducted in the Liupan Mountains and surrounding areas on the mid-western part of the Loess Plateau in Northwestern China (35°18′ N—36°34′ N, 105°47′ E—106°52′ E) (Figure 1, national and province maps are from the Ministry of Natural Resources of the P.R.C. (http://bzdt.ch.mnr.gov.cn, accessed on 12 March 2021), and the DEM data are from the Geospatial data cloud (https://www.gscloud.cn, accessed on 12 March 2021). The climate here is in to the transition zone from the warm temperate semi-humid zone to the semi-arid zone. There is a mean annual air temperature (MAT) of 4.1–9.5 ℃; the coldest month is January, and the warmest month is July. The mean annual precipitation (MAP) varies within the range of 350–650 mm, but is mainly distributed in the summer and autumn. The bedrocks are primarily sandy mudstone and calcareous shale in the rocky mountain areas, or wind-accumulated loess parent material in the loess areas around the Liupan Mountains. The soil types are mainly humic cambisols (Food and Agriculture Organization of the United Nations, FAO) in the rocky mountain areas, and loessal soils in the loess areas. In the study areas, the forests grow within the altitude ranges of 1400–2700 m, with a variety of landform types. Most of the forests are defined as protective forests, thus no management measures (except limited thinning of over-dense plantation stands) were taken until our investigation, also there has been no management of soil, water, and nutrients. In general, the limiting factor to forest growth is not soil nutrition conditions, but drought stress due to low precipitation. The study area is divided into three sub-areas (the rocky mountainous sub-area, RM; rocky hilly sub-area, RH; and loess hilly sub-area, LH) based on the topography conditions.
The sub-area RM, namely the Liupan Mountains, is distributed in a northwest-southeast direction, with an altitude generally above 2000 m. The MAT is 6 °C and the MAP is 632 mm. This sub-area has long and steep slopes and broken terrain. The soil type is mainly humic cambisols (FAO), which was developed on the residue or slope deposit of weathered mudstone and shale. The Liupan Mountain has high forest cover (of 64.5%) with relatively diverse tree species, including Betula platyphlla, Betula albo-sinensis, Quercus liaotungersis, Pinus armandii, and Populus davidiana. Larix principis-rupprechtii was introduced to this area in the 1960s as a fast-growing tree species for establishing timber plantations, which now covers the largest proportion of the plantation area in this region [16].
The RH sub-area is mainly located in the cenozoic fault zone between the eastern and western veins of the Liupan Mountains and within the transitional zone extending from the sub-area RM to the sub-area LH. The altitude in RH is mostly below 2000 m. The MAT is 6.7 °C and the MAP is 541.5 mm. The soils were developed in situ from lithological parent materials but are covered by a variable thickness of loess, thus leading to a wide spatial heterogeneity of soil conditions. The natural forests within this sub-area are patchily distributed, with the dominant tree species of Quercus liaotungersis, Populus davidiana, Betula platyphlla, etc. Large-scale forest restoration activities since 1978, and especially the Grain for Green Programs since 1999, have been carried out on gentle slopes, with the main tree species of Pinus tabulaeformis and Robinia pseudoacacia, the companion small arbor species of Prunus davidiana and Armeniaca sibirica, and the shrub species of Hippophae rhamnoides [17].
The sub-area of LH is mostly located within the Jing River basin in the eastern side of the Liupan Mountains, with a MAT of 8 °C and a MAP of 375 mm [18]. The altitude of this sub-area varies within 1400–1800 m, the soil type is loessal soil developed on the deep wind-accumulated loess materials. Lands in this sub-area were mostly used as typical rain-fed agricultural farmland. However, a lot of slope farmland was converted to plantations due to the forest restoration activities since 1978 and especially the Grain for Green Programs since 1999, with the main tree species of Prunus davidiana, Robinia pseudoacacia, Picea crassifolia, etc. [19]. Many efforts have been made in this area to increase the forest/vegetation cover to control the severe soil erosion, but the survival rate is always low due to the severe drought caused by low annual precipitation. Therefore, the forest cover is as low as 12.7%, and the forests are mainly distributed on the shady slopes [20].

2.2. Sample Plots Selection and Investigation

There are three main forestation modes in the study areas. They are natural-forest-to-plantation (NP, converting the natural (but secondary) forests to plantation by reforestation mainly for increasing the timber productivity), grassland-to-plantation (GP, converting grasslands—which had been abandoned for a long time or were never cultivated due to steep slopes—to forests by planting trees/shrubs mainly for timber production and/or soil erosion control), and cropland-to-plantation (CP, converting slope cropland to forests by planting trees/shrubs, according to site conditions, mainly for soil erosion control). The forestation, regardless of any particular forestation mode, was finished with manpower, not with machine. For getting more accurate calculations, the SOCD was corrected to exclude the effect of soil bulk density change after forestation. In total, 115 plantation plots and 27 control plots with a size of 20 m × 20 m were selected and investigated in the period of 2015–2018. These plots were divided into 15 groups according to topography or initial vegetation types (Table 1, Table 2).
The geographical information of all plots was recorded using a portable GPS receiver (Aicevoos M2, Wuhan, China). The mean tree height, diameter at breath height (DBH), and tree density of plantation plots were measured with technical regulations for continuous forest inventory (GB/T 38590–2020, Standardization Administration of China). The tree age was measured by taking stem growth cores. As all plantations investigated are even-aged, the mean age of 5–7 trees was used to determine the plantation age. The MAP and MAT were extracted according to the coordinates of plots from the daily ground precipitation grid data set for the last 60 years in China from the China Meteorological Data Network (http://www.dsac.cn, accessed on 8 March 2021).

2.3. Soil Sampling and Analysis

Typical soil profiles were set up for all plots, but away from natural or human disturbances such as tree stumps, animal burrows, windfall trees, and paths. The characteristics of soil profiles were recorded, and soil cutting ring samples of 5 layers (0–10, 10–20, 20–40, 40–60, 60–100 cm) were taken at 3–5 locations of each plot. The mean soil organic carbon content of the 0–100 cm soil layer was determined using the thickness-weighted average of each soil layer. Considering the low fraction of the organic carbon pool of the humus layers in the total organic carbon stock of forest ecosystems, and the much faster turnover and lower stability of the organic carbon in humus layers compared with that in mineral soils, where some fractions of SOC can be stored for decades to millennia [21,22], only the SOC in 0–100 cm mineral soil layers was considered in this study, without considering the SOC stored in humus layers. The soil bulk density and porosity were measured using the soil cutting ring method (stainless steel cylinders with a diameter of 7 cm and a volume of 200 cm3, according to the national standard (LY/T 1215–1999, National Forestry Administration of China)). Soil samples for chemical analysis were sampled at more than three different locations according to soil layers using a soil auger, then mixed equally within each layer, air dried, and transported to the laboratory, passed through a 2-mm soil sieve, and stored for analysis. The SOC content was determined using the potassium dichromate oxidation method (LY/T 1237–1999, National Forestry Administration of China). The weighted means of soil physical and chemical properties of the five layers of each plot were calculated and used for this study.

2.4. Calculation and Correction of SOCD

The SOC content generally declines with rising soil depth most significantly in the main root zone of 0–40 cm, but further declines in the layer of 40–100 cm [23,24]. In this study, most soil thickness investigated in the RM sub-area (with the shallowest soil of the three sub-areas) exceeds 100 cm. Thus, it was determined to study the variation of SOCD (t·ha−1) within the soil layer of 0–100 cm, which was calculated as below:
SOCD = C × BD × D × (1 − R)
where C is the SOC content (%), BD is the soil bulk density (g·cm−3), D is the soil thickness (m), and R is the volumetric content (%) of gravels larger than 2 mm in the soil.
Soil bulk density is one of the important parameters influencing the calculated change in SOCD. [25]. Because of the anthropogenic influences due to land-use change and the inherent nature of loose structure of forest soils, soil bulk density tends to change significantly within 20 years after afforestation [23], thus requiring a correction for constant soil mass [26,27], e.g., a study showed that the correction using soil bulk density before and after land-use change led to an average increase of 28% of the land-use change impact [8]. Thus, a SOCD correction using the soil bulk density of 0–100 cm layers was made (Equation (2)) in this study, and only the corrected SOCD (SOCDcorr, t·ha−1) was used in the later analysis (but still expressed as SOCD to save space).
SOCD corr = BD ( LU 0 ) × SOCD ( LU ) BD ( LU )
where BD is the average soil bulk density of 1 m soil layer (g·cm−3); LU0 and LU is the land-use type before and after forestation, respectively.
As the SOCD data will be analyzed in plot groups of forestation mode in each sub-area, a big effect on the analysis due to the big difference in initial SOCD (before forestation) among plot groups will appear. Thus, the SOCD change (ΔSOCD, Equation (3)) was calculated and used to exclude the effect caused by initial SOCD differences among plot groups for showing the SOCD change caused by forestation more accurately:
Δ SOCD = SOCD corr SOCD LU 0

2.5. The Functions of Temporal Variation of SOCD

The temporal variation of ΔSOCD after forestation may differ greatly among forestation modes and sub-areas. To determine the proper function types of the temporal variation of ΔSOCD by minimizing the disturbances from other factors than the time after forestation (forest age), the upper-boundary line (showing the best cases) and bottom-boundary line (showing the worst cases) were derived using the scatter diagram of measured data obtained from the not-controlled field investigation [16]. Firstly, the whole variation range of the independent variable (time after forestation) was divided into some segments. Then the upper-boundary line data of the dependent variables (SOCD, ΔSOCD) in each segment were selected if the data were one standard deviation higher (for the upper-boundary line) or lower (for the bottom-boundary line) than the mean value within each segment. However, the collected data were not uniformly distributed within the variation range of forest age, causing more scattering or insufficient data in a few segments. Therefore, some upper- or bottom-boundary line data within the segments of very few data were artificially selected, or some redundant data within segments of excessive data were removed. Based on the upper- or bottom-boundary line data, the function types of SOCD or ΔSOCD variation can be judged as logistic (Equation (4)) or polynomial (Equation (5)). When fitting the variation curves and equations of ΔSOCD, which presents the net change of SOCD, an intercept of 0 was used (Equations (6) and (7)).
SOCD upper = a + b a 1 + Time / t p
SOCD bottom = a × Time 2 + b × Time + c
Δ SOCD upper = a + a 1 + Time / t p
Δ SOCD bottom = a × Time 2 + b × Time
where Time is the time after forestation (forest age, years); and a, b, c, t, p are the parameters to be fitted. The SOCD and ΔSOCD with subscript upper or bottom present the absolute values and changes of SOCD (t·ha−1).
For expressing the general response of SOCD to the time after forestation, the averages of the fitted upper-boundary line and bottom-boundary line functions were used in this study (Equations (8) and (9)), for excluding the disturbance caused by the fitting bias due to over-aggregated data in some segments of forest age or in some spatial locations.
SOCD = ( SOCD upper + SOCD bottom ) / 2
Δ SOCD = ( Δ SOCD upper + Δ SOCD bottom ) / 2

2.6. TheΔSOCD Models Coupling the Effects of Multiple Factors

After excluding the temporal variation of ΔSOCD using fitted equations, the remaining variation of ΔSOCD can be partly attributed to other environmental factors (e.g., MAT, MAP, altitude (Alt)) and biological factors (e.g., initial SOCD (SOCD0), tree biomass (Bio)). They were used as additional explanatory variables in the development of more complete models. Factors significantly influencing the variation of ΔSOCD were selected using regression analysis, and the explained importance of these factors was calculated by the partial regression coefficient. Their linear response functions were used to build the multifactors model (Equation (10)) to reflect the continuous multiplicative effect on ΔSOCD. A factor can be added into the multifactors model when the model determination coefficient (R2) is higher after including this factor.
Δ SOCD = f ( Time ) × M + m 1 x 1 + m 2 x 2 + + m n x n
where f   ( x ) is the fitted response function of ΔSOCD to a single factor of x, n is the number of influencing factors, m is a constant.

3. Results

3.1. Difference in SOCD among Sub-Areas and Vegetation Types

The analysis showed an obvious difference in SOCD among sub-areas and vegetation types (Figure 2). The mean SOCD of plantations in the whole study area was 171.1 t·ha−1, which was lower than that of natural forests (229.4 t·ha1) and grasslands (185.2 t·ha−1), but much higher than that of cropland (56.2 t·ha−1).
The mean SOCD of plantations in the RM sub-area was 236.5 t·ha1, obviously higher than that in the RH sub-area (177.2 t·ha−1) and LH sub-area (76.2 t·ha−1). The mean SOCD of natural forests, grasslands, and croplands showed the same tendency of declining from RM, RH, to LH. The mean SOCD decreased from 281.8 in RM to 187.1 in RH and 162.0 t·ha−1 in LH for natural forests; and from 257.3 in RM to 173.3 in RH and 100.9 t·ha−1 in LH for grassland. The land use of cropland exists only in RH and LH sub-areas, with a mean SOCD of 73.7 and 45.7 t·ha−1, respectively (Figure 2).

3.2. The Temporal Variation of SOCD

Within the 40 years after forestation of NP, GP, and CP, a tendency of firstly decrease and then increase, or a direct increase, exists for SOCD variation with risingage (time after forestation) (Figure 3a–c). After 40 years of forestation, the average SOCD based on fitted lines is 293.2 t·ha−1 for NP, 266.48 t·ha−1 for GP, and 154.5 t·ha−1 for CP, respectively (Table 3), indicating a higher SOCD for the forestation mode NP than for GP and CP.
However, after excluding the effects of the different initial SOCDs of previous vegetation of each forestation mode at different sub-areas by using the averages of accumulated SOCD change (ΔSOCD) (Figure 3d–f), NP presented a more obvious nonlinear response curve, which showed an obvious decrease of SOCD after forestation for the next 12 years, and thereafter a recovering increase of SOCD up to 23 years, to reach its initial SOCD level, with a net SOCD increase of only 101.3 t·ha−1 at 40 years. On the contrary, the process of SOCD decrease after forestation was slight and negligible for GP and CP, thus only an increasing tendency existed with rising forest age, accumulating a net SOCD increase of 149.6 t·ha−1 and 90.07 t·ha−1 at 40 years according to the fitted line, respectively. Compared to CP, GP showed no significant decrease or increase of SOCD during the first 12 years after forestation.
In this study, the fitted curves of the upper- and bottom-boundary line (the dashed lines in Figure 3) were used to represent the high and low boundaries of the variation range of SOCD and ΔSOCD with forest age under the most advantageous and disadvantageous conditions for the three forestation modes in the study area.
The inflection points of the nearly constant upper-boundary line indicate the time required to reach a new stability of SOCD (ΔSOCD) after forestation under the most advantageous conditions of temperature, precipitation, and soil properties for SOC sequestration. The potential maximum SOCD after afforestation can reach 389.7, 307.5, and 201.2 t·ha−1 for NP, GP, and CP respectively, and the corresponding potential ΔSOCD can reach 207.9, 182.4, and 99.4 t·ha−1 compared with the initial SOCD under the previous vegetation. Since the logistic equation is infinitely close but not to the theoretical maximum, we define the forestation time at 95% of the potential maximum SOCD (or ΔSOCD) as the inflection point. This time should be 40 (44), 35 (39), and 25 (16) years for the forestation modes of NP, GP, and CP.
The inflection points of the lowest SOCD value of the bottom-boundary line indicate the time to reach the lowest net loss of SOCD (ΔSOCD) under the most disadvantageous conditions. Thereafter the SOCD begins to increase due to the offset of higher SOC input than SOC loss. According to the bottom-boundary line, an obvious net loss of SOCD can be seen for GP and NP, with the lowest values of SOCD (ΔSOCD) of 55.8 (−216.6) and 109.3 (−65.8) t·ha−1 at the ages of 17 (20) and 10 (15) years respectively. This showed more SOC loss after forestation, and a slower SOCD recovering process can be expected under higher initial SOCD and the most disadvantageous site conditions, especially for NP. The SOCD of CP reached its lowest value of 48.5 t·ha−1 at the age of 10 years, but the net loss was not obvious, only 5.44 t·ha−1 at the age of 10 years.

3.3. The Main Factors Influencing SOCD Changes

The factors that may influence the variation of ΔSOCD include the time after forestation (Time), biomass of trees (Bio), initial SOCD (SOCD0), MAT, MAP, and altitude (Alt). In order to further identify the main influencing factors, a correlation analysis was made for each forestation mode (Table 4).
It can be seen from Table 4 that four factors significantly correlate with ΔSOCD for the forestation mode of NP. The first important factor is SOCD0, with a negative effect and 43% explanation of the variation of ΔSOCD. The second important factor is Time, with a positive effect and 28% explanation. The third important factor is Alt, with a negative effect and 16% explanation. The last important factor is Bio, with a positive effect and 13% explanation. Using this information, the response models of △SOCD to main influencing factors for the forestation mode of NP (also the other modes of GP and CP below) were fitted (Table 5), and they can be used to predict the SOCD change under the influences of multiple factors. The great increase of R2 of the response functions (Equations (16) and (29) in Table 5) from 0.14 to 0.56 indicates that the addition of factors behind Time can significantly improve the model fitness.
For the forestation mode of GP, only two factors significantly correlate with ΔSOCD, while others show no significant correlation (Table 4). The first important factor is SOCD0, with a negative effect and 58% explanation of the variation of ΔSOCD. The second important factor is Time with a positive effect and 42% explanation. By comparing the R2 of the two models (Equations (22) and (30) in Table 5), we can see that the inclusion of SOCD0 can significantly improve the fitness of the model.
For the forestation mode of CP, four factors significantly correlate with ΔSOCD, while two factors show no significant correlation (Table 4). The first important factor is Time, with a positive effect and 40% explanation of the variation of ΔSOCD. The second important factor is MAP, with a positive effect and 30% explanation. The third important factor is SOCD0, with a positive effect and 28% explanation. The last important factor is MAT, with a negative effect and 2% explanation. The gradual increase of R2 of the response functions (Equations (28) and (31) in Table 5) from 0.26 to 0.51 indicates that the addition of these factors can significantly improve the model fitness.
To make the ΔSOCD responses to individual main influencing factors more readily understandable, the temporal variation of ΔSOCD with rising forest age (within 0–40 years) was simulated using the fitted models in Table 5 (Figure 4). During these simulations, three representative values were given for one factor, while the values of other factors were fixed at the average level. Since the tree biomass (Bio) is not an independent variable, but varies with many factors (e.g., forest age, tree density, and altitude), its effect on ΔSOCD was not simulated.
It can be seen from Figure 4a,d that the ΔSOCD for NP shows firstly a decrease with rising forest age until it reaches 20 years for all scenarios; thereafter it increases and recovers to the initial SOCD level at the forest age of 37 years. Higher SOCD0 and lower altitude can lead to more SOCD loss within the 0–37 years after forestation, but more SOCD increase after 37 years. This means that a service of net soil organic carbon sequestration can appear only after 37 years for the forestation mode of NP with high initial SOCD if it is reforested after clear-cutting of initial natural forests.
It can be seen from Figure 4b that the ΔSOCD for GP can have a slight decrease and then increase until it reaches 13 years, recovering to the initial SOCD level, probably due to the lower SOCD0. Thereafter, a nearly linear net increase of SOCD appears with rising forest age.
However, the variation of ΔSOCD for CP shows no SOCD loss within the whole period of the 40 years after forestation, due to the low initial SOCD in cropland. The ΔSOCD increases near linearly with rising forest age until it reaches 20 years, and then increases gradually with declining rate, and finally levels-off at the age of about 35 years. Better sites with higher SOCD0, MAP, and MAT will lead to higher net increases of SOCD. For example, the accumulation was significantly greater when SOCD0 was 150 t·ha−1 than that of 50 t·ha−1 (Figure 4c), and was higher when MAP was 600 mm than that of 400 mm (Figure 4e). But the differences in ∆SOCD between MATs were small (Figure 4f).

4. Discussion

4.1. The Difference in SOCD Due to Topographic Conditions

The SOCD in the sub-area of RM is much higher than that in other two sub-areas for all vegetation types investigated (Figure 2). This may be indirectly caused by the higher altitude of RM, which leads to higher precipitation, lower temperature, and evaporation (Table 6), and thus more available soil water for vegetation growth than in the sub-areas of RH and LH with lower altitude. Another study showed the same tendency of accumulating more organic carbon at higher altitudes in temperate areas [28]. The increasing single tree biomass with rising altitude in the range below 2400 m of the Liupan Mountains [13] is an indirect reason for explaining the increase of SOCD with rising altitude. But an opposite result was observed at the site where the vegetation growth has not been limited by water conditions [29]. Moreover, the lower-altitude-associated lower mean annual precipitation (MAP) and higher mean annual temperature (MAT) in RH and LH lead to more severe drought limit to vegetation growth and thus less SOC input at one side, and the higher mean annual temperature in RH and LH leads to higher SOCD loss due to accelerated SOC mineralization at another side, which primarily resulted from changes in soil microbial metabolic activity or microbial community composition [30]. Furthermore, the soil type of humic cambisols (FAO), developed from slope-washed parent material, in RM has higher contents of nutrients (Table 2) than that in RH and LH with loess soil, and this is also an important cause to the higher SOCD in RM than in RH and LH.
However, Table 4 showed that both the mean annual precipitation and mean annual temperature are not significantly correlated with ΔSOCD for all forestation modes, and the altitude (Alt) is significantly correlated with ΔSOCD only for the forestation mode of NP. This could be explained firstly by the nonlinear relationships between ΔSOCD and influencing factors, and secondly by the counteracting effects of mean annual precipitation and mean annual temperature on the SOCD input mainly from vegetation litter fall and on the SOCD output mainly through SOC mineralization. If the two counteracting effects can be separated in future studies, the influence mechanism of individual factors, especially the environmental factors (MAP, MAT, Alt, and other topography parameters), can be better understood and quantified in this area.

4.2. The Effects of Individual Factors on SOCD Change after Forestation

4.2.1. Initial SOCD

This study showed that the initial SOCD (SOCD0) is one of the important factors influencing the ΔSOCD after forestation. However, the importance and effect of SOCD0 are different among forestation modes, negatively and highly significant for GP and NP with a contribution of 43% and 58% respectively, but positively and highly significant for CP with a contribution of 28%. A study carried out in northern China highlighted that the SOCD increases more after forestation when SOCD0 is poor, and decreases more when SOCD0 is rich [35]. The underlying mechanism is that a higher SOCD0 can accelerate the SOCD loss due to SOC mineralization, leading to an obvious negative ΔSOCD at the earlier years after forestation [36,37] due to the disturbances to forest canopy, humus coverage, and soil structure. Besides, artificial disturbance of the soil during afforestation will increase the soil temperature, enhancing microbial activity and accelerating the mineralization of soil organic matter [38]. In this study, no essential SOCD loss was obtained after forestation for the forestation mode of CP (Figure 3f), largely due to the low SOCD0 with an average of 52.4 t·ha−1; while a net loss of SOCD (up to 17.1 t·ha−1 at 6 years after forestation) was observed for GP (Figure 3e) with a mean SOCD0 of 167.4 t·ha−1, and a significant net loss of SOCD (up to 82.8 t·ha−1 at 13 years) for NP (Figure 4d) with a mean SOCD0 of 254.7 t·ha−1. This confirms that higher SOCD0 can accelerate the SOCD loss after forestation and thus lower the net SOC accumulation and delay the new equilibrium between SOC input and SOC output (Figure 3). In this study, the CP appeared only in the sub-areas of LH and RH covered by loess soils with lower SOCD0 (Table 2, Figure 2), thus the SOCD change after forestation is dominated by the process of new SOC accumulation from the litter fall input, and is less affected by the loss of previously stored old SOC through mineralization. However, some other studies on the Loess Plateau showed a very limited effect of SOCD0 on SOCD change after forestation [14,39]. The much smaller variation range of SOCD0 for CP than GP and NP (Table 4) may be also a reason for the less significant correlation between SOCD0 and ΔSOCD for CP. Furthermore, the difference in the difficult degree of SOC mineralization among previous vegetation types and sub-areas may be also an important factor influencing SOC mineralization and thus the SOCD change. For example, the study on the Loess Plateau of China showed that the reactive organic matter was the main explanatory factor for the changes in soil organic matter mineralization characteristics [40]. However, this was not researched in this study and needs to be explored in future.

4.2.2. Organic Matter/Carbon Input

The variation of SOCD is a balanced result of SOC input mainly from vegetation litter fall and SOC output mainly by SOC mineralization [41]. The tree biomass can account for more than 80% of the total biomass in forest ecosystems [42], and is in proportion to the litter fall input to forest soils. Therefore, the tree biomass was used as a proxy of the litter fall and corresponding SOC input in this study, to explore the synergistic effect of SOC input on the SOCD change after forestation.
Table 4 showed that the tree biomass is positively correlated with ΔSOCD for all forestation modes, but significant only for NP with a low contribution of 13% to the total SOCD change. This positive correlation can be explained by the fact that the SOC input to soils comes mainly from the litter fall of trees. The difference in correlation coefficients among forestation modes can be explained by the differences in climatic conditions and SOCD variation range. The majority of the plots of NP were located in the RM sub-area with lower MAT and higher soil moisture compared to the plots in the sub-areas of RH and LH, and this led to a promotion to the biomass growth and new SOC accumulation in the early period after forestation when SOCD change was dominated by the mineralization of old SOC, and led to a much bigger variation range of SOCD for NP than that for CP and GP. The low contribution of tree biomass to SOCD can be explained by the counteracting effects of old SOC mineralization and new SOC accumulation.
It can be seen from this study that both the SOCD input and SOCD loss are jointly influenced by the climate, soil, and terrain factors, especially by the SOCD0. The forest biomass has just a low and indirect effect on SOCD change and this effect varies with forestation modes, tree ages, and environment conditions. The usual method of using only tree biomass to estimate the SOCD and its change within any growth stages in existing studies is not fully and always reliable [43]. All the influencing factors and their influencing mechanisms should be considered for accurate estimation of SOCD.

4.2.3. Climatic Factors

The climatic factors, mainly precipitation and air temperature, are important driving forces for the counteracting processes of SOCD input (depending on vegetation growth) and SOCD output (caused by SOC mineralization).
In temperate regions, higher MAT usually leads to higher SOCD increase [9] due to the promotion to net primary productivity (NPP) and corresponding SOC input when it exceeds the promotion to SOC mineralization if the soil moisture is high enough [44,45]; but higher MAT can also lead to higher SOCD loss if the promotion to SOC mineralization exceeds the promotion to SOC input. This can explain why the correlation between MAT and ΔSOCD is not significant for all forestation modes, and negative for CP but positive for GP and NP in the study area.
Like the effect of MAT, the effect of MAP on ΔSOCD is also an integrated result of its counteracting influences on the SOC input through vegetation growth promotion and the SOC output through SOC mineralization promotion. Therefore, the correlation between MAP and ΔSOCD is low and not significant for all forestation modes, not significant and negative for GP, but positive for CP and NP and only significant for CP with the severe drought limit due to the lowest MAP. Some studies on the Loess Plateau with clear spatial gradients of MAT and MAP [3,14] showed that the effects of climatic factors on SOC change at small spatial scales is more reflected by the vegetation distribution along altitude, rather than a direct effect on SOC dynamics.

4.2.4. Altitude

The SOCD on the Loess Plateau presents both lateral and vertical variation, largely because of the spatial distribution of climatic factors and corresponding vegetation growth. At the large scale of the Loess Plateau region, the SOCD decreases from southeast to northwest, mainly due to the lowering MAP. However, at the mesoscale of the Liupan Mountains areas with sharp terrain variation, topography (especially altitude) is a key factor influencing SOCD due to the topography-dependent climate factors [46,47], vegetation growth, and soil properties [4,48]. The growth of all vegetation types showed a clear spatial gradient, such as the increase of biomass (Table 4) and SOCD0 (Table 2) with rising altitude. Other studies in China also showed a SOCD dependence on the altitude [49,50].
In this study, the correlation between altitude and ΔSOCD was not significant for CP and GP, probably due to counteracting and indirect effects on SOCD and the small variation range of altitude of these two forestation modes. However, the correlation was significant and negative for NP, probably due to the dominant and indirect effect of increased SOCD loss through SOC mineralization caused by the elevated SOCD0 with rising altitude.
Besides altitude, other topography parameters (e.g., slope aspect, slope gradient, slope position, soil thickness, etc.) may be also important factors influencing SOCD change after forestation, although they exert indirect effects on soil moisture, vegetation growth, and SOC dynamics. The effects of all possibly important topography parameters should be studied and quantified in future to get a fuller understanding.

4.3. Temporal Variation Patterns of SOCD after Forestation

When looking at the regression lines of the variation of absolute SOCD and the SOCD change with rising time after forestation in Figure 3, the forestation modes of NP and GP showed firstly an obvious decrease and slight decrease of SOCD respectively, and then an increase; while CP showed a continuous increase of SOCD over the entire 40 years after forestation. The main cause of the difference in temporal variation pattern of SOCD among forestation modes could be the big difference in SOCD0 under the initial vegetation before forestation. The mean SOCD0 was 254.7, 167.4, and 52.4 t·ha−1 for NP, GP, and CP, respectively. The higher SOCD0 of NP and GP led to an obvious and slight decrease of SOCD due to SOC mineralization in the early years after forestation, while the low SOCD0 of CP led to no visible SOCD decrease due to SOC mineralization.
The upper-boundary line of ΔSOCD in Figure 3 can better show its temporal variation with time after forestation at the best sites for SOC accumulation, because the disturbances of other factors (including SOC mineralization) are minimized. The upper-boundary line of ΔSOCD for NP and GP showed firstly a stable period (about 0–10 years) after forestation, probably due to the balance of SOC input and output, then a quick increase period (10–44 and 10–39 years) and thereafter a leveling-off period because SOCD is approaching its potential capacity (the maximum at given site conditions). As for CP, it showed firstly nearly zero increase within 0–5 years, probably due to low growth of young trees and associated low litter fall, then a quick increase within the period of 6–16 years after forestation, and thereafter it gradually levelled off because it was approaching its potential capacity. This means that CP could be the first to reach a new equilibrium of SOCD after forestation, because of the lowest SOCD capacity and the lowest SOCD loss due to the lowest SOCD0; while GP and NP could be the second and third to reach a new equilibrium, because of their higher SOCD capacity and higher SOCD0.
Various patterns of SOCD change after forestation were reported (Table 6), such as: sustained decrease [13], first a decrease and then an increase [11,31], first a slow increase and then a rapid increase [32], first an increase and then a levelling off [14], first a decrease and then an increase and finally a levelling off [39]. All these change patterns can be well-explained by the SOCD variation processes, the effects of different SOCD capacity and SOCD0, and the observation years (growth stage) after forestation, and all these are dependent on the site quality and forest growth. The observed SOCD change after forestation is an integrated result of the counteracting processes of SOCD loss mainly due to SOC mineralization, and SOCD input mainly from litter fall of vegetation. The SOC mineralization can be accelerated by the increased temperature caused by tree cutting, forest canopy opening, and disturbances to humus layers and soil structure. Thus, the SOC mineralization is high and dominant in the initial and early periods after forestation, until the plantation canopy is fully closed [51], especially in the case of high initial SOCD.
The sustained decrease pattern of SOCD change can be caused by the dominant SOCD loss due to high SOCD0 in the early period after forestation, and due to the short observation time exactly within the SOCD loss dominant period [13], such as the period of 0–12 years showed by the regression line of SOCD change for NP (Figure 3e). The length of the SOCD-loss-dominant period varies according to environment and forest growth conditions [11]. The sustained-increase pattern of SOCD change, such as that reported in literature [52,53] and observed in CP of this study (Figure 3f), can be well-explained by the dominant SOCD input because of the negligible SOCD loss, due to either the low SOCD0 or the observed later period after forestation with weak SOC mineralization of initial SOC. The reason for the low restriction to SOC mineralization by the low SOC content is that the microbial activity is usually limited by the low C availability [14,53]. Because the SOCD input largely comes from the litter fall from above-ground vegetation and roots, which have a decreasing biomass with rising soil depth, the net SOC increase is high at the topsoil layer, and decreases with rising soil depth [32,54]. The pattern of SOCD change of first a decrease and then an increase can be well-explained by the inclusion of both the SOCD-loss-dominant period and the SOCD-input-dominant period [31,55], as observed for NP in this study (Figure 3d). The SOC input from vegetation litter fall increases gradually with the biomass growth of new plantation [56,57], so that the SOCD input is dominant usually in the later stages of forest development, and the relatively lower SOCD input compared with the SOCD loss in the early period will lead to a net SOCD decrease. The significant reduction of soil erosion and associated SOC loss due to the soil protection by ground vegetation and humus coverage of forests play an important role, too [23]. The levelling-off of SOCD change can be well-explained by the new equilibrium between the SOCD loss and SOCD input at certain forest ages. The occurrence time and level of this equilibrium vary with local conditions of climate, topography, soil, and vegetation [37]. Therefore, the SOCD increase will gradually level off if the forest age is sufficient.

4.4. Implications for the Assessment and Management of SOCD of Plantations

Afforestation is considered as an effective approach to increase terrestrial carbon storage for mitigating climate change [58], but most large-scale estimates of afforestation potential and/or contribution to carbon sequestration are often overly optimistic due to little consideration of the site-specific limit of carbon sequestration potential, which is jointly determined by the initial SOCD (SOCD0) before forestation and the SOCD capacity, and due to little consideration of the possible negative impacts of disturbances during afforestation and forest management [59]. In fact, the SOCD loss in the early stages of plantation development will lead to a lower actual carbon sequestration (as shown in Figure 3a) than expected, and the saturation of carbon stock in the later stages (as shown in Figure 3c) will lead to a stop of further increase of carbon sequestration. This study showed a big difference in SOCD0 due to the differences in initial vegetation cover and site quality (as shown in Table 1). At fertile sites, mainly due to higher precipitation and thicker soil in dryland regions, the well-growing initial vegetation cover of natural forests and grasses can produce a higher SOCD0 than that of cropland and poor sites, mainly due to dry climate and poor soil (Table 1). The afforestation accompanied destruction of well-growing initial vegetation cover can lead to a large loss of previously stored SOCD within a certain period until it reaches a new equilibrium between the SOCD loss and input is reached [60]. In cases of high SOCD0, the afforestation contribution to carbon sequestration cannot be high, but even negative, as shown by some plot data in Figure 3a. The forestry task is to keep the high initial carbon stock through proper measures, such as maintaining a high canopy/vegetation cover by underplanting, instead of planting trees after clear-cutting of initial forests, and possibly less soil disturbances. In cases of low SOCD capacity due to poor site quality, the soil carbon sequestration potential of new plantations is low and limited (as shown in Figure 3c) compared to the overly optimistic expectation in medium to long term (>50 years). Only in the cases of sites with low SOCD0 but high SOCD capacity, does high potential for carbon sequestration exist, which can be realized by proper afforestation and forest management measures. Thus, a prioritized work is the site-specific survey and assessment of soil carbon sequestration potential, especially in the climate change-sensitive dryland regions and geomorphologic complex areas, to identify the most suitable sites for afforestation, from the viewpoint of soil carbon sequestration. Meanwhile, proper measures to reserve previously stored SOCD should be searched and promoted. The quick and complete change from natural forests (even degraded secondary forests) to plantation, e.g., the slash-and-burn afforestation, should be avoided and replaced by fine-scale progressive afforestation.
As the study sites were limited within the Liupan Mountains and surrounding areas, the fitted models in this study cannot be directly used in a wide climatic range with ensured high accuracy, but can be used as a reference for future studies in wide areas. In this study, only the SOCD with 1 m soil layer was investigated. However, more SOCD exists in deep soil layers in the loess area with very thick soil and deep plant roots searching deep soil water [61]. Moreover, a big inorganic carbon pool often exists in the alkaline soils of dryland regions [62,63], its interaction with the variation of SOC content may strongly affect the total carbon sequestration. In addition, as one important agent of the soil organic matter origination and regime, the soil processing prior to forestation was not considered in this field-inventory-based study because of the lack of process data. Thus, more complete and more accurate studies on soil carbon pools and sequestration effects are required in future. Furthermore, it must be pointed out that the carbon sequestration is just one of the services supplied by forests, and its trade-offs with other multiple ecosystem services of forests (e.g., timber production, water regulation, biodiversity protection, recreation, etc.) and other land use types must be considered in afforestation and forest management decisions [64].

5. Conclusions

This study on the variation patterns of SOCD of plantations originated from different forestation modes in the semi-humid/arid area of northwestern China showed:
(1)
Wide variation of SOCD. The mean SOCD of main vegetation types follows the order of natural forests > grassland > plantation > cropland, and decreases from the sub-areas of RM, to RH, to LH with lowering altitudes and annual precipitation.
(2)
The important role of initial SOCD. The variation of SOCD is strongly affected by the counteracting processes of SOCD loss, mainly due to SOC mineralization and the SOCD input mainly from the litter fall of vegetation, besides the effects of pre-forestation soil processing. Higher initial SOCD can lead to a more obvious SOCD loss in the early periods after forestation and a delayed and lowered net SOCD increase after forestation. In average, the forestation mode from cropland to plantation presents a sustain increase of SOCD within 0–40 years after forestation because of the negligible SOCD loss due to low initial SOCD, while the forestation modes from grassland or natural forests to plantation presents firstly a slight or obvious decrease and then an increase of SOCD within 0−40 years because of the less significant or significant SOCD loss due to the relatively high or high initial SOCD.
(3)
Many factors to be considered. The site-quality-dependent tree growth, the SOCD response pattern, and the net SOCD increase after forestation are also greatly affected by the initial vegetation and site-specific initial SOCD, SOCD capacity, and their differences. All these points should be considered for a precise assessment and management of the SOCD of plantations.

Author Contributions

The first author Z.Z. conducted the data collection and analysis as well as the manuscript draft. J.G. and Y.W. provided the ideas and methodology; Y.W., P.Y. and X.W. mainly guided and revised the manuscript. All authors have read and agreed to the published version of the manuscript.

Funding

This work was funded by the Central Public-Interest Scientific Institution Basal Research Fund of Chinese Academy of Forestry (CAFYBB2021ZW002, CAFYBB2020QB004), the National Natural Science Foundation of China (U20A2085, 41971038), the long-term forest ecological station of Liupan Mountains of the National Forestry and Grassland Administration of China (NFGAC), and the NFGAC Key Laboratory for Forest Ecology and Environment.

Institutional Review Board Statement

Not applicable.

Informed Consent Statement

Not applicable.

Data Availability Statement

The data presented in this study are available from corresponding authors upon reasonable request.

Conflicts of Interest

The authors declare no conflict of interest.

Abbreviations

The following abbreviations are used in this manuscript:
SOCSoil organic carbon
SOCDSoil organic carbon density
ΔSOCDSoil organic carbon density change
MATMean annual air temperature
MAPMean annual precipitation
RMRocky mountainous sub-area
RHRocky hilly sub-area
LHLoess hilly sub-area
NPNatural-forests-to-plantation
GPGrassland-to-plantation
CPCropland-to-plantation
BioBiomass of trees
SOCD0Initial soil organic carbon density

References

  1. Tang, X.; Zhao, X.; Bai, Y.; Tang, Z.; Wang, W.; Zhao, Y.; Wan, H.; Xie, Z.; Shi, X.; Wu, B.; et al. Carbon Pools in China’s Terrestrial Ecosystems: New Estimates Based on an Intensive Field Survey. Proc. Natl. Acad. Sci. USA 2018, 115, 4021–4026. [Google Scholar] [CrossRef] [PubMed] [Green Version]
  2. Chen, C.; Park, T.; Wang, X.; Piao, S.; Xu, B.; Chaturvedi, R.K.; Fuchs, R.; Brovkin, V.; Ciais, P.; Fensholt, R.; et al. China and India Lead in Greening of the World through Land-Use Management. Nat. Sustain. 2019, 2, 122–129. [Google Scholar] [CrossRef] [PubMed]
  3. Liu, Z.; Shao, M.; Wang, Y. Effect of Environmental Factors on Regional Soil Organic Carbon Stocks across the Loess Plateau Region, China. Agric. Ecosyst. Environ. 2011, 142, 184–194. [Google Scholar] [CrossRef]
  4. Wang, J.; Fu, B.; Qiu, Y.; Chen, L. Analysis on Soil Nutrient Characteristics for Sustainable Land Use in Danangou Catchment of the Loess Plateau, China. Catena 2003, 54, 17–29. [Google Scholar] [CrossRef]
  5. Zhou, G.; Liu, S.; Li, Z.; Zhang, D.; Tang, X.; Zhou, C.; Yan, J.; Mo, J. Old-Growth Forests Can Accumulate Carbon in Soils. Science 2006, 314, 1417. [Google Scholar] [CrossRef] [Green Version]
  6. Wang, S.; Huang, Y. Determinants of Soil Organic Carbon Sequestration and Its Contribution to Ecosystem Carbon Sinks of Planted Forests. Glob. Change Biol. 2020, 26, 3163–3173. [Google Scholar] [CrossRef]
  7. Detwiler, R.P. Land Use Change and the Global Carbon Cycle: The Role of Tropical Soils. Biogeochemistry 1986, 2, 67–93. [Google Scholar] [CrossRef]
  8. Don, A.; Schumacher, J.; Freibauer, A. Impact of Tropical Land-Use Change on Soil Organic Carbon Stocks—A Meta-Analysis. Glob. Change Biol. 2011, 17, 1658–1670. [Google Scholar] [CrossRef] [Green Version]
  9. Poeplau, C.; Don, A.; Vesterdal, L.; Leifeld, J.; Van Wesemael, B.; Schumacher, J.; Gensior, A. Temporal Dynamics of Soil Organic Carbon after Land-Use Change in the Temperate Zone—Carbon Response Functions as a Model Approach. Glob. Change Biol. 2011, 17, 2415–2427. [Google Scholar] [CrossRef]
  10. Friggens, N.L.; Hester, A.J.; Mitchell, R.J.; Parker, T.C.; Subke, J.; Wookey, P.A. Tree Planting in Organic Soils Does Not Result in Net Carbon Sequestration on Decadal Timescales. Glob. Change Biol. 2020, 26, 5178–5188. [Google Scholar] [CrossRef]
  11. Wang, K.; Deng, L.; Ren, Z.; Shi, W.; Chen, Y.; Shang-Guan, Z. Dynamics of Ecosystem Carbon Stocks during Vegetation Restoration on the Loess Plateau of China. J. Arid Land 2016, 8, 207–220. [Google Scholar] [CrossRef] [Green Version]
  12. Cao, Z.; Fang, X.; Xiang, W.; Lei, P.; Peng, C. The Vertical Differences in the Change Rates and Controlling Factors of Soil Organic Carbon and Total Nitrogen along Vegetation Restoration in a Subtropical Area of China. Sustainability 2020, 12, 6443. [Google Scholar] [CrossRef]
  13. Kirschbaum, M.U.F.; Guo, L.; Gifford, R.M. Observed and Modelled Soil Carbon and Nitrogen Changes after Planting a Pinus Radiata Stand onto Former Pasture. Soil Biol. Biochem. 2008, 40, 247–257. [Google Scholar] [CrossRef]
  14. Wang, H.; Yue, C.; Mao, Q.; Zhao, J.; Ciais, P.; Li, W.; Yu, Q.; Mu, X. Vegetation and Species Impacts on Soil Organic Carbon Sequestration Following Ecological Restoration over the Loess Plateau, China. Geoderma 2020, 371, 114389. [Google Scholar] [CrossRef]
  15. Li, W.; Ciais, P.; Guenet, B.; Peng, S.; Chang, J.; Chaplot, V.; Khudyaev, S.; Peregon, A.; Piao, S.; Wang, Y.; et al. Temporal Response of Soil Organic Carbon after Grassland-Related Land-Use Change. Glob. Change Biol. 2018, 24, 4731–4746. [Google Scholar] [CrossRef] [PubMed]
  16. Tian, A.; Wang, Y.; Webb, A.A.; Liu, Z.; Ma, J.; Yu, P.; Wang, X. Water Yield Variation with Elevation, Tree Age and Density of Larch Plantation in the Liupan Mountains of the Loess Plateau and Its Forest Management Implications. Sci. Total. Environ. 2021, 752, 141752. [Google Scholar] [CrossRef] [PubMed]
  17. Wang, H.B. Status and Countermeasures of Forest Resources Construction in Yuanzhou District of Guyuan City. Mod. Agric. Sci. Technol. 2018, 8, 165–166, (In Chinese with English abstract). Available online: http://en.cnki.com.cn/Article_en/CJFDTotal-ANHE201808106.htm (accessed on 18 October 2021).
  18. Pi, H.Y.; Zhang, M.X.; Xia, J.X. Changes in Land Use and Soil Erosion in the Loess Plateau Driven by the Grain for Green Program: A Case Study of Jingyuan Ningxia. J. Basic Sci. Eng. 2020, 28, 522–534, (In Chinese with English abstract). [Google Scholar] [CrossRef]
  19. Huaizhu, L. On the Current Situation and Development Plan of Mixed Needle-Broad Water Containment Forest Project Construction in Liupan Mountain Area of Ningxia. Ningxia J. Agric. For. Sci. Technol. 1999, 3, 23–25. (In Chinese). Available online: http://www.cnki.com.cn/Article/CJFDTOTAL-NXNL903.006.htm (accessed on 18 October 2021).
  20. Wang, F.; Pan, X.; Gerlein-Safdi, C.; Cao, X.; Wang, S.; Gu, L.; Wang, D.; Lu, Q. Vegetation Restoration in Northern China: A Contrasted Picture. Land Degrad. Dev. 2020, 31, 669–676. [Google Scholar] [CrossRef]
  21. Scheu, S.; Wolters, V. Influence of fragmentation and bioturbation on the decomposition of C-14-labeled beech leaf litter. Soil Biol. Biochem. 1991, 23, 1029–1034. [Google Scholar] [CrossRef]
  22. Rethemeyer, J.; Kramer, C.; Gleixner, G.; John, B.; Yamashita, T.; Flessa, H.; Andersen, N.; Nadeau, M.-J.; Grootes, P.M. Transformation of Organic Matter in Agricultural Soils: Radiocarbon Concentration versus Soil Depth. Geoderma 2005, 128, 94–105. [Google Scholar] [CrossRef]
  23. Guo, L.B.; Gifford, R.M. Soil Carbon Stocks and Land Use Change: A Meta Analysis. Glob. Change Biol. 2002, 8, 345–360. [Google Scholar] [CrossRef]
  24. Chang, R.; Fu, B.; Liu, G.; Wang, S.; Yao, X. The Effects of Afforestation on Soil Organic and Inorganic Carbon: A Case Study of the Loess Plateau of China. Catena 2012, 95, 145–152. [Google Scholar] [CrossRef]
  25. Lal, R.; Kimble, J.M. Importance of soil bulk density and methods of its importance. In Assessment Methods for Soil Carbon; Lal, R., Kimble, J.M., Follell, R.F., Stewart, B.A., Eds.; Taylor & Francis: London, UK, 2000; pp. 31–44. [Google Scholar]
  26. Henderson, D.; Ellert, B.; Naeth, M.A. Grazing and soil carbon along a gradient of Alberta rangeland. J. Range Manage. 2004, 57, 402–410. [Google Scholar] [CrossRef]
  27. Piñeiro, G.; Paruelo, J.M.; Jobbágy, E.G.; Jackson, R.B.; Oesterheld, M. Grazing Effects on Belowground C and N Stocks along a Network of Cattle Exclosures in Temperate and Subtropical Grasslands of South America. Glob. Biogeochem. Cycles 2009, 23, GB2003. [Google Scholar] [CrossRef] [Green Version]
  28. Sumfleth, K.; Duttmann, D. Prediction of soil property distribution in paddy soil landscapes using terrain data and satellite information as indicators. Ecol. Indic. 2008, 8, 485–501. [Google Scholar] [CrossRef]
  29. Zhang, W.; Wang, K.; Chen, H.; He, X.; Zhang, J. Ancillary Information Improves Kriging on Soil Organic Carbon Data for a Typical Karst Peak Cluster Depression Landscape. J. Sci. Food Agric. 2012, 92, 1094–1102. [Google Scholar] [CrossRef]
  30. Hartley, I.P.; Ineson, P. Substrate quality and the temperature sensitivity of soil organic matter decomposition. Soil Biol. Biochem. 2008, 40, 1567–1574. [Google Scholar] [CrossRef] [Green Version]
  31. Lu, N.; Liski, J.; Chang, R.Y.; Akujärvi, A.; Wu, X.; Jin, T.T.; Wang, Y.F.; Fu, B.J. Soil Organic Carbon Dynamics of Black Locust Plantations in the Middle Loess Plateau Area of China. Biogeosciences 2013, 10, 7053–7063. [Google Scholar] [CrossRef] [Green Version]
  32. Wang, Z.; Liu, G.-B.; Xu, M.-X.; Zhang, J.; Wang, Y.; Tang, L. Temporal and Spatial Variations in Soil Organic Carbon Sequestration Following Revegetation in the Hilly Loess Plateau, China. Catena 2012, 99, 26–33. [Google Scholar] [CrossRef]
  33. Dou, X.; Deng, Q.; Li, M.; Wang, W.; Zhang, Q.; Cheng, X. Reforestation of Pinus Massoniana Alters Soil Organic Carbon and Nitrogen Dynamics in Eroded Soil in South China. Ecol. Eng. 2013, 52, 154–160. [Google Scholar] [CrossRef]
  34. Deng, L.; Liu, G.; Shangguan, Z. Land-Use Conversion and Changing Soil Carbon Stocks in China’s ‘Grain-for-Green’ Program: A Synthesis. Glob. Change Biol. 2014, 20, 3544–3556. [Google Scholar] [CrossRef] [PubMed]
  35. Hong, S.; Yin, G.; Piao, S.; Dybzinski, R.; Cong, N.; Li, X.; Wang, K.; Peñuelas, J.; Zeng, H.; Chen, A. Divergent Responses of Soil Organic Carbon to Afforestation. Nat. Sustain. 2020, 3, 694–700. [Google Scholar] [CrossRef]
  36. Don, A.; Rebmann, C.; Kolle, O.; Scherer-Lorenzen, M.; Schulze, E.-D. Impact of Afforestation-Associated Management Changes on the Carbon Balance of Grassland. Glob. Change Biol. 2009, 15, 1990–2002. [Google Scholar] [CrossRef]
  37. Laganière, J.; Angers, D.A.; Paré, D. Carbon Accumulation in Agricultural Soils after Afforestation: A Meta-Analysis. Glob. Change Biol. 2010, 16, 439–453. [Google Scholar] [CrossRef]
  38. Song, Y.; Zhai, J.; Zhang, J.; Qiao, L.; Wang, G.; Ma, L.; Xue, S. Forest Management Practices of Pinus Tabulaeformis Plantations Alter Soil Organic Carbon Stability by Adjusting Microbial Characteristics on the Loess Plateau of China. Sci. Total. Environ. 2021, 766, 144209. [Google Scholar] [CrossRef]
  39. Deng, L.; Shangguan, Z.; Sweeney, S. “Grain for Green” Driven Land Use Change and Carbon Sequestration on the Loess Plateau, China. Sci. Rep. 2015, 4, 7039. [Google Scholar] [CrossRef]
  40. Xiao, H.B.; Li, Z.W.; Chang, X.F.; Huang, B.; Nie, X.D.; Liu, C.; Liu, L.; Wang, D.Y.; Jiang, J.Y. The mineralization and sequestration of organic carbon in relation to agricultural soil erosion. Geoderma 2018, 329, 73–81. [Google Scholar] [CrossRef]
  41. Davidson, E.A.; Janssens, I.A. Temperature sensitivity of soil carbon decomposition and feedbacks to climate change. Nature 2006, 440, 165–173. [Google Scholar] [CrossRef]
  42. Oren, R.; Ellsworth, D.S.; Johnsen, K.H.; Phillips, N.; Ewers, B.E.; Maier, C.; Schäfer, K.V.R.; McCarthy, H.; Hendrey, G.; McNulty, S.G.; et al. Soil Fertility Limits Carbon Sequestration by Forest Ecosystems in a CO2-Enriched Atmosphere. Nature 2001, 411, 469–472. [Google Scholar] [CrossRef] [PubMed]
  43. Huang, M.; Hou, J.; Tang, X.L.; Hao, M. Response of vegetation and soil carbon accumulation rate for China’s mature forest on climate change. Chin. J. Plant. Ecol. 2016, 40, 416–424, (In Chinese with English abstract). [Google Scholar] [CrossRef] [Green Version]
  44. Post, W.M.; Kwon, K.C. Soil carbon sequestration and landuse change: Processes and potential. Glob. Change Biol. 2010, 6, 317–327. [Google Scholar] [CrossRef] [Green Version]
  45. Thornley, J. Temperate Grassland Responses to Climate Change: An Analysis Using the Hurley Pasture Model. Ann. Bot. 1997, 80, 205–221. [Google Scholar] [CrossRef] [Green Version]
  46. Trumbore, S.E.; Chadwick, O.A.; Amundson, R. Rapid exchange between soil carbon and atmospheric carbon dioxide driven by temperature change. Science 1996, 272, 393–396. [Google Scholar] [CrossRef] [Green Version]
  47. Garten, C.T.; Post, W.M.; Hanson, P.J.; Cooper, L.W. Forest soil carbon inventories and dynamics along an elevation gradient in the southern Appalachian Mountains. Biogeochemistry 1999, 45, 115–162. [Google Scholar] [CrossRef]
  48. Lal, R.; Follett, R.F.; Stewart, B.A.; Kimble, J.M. Soil Carbon Sequestration to Mitigate Climate Change and Advance Food Security. Soil Sci. 2007, 172, 943–956. [Google Scholar] [CrossRef]
  49. Tan, Z.X.; Lal, R.; Semeck, N.E.; Calhoun, F.G. Relationships between surface soil organic carbon pool and site variables. Geoderma 2004, 121, 187–195. [Google Scholar] [CrossRef]
  50. Dai, W.; Huang, Y. Relation of soil organic matter concentration to climate and altitude in zonal soils of China. Catena 2006, 65, 87–94. [Google Scholar] [CrossRef]
  51. Martínez-Mena, M.; Rogel, J.A.; Castillo, V.; Albaladejo, J. Organic Carbon and Nitrogen Losses Influenced by Vegetation Removal in a Semiarid Mediterranean Soil. Biogeochemistry 2002, 61, 309–321. [Google Scholar] [CrossRef]
  52. Deng, L.; Wang, K.-B.; Chen, M.-L.; Shangguan, Z.-P.; Sweeney, S. Soil Organic Carbon Storage Capacity Positively Related to Forest Succession on the Loess Plateau, China. Catena 2013, 110, 1–7. [Google Scholar] [CrossRef]
  53. Kuzyakov, Y.; Friedel, J.K.; Stahr, K. Review of Mechanisms and Quantification of Priming Effects. Soil Biol. Biochem. 2000, 32, 1485–1498. [Google Scholar] [CrossRef]
  54. Kuzyakov, Y. Priming Effects: Interactions between Living and Dead Organic Matter. Soil Biol. Biochem. 2010, 42, 1363–1371. [Google Scholar] [CrossRef]
  55. Ritter, E. Carbon, Nitrogen and Phosphorus in Volcanic Soils Following Afforestation with Native Birch (Betula Pubescens) and Introduced Larch (Larix Sibirica) in Iceland. Plant. Soil 2007, 295, 239–251. [Google Scholar] [CrossRef]
  56. Thuille, A.; Schulze, E.-D. Carbon Dynamics in Successional and Afforested Spruce Stands in Thuringia and the Alps. Glob. Change Biol. 2006, 12, 325–342. [Google Scholar] [CrossRef]
  57. Zhu, J.; Hu, H.; Tao, S.; Chi, X.; Li, P.; Jiang, L.; Ji, C.; Zhu, J.; Tang, Z.; Pan, Y.; et al. Carbon Stocks and Changes of Dead Organic Matter in China’s Forests. Nat. Commun. 2017, 8, 151. [Google Scholar] [CrossRef] [PubMed]
  58. IPCC. Land Use, Land-Use Change, and Forestry; Cambridge University Press: Cambridge, UK, 2000. [Google Scholar]
  59. Bastin, J.-F.; Finegold, Y.; Garcia, C.; Mollicone, D.; Rezende, M.; Routh, D.; Zohner, C.M.; Crowther, T.W. The Global Tree Restoration Potential. Science 2019, 365, 76–79. [Google Scholar] [CrossRef] [PubMed]
  60. Bedison, J.E.; Scatena, F.N.; Mead, J.V. Influences on the Spatial Pattern of Soil Carbon and Nitrogen in Forested and Non-Forested Riparian Zones in the Atlantic Coastal Plain of the Delaware River Basin. For. Ecol. Manage. 2013, 302, 200–209. [Google Scholar] [CrossRef]
  61. Song, B.-L.; Yan, M.-J.; Hou, H.; Guan, J.-H.; Shi, W.-Y.; Li, G.-Q.; Du, S. Distribution of Soil Carbon and Nitrogen in Two Typical Forests in the Semiarid Region of the Loess Plateau, China. Catena 2016, 143, 159–166. [Google Scholar] [CrossRef]
  62. Jin, Z.; Dong, Y.; Wang, Y.; Wei, X.; Wang, Y.; Cui, B.; Zhou, W. Natural Vegetation Restoration Is More Beneficial to Soil Surface Organic and Inorganic Carbon Sequestration than Tree Plantation on the Loess Plateau of China. Sci. Total. Environ. 2014, 485–486, 615–623. [Google Scholar] [CrossRef] [Green Version]
  63. Liu, W.; Wei, J.; Cheng, J.; Li, W. Profile Distribution of Soil Inorganic Carbon along a Chronosequence of Grassland Restoration on a 22-Year Scale in the Chinese Loess Plateau. Catena 2014, 121, 321–329. [Google Scholar] [CrossRef]
  64. Wang, Y.; Xiong, W.; Gampe, S.; Coles, N.A.; Yu, P.; Xu, L.; Zuo, H.; Wang, Y. A Water Yield-Oriented Practical Approach for Multifunctional Forest Management and Its Application in Dryland Regions of China. J. Am. Water Resour Assoc. 2015, 51, 689–703. [Google Scholar] [CrossRef]
Figure 1. The geographical location of study areas and sample plots with different forests/vegetation.
Forests 12 01811 g001
Figure 2. The difference in SOCD among the sub-areas of RM, RH, LH, and vegetation types. The mean SOCD values of plantation, natural forests, grassland, and cropland were given at the top of the bars, and the error bars are standard deviations.
Forests 12 01811 g002
Figure 3. The variation of SOCD for NP (a), GP (b) and CP (c), and variation of SOCD change (ΔSOCD) for NP (d), GP (e) and CP (f) with rising time after forestation (forest age). The equations of fitted curves can be found in Table 3.
Forests 12 01811 g003
Figure 4. Response of ΔSOCD after forestation to main factors for each forestation mode (ac): the response curves under different SOCD0 for NP (a), GP (b), CP (c);, (d): the response curves under different Alt for NP (d);, (e): the response curves under different MAP for CTP (e);, (f): the response curves under different MAT for CP (f)). The curves are obtained using the equations in Table 5. The range of variables (SOCD0, MAP, MAT, and Alt) are set based on the means and standard deviations of each forestation mode. The control variables are set with the fixed values of the means of sample points, but Bio varies following the exponential functions of forest age.
Forests 12 01811 g004
Table 1. Sample plots information and stand conditions in each sub-area investigated in this study (mean ± SD).
Sub-AreasForestation
Modes
Group QuantityPlot QuantityTree Density
(Trees·ha−1)
Tree Height
(m)
Tree Breast Dimension (cm)Forest Age
(years)
Main Tree Species
RMGP191940 ± 4498.3 ± 0.99.8 ± 0.427 ± 6 Larix principis-rupprechtii
NP2311116 ± 51115.5 ± 2.819.7 ± 2.132 ± 3
RHCP193244 ± 19956.2 ± 3.56.9 ± 2.617 ± 8 Robinia pseudoacacia
GP2131271 ± 6028.4 ± 5.215.0 ± 4.516 ± 8 Pinus tabulaeformis, Armeniaca sibirica
NP254140 ± 19277.3 ± 1.88.7 ± 1.621 ± 8 Pinus tabulaeformis, Populus davidiana
LHCP4291790 ± 9654.8 ± 3.37.3 ± 3.914 ± 8 Prunus davidiana, Pinus tabulaeformis, Pyrus sorotina
GP2101789 ± 47211.2 ± 2.914.6 ± 8.326 ± 9 L. principis-rupprechtii, Hippophae rhamnoides
NP193000 ± 18686.3 ± 5.77.6 ± 4.014 ± 7 Robinia pseudoacacia
Table 2. Sample plots information of climate and soil properties in each sub-area investigated in this study (mean ± SD).
Sub-AreasForestation
Modes
MAT
(°C)
MAP
(mm)
Alt
(m)
Soil Bulk Density
(g·cm−3)
Initial SOCD
(t·ha−1)
Total N
(t·ha−1)
Total P
(t·ha−1)
Total K
(t·ha−1)
RMGP5.1 ± 0.5564.0 ± 46.22069 ± 291.11 ± 0.06257.3328.9. ± 9.65.7 ± 1.2220.2 ± 12.2
NP5.1 ± 1.1601.4 ± 20.02294 ± 1581.17 ± 0.11247.9924.6 ± 6.27.7 ± 1.6233.2 ± 28.5
RHCP6.0 ± 0.7562.5 ± 38.81806 ± 991.04 ± 0.0773.7011.8 ± 5.07.2 ± 1.4213.4 ± 31.8
GP6.9 ± 1.5506.9 ± 52.31930 ± 1161.12 ± 0.10173.2619.8 ± 7.07.1 ± 0.9200.5 ± 35.0
NP7.2 ± 0.9426.2 ± 19.11914 ± 2471.09 ± 0.04187.0920.2 ± 11.08.1 ± 2.6226.5 ± 18.8
LHCP7.7 ± 0.8484.8 ± 26.61836 ± 2081.13 ± 0.0845.667.9 ± 4.07.2 ± 1.2200.1 ± 25.0
GP7.5 ± 0.4477.0 ± 10.11914 ± 2471.02 ± 0.11100.8515.6 ± 7.17.4 ± 1.7201.4 ± 27.5
NP7.8 ± 0.4476.1 ± 14.42113 ± 1551.09 ± 0.07245.168.2 ± 4.27.1 ± 1.4189.0 ± 14.3
Table 3. The fitted response equations of SOCD variations with time after forestation shown in Figure 3.
Foresta-tion ModesCurveEquation NumberResponse Function TypesFitted Response EquationsInflection PointsValues at 40 Years (t·ha−1)
Value (t·ha−1)Time (Years)
NPSOCDupper (11)Logistic389.67–181.41/[1 + (Time/24.40)4.40]389.740--
SOCDbottom(12)Polynomial147.03–10.61 × Time + 0.31 × Time255.817--
SOCD average(13)Composite((11) + (12))/2140.012293.2
ΔSOCDupper(14)Logistic207.87–207.87/[1 + (Time/21.25)4.00]207.944--
ΔSOCDbottom(15)Polynomial−21.91 × Time + 0.55 × Time2−216.620--
ΔSOCD average(16)Composite((14) + (15))/2−82.813101.3
GPSOCDupper(17)Logistic307.49–131.63/[1 + (Time/16.89)2.75]307.535--
SOCDbottom(18)Polynomial121.90–2.63 × Time + 0.14 × Time2109.310--
SOCD average(19)Composite((17) + (18))/2145.94266.5
ΔSOCDupper(20)Logistic182.36–182.36/[1 + (Time/15.51)3.17]182.439--
ΔSOCDbottom (21)Polynomial−8.90 × Time + 0.30 × Time2−65.815--
ΔSOCD average(22)Composite((20) + (21))/2−17.16149.6
CPSOCDupper(23)Logistic201.17–127.47/[1 + (Time/0.17)2.78]201.225--
SOCDbottom(24)Polynomial51.18–1.86 × Time + 0.08 × Time240.910--
SOCD average(25)Composite((23) + (24))/2----154.5
ΔSOCDupper(26)Logistic99.40–99.40/[1 + (Time/6.46)3.16]99.416--
ΔSOCDbottom (27)Polynomial−1.34 × Time + 0.08 × Time2−5.48--
ΔSOCD average(28)Composite((26) + (27))/2----90.0
Table 4. The correlation analysis between ΔSOCD and possible influencing factors.
Forestation ModesPossible FactorsAverages
(Standard Error)
MaxMinCorrelation CoefficientRegressionExplained Importance
PRCPr
NPTime27±94030.34 *0.340.006 **28%
Bio129.7±83.4358.112.00.39 **0.150.18713%
SOCD0254.7±111.8378.4117.6−0.66 **−0.520.001 **43%
MAT5.9±1.58.74.20.19
MAP556.9±70.9617.2398.00.03
Alt2214±19525251737−0.46 **−0.190.19916%
GPTime23±93640.47 **0.420.002 **42%
Bio85.3±64.4218.11.90.33
SOCD0167.4±68.9257.369.0−0.63 **−0.590.000 **58%
MAT6.6±1.48.54.60.15
MAP513.6±53.2603.2450.4−0.16
Alt1876±20922891506−0.18
CPTime15±83550.51 **0.3750.009 **40%
Bio41.8±30.9124.71.20.04
SOCD052.4±16.373.723.40.56 **0.2630.12128%
MAT7.3±1.19.54.6−0.35 *−0.0220.8992%
MAP503.2±44.5603.2434.60.51 **0.2880.11430%
Alt1829±187218514460.11
Note: PRC = partial regression coefficient; Pr = the probability of a PRC greater than the given value. *= p < 0.05, ** = p < 0.01. Time = time after forestation (forest age, year); Bio = biomass of trees (t·ha−1); SOCD0 = initial SOCD (t·ha-1); MAT = mean annual air temperature (°C); MAP = mean annual precipitation (mm); Alt = altitude (m).
Table 5. The response functions of△SOCD to influencing factors.
Forestation ModesPlot QuantityInfluencing FactorsResponse Functions (Models) of △SOCDR2Sig. (P)Equation Number
NP45Time103.94–103.94/[1 + (Time/21.25)4.00]−10.96 × Time + 0.28 × Time20.140.01(16)
Time, SOCD0, Alt, Bio{13.37–13.37 / [1 + (Time/58.52)11.49] −0.022 × Time + 0.0006 × Time2} × (4.58 × SOCD0 −0.53 × Alt−2.82 × Bio + 1029.41)0.560.000(29)
GP32Time91.18–91.18/[1 + (Time/15.51)3.17]−4.45 × Time + 0.15 × Time20.230.006(22)
Time, SOCD0{91.18- 91.18/ [1 + (Time/15.51)3.17] −4.45 × Time + 0.15 × Time2} × (−0.01 × SOCD0 + 1.92)0.540.000(30)
CP38Time49.70–49.70/[1 + (Time/6.46)3.16]−0.67 × Time + 0.04 × Time20.260.001(28)
Time, SOCD0, MAP, MAT{3.40–3.40/[1 + (Time/18.26)0.02] + 0.71 × Time−0.01 × Time2} × (0.07 × SOCD0 + 0.02 × MAP + 0.29 × MAT −13.55)0.510.000(31)
Table 6. The response patterns of SOC/SOCD with time after forestation in this study and other studies carried out mainly in China.
SOC/SOCD Response PatternsRange of Forest Age (Year)Inflection Time (Year)Initial Vegetation Type (SOCD0, t·ha−1)Soil Layer (cm)CountryLongitude(°)Latitude(°)Plantation Type after AfforestationReference
Decrease0–18 Grassland0–100Australia Pinus radiata [13]
From decrease to increase0–3015–30Grassland0–100China109.25 E36.77NRobinia pseudoacacia [11]
0–3010–15Grassland0–100China107.77–109.95 E35–38.80 NRobinia pseudoacacia [31]
From slow increase to rapid increase0–3510Cropland (7.7)0–20China109.24 E36.77 NRobinia pseudoacacia [32]
0–3010Forest0–10China116.30–116.48 E25.55–25.80 NPinus massoniana [33]
From increase to levelling off0–6050Cropland0–100China108.58–109.25 E35.28–36.78 NConiferous [14]
0–40≥16 yearsCropland (52.4)0–100China105.78–107.11 E35.32–36.58 NConiferous, deciduous broad-leavedThis study, Figure 3f
From decrease to increase and finally levelling off0–2505, 40Cropland (78.0)0–100ChinaNationwideConiferous [34]
10, 30Broad-leaved
5, 40Evergreen
10, 30Deciduous
0–40≥39 yearsGrassland (167.4)0–100China105.78–107.11 E35.32–36.58 NConiferous, deciduous broad-leavedThis study, Figure 3e
0–40≥44 yearsForest (254.7)0–100China105.78–107.11 E35.32–36.58 NConiferous, deciduous broad-leavedThis study, Figure 3d
Publisher’s Note: MDPI stays neutral with regard to jurisdictional claims in published maps and institutional affiliations.

