
Optimum Sensors Allocation for a Forest Fires Monitoring System


1
Research Centre in Digitalization and Intelligent Robotics (CeDRI), Instituto Politécnico de Bragança, 5300-253 Bragança, Portugal
2
Algoritmi Research Centre, Campus Azurém, University of Minho, 4800-058 Guimarães, Portugal
3
Faculty of Engineering, University of Porto, 4200-465 Porto, Portugal
4
INESC TEC—INESC Technology and Science, 4200-465 Porto, Portugal
*
Author to whom correspondence should be addressed.
†
These authors contributed equally to this work.
Forests 2021, 12(4), 453; https://0-doi-org.brum.beds.ac.uk/10.3390/f12040453
Submission received: 19 February 2021
/
Revised: 27 March 2021
/
Accepted: 30 March 2021
/
Published: 9 April 2021
(This article belongs to the Special Issue Decision Support System Development of Wildland Fire)
Abstract
:Every year forest fires destroy millions of hectares of land worldwide. Detecting forest fire ignition in the early stages is fundamental to avoid forest fires catastrophes. In this approach, Wireless Sensor Network is explored to develop a monitoring system to send alert to authorities when a fire ignition is detected. The study of sensors allocation is essential in this type of monitoring system since its performance is directly related to the position of the sensors, which also defines the coverage region. In this paper, a mathematical model is proposed to solve the sensor allocation problem. This model considers the sensor coverage limitation, the distance, and the forest density interference in the sensor reach. A Genetic Algorithm is implemented to solve the optimisation model and minimise the forest fire hazard. The results obtained are promising since the algorithm could allocate the sensor avoiding overlaps and minimising the total fire hazard value for both regions considered.
1. Introduction
Forest fires are a global problem, especially in the Mediterranean region. Portugal is by far the Mediterranean country that has suffered the most due to forest fires, registering on average of 141,007 ha burned per year between 2009 and 2018 [1,2]. Although the Mediterranean region was considered highly fire-adapted due to historical occupation context, the contemporary societies have not fully adapted to balancing fire hazard risk and resource needs on the region [3,4]. Thus, today, this type of environmental catastrophe has severe damage not only for flora and fauna but also for economics and loss of human lives.
The origin of forest fires may have different sources, natural or not. Although, as a general rule, globally only around 4% of all forest fires have natural causes, such as meteorological factors. In all other cases, humans are responsible for the fires, deliberately or due to heedlessness [1]. In Portugal, the majority cause of the fire events is human origin, whether caused by accident, negligence or arson [5]. The greatest number of the wildfires and burnt area is concentrated in agricultural areas (47% and 55%) and artificial surfaces (36% and 27%) while only a small fraction of these statistics respect to wildfires started in forests (13% and 18%) [5]. Thus, areas with greater fire risk, such as farmland reclamation and roads, should be monitored for key prevention and control.
The forest environment is composed of trees, leaves, dry, and wood, which facilitate the quick spread of fire and difficult the control in a short time [6], which also depends on the weather condition during fire ignition and the fire spread. Furthermore, the forest is an environment with several risks and uncertainty, since it involves large dimensions, irregular and remote lands, and many obstacles, such as trees, rivers, and animals. The development of decision support tools, like a forest monitoring system, is a way to provide support in management, planning, resources allocation, and pre-fire planning to the authorities [7,8].
The project Forest Alert Monitoring System (SAFe) proposes a monitoring system for the "Serra da Nogueira” region, located in the North of Portugal. This project proposes a set of innovative operations to reduce the alert time of forest fire ignitions and contribute to the local surveillance systems, supporting firefighters and civil protection with more details and real-time information. Thus, modules of wireless sensors will be spread in the forest to collect data about humidity, temperature, UV index, and flame presence. These data are evaluated by an intelligent and autonomous system and alerts messages are sent when a fire ignition is identified. In the absence of fires, this system will allow monitoring the forest parameters, such as temperature, humidity, UV index, and soil moisture, through the data collected by the sensors.
However, installing sensors in large areas is chaotic and laborious if an optimised strategy is not established to define the optimum position to allocate each sensor. Thus, this paper concentrates efforts to determine the optimal position for sensor allocation considering the sensor coverage limitation, the distance and the forest density interference in the sensor reach.
2. Related Work
Wireless sensor network (WSN) is a current technology used in several fields [9]. Their capabilities for monitoring large areas, accessing remote places, reacting in real-time allows its use in forest fire system detection [10]. The sensor measures physical parameters, such as changes in barometric pressure, humidity, and temperature, solar radiation, and chemical parameters, such as carbon dioxide, carbon monoxide, and nitrogen dioxide [11,12]. In the forest environment, the use of WSN has become more prominent in recent years since they can detect a small flame that characterises the initial stage of a forest fire. Nevertheless, if the forest components were not enough, the WSN on forest involves other challenges, such as data transmissions, sensors’ power, and optimal location to install them.
The amount of data and uncertain of the forest environment tend to be chaotic for some approaches, thus, algorithms are required for data processing and provide solutions optimised. Genetic Algorithm (GA), Support Vector Machine (SVM), Random Forest, and many others are some examples of techniques widespread in the forest protection context. A system based on genetic algorithm and geometric semantic genetic algorithm is proposed in Reference [13], which uses drought factor, temperature, relative humidity, and wind to predict the fire spread during a forest fire. A novel algorithm for multiple wireless sensors allocation and for solving the coverage problem on a large-scale is presented in References [14,15] to design a system for early detection of forest fires by WSN. The system uses Fine Fuel Moisture Code (FFMC) and the Fire Weather Index to model the forest fire detection as a k-coverage problem. Another relevant approach is found in Reference [16], which GA is uses as a feature selection technique to obtain a set of variables that have a high relation with forest fires. Thereafter, two data mining methods, Random Forest and SVM, were used to produce forest fire susceptibility maps, considering the selected variables.
Some models and algorithms are addressed to modelling fire propagation in order to minimise the forest fires damage. The systems presented in References [17,18,19] incorporate topography, vegetation and meteorological conditions to predict the forest fire spreading. The work presented in Reference [20] applies GA to define the optimum fireline and location of firefighters on the landscape which minimises the forest fire damage. This model evaluates strategies and guides the search direction to obtain the best fireline construction strategy that minimises the total burnt area. Monte Carlo simulations were also used to incorporate the uncertain conditions of weather and imperfect knowledge about vegetation topographical conditions.
In most cases, the data used in the monitoring systems are collected by sensors. The position of these sensors can determine the quality of the data and the accuracy of the system. Thus, defining the optimal position of each sensor by optimisation tools can provide substantial improvements to the system since the monitoring system’s robustness depends on how the data and constraints are handled. In the present work, a wireless sensor is considered to collect data to be processed by a system for alerts generation when a fire is detected. The forest sensor allocation issue is treated as an optimisation problem, and a GA is used to solve the problem and establish the sensors’ optimal position. The optimisation problem considers technical and environmental constraints as sensor reach limitation, the number of available sensors, fire hazard, and the forest density.
3. The Area of Study
The methodology developed in the SAFe project will be implemented in the North region of Portugal, more specifically in the “Serra da Nogueira”, belonging to the municipality of Bragança. The monitoring system’s total coverage area is expected to be a radial . The QGIS software [21] is used as a visualisation base, and with this software, it is possible to use the data with information on Fire Hazard and Forest Density in the study area. These data are provided by ICNF [2] and Copernicus [22], respectively, and the next subsections it will be described how these data are generated by these entities. The coordinate system has the ETRS89/PT-TM06 (EPSG:3763) UTM Zone 29N standard with Mercator Transverse Universal projection, the unit of measurement used is in meters.
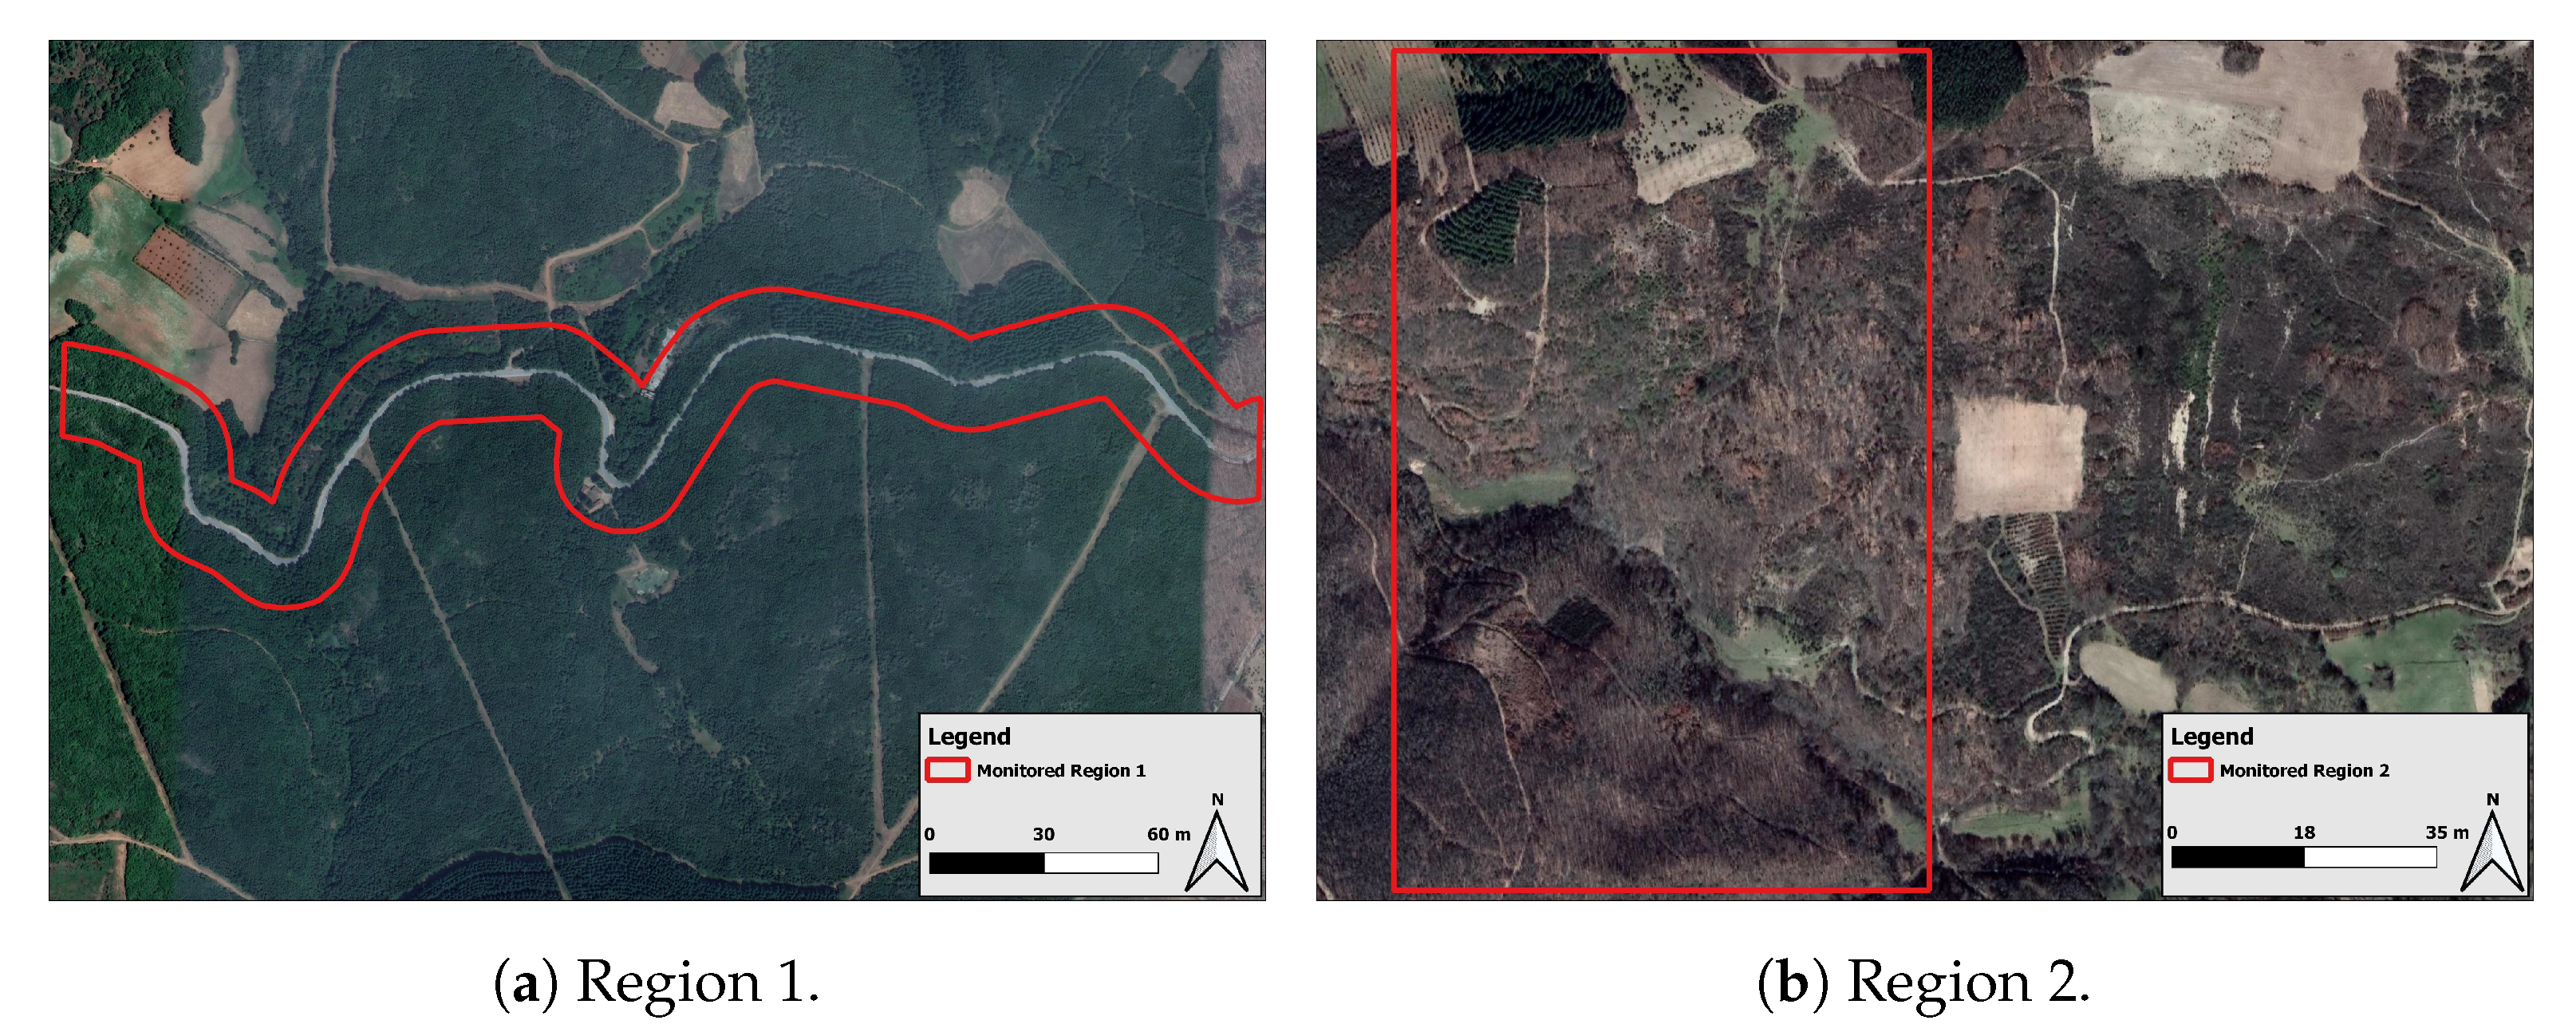
Two experimental regions of "Serra da Nogueira” were chosen to test the mathematical model and the algorithm behaviour in different situations. Each region was strategically defined due to its heterogeneity, such as different fire hazards, density levels, and road presence or not. The results obtained will guide the SAFe project into the improvement and the expansion of the monitored area. In addition, it will provide for the literature, replicable manner to allocate sensor into the forest. Region 1 is approximately 253,000 m, and it is illustrated in Figure 1a, whereas Region 2 is 246,875 m, and it is illustrated in Figure 1b.
According to local firefighters, a significant part of the fires in the "Serra da Nogueira” are intentionally provoked by human actions, and they start near the roads, in areas with a high concentration of trees. Thus, Region 1 considers of road, in which the next to each side of the road, are considered regions of high probability to start a fire ignition. In contrast, Region 2 characterises the forest’s interior, further of road, so, a situation opposite to Region 1.
To define the optimal sensor modules’ position, besides the sensor technical characteristics, two critical parameters are considered to develop the optimisation model: fire hazard and forest density. For both regions, the information of fire hazard and forest density parameters were provided by QGIS [21].
3.1. Fire Hazard
The fire hazard refers to the probability of potentially destructive phenomena, considering a time interval and a specific area [23,24]. Thus, the fire hazard can be described as the probability of occurrence associated with the conditions of the territory. Therefore, the two components (time and space) encompass the probability of the event occurring, whose calculation can be based on the existing history; they also encompass the susceptibility, which addresses aspects related to the territory for which the phenomenon is being studied. In the case of forest fires, a given area will be more susceptible the better it allows the deflagration and/or the progression of the fire [24,25]. Nevertheless, in the fire risk analysis, the hazard refers to the introduction of the fire source, and the fuel load location refers to the vulnerability of the fire.
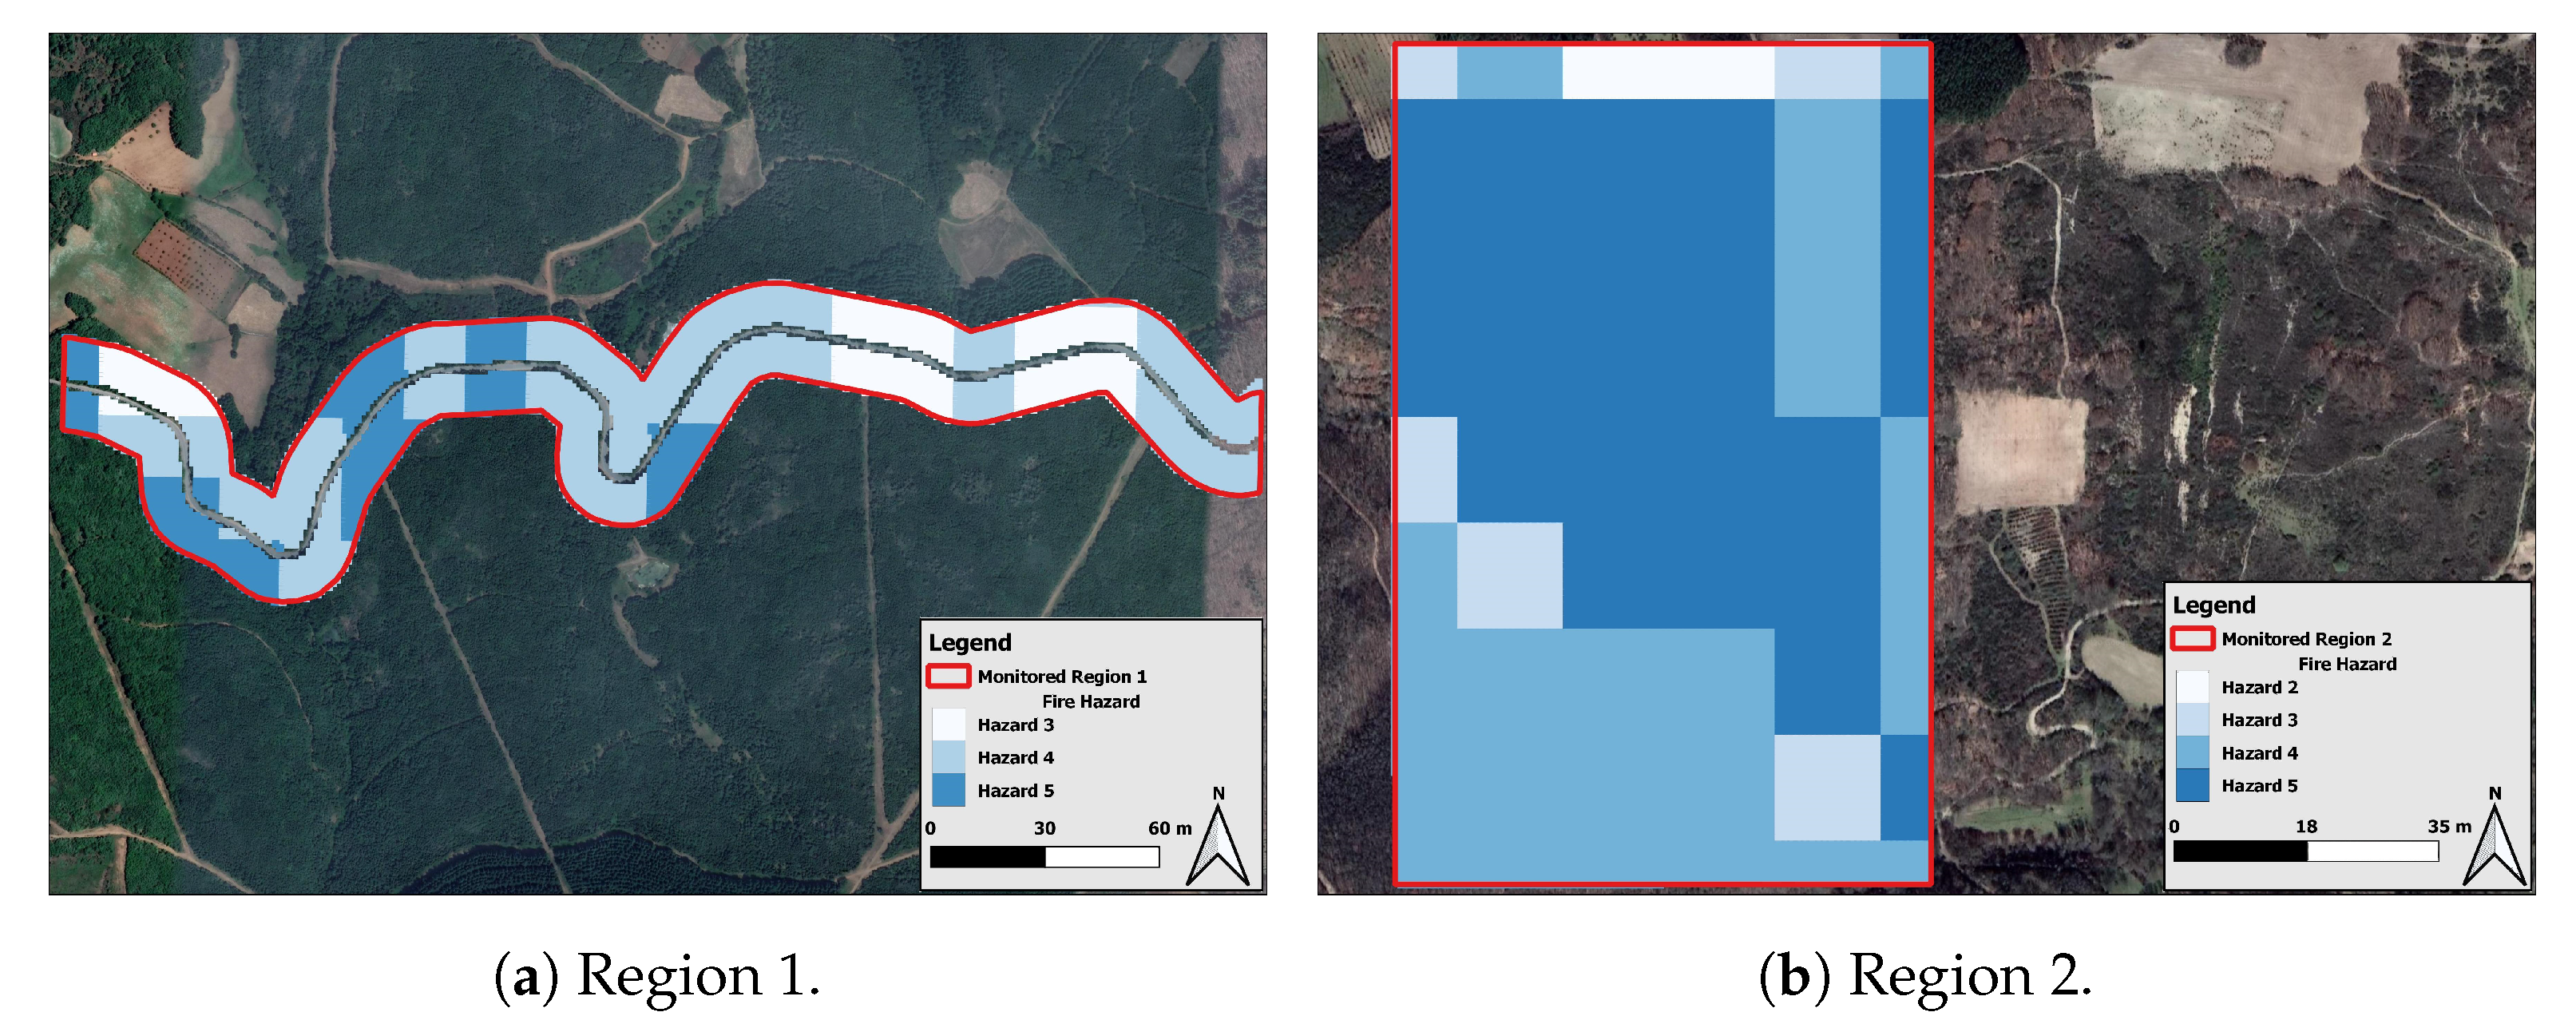
The fire hazard map is public information that is useful to support a decision in preventive actions since it is possible to identify the location with the highest fuel load. That is, it allows to identify the hazard of a forest ignition of each region. According to Reference [24], it is possible to elaborate a probability with the three crucial parameters (mentioned before) and estimate a scale from 0 to 5. In this way, level 0 indicates a low fire hazard, and level 5 indicates a high hazard fire. The fire hazard of the regions is indicated in Figure 2a for Region 1 and Figure 2b for Region 2.
3.2. Forest Density
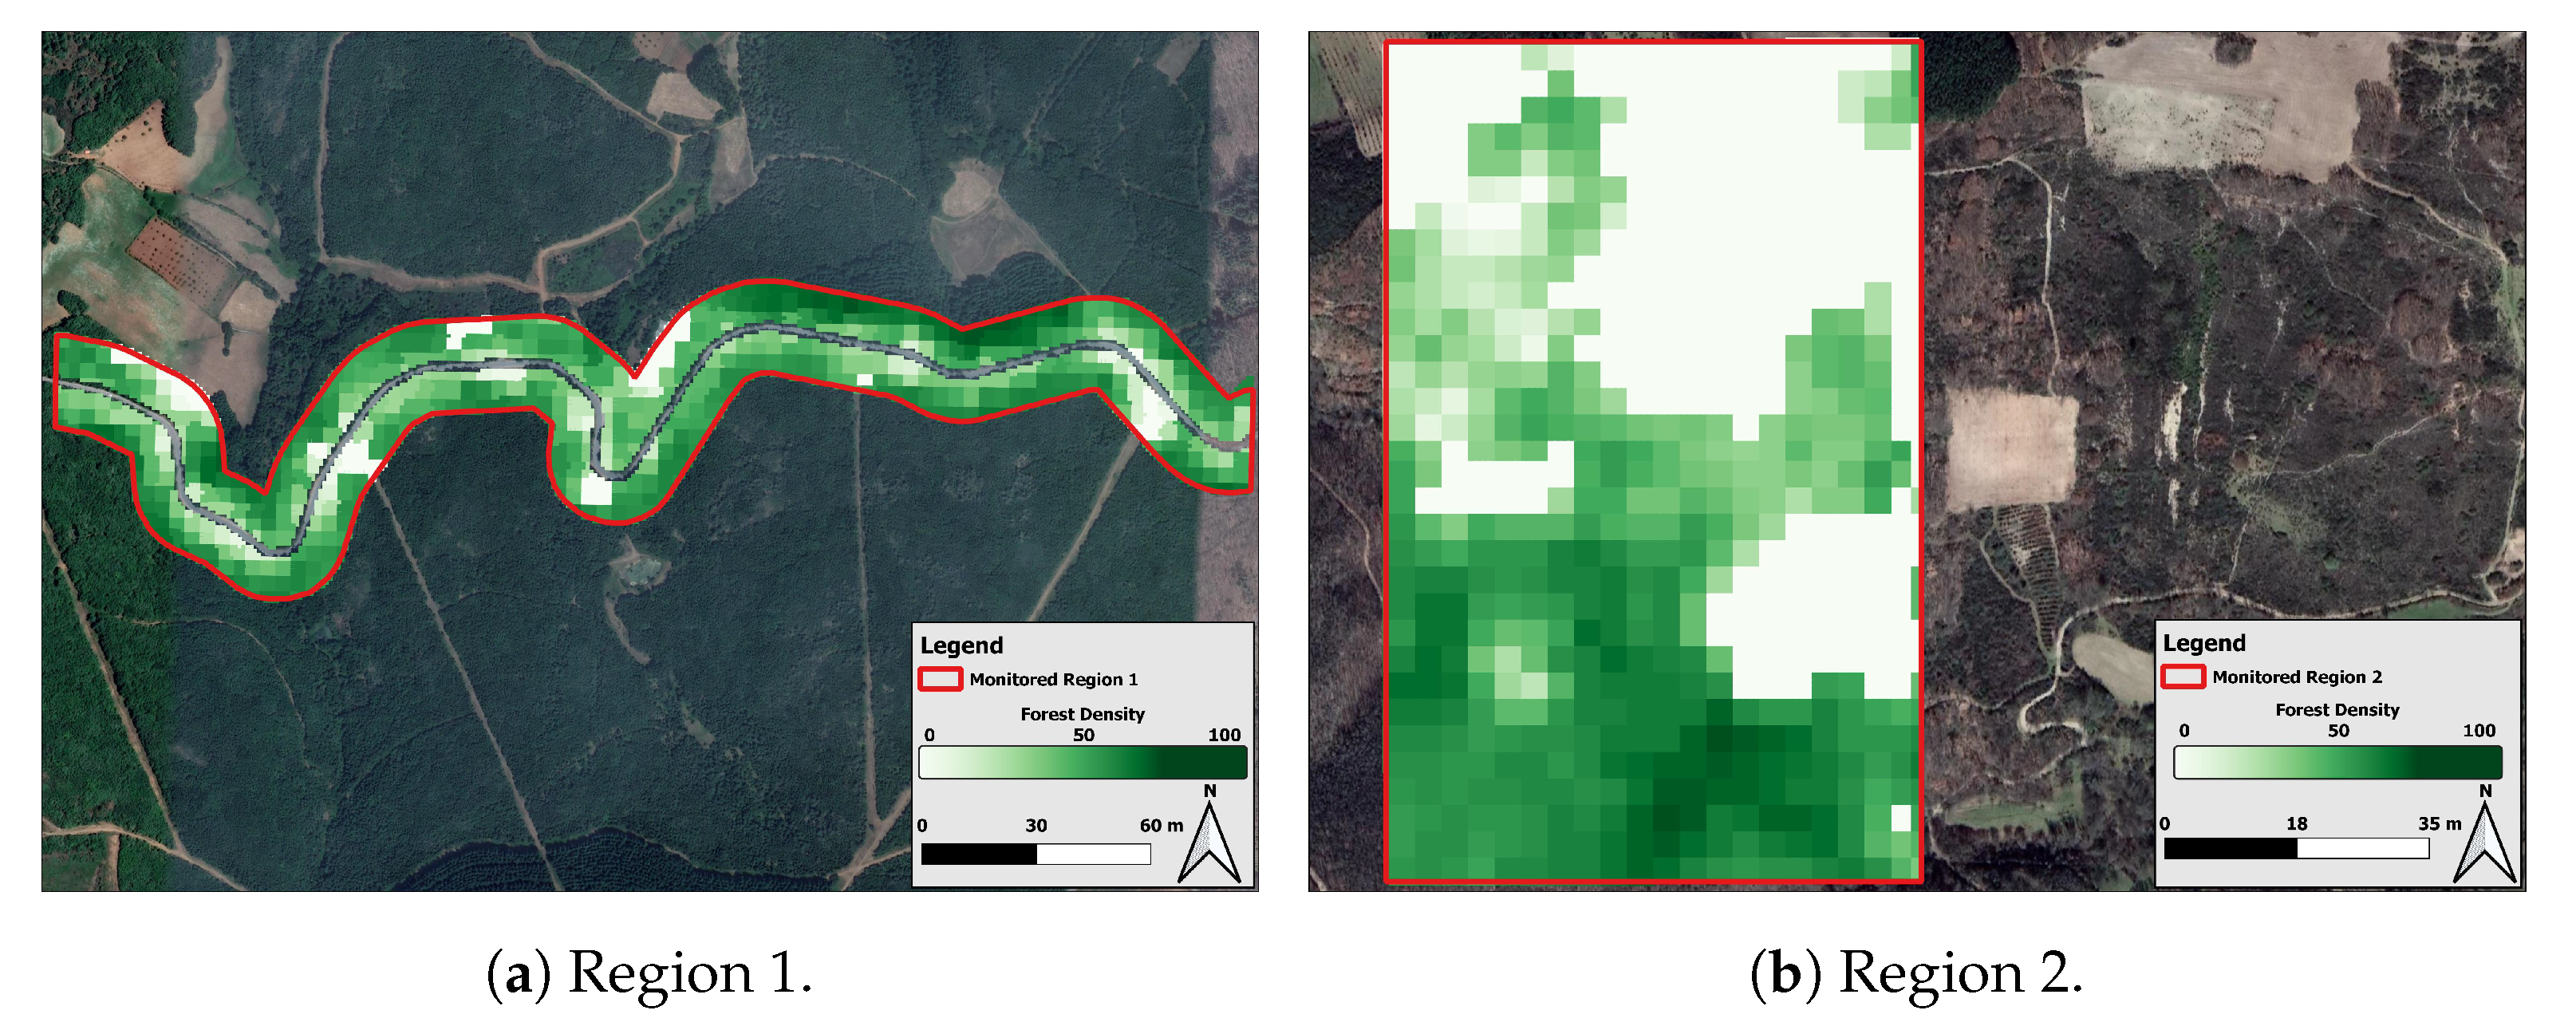
The forest density is a parameter related to the quantity of vegetation in a specific area. In this work, the forest density varies from 0 to 100, where 0 indicates no presence of vegetation and 100 indicates a high concentration of vegetation in . These values are obtained using the map from the European satellite named Sentinel-2 created by the Copernicus program [22]. Figure 3a indicates the forest density of Region 1, and Figure 3b indicates the forest density of Region 2.
4. The Optimisation Problem
The problem of sensor allocation can be treated as a nonlinear optimisation problem where a limited forest region should be monitored by a set of sensors ( sensors). This kind of problem involves technical and environmental constraints. The technical constraints refer to the sensors, such as the sensors’ number available and their ability to identify and cover a given place on the forest at a certain distance. On the other hand, the environmental constraints refer to the forest characteristics, as forest density and the fire hazard of each point. It is essential to highlight that many sensors are available on the market with different characteristics, so a robust optimisation model should work with different sensor constraints.
A sensor has a limited capability of coverage, which depends on the sensor’s technical specifications. Nevertheless, as closer a given forest point is to the sensor , as higher will be the protection. Besides, in the forest environment, the sensor’s coverage also depends on the forest density where the sensor and the point are located. Trees are barriers that block the sensor range. A point has a higher level of coverage if it has a small distance () from the sensor , and both points have low forest density.
The fire hazard values vary as the point localisation, and it has values between . The fire hazard of a point was obtained by fire hazard maps. For example, according to the local firefighters and civil protections, some regions should be prioritised in a monitoring system due to environmental aspects, lives, or economic issues. Thus, these priority regions should have higher fire hazard than the others less critical.
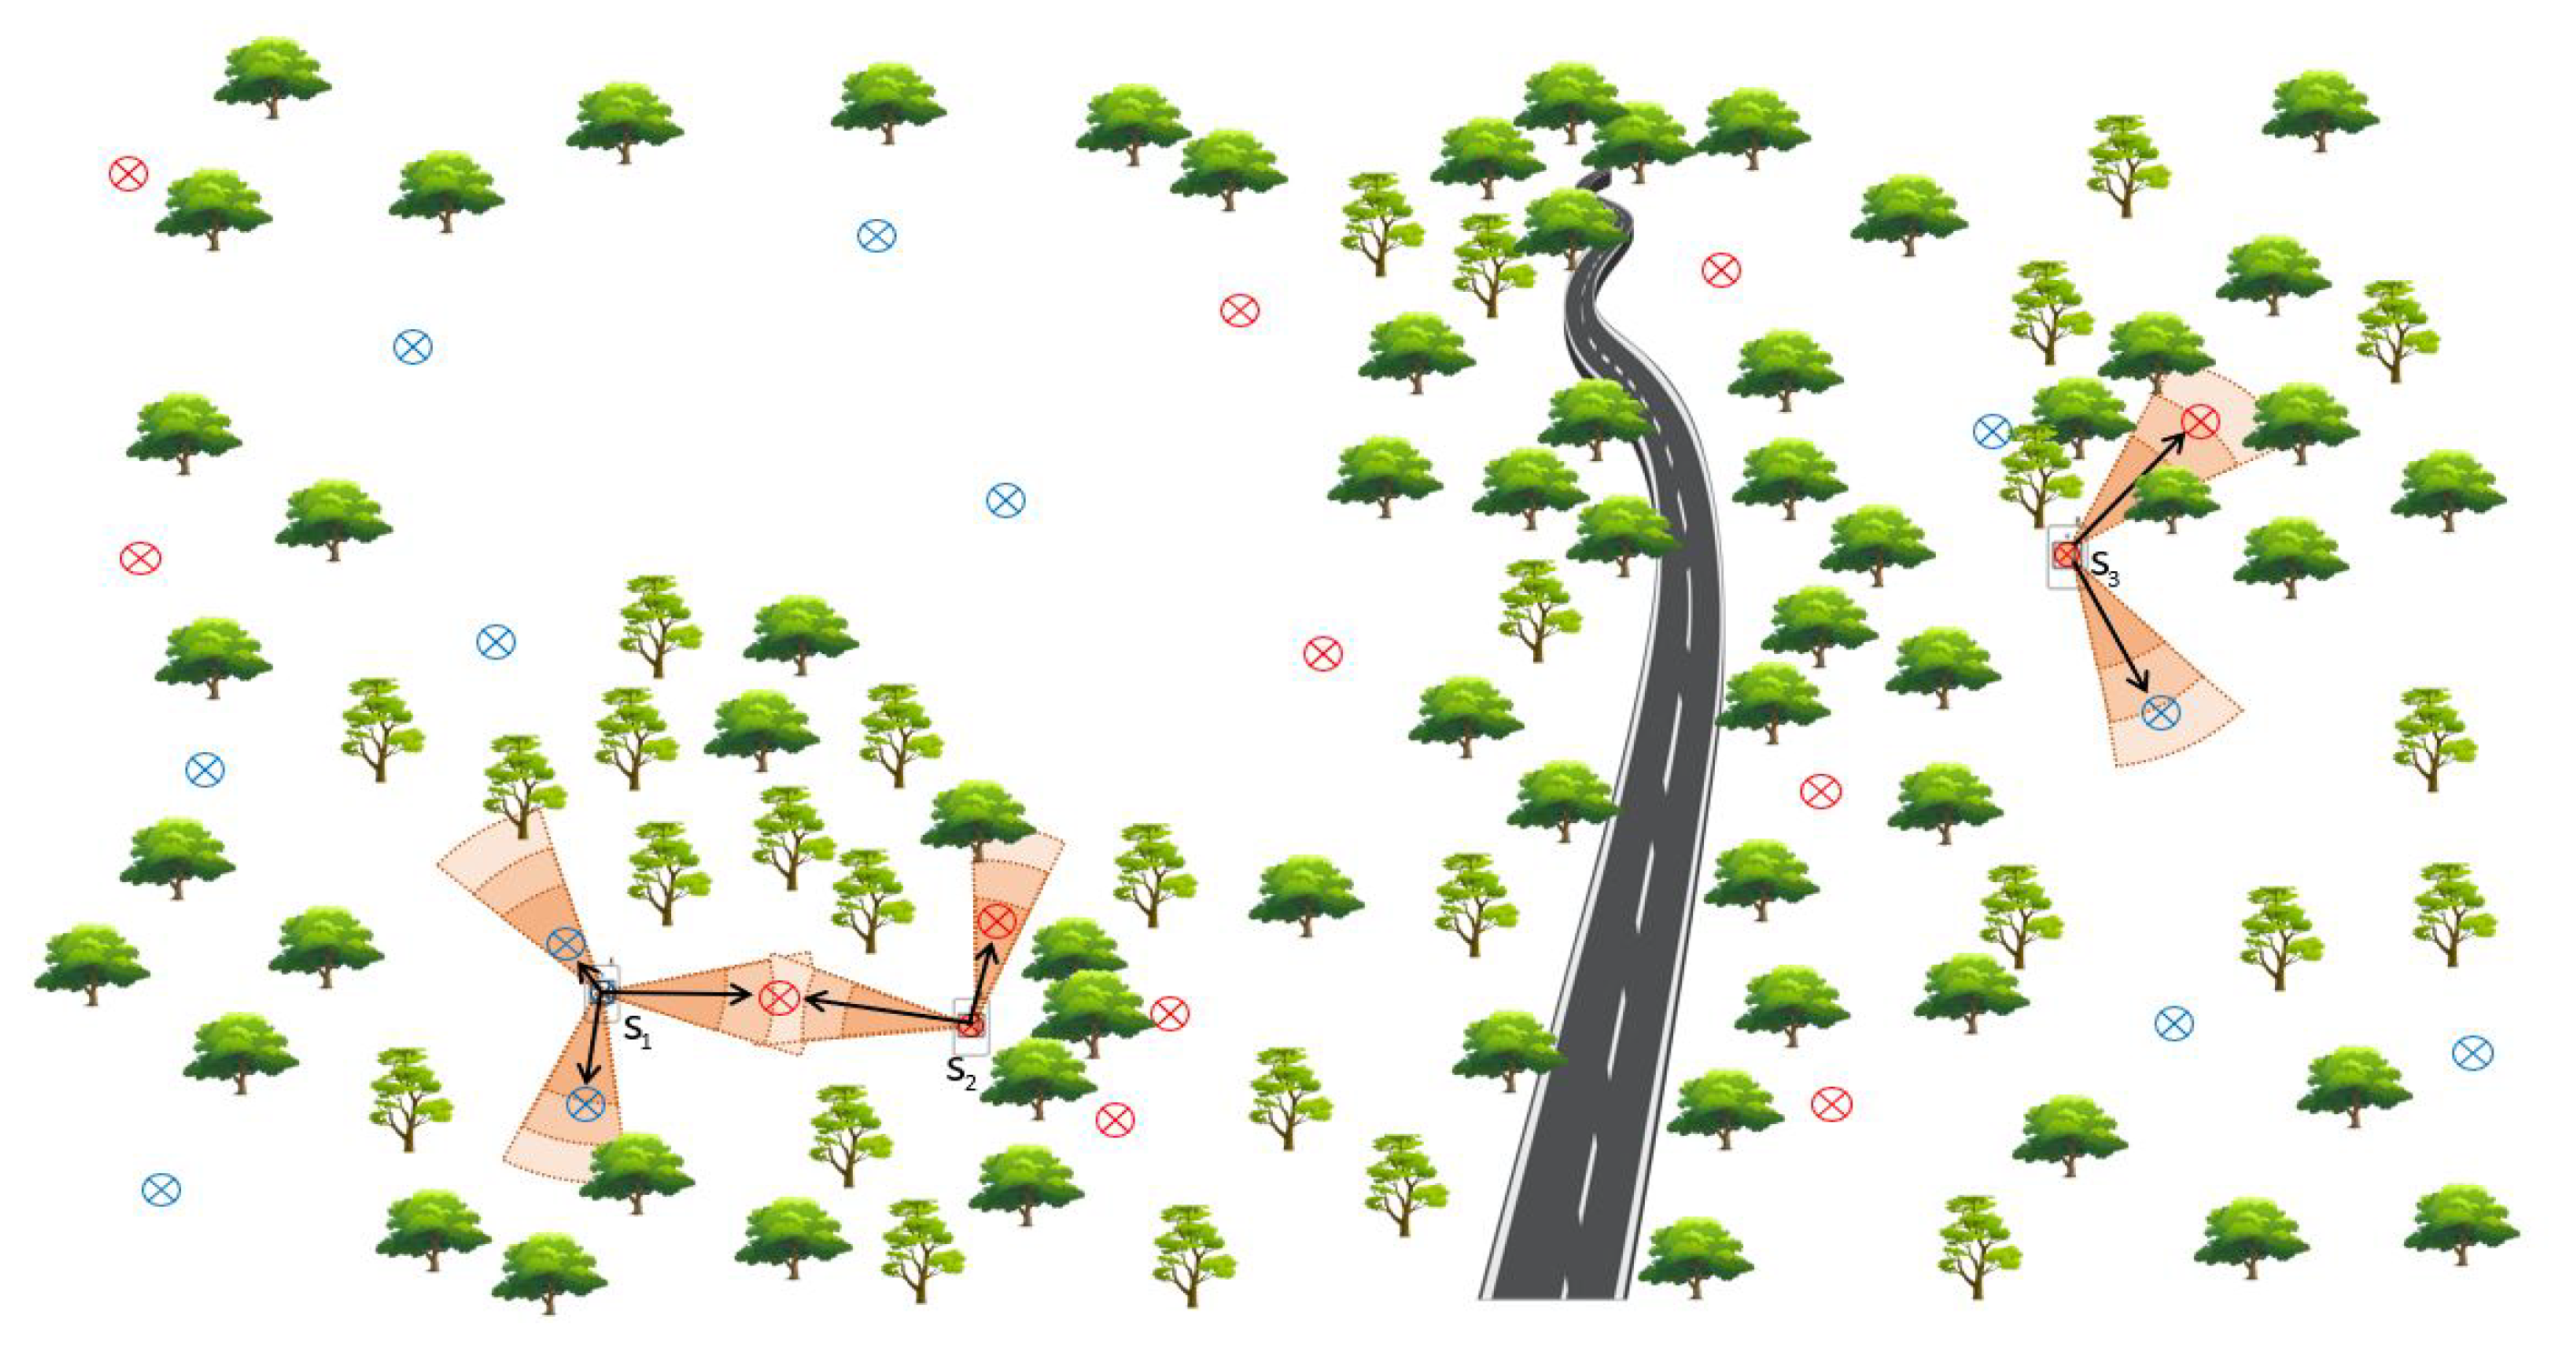
In this work, it is considered that each sensor is capable of covering points in any direction, i.e., in 360 degrees. When a sensor is assigned to a point, not only the fire hazard associated with that point is reduced but also the fire hazard of the points inside the sensor coverage reach. This reduction is linear, and it depends on the weight that the distance and forest density constraints exert on the sensor reach. To illustrate the problem, consider Figure 4, in which two fire hazard levels are considered, represented by blues and reds points. In this case, three sensors were assigned. As illustrated, the points closest to the sensor has a better coverage level than the points further, but still inside the sensor’s coverage reach. At the same time, the most distant points are not covered by any sensor. Furthermore, there are situations that even near the sensor, the point is not protected since the sensor reach is blocked due to high forest density interference, as occur in some points near the sensors and .
However, two sensors can also cover the same point, as illustrated by the sensors and , which have a common point of coverage. In this situation, two conditions can occur: the overlap value is smaller than the fire hazard value (i.e., even covered by two sensors the fire hazard is still positive at that point); or the overlap value is higher than the fire hazard value, it is the point that has an excess of coverage (i.e., the fire hazard is negative in that point). From the point of view of the optimisation problem, it should be avoided the overlap coverage situation to promote the null forest hazard values in the maximum possible points. Besides, it is vital to highlight the sensor covers two equidistant points, so the distance interference in the sensor reach is the same for both points. However, the red point is located in a higher density area, so it has a lower coverage level than the blue point, which is not influenced by forest density.
Thereby, there are four situations that can describe a point, after all sensors are assigned:
- Case 1: the point is not covered by any sensor ().
- Case 2: the point is covered and its fire hazard is completely eliminated either because a given sensor or due to a set of sensors ().
- Case 3: the point is covered by a sensor but the fire hazard is not completely eliminated ().
- Case 4: the point is covered more than it needed, by a set of sensors - overlap coverage ().
Therefore, this optimisation problem aims to minimise the fire hazard sum of each region considered in this work. In this way, the sensor allocation problem will be described as a single-objective optimisation problem. Each forest region is mapped according to the forest density and the fire hazard of each point. Moreover, each region is filled by a grid of points , with a linear spacing of 5 between each point. Thus, with these points will be possible to determine the optimum location to place a given sensor .
The forest region is given by a map of points associated to the Cartesian’s coordinates, the forest density in each point and the forest hazard in each point . The Table 1 represents the study region map.
The priority areas to be monitored are associated with a higher fire hazard. In this sense, a given sensor can be placed on a point , for , with a given coverage that depends on the forest density and fire hazard parameters. When a sensor , for , is assigned to a point , it is necessary to identify which points are covered by this sensor, and consequently, how much the sensor coverage reduces the fire hazard associated to the point . To define if a sensor covers a point, firstly, the Euclidean Distance, , between the sensor , placed on the point , and a given point is evaluated by Equation (1).
The coverage sensor distance function depends on the forest density of the sensor position , the forest density of the point , and the sensor maximum covered distance . Thereby, the coverage sensor distance is given by Equation (2).
If the distance () between the sensor located on to the point is smaller than the coverage sensor distance , that is Equation (3),
the point is covered by the sensor placed on position. In this case, it is necessary to define the level of coverage, establishing the fire hazard reduction on the point . The fire hazard reduction function , expressed by Equation (4), depends on the locations of , placed on , and also the point location.
where is the maximum fire hazard, is the minimum fire hazard, and and are the maximum and minimum coverage distance, respectively. The value refers to the interference produce by the distance and the forest density and , and both quantities and have the same range of values. The value is calculated as the average of both values as expressed on Equation (5).
The fire hazard value on the point is updated with the fire hazard reduction, associated to the sensor coverage, according to the following function, in Equation (6).
When is positive, it means no sensor covers the point or the coverage level received by a sensor or a set of sensors is not enough to completely eliminate the fire hazard of the point . If the is zero, the point is fully covered by a sensor or a set of sensors. Finally, when is negative, it means that more than one sensor is covering that point, resulting in excess coverage (overlap). The overlap of the sensor range must be avoided.
Thereby, the optimisation problem aims to identify the best sensor locations with for in order to cover as much area as possible, using a fix quantity of sensors, and avoid unnecessary overlap of sensor range. Thus, optimisation problem is defined by Equation (7).
where is a fix the penalty parameter.
5. Genetic Algorithm
In this study, the GA is applied to solve the optimisation problem of sensor allocation. GA is an optimisation technique based on population evolution, which is inspired by the principles of genetics and natural selection [26]. GA’s basic idea is to create feasible individuals solutions to form the initial population with dimension N. After that, genetic operators, such as selection, crossover, and mutation, are applied to every population to obtain new individuals, better than the previous ones. The individual’s evaluation is done by the objective function (fitness function) that describes the optimisation problem. The value provided by the objective function defines how well an individual is adapted to solve the optimisation problem. This process is repeated iteratively until a solution satisfies a predefined termination criterion [27].
The individual of the GA population is the vector , for , with the locations to allocate the sensors. Each place has the Cartesian’s coordinates of the candidate to allocate the sensor. When a point is selected to receive a sensor, the fire hazard associated to this point is completely eliminated and the hazard of the points near to the sensor have the fire hazard decreased linearly.
Suppose the distance between the sensor and the point is smaller than the sensor view (Equation (3)); this means the sensor covers the point, so the hazard of this point should be reduced. This reduction is evaluated by Equation (4), which ponders linearly the distance between the sensor and the point and also the forest density interference. The total fire hazard is calculated using Equation (7). The GA developed is presented in Algorithm 1.
As stop criteria, it was considered the maximum number of iterations (), function evaluations, and the similarity between the successive solutions ().
| Algorithm 1: GA to solve sensors allocation problem |
|
6. Numerical Results
The SAFe project intends to implement a set of sensors on tree trunks, so at least one tree is required on the point indicated by the algorithm to allocate a sensor. Besides, intentional fire forest starts typically in regions with high forest density, according to the forest local surveillance personal. In this sense, only points with forest density over or equal to 80 were considered candidates to receive a sensor. This value ensures there are trees in the region appropriated to fix the sensors. It also was limited the fire hazard, so, for Region 1, it was considered the points with fire hazard equal to 4 or 5. While in Region 2, it was considered a fire hazard value between 2 and 5.
Two types of Sensors Module, named A and B, are considered. The Sensors Module A are less robust, and they can cover a distance between 0 and 50 , depending on the forest density interference. On the other hand, the Sensors Module B can cover between 0 and 100 , also varying according to forest density interference. Both modules perform communication (sending and receiving information) using LoRaWAN [28]. technology. In this way, it is possible to obtain long-range communication with reduced operating costs since LoRaWAN does not have monthly operating costs for business plans. The design of these modules also considers energy autonomy, as they will be installed in regions that are difficult to access and, therefore, carrying out periodic maintenance could be impracticable. Based on this, the modules have batteries that last for approximately six months. There is still the possibility that Sensors Module B can be installed with a solar panel, further extending the recharging period of its battery [11]. There are available 50 units of Sensors Module A and 10 units of Sensors Module B.
The results obtained by the optimisation model and the algorithm proposed were obtained using an Inter(R) Xenon(R) CPU GHz with 32 GB of RAM and the Software R2020a [29]. The parameters used for the optimisation problem were =50, , , , is the initial hazard of the point , and varies according to the sensor type, being for the sensor A and for the sensor B. The parameters used for the GA termination criterion are and = 50. Since GA is a stochastic method, the algorithm was executed five times for both regions.
The iteration with a smaller objective function value is considered the optimum solution for the problem. The results also analysed the iterations number, overlap value, and the final fire hazard sum after the sensor’s allocation.
6.1. Results Obtained in Region 1
Region 1 describes a road area with a high incidence of fires. It is composed of 3507 points, which means 3507 possibilities to allocate 50 Sensors Modules A and 10 Sensors Modules B, and it has a total fire hazard equal to 15,098. Table 2 presents the algorithm results for this region. The average of the executed runs’ objective function was 13,099, needing 1082 average iterations. It is possible to observe that the obtaining overlap is between 0 and . Comparing the runs, the third one had the smallest objective function value and the smallest sum of fire hazards after the sensor’s allocation. In this run, the sensors’ location produces an overlap equal to zero, which means that no waste of sensor coverage occurs, so the maximum area covered by the set of the sensor was established, considering the problem constraints.
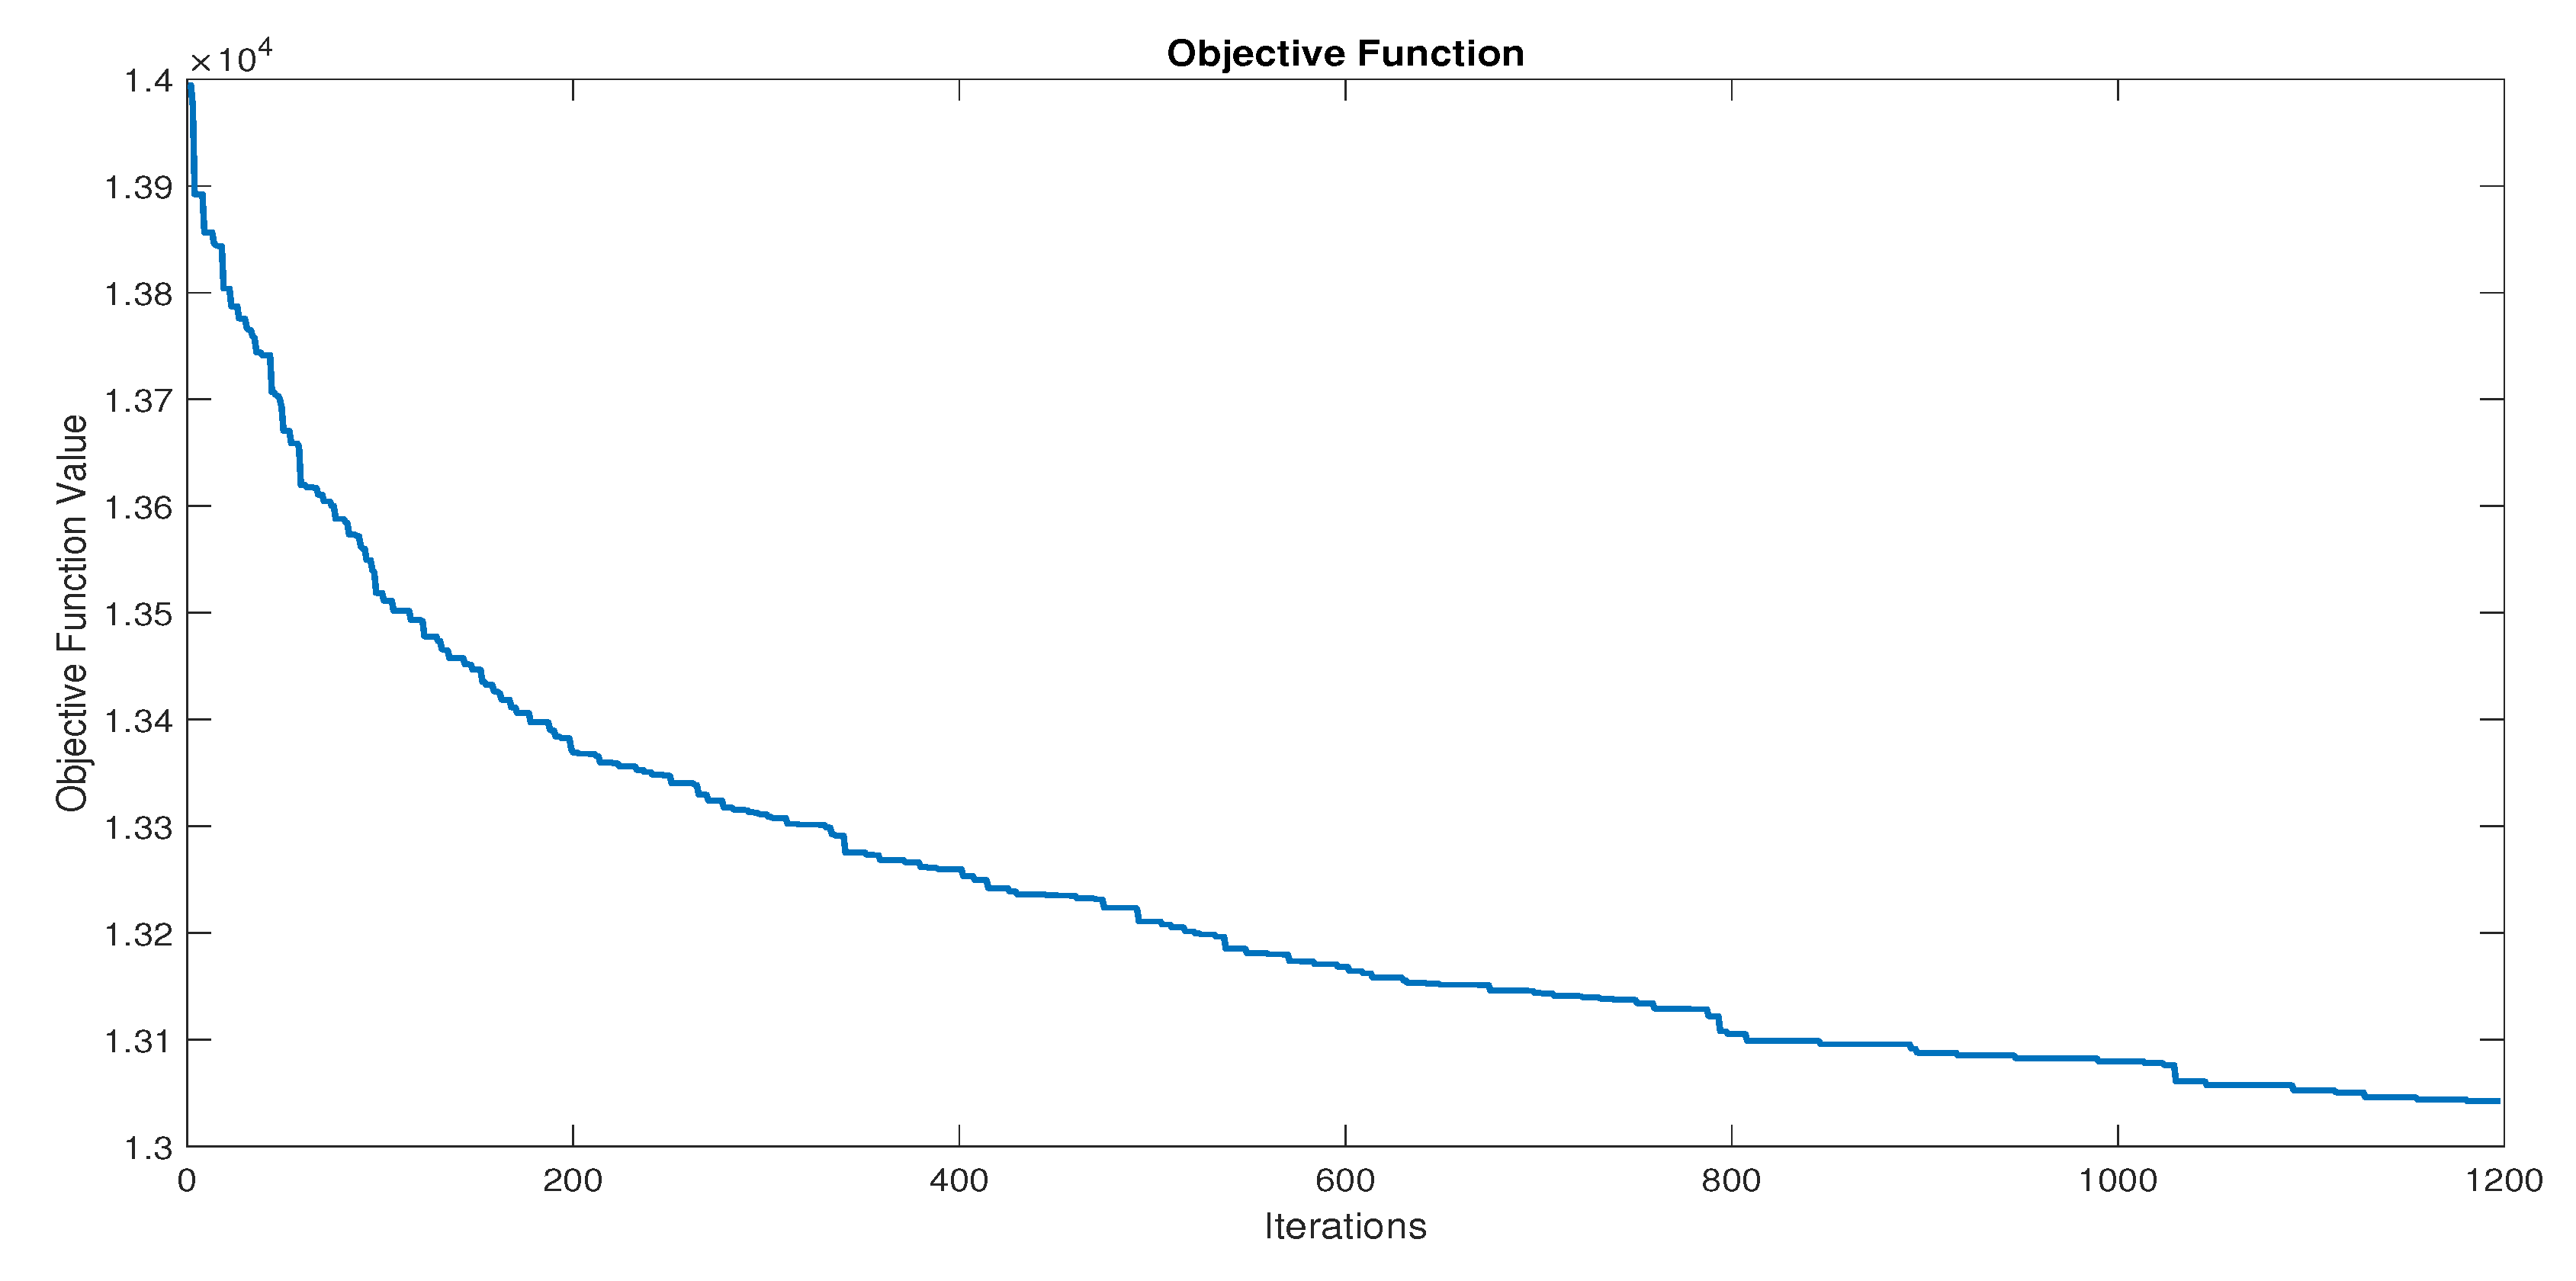
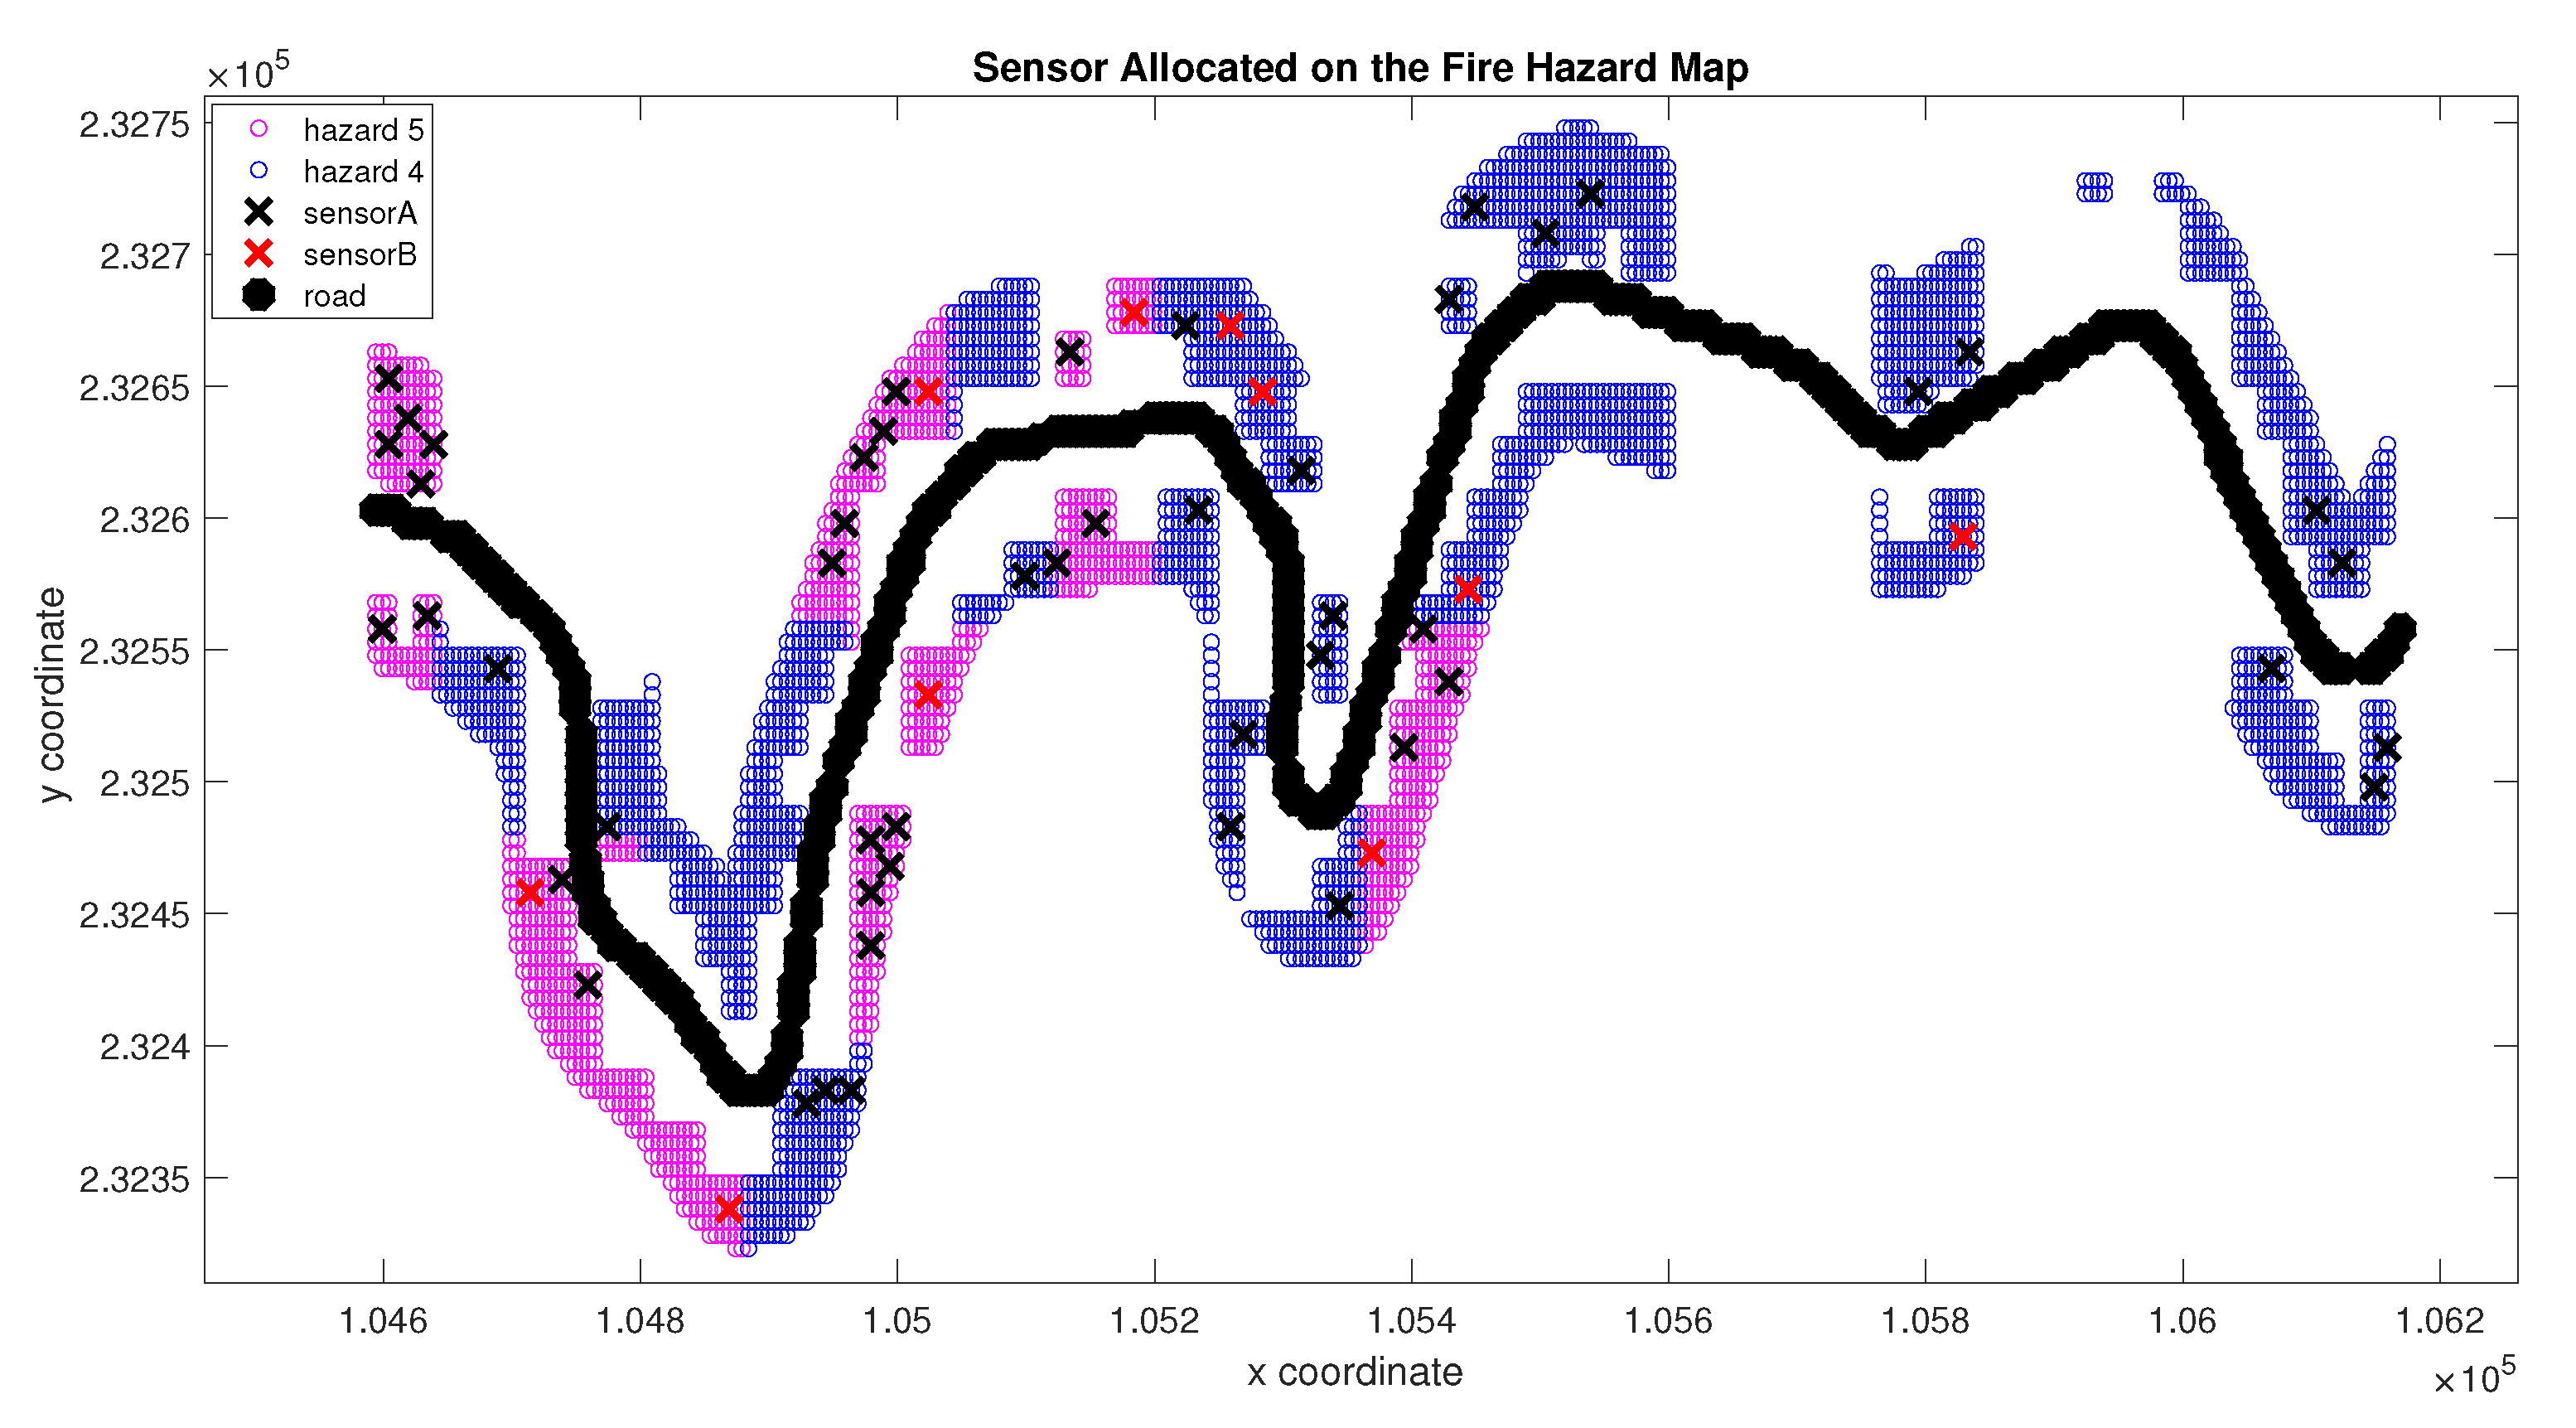
Observing Figure 5 is possible to analyse that the initial sum of fire hazard was 15,098. As the GA population evolves, the fire hazard is minimised. At the last iteration, the final fire hazard value is 13.042, resulting in no overlap. The sensor spreading proposed by the GA is illustrated in Figure 6 on the fire hazard map. By this arrangement, it is possible to reduce 2056 units of the fire hazard on Region 1, which corresponds to a decrease of % of the total fire hazard.
The gap (white points) in Figure 6 are points that do not satisfy the fire hazard, or the forest density imposed restrictions. As can be seen, the algorithm can spread the sensor inside the region defined to be monitored, avoiding overlap.
6.2. Result Obtained in Region 2
Region 2 has the aim to evaluate the algorithm performance in the interior of the forest. In this case, there are 4690 possible points to locate 50 Sensors Modules A and 10 Sensors Modules B. In this region, the total fire hazard equal to . The results of five runs are shown in Table 3. The average of the executed runs’ objective function was , needing 948 average iterations. It is possible to observe that the obtaining overlap is between and . So, even though overlap values different from zero, it is possible to say the sensor’s capacity is very well-used due to the low overlap values found.
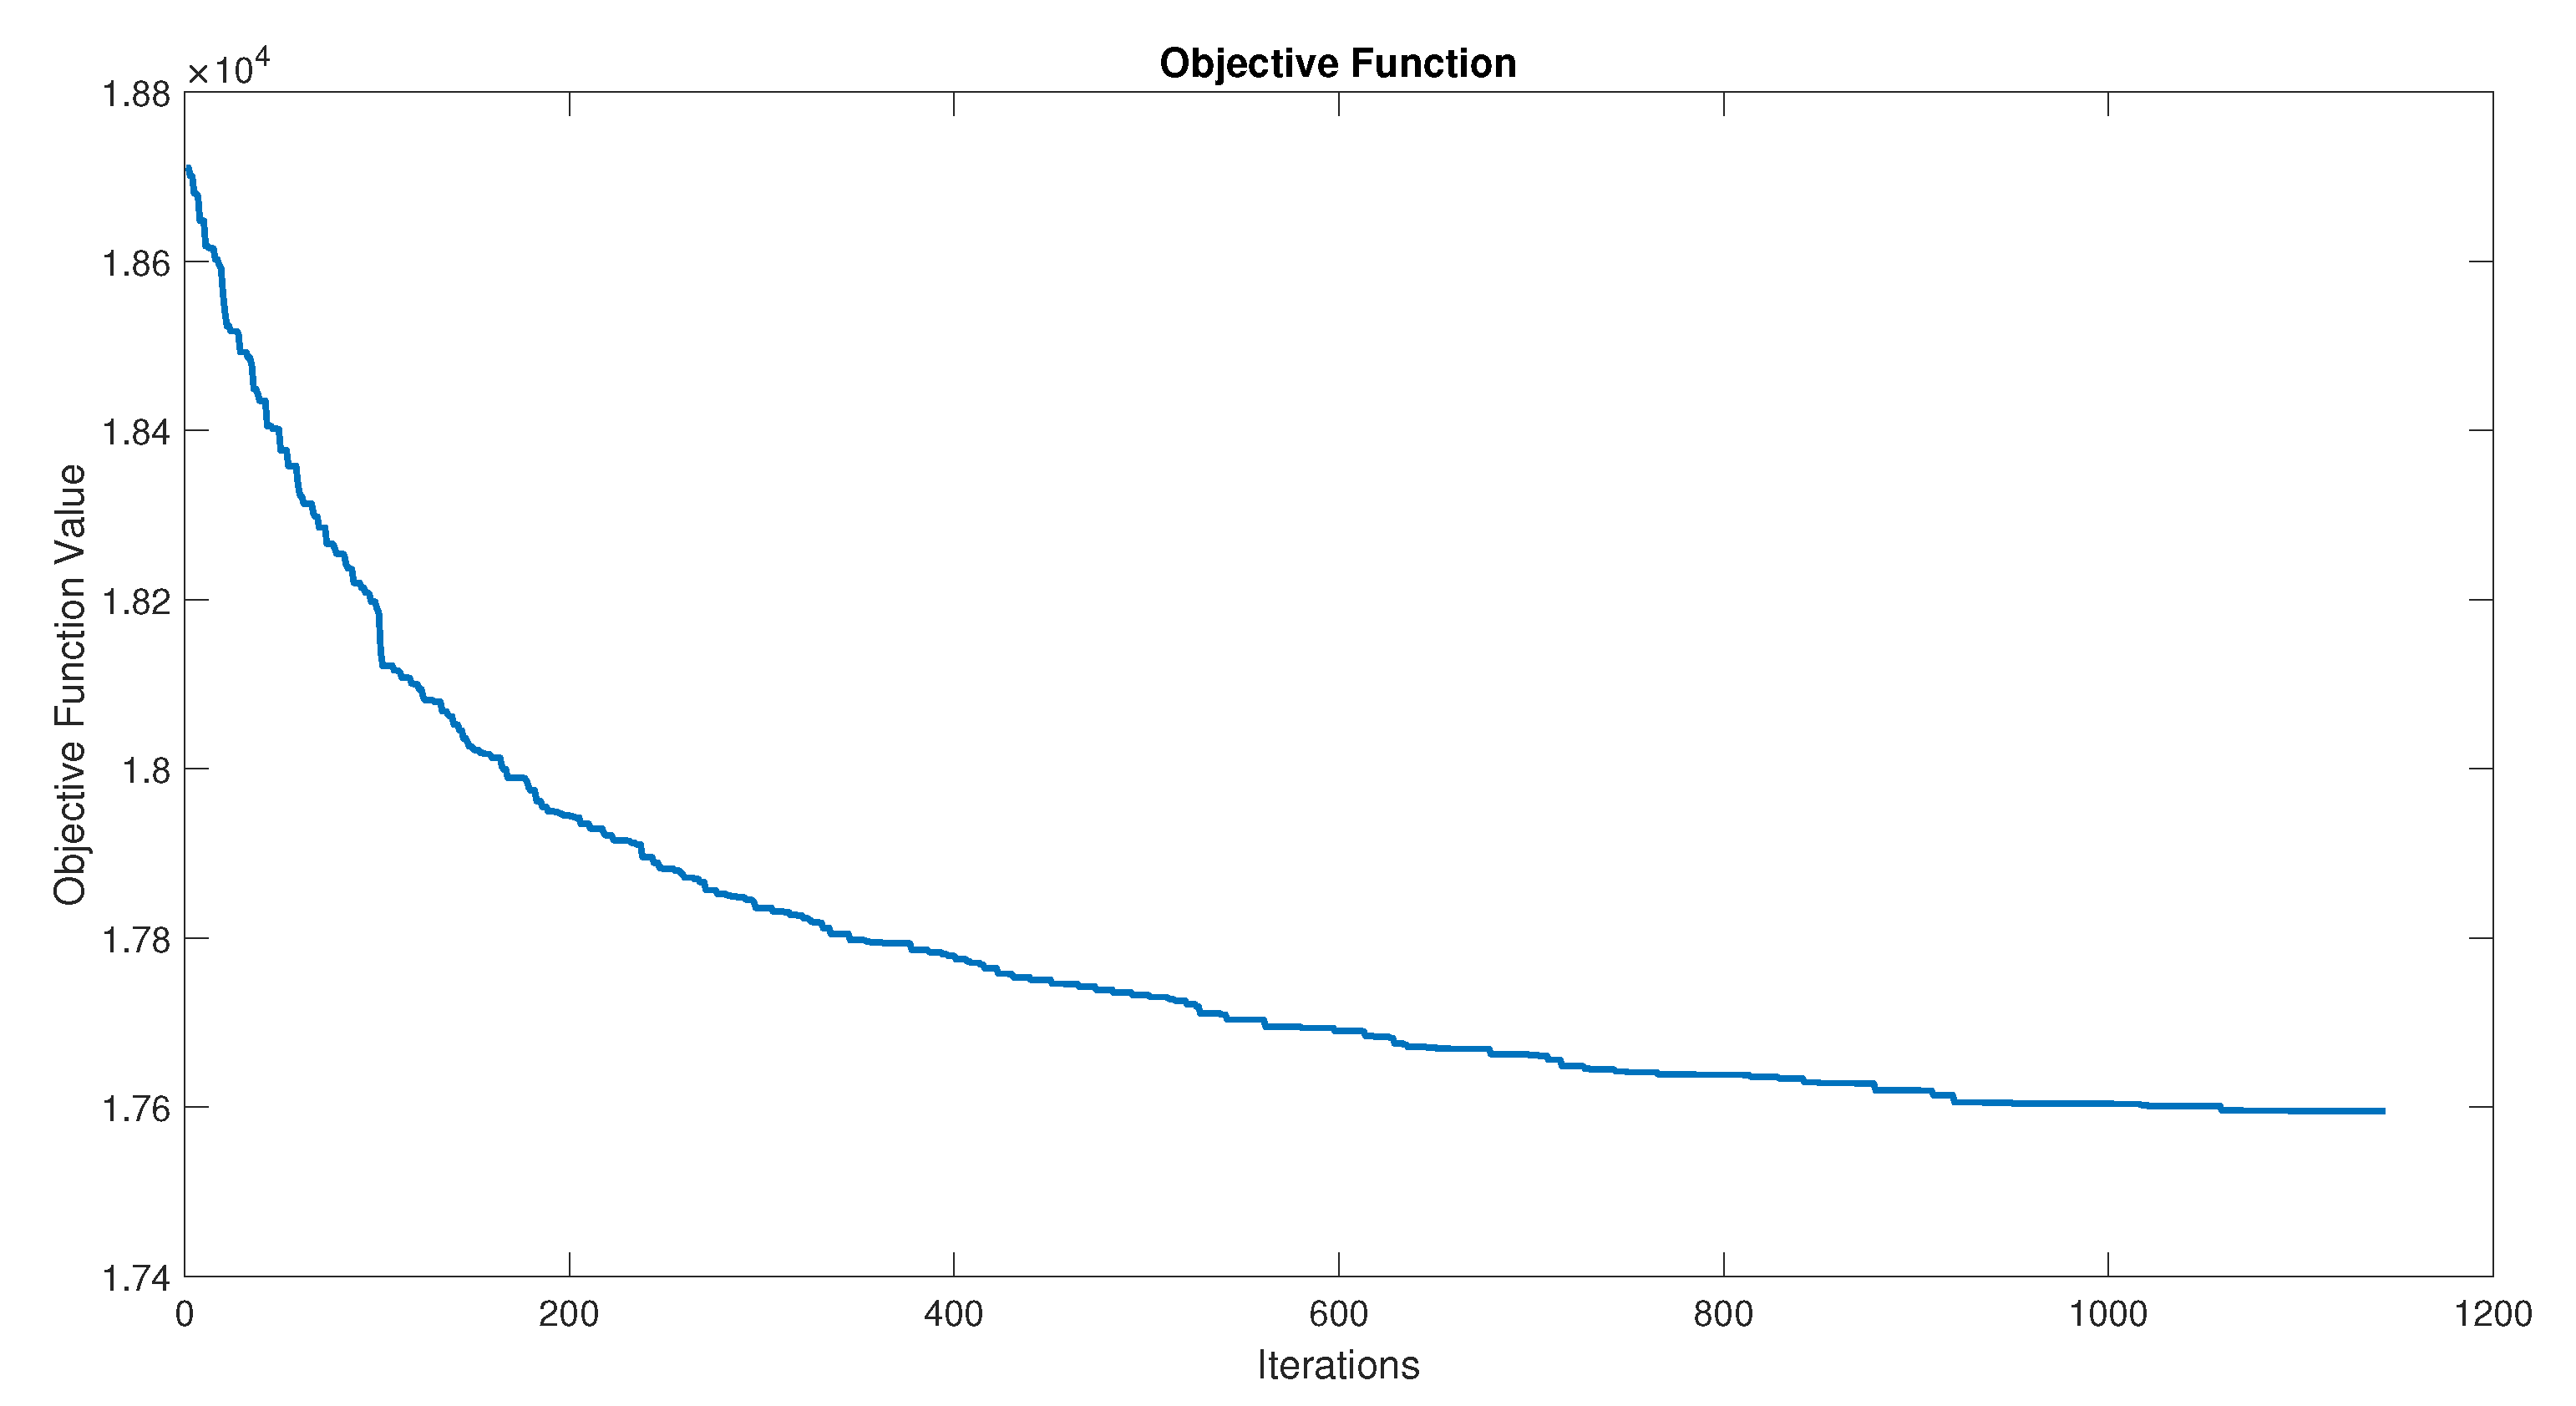
The best run was verified on the first execution, which presented the smallest objective function value and the smallest sum of fire hazards after the sensor’s allocation. At the optimum solution, the overlap is equal to . The objective function behaviour of the best execution is presented in Figure 7. The initial sum of forest hazard is equal to 19,660, and at the last iteration, the value of 17,584 is attached.
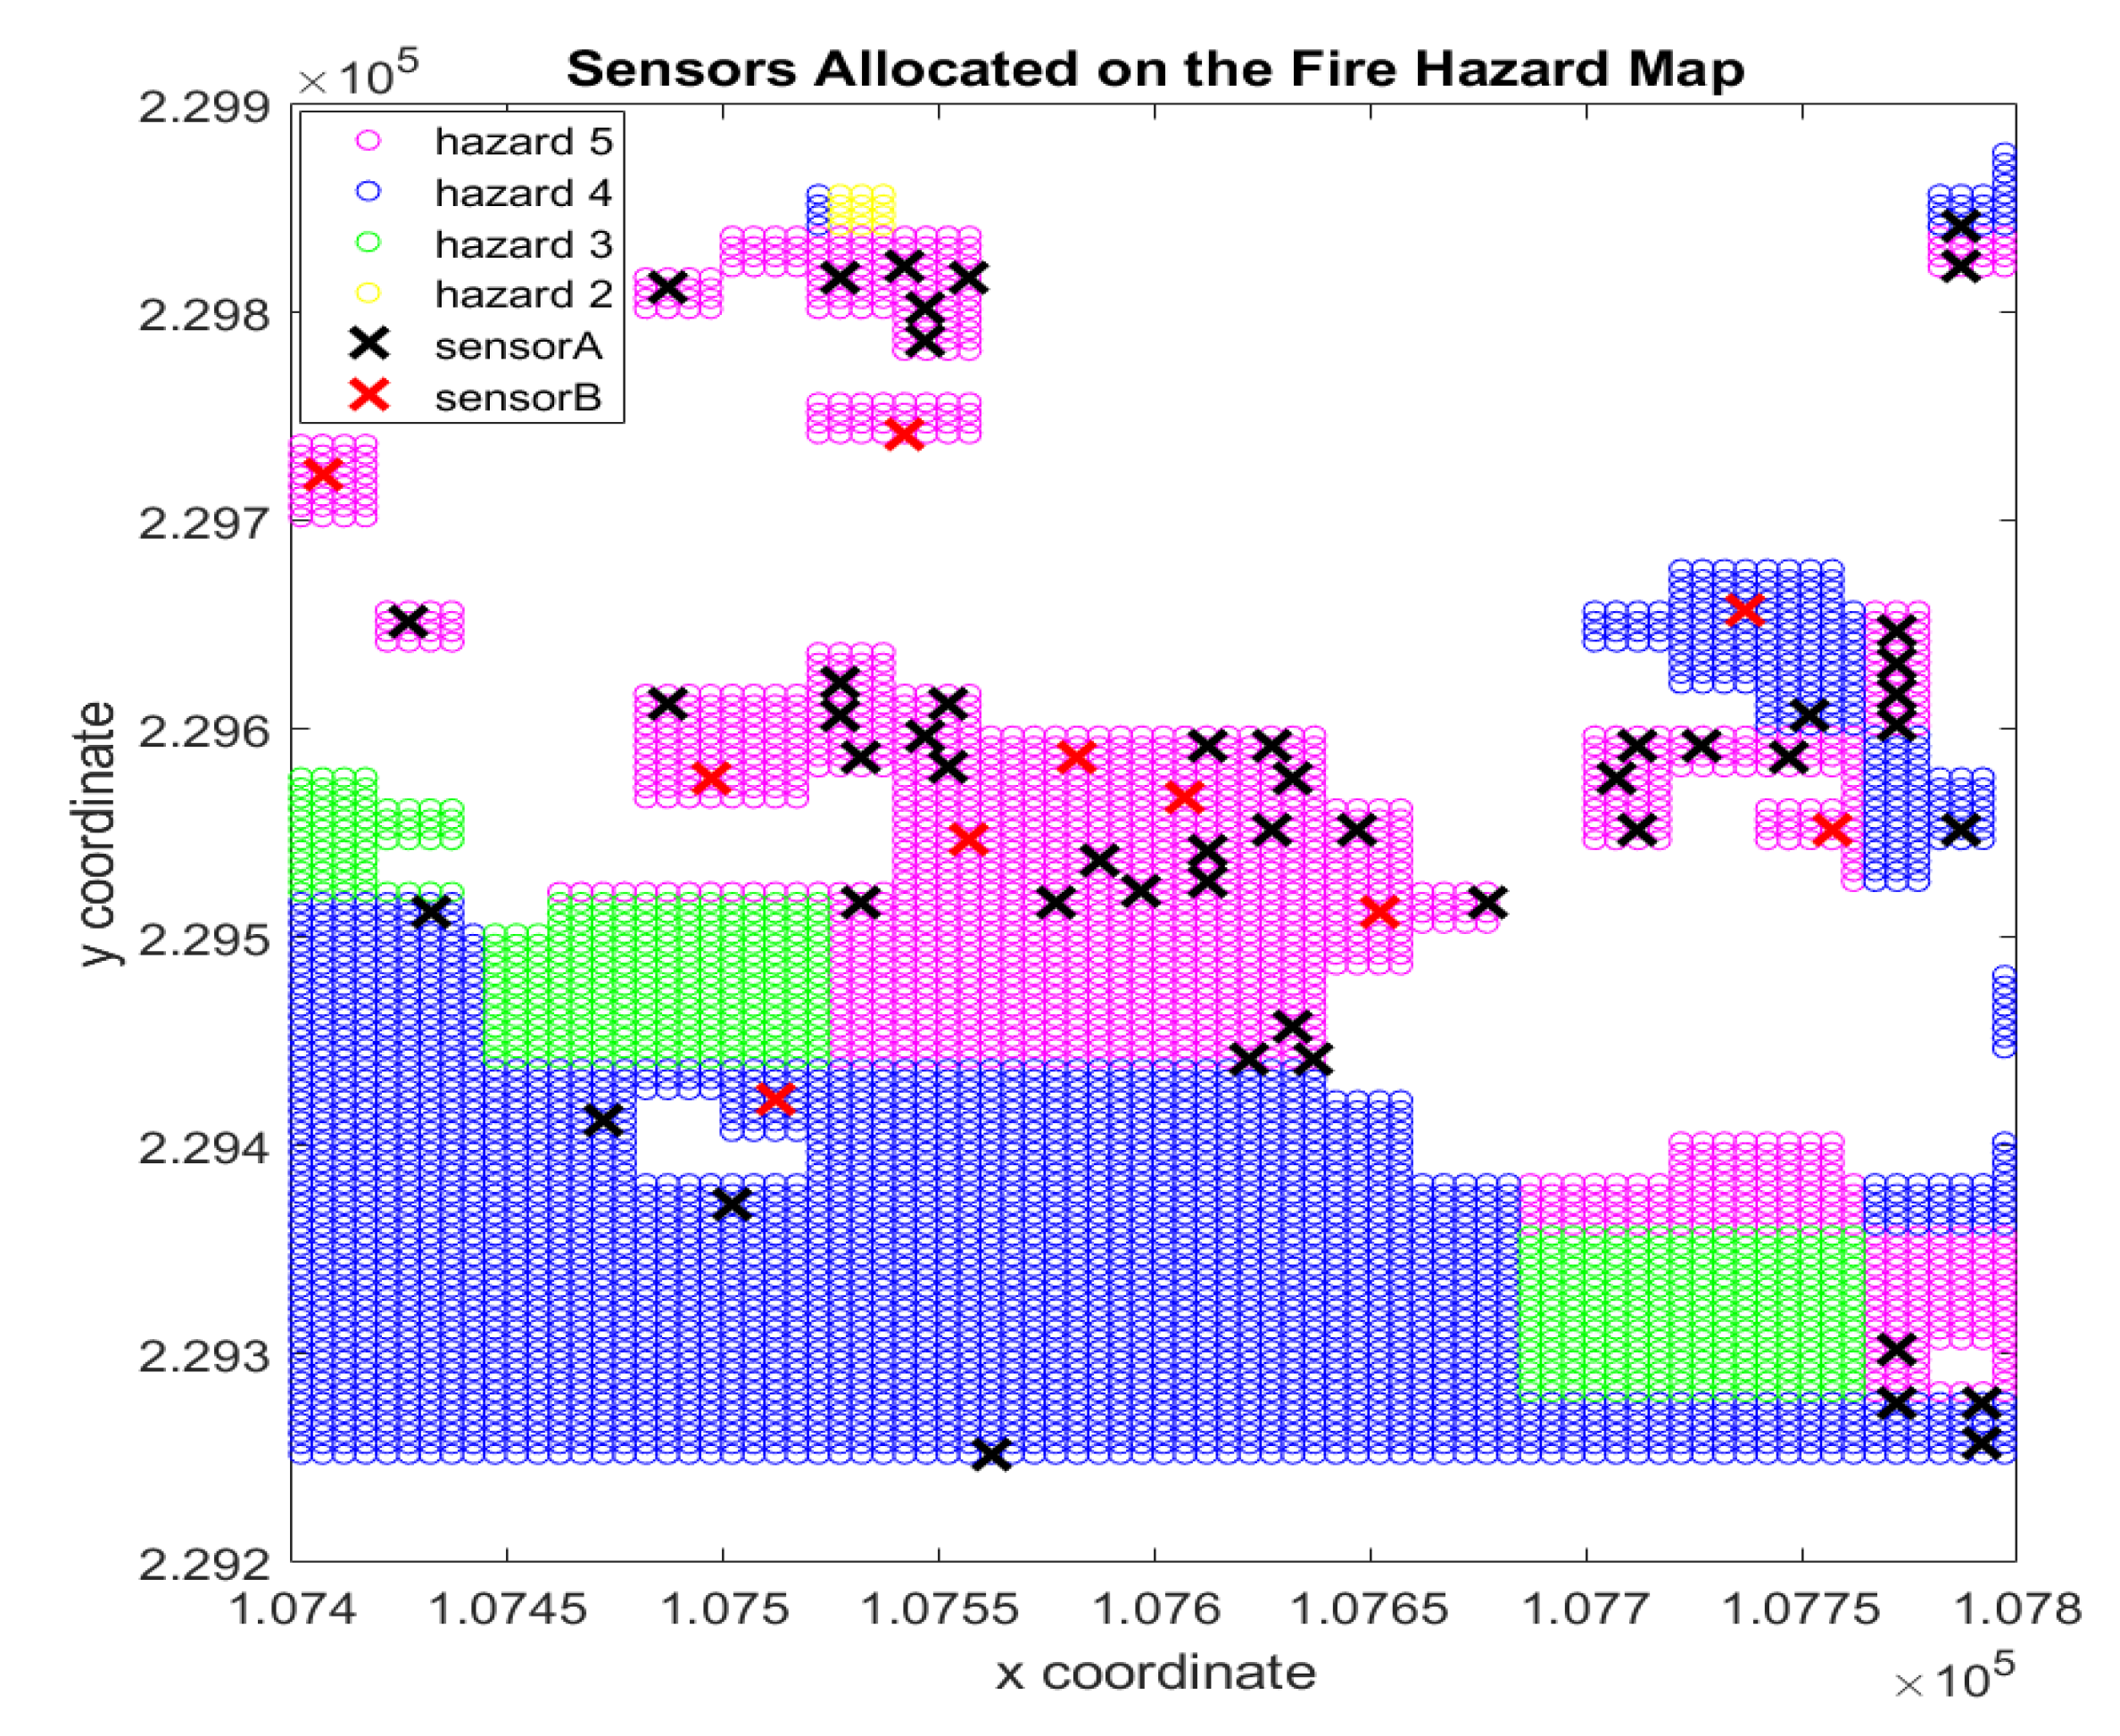
The sensor spreading proposed as optimum solution is illustrated in Figure 8 on fire hazard map. Similar occurs in the first region, the gaps are points that do not satisfy the fire hazard or the forest density restrictions. By this arrangement, it is possible to reduce 2076 units of the fire hazard on Region 2, and this value corresponds to % of the total fire hazard.
It is possible to see, in Figure 8, sensors significantly closer to each other, which can lead to the erroneous conclusion that the proposed sensor allocation could generate unnecessary overlaps. However, in situations like this, it is verified high forest density interference on the sensor reach, making the same for the objective function to allocate sensors near or far from each other. Besides, it is possible to validate this by the overlap value, which is near zero in all executions.
7. Conclusions and Future Work
Protecting forests is an emerging issue worldwide, given the enormous importance of these ecosystems to the planet. An efficient forest fire monitoring system is essential to reducing wildfire damage and supporting firefighters in decision-making when ignitions are detected. Therefore, the SAFe project proposes developing a forest monitoring system to send alerts when a fire ignition is detected. This study was addressed to define the optimum sensor allocation into two experimental regions. For this, an optimisation model is proposed, and a GA is implemented to provide the optimum solution to solve the sensor allocation problem.
The information about forest fire hazard and forest density is used as forest constraints. The sensors’ characteristics (type, quantity available, and maximum distance reach) were also considered in the model. Some data filters on the fire hazard and the forest density values were necessary to characterise the "Serra da Nogueira” problem and make the algorithm process a little challenging. The main purpose is to get a fire hazard equal to zero, but it is impossible due to cost, forest, and equipment constraints. Furthermore, considering the overlap value is always equal to or very close to zero, it is possible to conclude that the algorithm could use the maximum sensor resources and spread them to monitor the forest regions.
Due to the choice of two regions, composed of different characteristics, it was possible to evaluate the methodology under different conditions. For both regions, the algorithm indicates the optimum points in order to spread the sensors within the monitored region, avoiding overlaps. Some sensors were allocated very near each other, in regions with high forest density, since in these regions the sensor’s range is reduced to the minimum, promoting numerous optimal solutions in the optimisation problem. It was mainly noticed in Region 2 that the algorithm prioritises the points with a high fire hazard.
Most models and algorithms are developed for specific forest regions, which are difficult to reproduce. Thus, it is essential to highlight that model and the algorithm developed in this paper can be easily replicable in different regions and sensors with distinct conditions. It is intended to expand the monitored area into "Serra da Nogueira" using parallel computation to reduce the computational cost since 10 of a radial area provide an enormous quantity of possibilities to allocate sensors, which is hard to process. Besides, a new mathematical model will explore a multi-objective optimisation solution. This model will embed the sensor costs and the impacts of different quantity of sensors into the monitored region. In addition, it will provide a new strategy of decision support to manage the optimum quantity of sensors and their allocation into the forest monitoring problem.
Author Contributions
The contributions of the authors of this work are pointed as follows: Conceptualisation, A.I.P. and J.L.; Methodology, B.F.A. and A.I.P.; Software, B.F.A. and A.I.P.; Validation, B.F.A., T.B., and A.I.P.; Investigation, B.F.A., T.B., J.L., and A.I.P.; Data Curation, B.F.A., T.B.; Writing—Original Draft Preparation, B.F.A., T.B., J.L., and A.I.P.; Writing—Review and Editing, B.F.A., T.B., J.L., and A.I.P.; Visualisation, B.F.A., T.B.; Supervision, A.I.P., and J.L.; Project Administration, A.I.P. and J.L. All authors have read and agreed to the published version of the manuscript.
Funding
This research received no external funding.
Acknowledgments
The authors are grateful to the anonymous referees for their fruitful comments and suggestions. This work has been supported by Fundação La Caixa and FCT—Fundação para a Ciência e Tecnologia within the Project Scope: UIDB/05757/2020 and by SAFe Project through PROMOVE—Fundação La Caixa.
Conflicts of Interest
The authors declare no conflict of interest.
References
- Hernández, L. The Mediterranean Burns: WWF’s Mediterrenean Proposal for the Prevention of Rural Fires; WWF: Gland, Switzerland, 2019. [Google Scholar]
- ICNF. 8 Relatório de Incêncios Rurais 2019—01 de Janeiro a 15 de Outubro. 2019. Available online: http://www2.icnf.pt/portal/florestas/dfci/Resource/doc/rel/2019/2019-10-16-RPIR-08-01jan-15out.pdf (accessed on 21 October 2020).
- Keeley, J.E. Fire in mediterranean climate ecosystems—A comparative overview. Isr. J. Ecol. Evol. 2012, 58, 123–135. [Google Scholar]
- Keeley, J.E.; Bond, W.J.; Bradstock, R.A.; Pausas, J.G.; Rundel, P.W. Fire in Mediterranean Ecosystems: Ecology, Evolution and Management; Cambridge University Press: Cambridge, UK, 2011. [Google Scholar]
- Parente, J.; Pereira, M.G.; Amraoui, M.; Tedim, F. Negligent and intentional fires in Portugal: Spatial distribution characterization. Sci. Total Environ. 2018, 624, 424–437. [Google Scholar] [CrossRef] [PubMed] [Green Version]
- Xu, R.; Lin, H.; Lu, K.; Cao, L.; Liu, Y. A Forest Fire Detection System Based on Ensemble Learning. Forests 2021, 12, 217. [Google Scholar] [CrossRef]
- O’Connor, C.D.; Calkin, D.E.; Thompson, M.P. An empirical machine learning method for predicting potential fire control locations for pre-fire planning and operational fire management. Int. J. Wildland Fire 2017, 26, 587–597. [Google Scholar] [CrossRef]
- Hand, M.S.; Gebert, K.M.; Liang, J.; Calkin, D.E.; Thompson, M.P.; Zhou, M. Economics of Wildfire Management: The Development and Application of Suppression Expenditure Models, 1st ed.; Springer: Berlin, Germany, 2014. [Google Scholar]
- Molina, G.; Luna, F.; Nebro, A.J.; Alba, E. An efficient local improvement operator for the multi-objective wireless sensor network deployment problem. Eng. Optim. 2011, 43, 1115–1139. [Google Scholar] [CrossRef]
- Singh, A.; Rossi, A.; Sevaux, M. Matheuristic approaches for Q-coverage problem versions in wireless sensor networks. Eng. Optim. 2013, 45, 609–626. [Google Scholar] [CrossRef]
- Brito, T.; Pereira, A.I.; Lima, J.; Valente, A. Wireless Sensor Network for Ignitions Detection: An IoT approach. Electronics 2020, 9, 893. [Google Scholar] [CrossRef]
- Mahmound, M.A.I.; Ren, H. Forest Fire Detection Using a Rule-Based Image Processing Algorithm and Temporal Variation. Math. Probl. Eng. 2018, 2018, 1–8. [Google Scholar] [CrossRef] [Green Version]
- Amol, D.R. Prediction of Fire Propagation in Forest Areas using Genetic Algorithm. In Proceedings of the ITM Web of Conferences 32—ICACC-2020, Navi Mumbai, India, 27–28 June 2020; pp. 1–5. [Google Scholar]
- Hefeeda, M.; Bagheri, M. Wireless Sensor Networks for Early Detection of Forest. In Proceedings of the 2007 IEEE International Conference on Mobile Adhoc and Sensor Systems, Pisa, Italy, 8–11 October 2007; pp. 1–6. [Google Scholar]
- Hefeeda, M.; Bagheri, M. Randomized k-Coverage Algorithms For Dense Sensor Networks. In Proceedings of the IEEE International Conference on Computer Communications(INFOCOM), Anchorage, AK, USA, 6–12 May 2007; pp. 2376–2380. [Google Scholar]
- Hong, H.; Tsangaratos, P.; Ilia, I.; Liu, J.; Zhu, A.; Xu, C. Applying genetic algorithms to set the optimal combination of forest fire related variables and model forest fire susceptibility based on data mining models. The case of Dayu County, China. Sci. Total Environ. 2018, 630, 1044–1056. [Google Scholar] [CrossRef] [PubMed]
- Alessandri, A.; Bagnerini, P.; Gaggero, M.; Mantelli, L. Parameter Estimation of Fire Propagation Models Using Level Set Methods. Appl. Math. Model. 2020, 92, 731–747. [Google Scholar] [CrossRef]
- Hernández Encinas, L.; Hoya White, S.; Martín del Rey, A.; Rodríguez Sánchez, G. Modelling forest fire spread using hexagonal cellular automata. Appl. Math. Model. 2007, 31, 1213–1227. [Google Scholar] [CrossRef]
- Alexandridis, A.; Vakalis, D.; Siettos, C.I.; Bafas, G.V. A cellular automata model for forest fire spread prediction: The case of the wildfire that swept through Spetses Island in 1990. Appl. Math. Comput. 2008, 204, 191–201. [Google Scholar] [CrossRef]
- Kumar, M.; Cohen, K. Genetic Algorithm based Simulation-Optimization Technique for Fighting Forest Fires. Int. J. Comput. Methods 2013, 10, 1–28. [Google Scholar]
- QGIS Development Team. QGIS Geographic Information System; QGIS Association: 2021. Available online: https://qgis.org/en/site/ (accessed on 5 April 2020).
- Copernicus. European Union’s Earth Observation Programme. 2019. Available online: https://www.copernicus.eu (accessed on 20 August 2020).
- Varnes, D.J. Landslide Hazard Zonation: A Review of Principles and Practices; Unesco: Paris, France, 1984. [Google Scholar]
- Verde, J.C. Avaliação da Perigosidade de Incêndio Florestal. Ph.D. Thesis, University of Lisbon, Lisbon, Portugal, 2010. [Google Scholar]
- Zêzere, J.L.; Reis, E.; Garcia, R.; Oliveira, S.; Rodrigues, M.L.; Vieria, G.; Ferreira, A.B. Integration of spatial and temporal data for the definition of different landslide hazard scenarios in the area north of Lisbon (Portugal). Nat. Hazards Earth Syst. Sci. 2004, 4, 133–146. [Google Scholar] [CrossRef]
- Haupt, R.; Haupt, S.E. Practical Genetic Algorithms, 2nd ed.; John Wiley & Sons: Hoboken, New Jersey, 2004. [Google Scholar]
- Pham, D.; Karaboga, D. Intelligent Optimisation Techniques: Genetic Algorithms, Tabu Search, Simulated Annealing and Neural Networks, 1st ed.; Springer: Berlin, Germany, 2000. [Google Scholar]
- LoRa Alliance. A Technical Overview of LoRa and LoRaWAN; LoRa Alliance: Fremont, CA, USA, 2015; Available online: https://lora-alliance.org/resource_hub/what-is-lorawan/ (accessed on 20 December 2020).
- The MathWorks Inc. Matlab; The MathWorks Inc.: USA, 2020; Available online: https://www.mathworks.com/products/matlab.html (accessed on 10 July 2020).
Figure 1.
Forest experimental regions.

Figure 2.
Fire hazard maps of the forest regions.

Figure 3.
Forest density maps of the forest regions.

Figure 4.
Forest simulation.

Figure 5.
Objective function behaviour of the optimum solution for Region 1.

Figure 6.
Optimum solution to spread sensor on Region 1.

Figure 7.
Objective function behaviour of the optimum solution for Region 2.

Figure 8.
Optimum solution to spread sensor on Region 2.


Table 1.
Forest density and fire hazard map.
| 0 | 5 | ||
| 69 | 5 | ||
| 23 | 4 | ||
| ⋮ | ⋮ | ⋮ | ⋮ |
Table 2.
Algorithm results for region 1.
| Runs | Obj. Func. | Iterations | Overlap | Final Fire Hazard |
|---|---|---|---|---|
| 1 | 13,084 | 1201 | 0,0000 | 13,084 |
| 2 | 13,201 | 715 | 0,0243 | 13,199 |
| 3 | 13,042 | 1198 | 0,0000 | 13,042 |
| 4 | 13,083 | 1093 | 0,1304 | 13,077 |
| 5 | 13,087 | 1201 | 0,0000 | 13,087 |
Table 3.
Algorithm results for Region 2.
| Runs | Obj. Func. | Interactions | Overlap | Final Fire Hazard |
|---|---|---|---|---|
| 1 | 17,595 | 1144 | 0,2177 | 17,584 |
| 2 | 17,627 | 849 | 0,1969 | 17,618 |
| 3 | 17,602 | 1031 | 0,1141 | 17,596 |
| 4 | 17,614 | 1143 | 0,5537 | 17,586 |
| 5 | 17,684 | 572 | 0,0343 | 17,682 |
Publisher’s Note: MDPI stays neutral with regard to jurisdictional claims in published maps and institutional affiliations. |
© 2021 by the authors. Licensee MDPI, Basel, Switzerland. This article is an open access article distributed under the terms and conditions of the Creative Commons Attribution (CC BY) license (https://creativecommons.org/licenses/by/4.0/).
Share and Cite
MDPI and ACS Style
Azevedo, B.F.; Brito, T.; Lima, J.; Pereira, A.I. Optimum Sensors Allocation for a Forest Fires Monitoring System. Forests 2021, 12, 453. https://0-doi-org.brum.beds.ac.uk/10.3390/f12040453
AMA Style
Azevedo BF, Brito T, Lima J, Pereira AI. Optimum Sensors Allocation for a Forest Fires Monitoring System. Forests. 2021; 12(4):453. https://0-doi-org.brum.beds.ac.uk/10.3390/f12040453
Chicago/Turabian StyleAzevedo, Beatriz Flamia, Thadeu Brito, José Lima, and Ana I. Pereira. 2021. "Optimum Sensors Allocation for a Forest Fires Monitoring System" Forests 12, no. 4: 453. https://0-doi-org.brum.beds.ac.uk/10.3390/f12040453
Note that from the first issue of 2016, this journal uses article numbers instead of page numbers. See further details here.