Article

Impact of Roadside Drying on Delivered Costs for Eucalyptus globulus Logging Residue and Whole Trees Supplying a Hypothetical Energy Plant in Western Australia Using a Linear-Programming Model

by
Martin Strandgard
1,2,*,
Mohammad Sadegh Taskhiri
1,
Mauricio Acuna
2 and
Paul Turner
1
1
ARC Centre for Forest Value, eLogistics Research Group (eLRG), Discipline of ICT, College of Science and Engineering, University of Tasmania, Hobart, TAS 7001, Australia
2
Forest Industries Research Centre, University of the Sunshine Coast, Locked Bag 4, Maroochydore, QLD 4558, Australia
*
Author to whom correspondence should be addressed.
Submission received: 24 February 2021 / Revised: 1 April 2021 / Accepted: 1 April 2021 / Published: 9 April 2021

Abstract

:
Australia’s large potential forest bioenergy resource is considerably underutilised, due largely to its high delivered costs. Drying forest biomass at the roadside can potentially reduce its delivered cost through weight reduction and increased net calorific value. There has been little research on the impact of roadside drying for Australian conditions and plantation species. This study compared delivered costs for three forest biomass types—Eucalyptus globulus plantation whole trees and logging residue (LR)-disaggregated (LR conventional) or aggregated (LR fuel-adapted)—and three roadside storage scenarios—no storage, ≤two-month storage and optimal storage—to supply a hypothetical thermal power plant in south-west Western Australia. The study was performed using a tactical linear programming tool (MCPlan). Roadside storage reduced delivered costs, with optimal storage (storage for up to 14 months) producing the lowest costs. Delivered costs were inversely related to forest biomass spatial density due to transport cost reductions. Whole trees, which had the highest spatial density, stored under the optimal storage scenario had the lowest delivered costs (AUD 7.89/MWh) while LR conventional, with the lowest spatial density, had the highest delivered costs when delivered without storage (AUD 15.51/MWh). For both LR types, two-month storage achieved ~60% of the savings from the optimal storage scenario but only 23% of the savings for whole trees. The findings suggested that roadside drying and high forest biomass spatial density are critical to reducing forest biomass delivered costs.

1. Introduction

Worldwide interest has increased in the use of bioenergy, such as forest biomass (FB) (trees, logs, logging residue (LR), bark and stumps [1]), to reduce greenhouse gas emissions [2] and dependence on imported fuels [3]. Major FB sources include unutilised tree parts/trees remaining after harvest, extraction and processing of commercial roundwood, trees rendered non-commercial through damage by insects, disease, fire or windthrow, and short-rotation dedicated energy plantations. Industrial use of forest bioenergy is well-developed in the northern hemisphere [4] but is comparatively under-utilised elsewhere. Australia, for example, has a large potential forest bioenergy resource [5] but currently supplies <2% of its energy needs from FB [6].
A major impediment to the expanded use of forest bioenergy is its high cost relative to other energy sources [7]. High FB supply chain costs, particularly for transport and comminution [8], primarily result from its high moisture content (MC), low energy, bulk and spatial densities and high spatial and temporal variability in quantity [9,10].
Primary FB transport costs can be reduced through logging residue aggregation using fuel-adapted harvesting [11] or roadside processing [12]; however, soil contamination can occur where whole trees are skidded to roadside [13]. Natural drying of FB infield or at roadside can be a cost-effective means to reduce secondary transport costs through weight reduction and increased net calorific value [14,15,16]. Natural drying can also increase FB value, where delivered MC is a component of pricing, and reduce road maintenance costs through reduced truck trips [17]. Where FB is used for bioenergy in Australia, it is either comminuted and transported with minimal storage time or, where there is recognition of the value of natural drying, stored at roadside for a fixed length of time (typically one to two months), prior to comminution and secondary transport.
The emerging Australian bioenergy industry has focussed on plantation LR as the major potential FB resource (>7,000,000 t/year potentially available [18]). Major commercial plantation species in Australia include Pinus spp. (predominantly P. radiata) for sawlogs and pulplogs and Eucalyptus globulus and E. nitens for export woodchips, with approximately 1,000,000 ha of Pinus and 900,000 ha of Eucalyptus plantations. Australian plantations are harvested using either cut-to-length at the stump or whole tree processing at roadside harvest systems. Other potential bioenergy sources under consideration in Australia include failed or underperforming short-rotation eucalypt plantation trees [19], thinned trees without an alternative market [20] or FB from mechanical fuel reduction treatments [21]. Diverting wood waste from landfill is another potential bioenergy source, though contamination and heterogeneity of the resource can increase recovery costs [22,23].
A broad analysis of FB supply chain costs, including harvest, transport, storage and processing costs and material losses, is required to assess its commercial viability as a bioenergy source and to compare delivered costs of potential FB sources. This is particularly relevant to natural drying, which involves a trade-off between gains from drying against storage costs [24], increased comminution costs [25], material losses [26] and FB deterioration [27]. Research aimed at reducing FB supply chain costs has led to the development of numerous mathematical models and tools in recent decades, predominantly targeted at strategic and tactical planning levels [16]. Strategic planning defines a broad overview of a business’s direction, including long-term harvest levels and facility size and location. Tactical planning identifies areas to be harvested over a one-to-five-year period. Few published FB supply chain tools have considered the impact of infield or roadside drying on costs and returns and even fewer have used models to estimate natural drying rates [16]. As FB is typically also stored at the power plant (and/or at intermediate locations), consideration may also be made in an FB supply chain tool of MC changes from natural drying at these locations.
The objective of this paper was to compare the impact of roadside drying on the delivered costs of chipped Eucalyptus globulus whole trees and LR obtained from either a conventional CTL harvest system or a fuel-adapted harvest system. The comparison was conducted using a tactical-level linear-programming model to compare delivered costs for each FB type supplying a hypothetical thermal power plant in south-west Western Australia under three storage scenarios: no storage, two months of storage and the optimal storage duration to minimise delivered costs.

2. Materials and Methods

2.1. Study Description

The system under study includes harvest, primary and secondary transport and chipping of E. globulus LR or whole trees to supply a hypothetical 10 MWe thermal power plant located in south-west Western Australia to produce electricity. Moving grate and fluidised bed boilers of this capacity are able to accept FB with a wide range of MC values [28]. The region has over 200,000 ha of E. globulus plantations managed on a 10–15 year rotation to produce export woodchips [29]. The hypothetical power plant would require 20,000–25,000 MWh of energy input per month, supplied using E. globulus LR (branches, stem tops and bark) or whole trees (aboveground biomass without the stump). Monthly energy requirements reflect seasonal variations in electricity demand in Western Australia [30].
The availability of LR from individual plantations in the study area is dependent on a number of factors, including company policies and attitudes regarding LR retention, current site preparation practices (LR removal can considerably reduce site preparation costs [31] and whether the current rotation is the final rotation (for underperforming plantations or areas leased from farmers). As there have been no published studies on the availability of E. globulus plantation LR in the studied region, a conservative estimate of LR from approximately one-third of the annual E. globulus plantation harvest was assumed to be available in the study (395,000 m3). Six supply regions were set up for the study, representing regions with a one-way transport distance of 25 km, 50 km, 75 km, 100 km, 125 km and 150 km. The wood availability in each supply region (25,000 m3, 30,000 m3, 45,000 m3, 60,000 m3, 90,000 m3, 145,000 m3) broadly matches that available from plantation areas surrounding the city of Albany in south-west Western Australia. The maximum one-way transport distance of 150 km was based on a study in the same area as the current study [32].

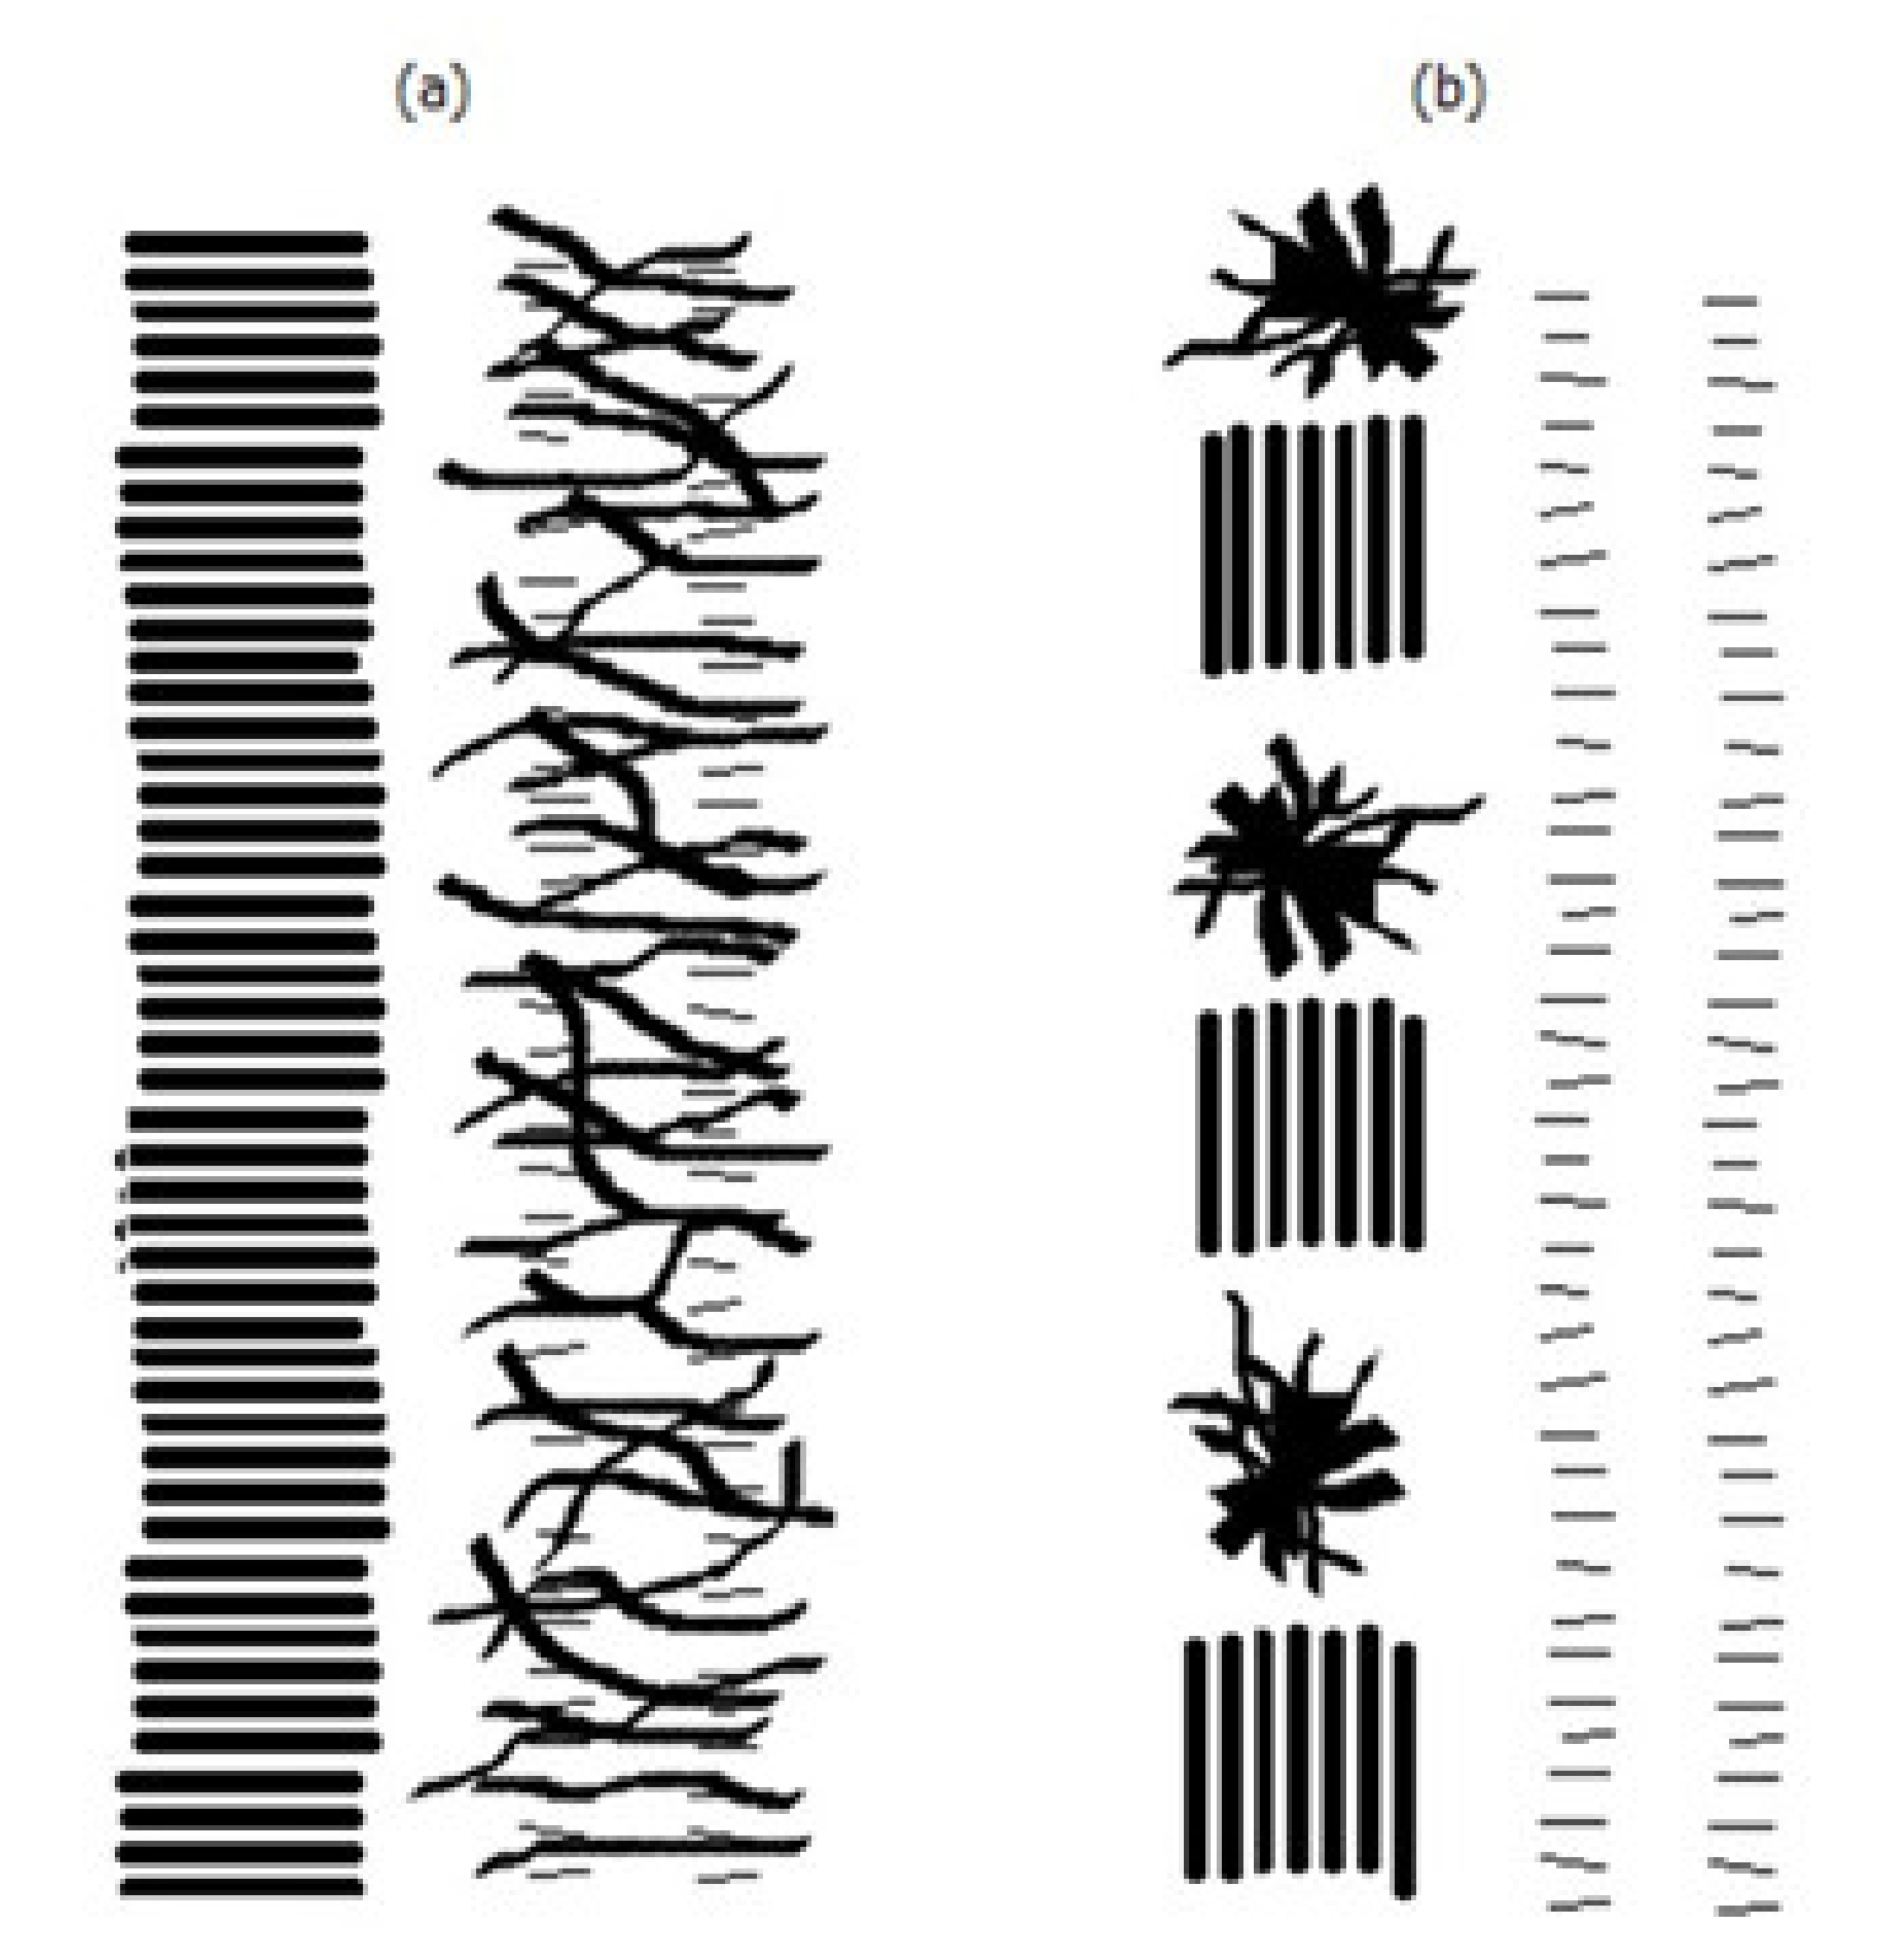
2.2. Forest Biomass Supply Chains
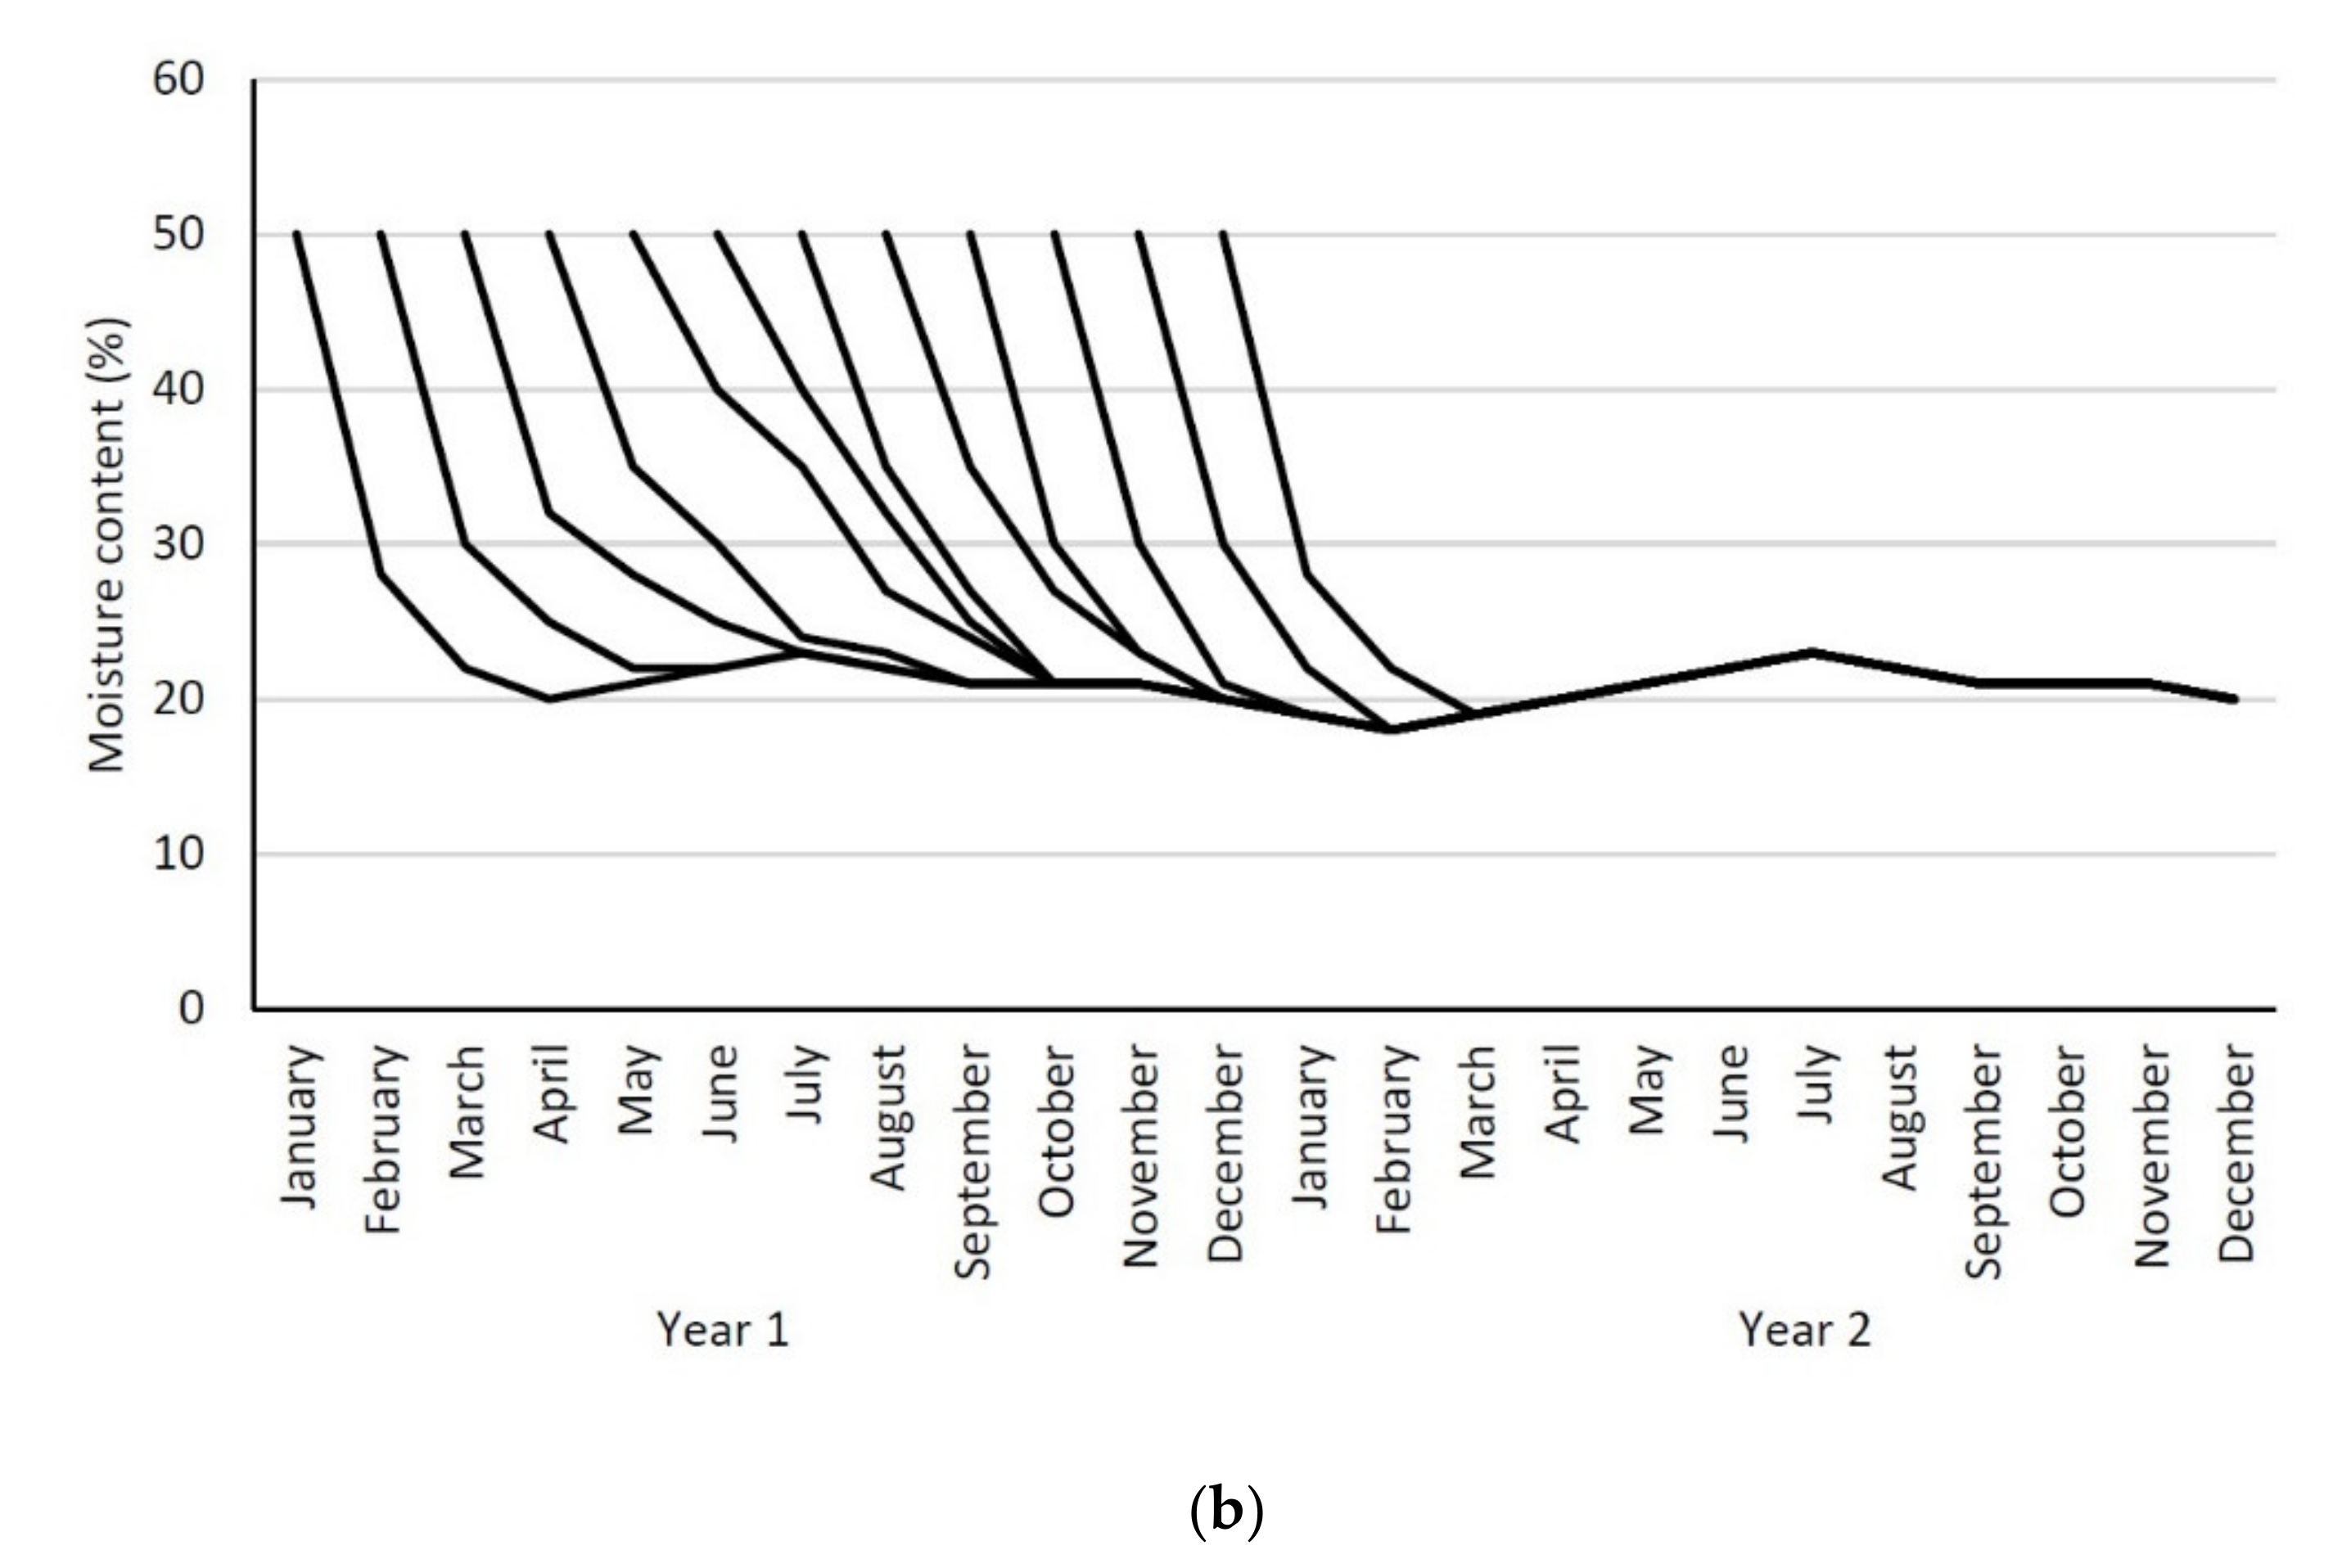
Three E. globulus FB supply chains were modelled:
  • Whole trees;
  • LR conventional: LR scattered over harvester path during harvest (Figure 1a);
  • LR fuel-adapted: LR piled alongside logs during harvest (Figure 1b).
Whole trees were felled and bunched with a feller–buncher and transported to roadside by grapple skidders. LR was harvested in an integrated double-pass operation [33] with a harvester/processor and unmodified forwarder.
The yields for each FB type are shown in Table 1. As the whole trees scenario includes the stem and most of the foliage and branches, it had a considerably higher yield than the LR types. The LR fuel-adapted scenario was able to extract considerably more of the LR than the LR conventional scenario as the LR is piled during processing of the trees to logs. It should also be noted that the LR includes bark, which can have a yield equivalent to 10% of the stemwood mass [34].
For the three modelled supply chains, FB was chipped at roadside directly into trucks prior to secondary transport. LR harvest costs were set to zero as they were assumed to be included in roundwood harvest costs. The studied FB supply chains were modelled from the tree at time of harvest to delivery of chips at the power plant. Year-round access to stored FB is available as the majority of E. globulus plantations in the region were established on ex-pasture sites with little slope, close to major roads. Modelled FB supply chains were compared in terms of their delivered cost.
Three storage scenarios were studied: no storage (NS), up to two-month storage at roadside (TM) and storage at roadside for the optimal period of time (OS). FB was not stored infield prior to storage at roadside. Model parameters for each FB type and scenario are listed in Table 1. Modelled FB supply chain activities were harvest, primary transport, storage, chipping and secondary transport.
Six-axle semi-trailers were used for secondary chip transport for all scenarios. Semi-trailers are widely used in Australia to transport logs and chips as they can access roads that are inaccessible to larger trucks due to mass limits and road conditions [38]. Based on Australian forest haulage company data and manufacturer specifications, semi-trailer load capacity for transporting chips was set as 26.5 t and 75 m3.
The study assumed that there were no limitations for truck numbers and chipping and unloading capacities and no delays along the supply chain, and no intermediate storage was required. MC was expressed on a wet basis. Whole tree stands were not re-established.

2.3. Drying Curves

The generalised natural drying curves used in the study were based on roadside drying studies of E. globulus LR [39] and whole trees [40] (Figure 2). Note that drying can commence in any month across the two years modelled in MCPlan (Section 2.4). However, for clarity, only drying curves for drying commencing in the 1st year are shown in Figure 2.

2.4. Optimisation Model

MCPlan is a linear programming model developed to optimise timber and biomass supply chains [41,42]. The model is implemented with Visual Basic™ macros and solved with the What’s best™ solver add-in for MS Excel™. The objective function minimises total supply chain costs (delivered costs).
MCPlan has a two-year planning horizon divided into monthly steps. Trees can be harvested in any month over the two-year period but only delivered to the power plant in the second year.
In MCPlan, LR is produced as a by-product of log production. For the current study, the energy content and costs associated with logs in MCPlan were set to zero so that MCPlan determined the optimal least-cost solution solely on the basis of delivering the quantity of FB chips required to meet monthly energy requirements for each storage scenario. Whole trees were modelled as LR in MCPlan, as LR is chipped at roadside whereas logs are chipped at the power plant.
Sets, parameters and variables used in the mathematical model implemented in MCPlan are listed in Table 2.
The objective function is presented in Equation (1) and the constraints are listed in Equations (2)–(8). The objective function minimises total supply chain costs (delivered costs) including the following components:
  • harvesting and primary transport of logs and FB to roadside;
  • drying of logs and FB at roadside;
  • secondary transport of logs and FB chips.
The objective function (Equation (1)) assumptions were:
  • Collection and transport of logs and FB to roadside occur at the time of harvest; this cost varies by supply area and depends on the MC of logs and FB;
  • Drying cost only depends on the length of storage of logs and FB at the roadside;
  • Chipping cost depends on the MC of logs and FB. The assumption is that chipping of materials with a reduced MC increases blade tear-out, increasing their maintenance and replacement costs [25].
Min = i j s Χ i j s × C T R W i j s + C H R W i s + C D R W i j + C C H R W i j   +   i j s Y i j s × C H L R i s + C D L R i j + C C H L R i j + i j s Y i j s × C T L R i j s
Equation (2) ensures that the availability of solid volume logs in each supply area is not exceeded.
i j Χ i j s     S C R W s s   S
Equation (3) ensures that, for any period, the solid volume of FB collected does not exceed its availability. The latter is determined by the solid volume of logs harvested in a period and the biomass factor in the supply area.
j Χ i j s ×   B F s     j Y i j s i   I , s S
Equation (4) ensures that the demand for energy at the energy plant is met in each period.
i s Χ i j s × E C R W i j   +   i s Y i j s × E C L R i j     E D j j   J
Equations (5) and (6) ensure that the logs and FB chips are delivered within the user-specified MC range to the energy plant.
i s Χ i j s × M i n M C R W   i s Χ i j s ×   M C R W i j     i s Χ i j s   ×   M a x M C R W j   J
i s Y i j s × M i n M C L R   i s Y i j s ×   M C L R i j     i s Y i j s   ×   M a x M C L R j   J
Equation (7) allows the maximum length of storage to be set.
j > i Χ i j s = 0   i I , s   S
Equation (8) establishes the non-negativity of decision variable Xijs.
Χ i j s 0 ,     i I , j J , s   S

2.5. Sensitivity Analysis

Sensitivity analyses were performed on harvest and primary transport costs, storage losses and MC.
Harvest/primary transport costs can vary based on factors including tree and equipment characteristics, operator experience and site conditions. Based on published values, harvest/primary transport costs were varied by +/−10%.
Published monthly storage losses for LR and whole trees varied between 0.1% and 4% depending on various factors including species, pile size and season and length of storage [43,44,45,46]. To examine the sensitivity of delivered costs to storage losses, loss values of 0.1% and 2% were evaluated.
The effect of whole tree and LR MC on delivered costs was examined by modifying MC by ±5%. MC changes were absolute rather than relative, e.g., an MC of 40% reduced by 5% would be 35%. Changes in MC of >5% produced infeasible solutions from the MCPlan optimiser.

3. Results

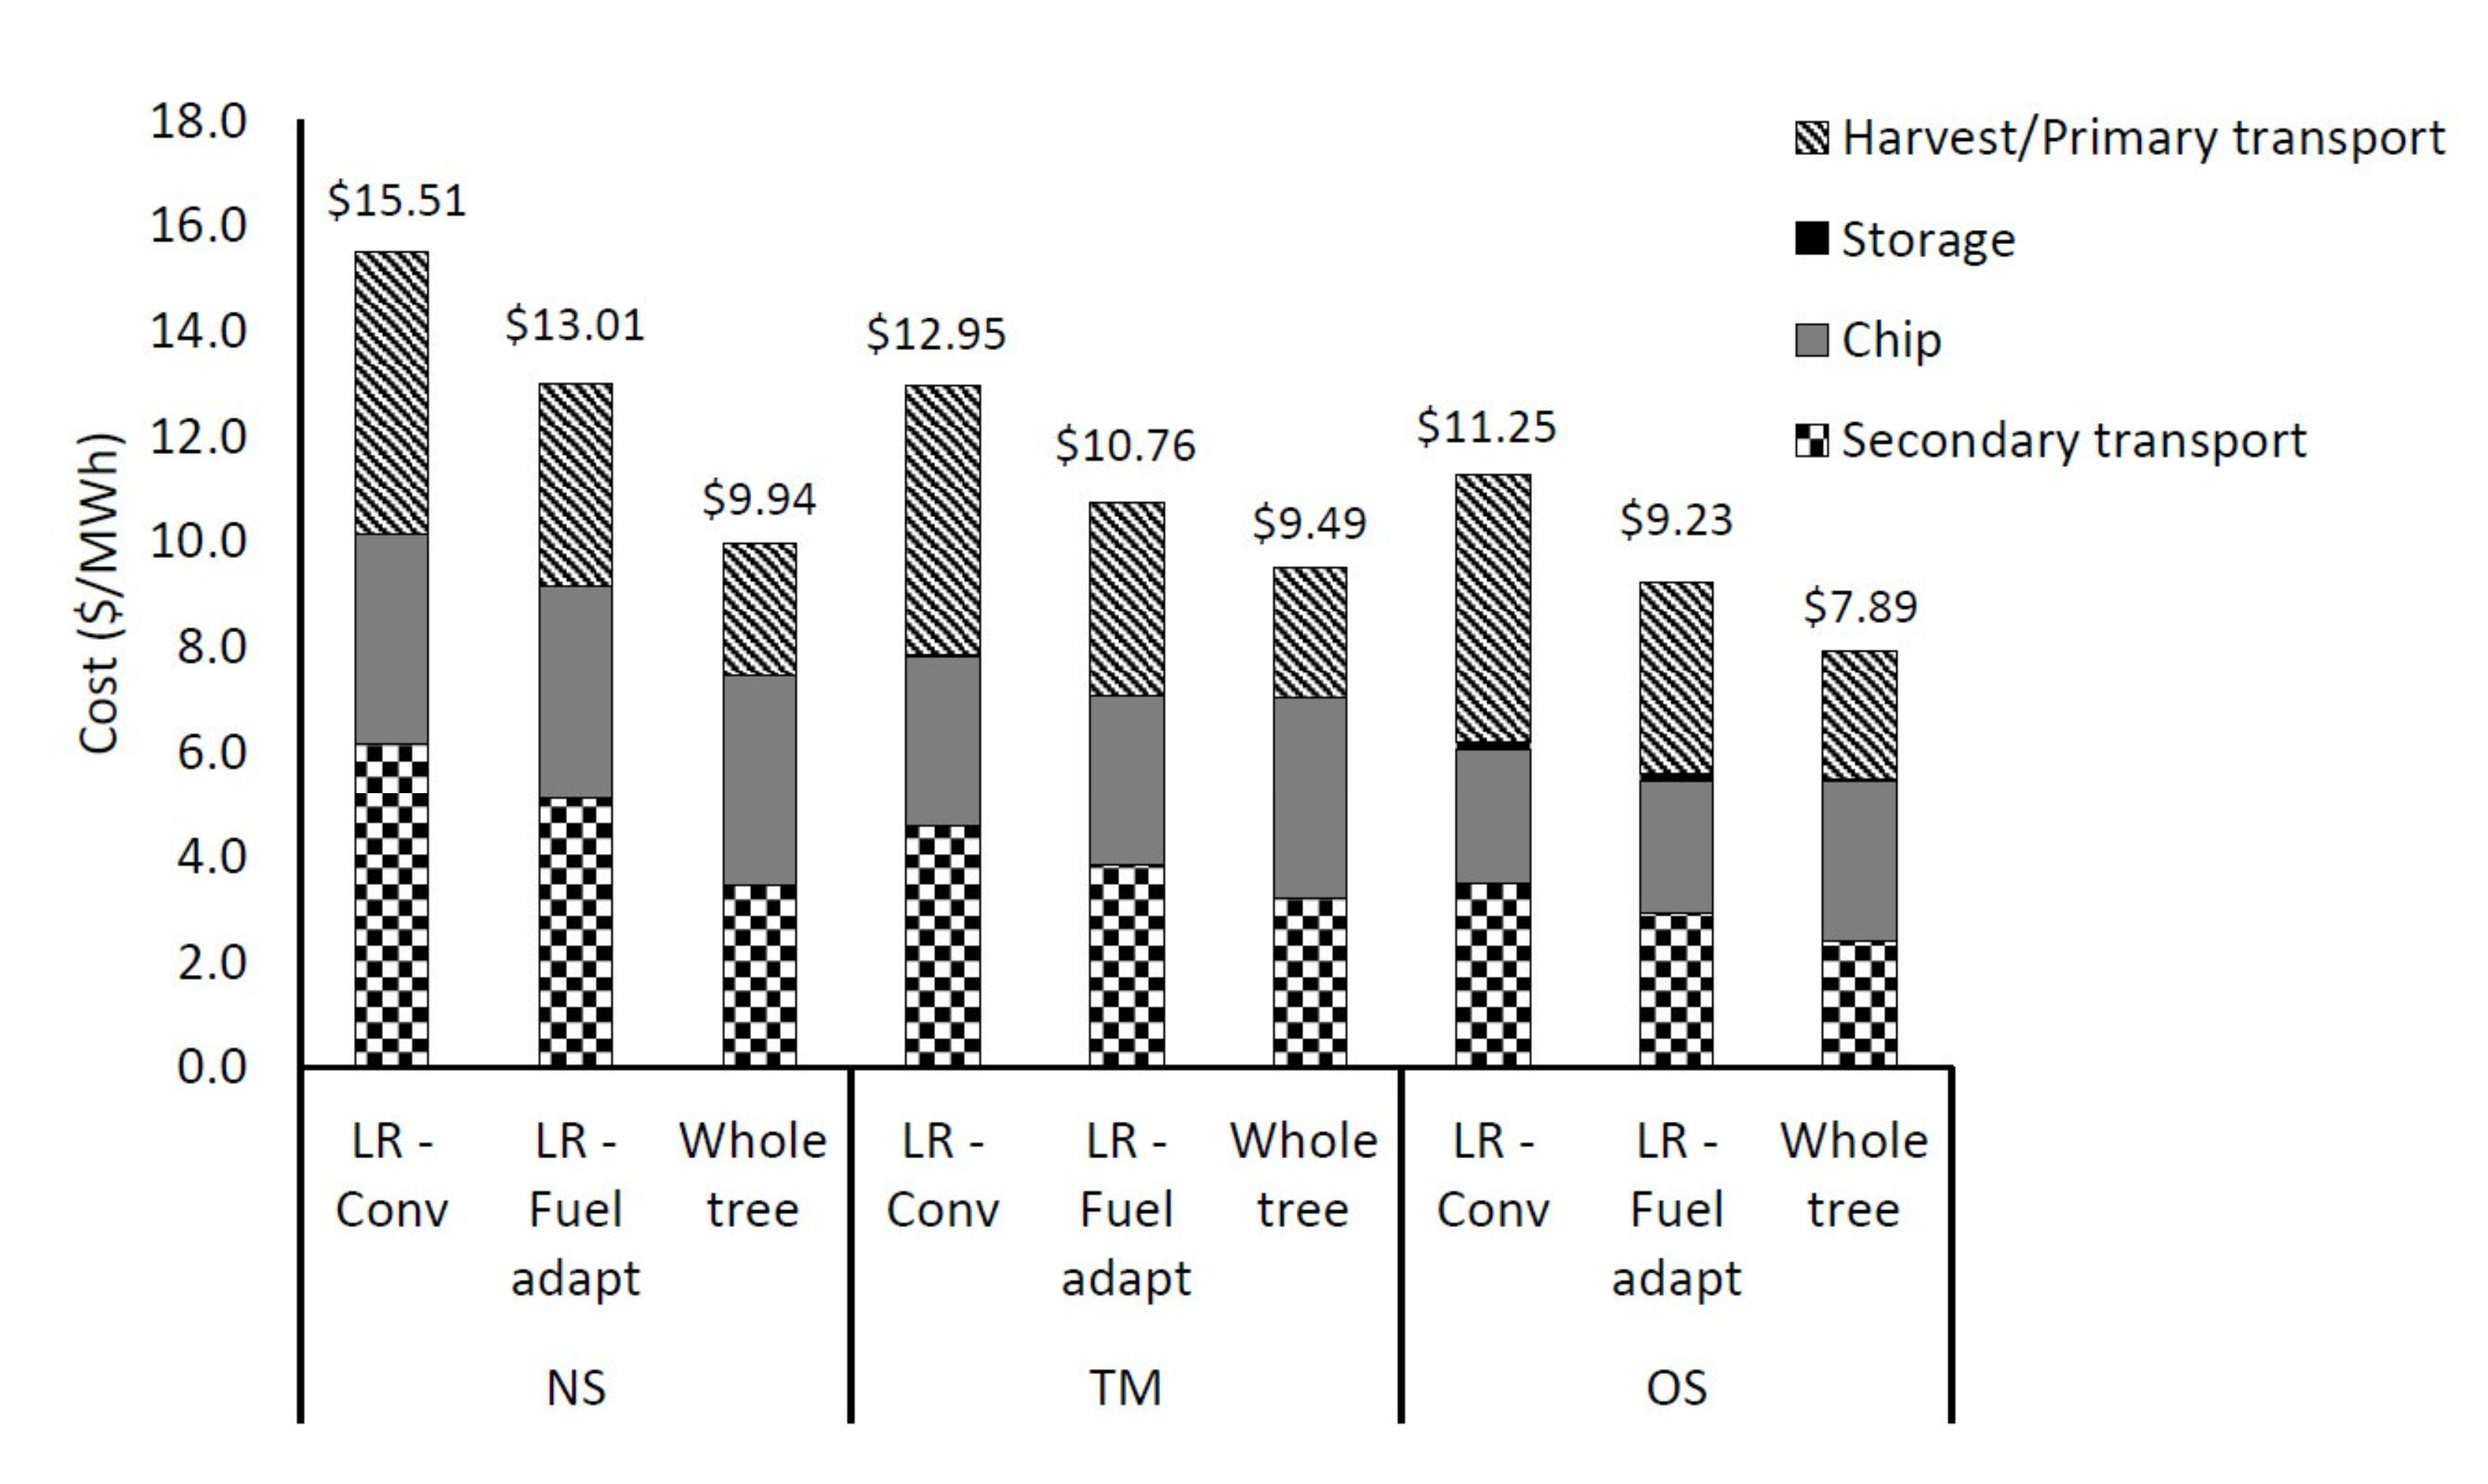
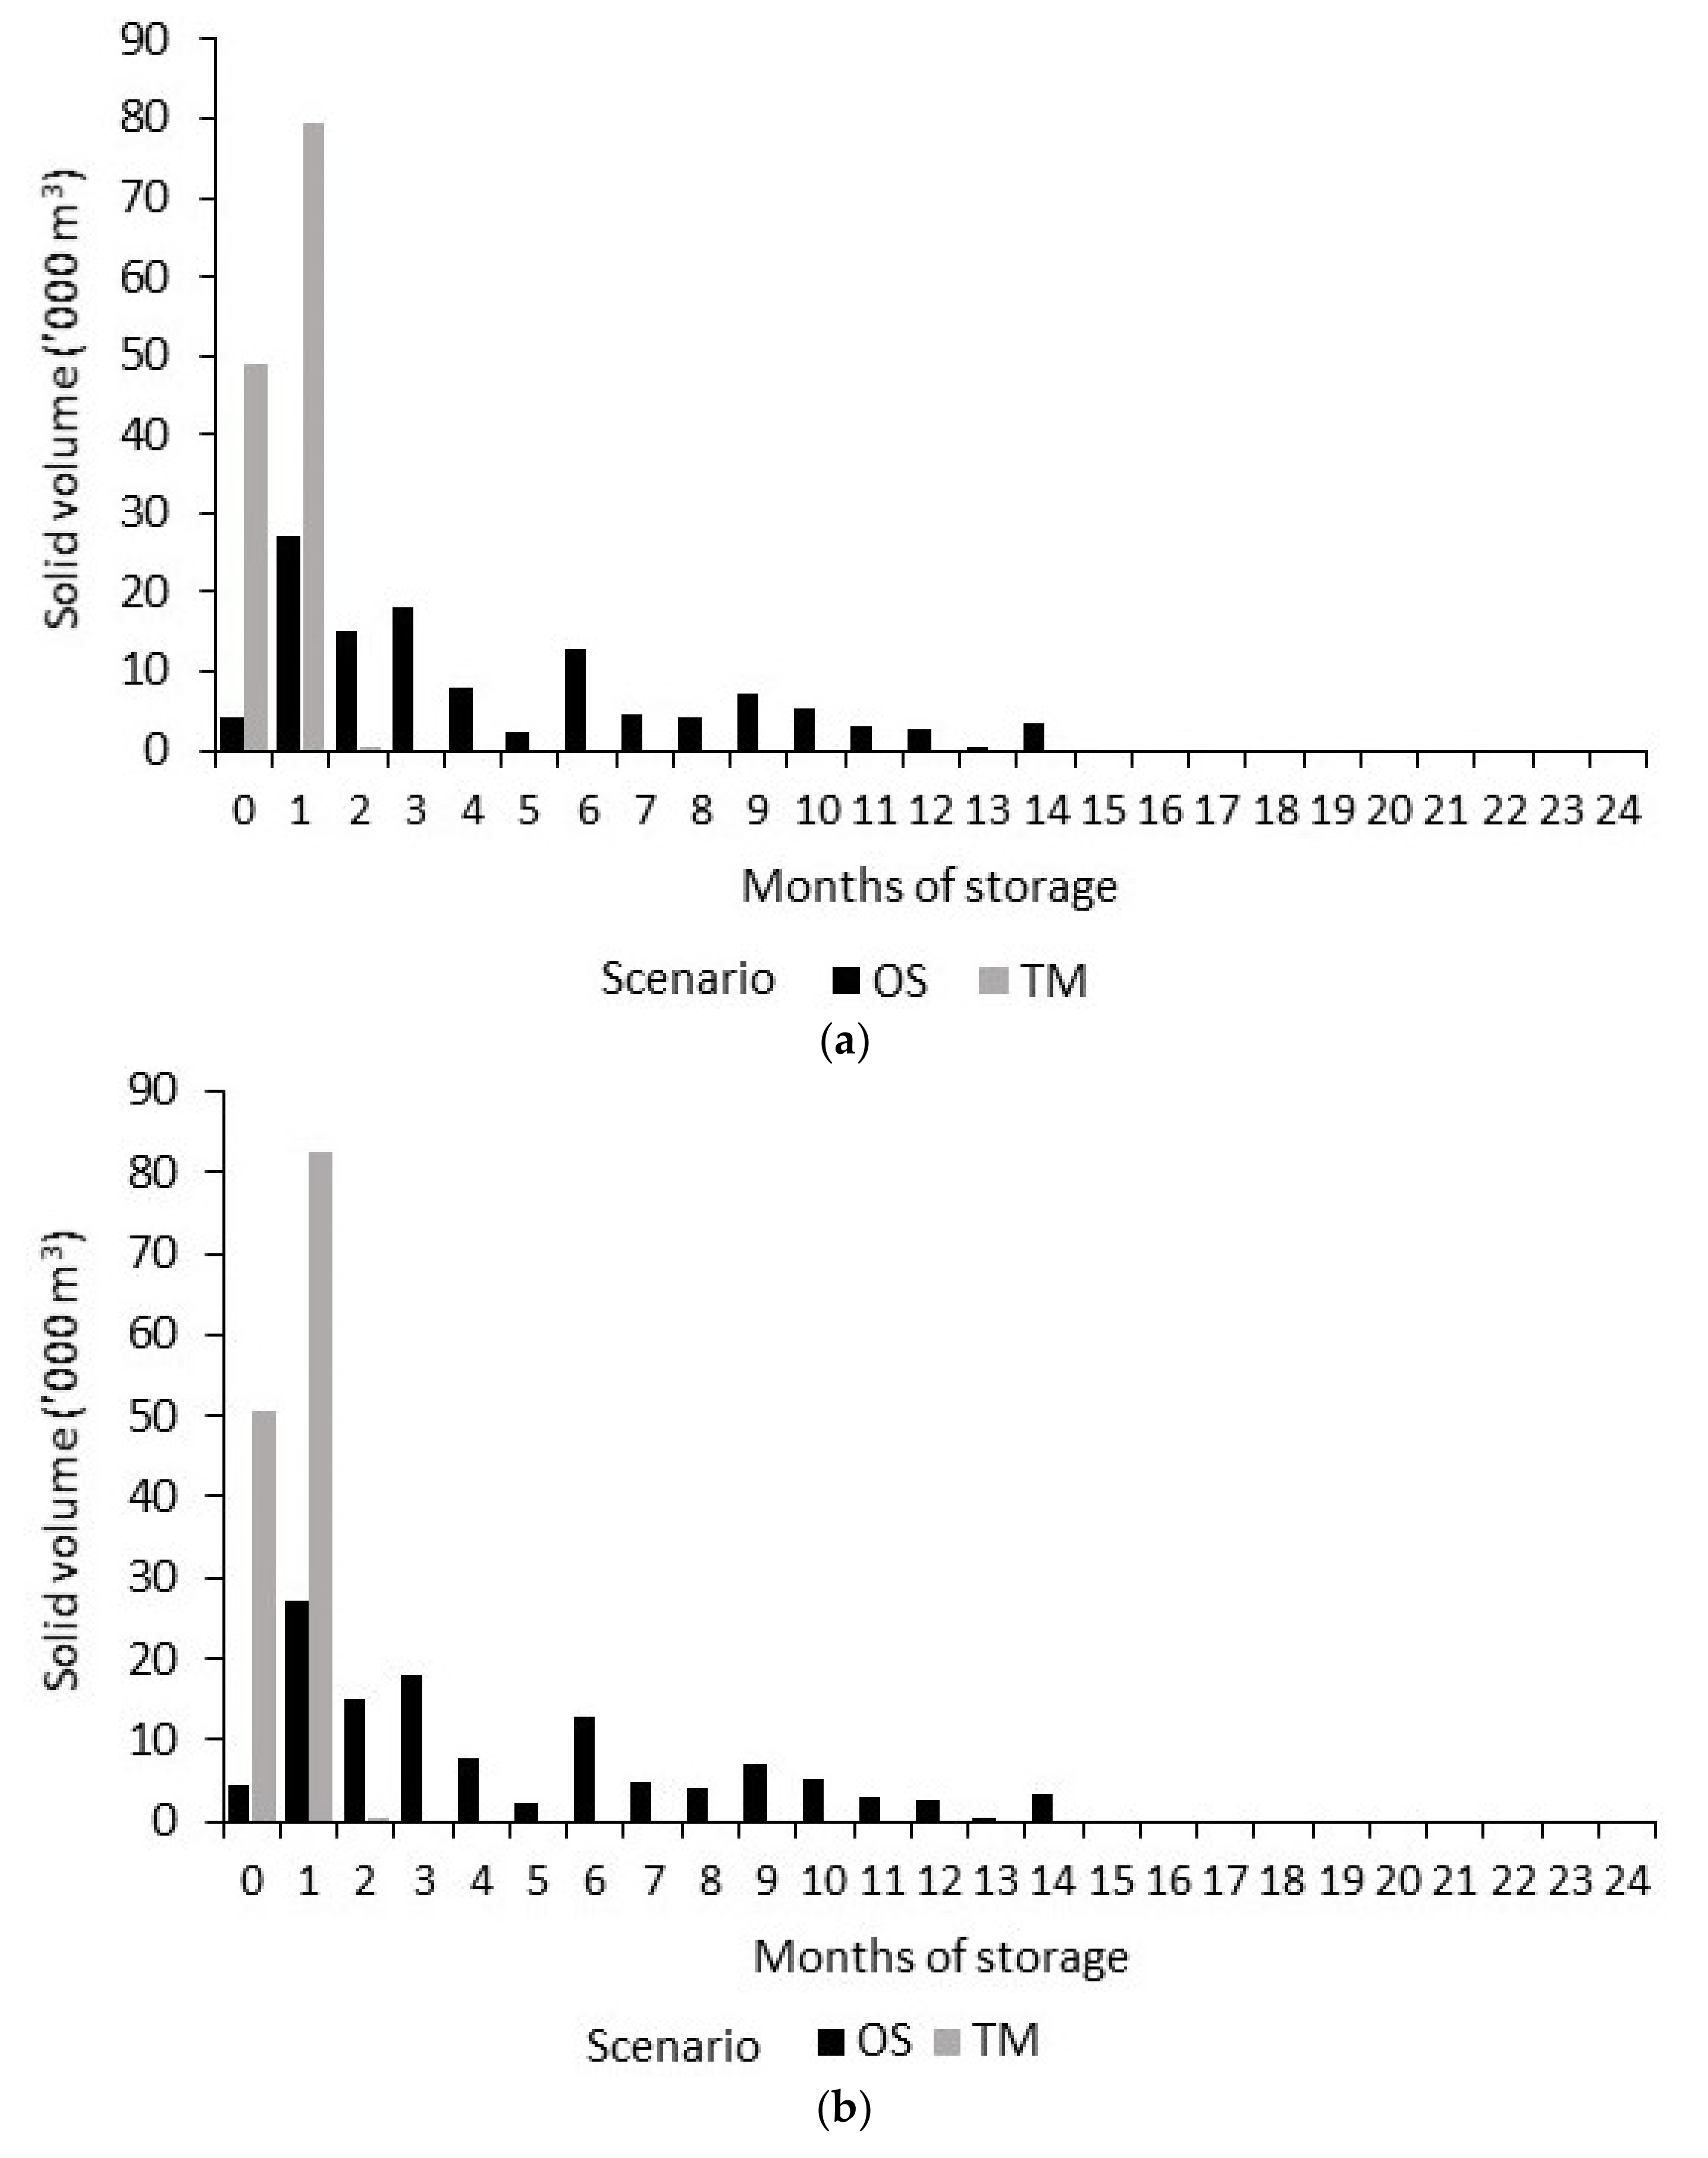
3.1. Storage Scenarios

Delivered costs were highest for the NS scenario for all FB types and lowest for the OS scenario (Figure 3). The cost components with the greatest reductions between the NS scenario and the other two scenarios were secondary transport and chipping. Delivered cost reductions for the TM and OS scenarios compared with the NS scenario were, for each FB type: TM scenario 17%, 18% and 5% (LR conventional, LR fuel-adapted and whole trees, respectively); OS scenario 29%, 30% and 22% (LR conventional, LR fuel-adapted and whole trees, respectively). Storage costs were <1.5% of delivered costs for the TM and OS scenarios.
Differences in delivered costs between FB types within a scenario mainly resulted from differences in their primary and secondary transport costs. Within each scenario, cost reductions between FB types (compared with LR conventional) ranged from 16% to 18% for LR fuel adapted and 27% to 36% for whole trees.

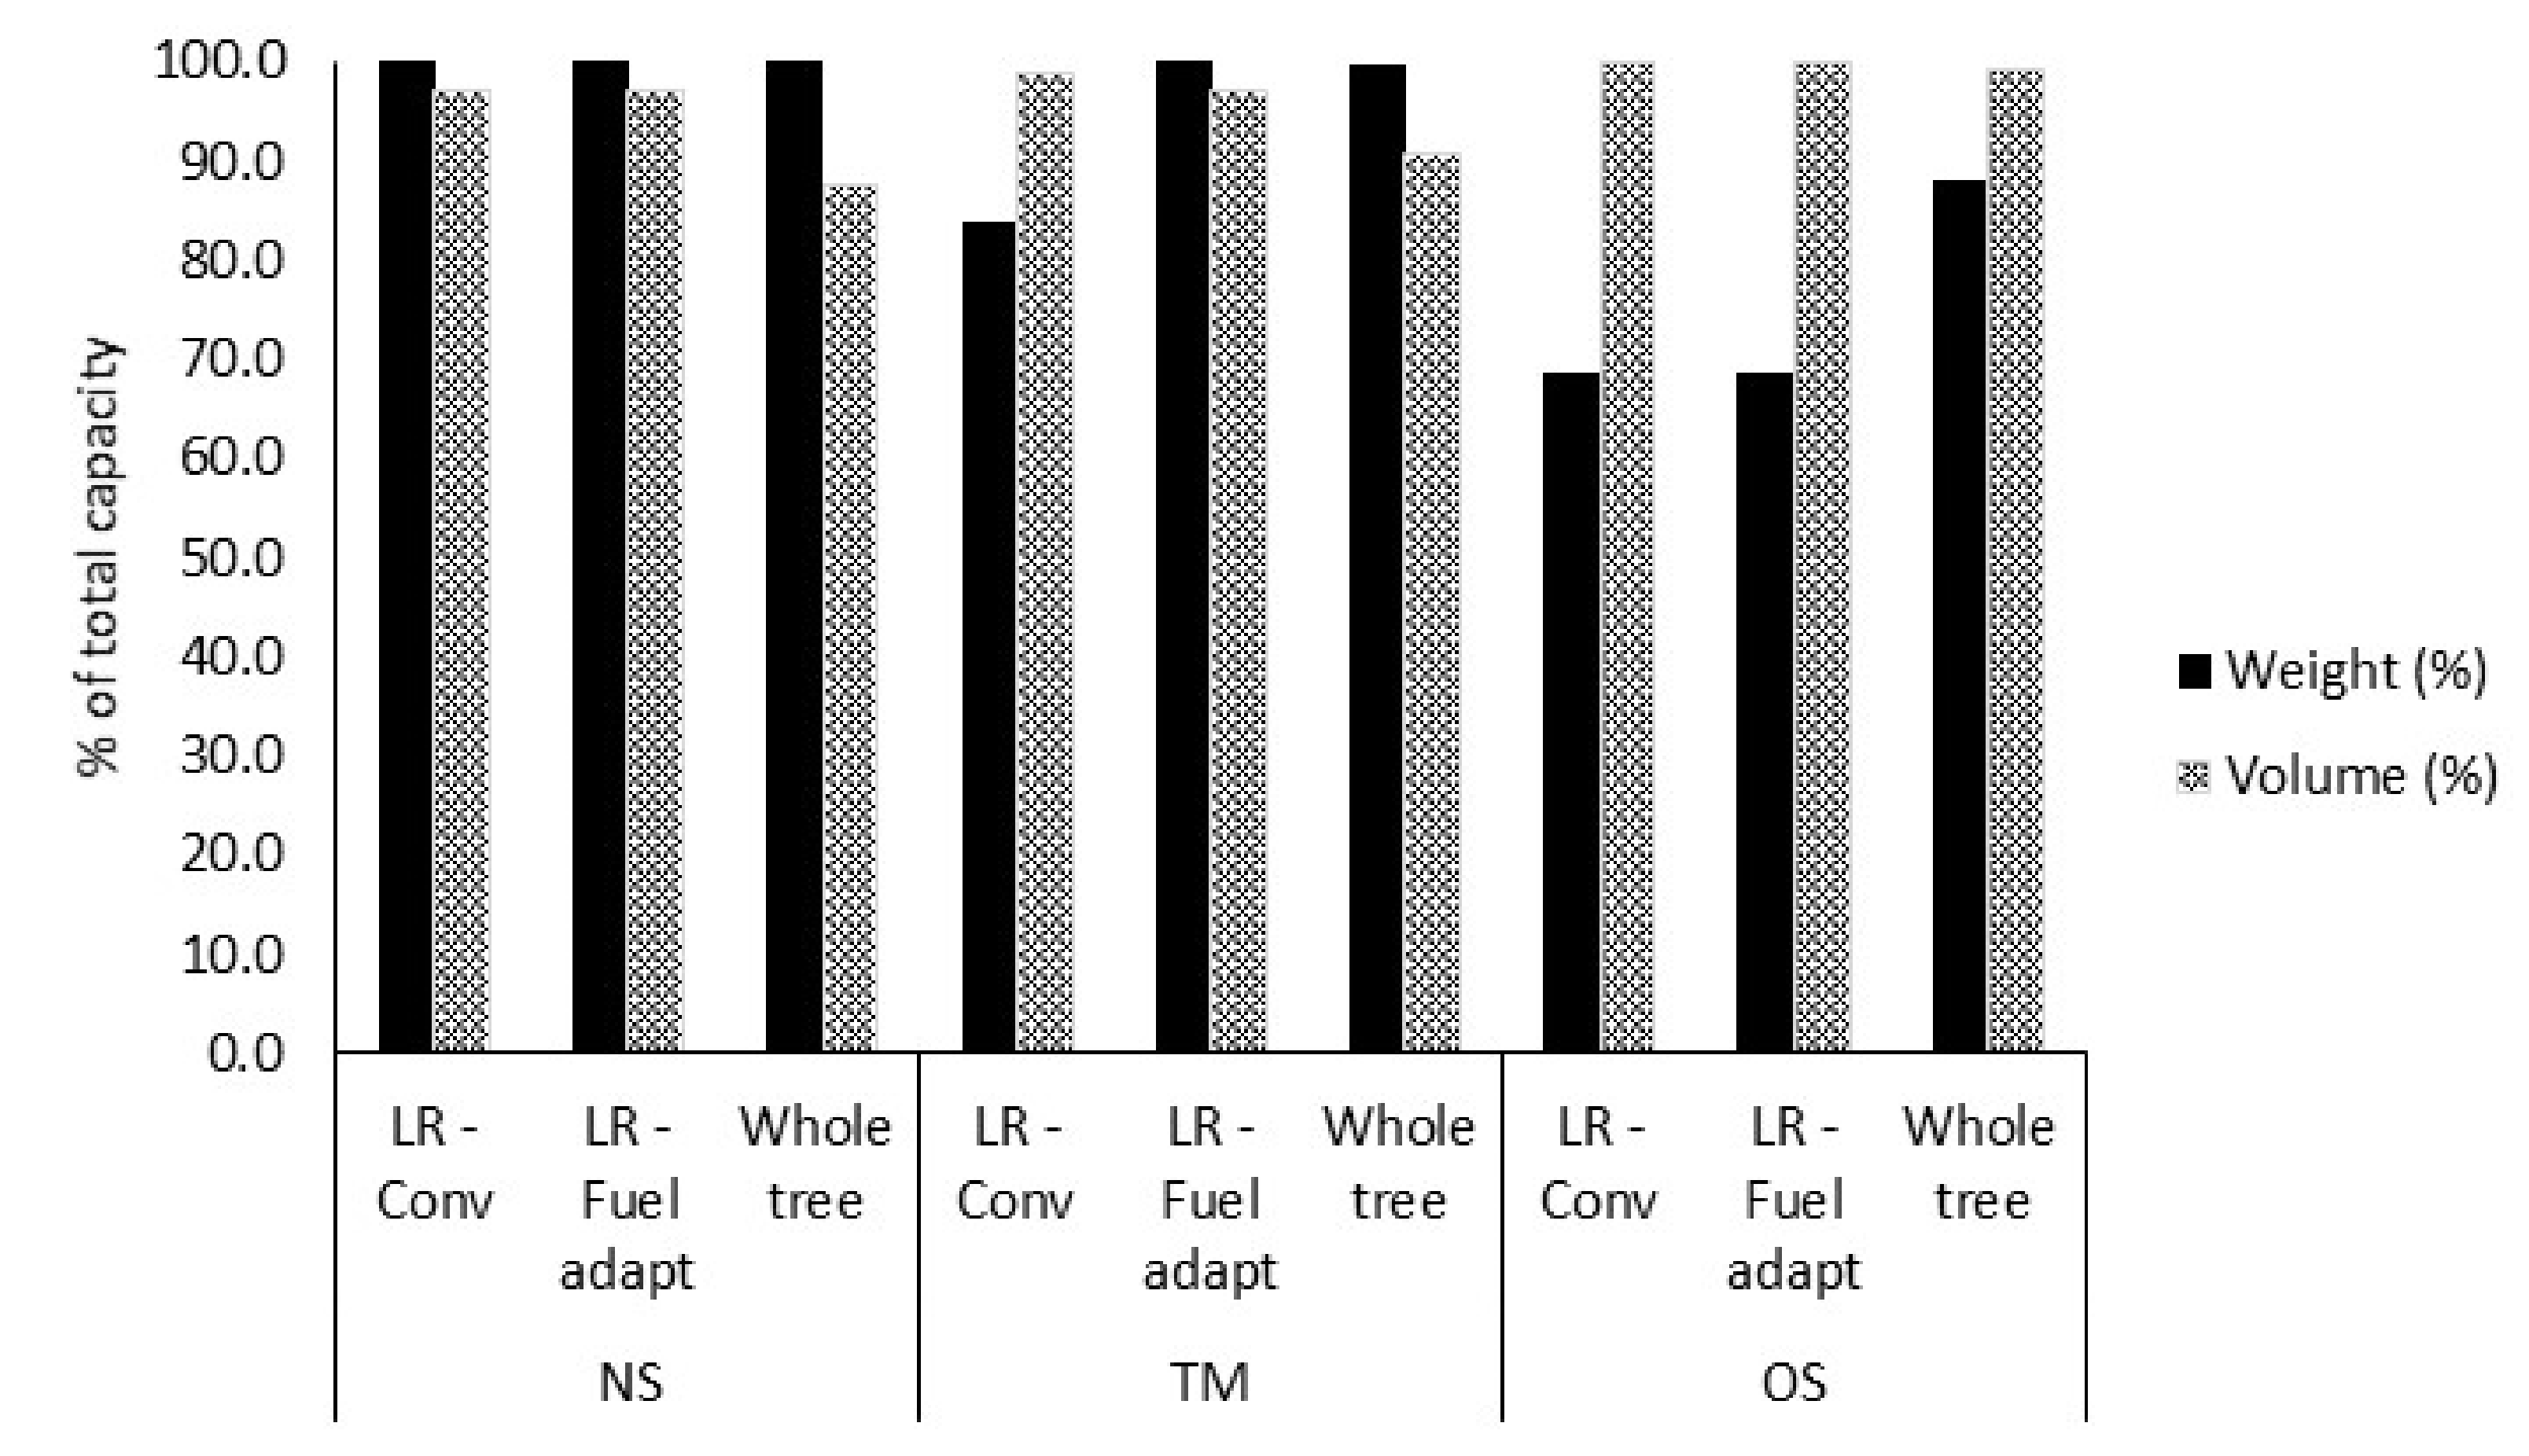
3.2. Truck Capacity Utilisation

All FB types used 100% of the truck weight capacity for the NS scenario and 100% of the truck volumetric capacity for the OS scenario (Figure 4). For the TM scenario, the two LR FB types used 100% of the volumetric capacity whereas the whole trees used 100% of the weight capacity.

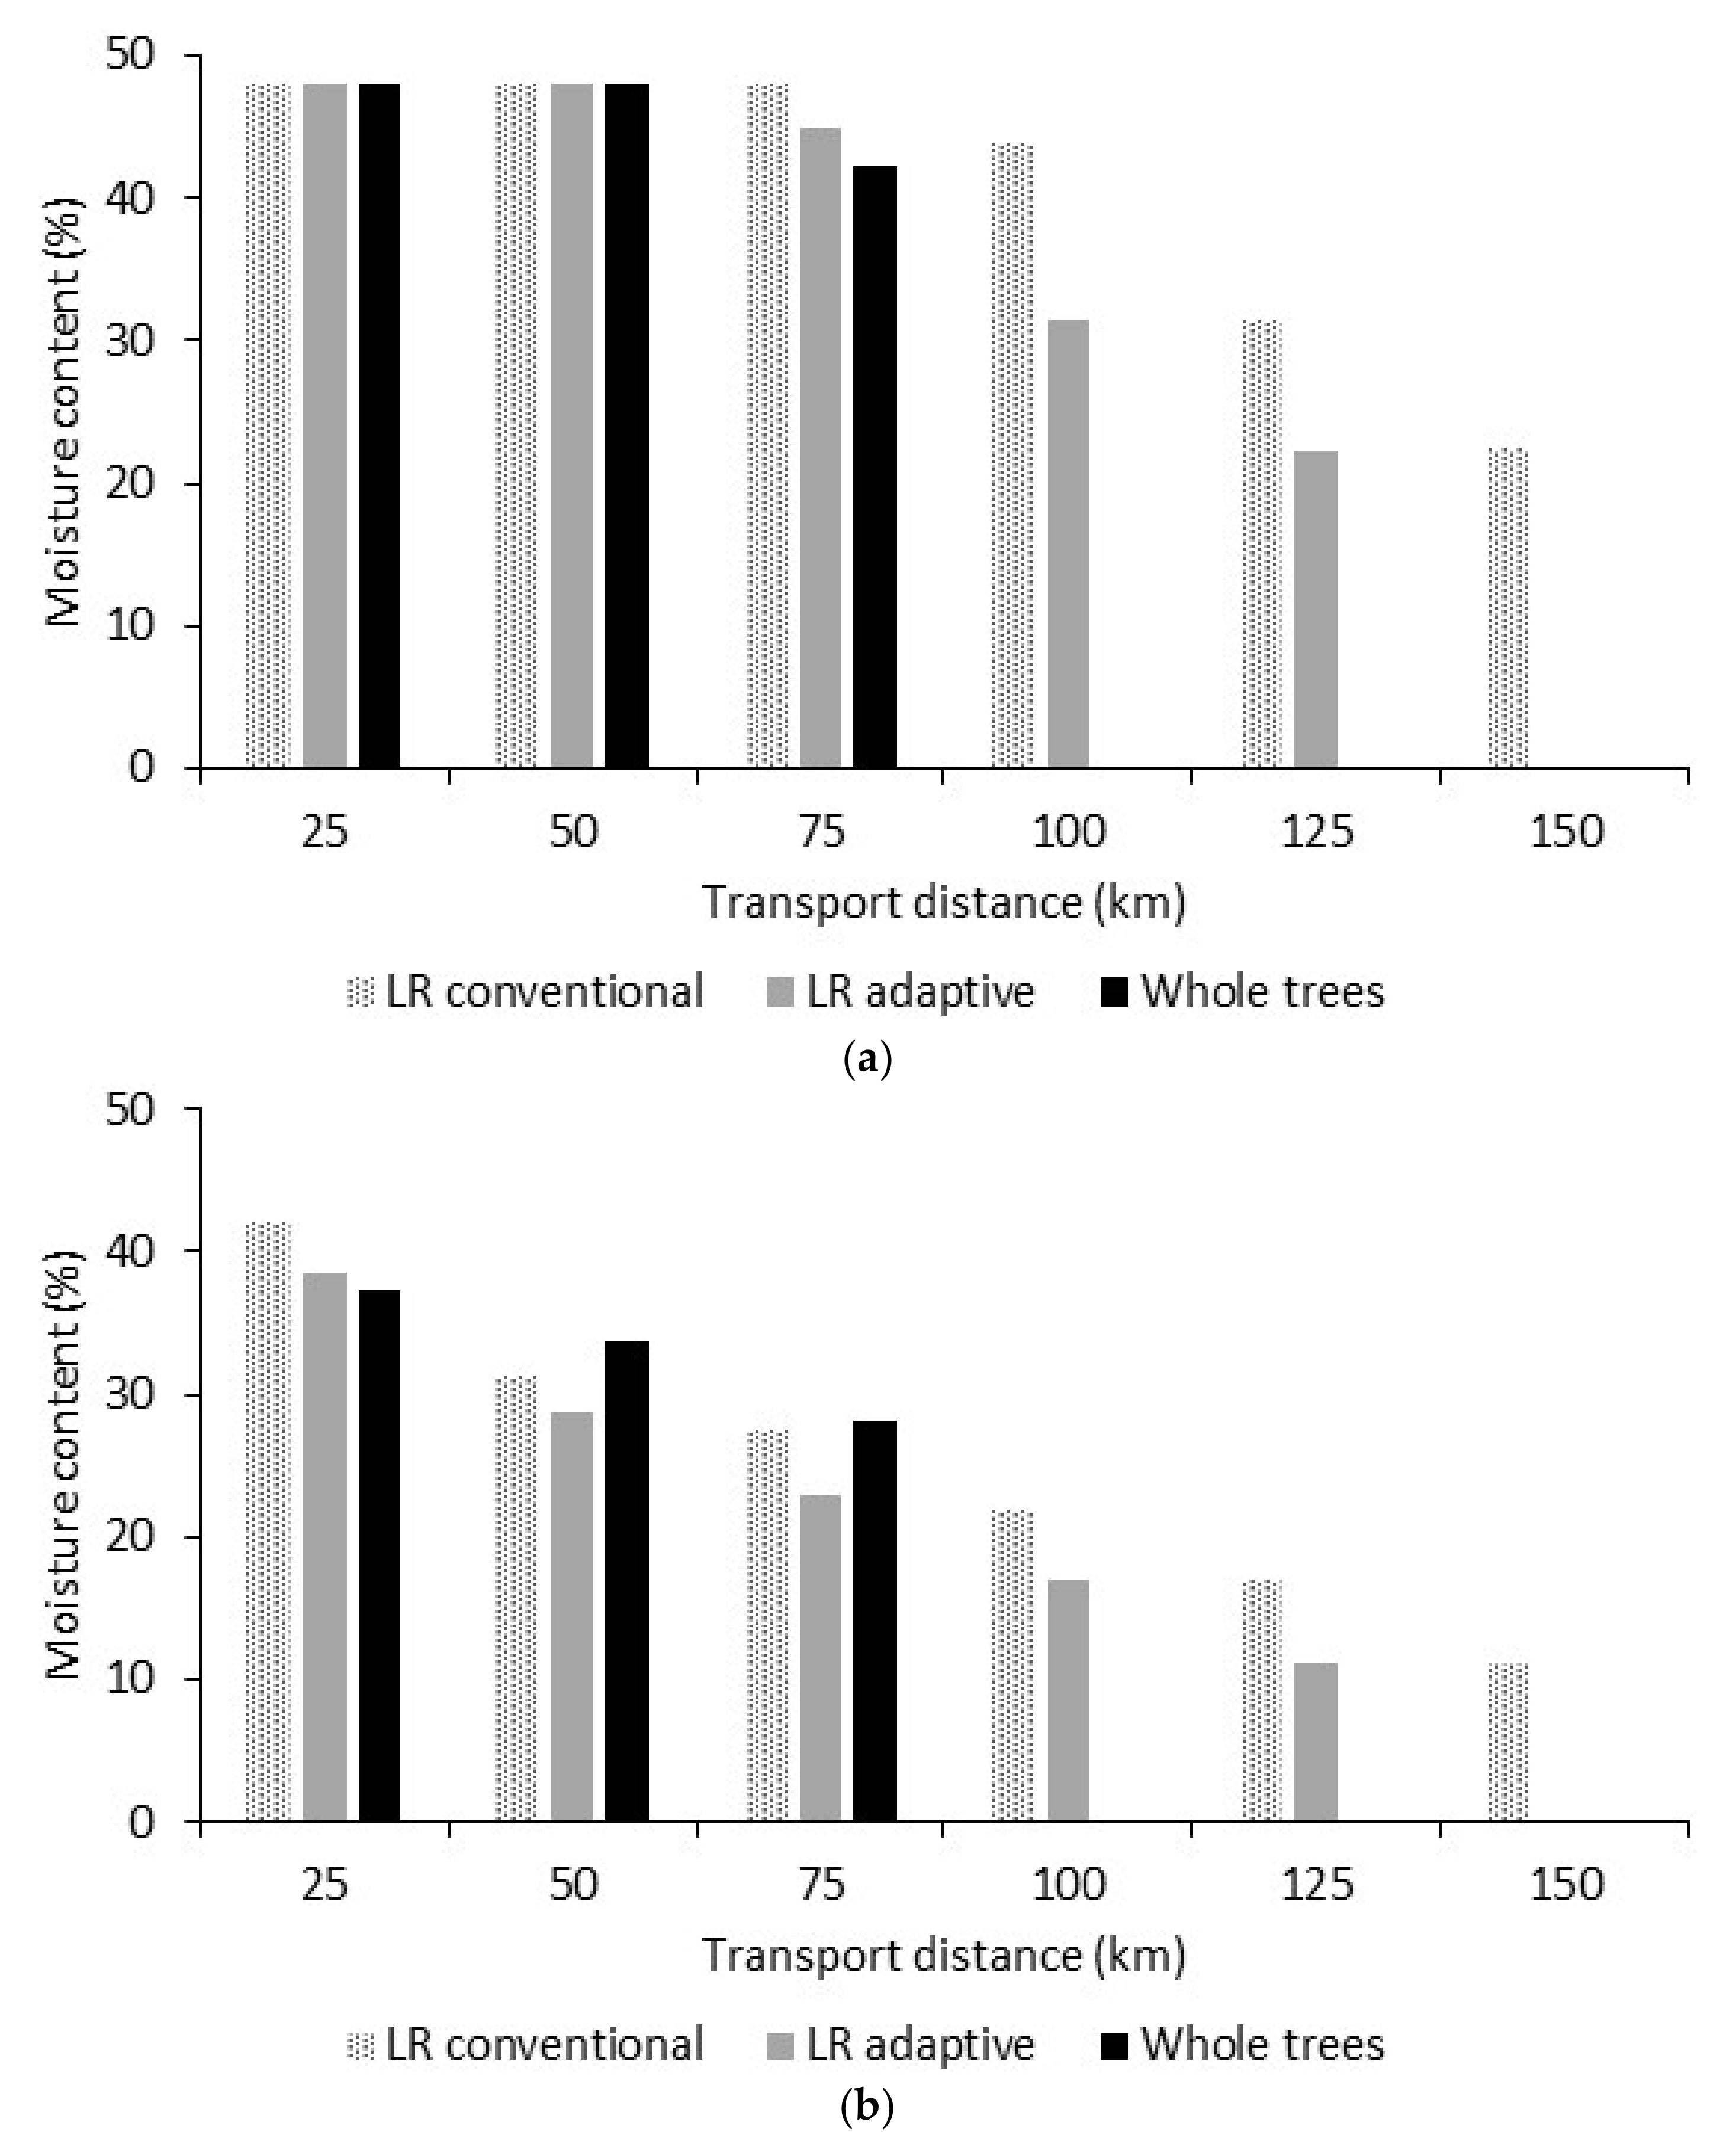
3.3. Transport Distance

The mean transport distance weighted by tonnes of chips for each FB type was 101–110 km for LR conventional, 81–89 km for LR fuel-adapted and 51–53 km for whole trees. For each FB type, the mean weighted transport distance was greatest for the NS scenario and lowest for the OS scenario.

3.4. Moisture Content

Mean FB MC weighted by chip volume for the NS scenario was at the maximum value (48%) across all transport distances and FB types in the study. For the TM scenario, mean FB MC was at the maximum value for transport distances of 25 km and 50 km for the LR fuel adapted and whole trees FB types and for 25 km, 50 km and 75 km for the LR conventional FB type (Figure 5). For all three studied FB types, the mean FB MC then declined with increasing secondary transport distance. For the OS scenario, MC was less than the maximum value for a transport distance of 25 km and then declined with increasing transport distance.
The maximum secondary transport distance for each FB type across all scenarios was: LR conventional 150 km, LR fuel adapted 125 km and whole trees 75 km. This reflected the mean weighted transport distances.

3.5. Storage Duration

For the OS scenario, over 70% of the FB was stored for periods ≤6 months, with the remainder being stored for various periods of time up to 14 months (LR) or 12 months (Whole trees) (Figure 6). For the TM scenario, the majority of the LR FB was stored for one month, whereas for the whole trees, the majority was transported directly to the power plant.

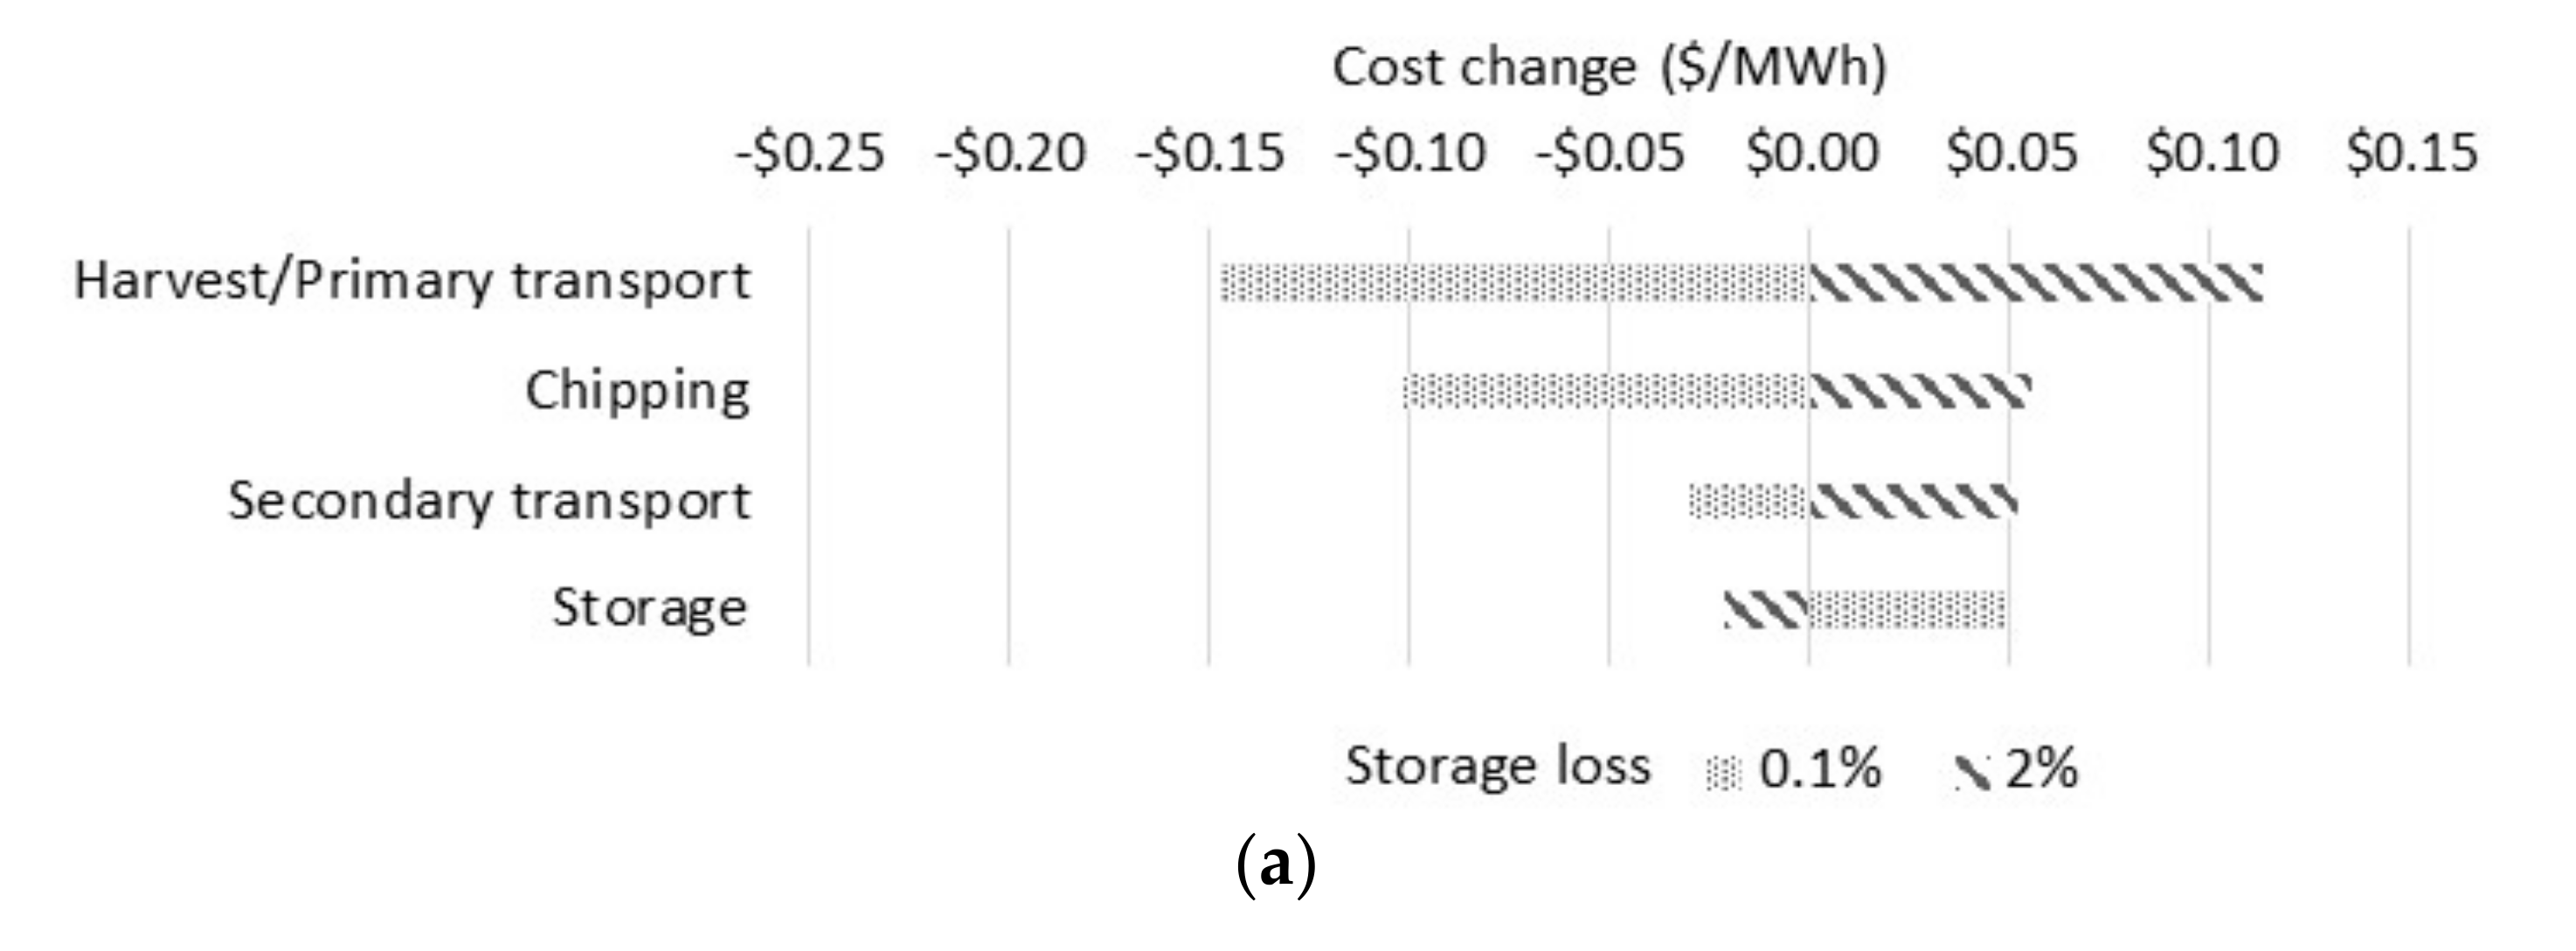
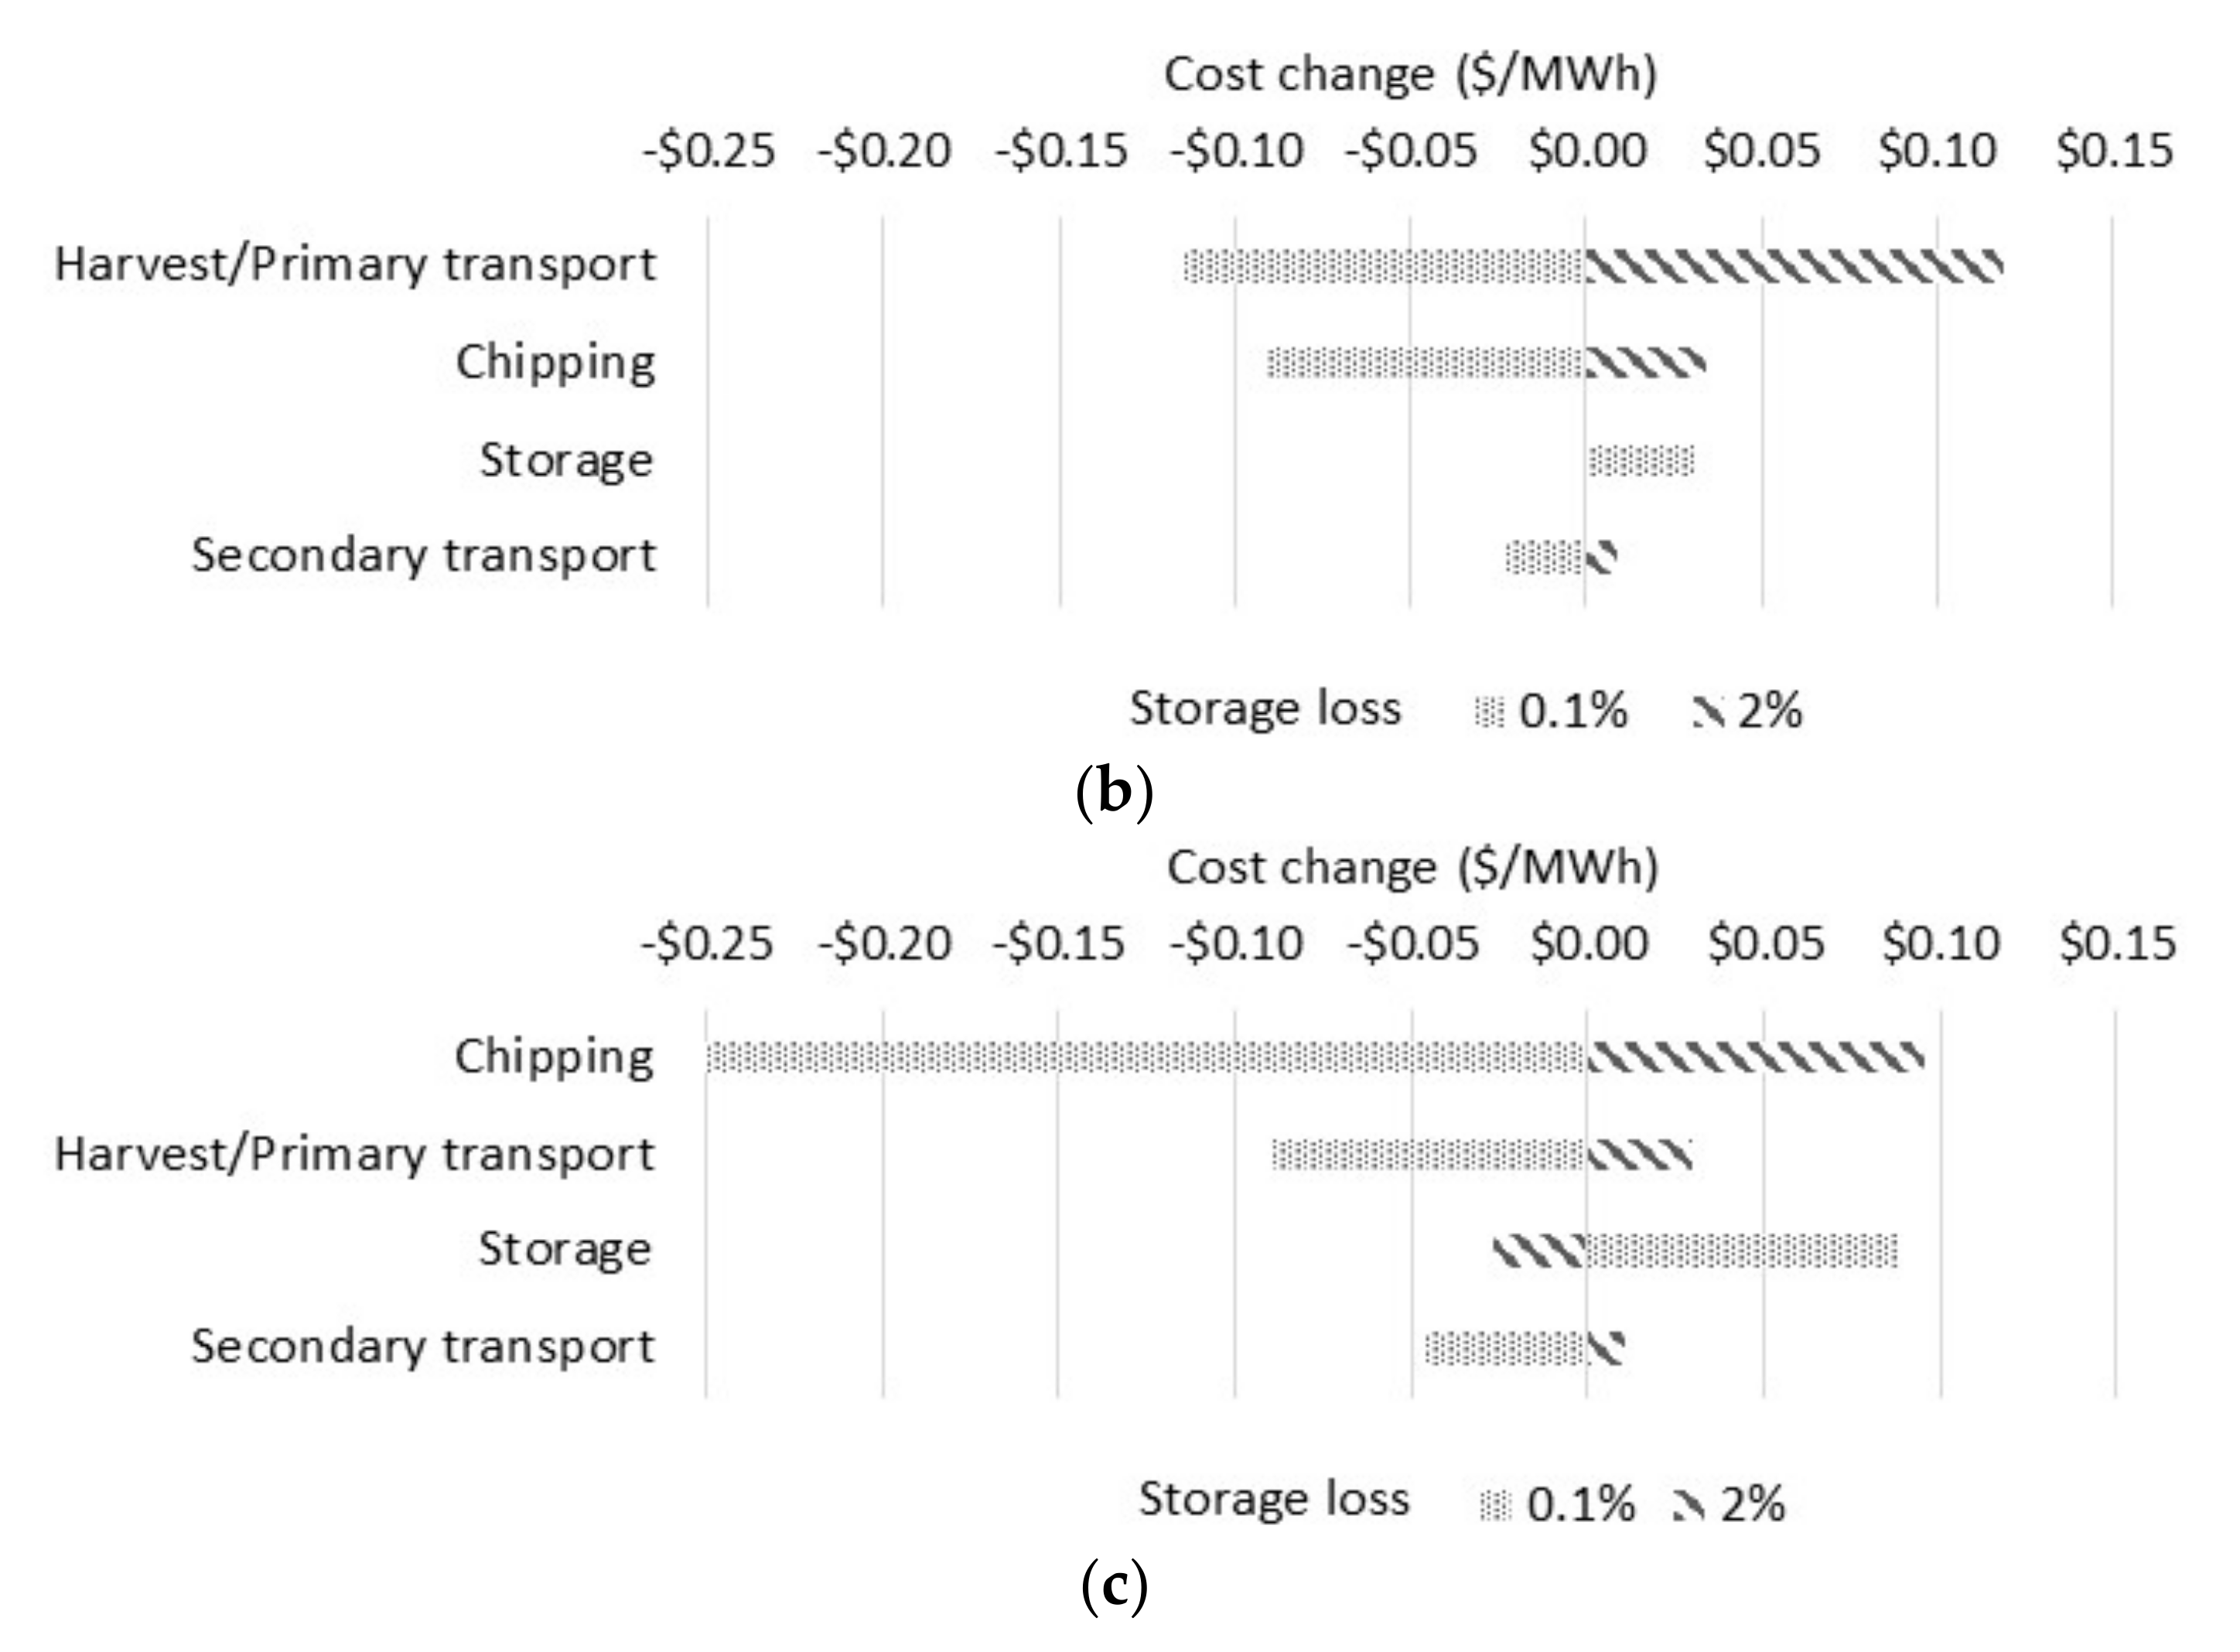
3.6. Sensitivity Analysis

3.6.1. Harvest/Primary Transport Costs

In all cases, changing harvest/primary transport costs by ±10% changed delivered costs in proportion to the percentage of delivered costs that consisted of harvest/primary transport costs. For example, harvest/primary transport costs were 40% of LR conventional delivered cost for the TM scenario. A 10% increase or decrease in LR conventional harvest/primary transport costs increased or decreased delivered costs by 4%, respectively. Maximum delivered cost changes were ±4.7% for LR conventional in the OS scenario. All other delivered cost changes were ±4.1% or less.

3.6.2. Storage Losses

For the TM scenario, changes in monthly storage loss values did not change the delivered costs for any FB type. For the OS scenario, reducing storage losses to 0.1% per month reduced delivered costs between −3.9% and −2.1%, while increasing storage losses to 2% per month increased delivered costs between 1.4% and 1.8% (Figure 7). For all FB types, the greatest cost changes resulting from changes to storage losses were in harvest/primary transport and chipping costs.

3.6.3. Moisture Content

For the two LR types, increasing MC by 5% increased delivered costs by approximately 5% for the OS scenario and 4% for the TM scenario (Table 3). Decreasing MC by 5% decreased delivered costs by approximately 4% for the OS scenario and 3.5% for the TM scenario.
For whole trees, increasing MC by 5% increased delivered costs by approximately 6% for the OS scenario and 2% for the TM scenario. Decreasing MC by 5% decreased delivered costs by approximately 6% for the OS scenario and 8% for the TM scenario.

4. Discussion

Comparisons between the study results and published delivered FB cost figures were complicated by the plethora of harvest, extraction, processing and transport systems and machines used in previous studies, combined with variations in cost assumptions, transport distances, FB properties, drying rates and length of storage. However, the delivered costs reported by Hall et al. [47] for P. radiata LR stored for six months at roadside prior to chipping and secondary transport (~AUD 7.90–9.80/MWh) and by Greene et al. [48] for whole P. taeda trees stored for 4 or 8 weeks at roadside prior to chipping and secondary transport (~AUD 15.10–17.20/MWh) suggested that FB delivered costs in the current study were reasonable.
For all three scenarios, the study found that FB types in order from highest to lowest delivered costs were LR conventional, LR fuel-adapted and whole trees. The major factors found to influence delivered FB costs were roadside drying and FB yield per hectare. Roadside drying reduced delivered FB costs for the TM scenario by 5% to 18% and for the OS scenario by 22% to 30%, due largely to reductions in transport and chipping costs, resulting from a reduction in FB MC decreasing FB weight and increasing its net calorific value. FB MC decreased with increasing transport distance as the savings from reduced FB weight were greater. Storage costs were greatest for the OS scenario but constituted <1.5% of delivered costs.
The study considered FB MC only in terms of its effect on delivered costs. Low MC FB also has a number of advantages for the end user as it increases boiler efficiency and reduces the size of the storage area and unloading and infeed facilities [49], though undercover storage may be required to maintain the low delivered MC values. It also reduces the need for supplemental drying prior to additional processing such as torrefaction [50] and wood pellet production [51].
Delivered costs for each FB type were strongly related to the yield of FB extracted per hectare for all scenarios, and the corresponding impact on mean transport distance, supporting the findings of Allen et al. [52] and Singh et al. [53]. Whole trees had the highest yield of FB extracted per hectare and hence the lowest mean transport distance and delivered costs, whereas LR conventional had the lowest FB yield per hectare and hence the highest transport distance and delivered costs. The importance of high biomass yield per hectare to lowering delivered costs suggested that overall delivered fuel costs for the hypothetical power plant could be reduced by investigating other regional biomass sources, as has been explored by a number of researchers, e.g., [54,55]. Potential additional biomass sources in the studied region include P. radiata plantations [56] and agricultural by-products [57]. The disadvantage of multiple biomass sources is the increase in supply chain complexity, particularly when including highly seasonal agricultural biomass [58]. Lower delivered costs resulting from increased biomass yield per hectare would increase the potential size of a power plant, enabling economies of scale to be achieved [59]. A region with a lower spatial biomass density may be better suited to the use of a mobile plant to produce high-energy-density biofuels and hence reduce transport costs [60].
A high yield of FB extracted per hectare is associated with the removal of nutrients and organic matter, which can reduce the growth of subsequent rotations [61,62]. However, there are few guidelines and little consensus concerning minimum LR retention levels required to maintain tree growth rates [63]. Australian forest management guidelines refer to maintenance of long-term site sustainability without specific reference to LR retention, e.g., [64]. As whole tree removal maximises site biomass extraction, it has the greatest impact on site fertility as almost all aboveground tree biomass is removed from the site [65]. The impact of retaining 60% (LR conventional) or 30% (LR fuel-adapted) of the LR on site fertility is unknown and would depend on the nutrient status of the leaf litter and the mineral soil. Leaves and needles contain the highest proportion of FB nutrients [66,67]. Scandinavian studies have reported that most needles fall off coniferous LR drying on-site or at roadside, reducing the export of nutrients contained in FB [26,68]. However, there are no equivalent Australian studies of physical losses from stored eucalypt FB.
The high delivered costs for LR conventional were related to its high cost for collection and primary transport and the low proportion of LR extracted per hectare. LR collection and transport was modelled in this study with unmodified log forwarders, which have been found to commonly transport LR load weights less than half their rated weight capacity [11]. LR primary transport costs could be reduced through the use of modified forwarders to increase forwarder bunk volumetric capacity, which can increase the utilisation of weight capacity to 65–80% [69]. Use of asymmetric forwarder grapples may also reduce LR collection and transport costs as they have been found to increase LR loading and unloading speed by over 10% compared with a conventional residue grapple [70]. However, the sensitivity analysis suggested that reducing LR conventional harvest/primary transport costs by 10% would only reduce its delivered costs by 4.7%. In addition, forwarder productivity gains from modifications to load capacity and grapple type were evaluated with coniferous LR and would need to be tested with eucalypt LR.
FB storage losses and drying rates can vary depending on a number of factors, including the size of FB components [71] and piles [72], the proportions of various components (needles/leaves, branches, bark, wood) and the storage conditions [73]. Increased monthly storage losses increased the quantity of FB required and hence increased harvest, primary transport and chipping costs, with decreasing storage losses having the opposite effect. However, delivered costs changes suggested that they were relatively insensitive to storage losses within the tested range. MC changes tested had a larger effect on delivered costs, though the effect was still relatively small for the two LR types (delivered cost changes between −4% and 5%) and whole trees for the OS scenario (±6%). For whole trees for the TM scenario, increasing MC by 5% had little effect on delivered costs because most of the whole trees were delivered directly to the power plant. In contrast, reducing MC by 5% reduced delivered costs by 8% as it became cost-effective to store more of the whole trees at roadside due to the greater cost reductions from increased MC losses.
While the OS scenario had the lowest delivered FB costs, it is likely to be the most complex to implement operationally due to the requirement to manage roadside stocks over broad spatial and temporal ranges. This complexity suggested that an operational management system would be required to manage roadside FB storage optimally. The additional expense of implementing and running an FB storage management system would cause some forest companies utilising LR for bioenergy to forgo the additional cost reductions from the OS scenario in favour of the relatively easier to manage TM storage scenario, which, for LR, was found to gain approximately 60% of the OS scenario cost reductions. Based on historical trends in the adoption of new research findings and information technology, larger forest companies would be more likely to adopt optimised FB roadside management systems [74,75]. Development and implementation of an operational DSS to optimally manage roadside FB stocks will be discussed in a subsequent paper.
The current study had several limitations: whole tree stands were assumed to not be re-established and hence did not incur re-establishment costs; costs of replenishing nutrients lost from FB removal were not included, and plantation harvesting was scheduled to meet the power plant energy commitments. While a proportion of the annual E. globulus harvested stands in Western Australia is currently not re-established due to poor growth or land leasing arrangements, this would not be a sufficient supply of whole trees to supply a power plant over the long term. Alternative whole tree resources which would not incur re-establishment costs include: radiata pine first thinning trees [76], wilding plantation trees [77] and mechanised fuel reduction [21].
As LR from E. globulus plantations in the study area is a by-product of pulplog production, it is unlikely that LR production would match power plant demand in an operational implementation. LR storage at roadside and at the power plant (which typically have twenty to thirty days’ supply of chipped FB stored onsite [78]) would provide a level of buffering for the TM and OS scenarios. Operational implementation of the NS scenario may need additional storage area at an intermediate depot or at the power plant to better match FB supply and demand. Intermediate storage has not previously been considered for Australian forest biomass supply chains as the hypothesised demand for FB is relatively consistent over a year compared with northern hemisphere supply chains, which have a large peak in FB demand in winter to meet heating needs [79]. As intermediate storage can increase FB delivered costs by 10–20% [52], further studies would be required to examine the potential need for intermediate storage and the cost implications in the Australian context.
Further studies could consider the overall economics of the hypothetical power plant in the current study under the study conditions or with consideration of additional biomass sources. The economic case would be enhanced through simultaneous use of waste heat from electricity production in forced drying of stored FB to increase boiler efficiency [80] or in industrial processes (combined heat and power (CHP)) [81], which can increase power plant efficiency by 35–40% [82], and by the increased reliability of the regional electricity supply and delayed upgrades of transmission line capacity.

5. Conclusions

The study used a tactical linear programming tool (MCPlan) to compare the impact of roadside drying on the delivered costs of E. globulus chips produced from LR obtained from a conventional CTL harvest system, LR obtained from a fuel-adapted harvest system and whole trees felled and transported to roadside to supply a hypothetical 10 MWe thermal power plant in Western Australia.
The study found that, for the tested scenarios and biomass types, FB delivered costs could be greatly reduced by roadside drying (cost reductions ≤ 30%) and by increasing FB spatial density (cost reductions ≤ 36%). Whereas the highest gains from roadside drying were obtained from the OS scenario, for LR, approximately 60% of the OS scenario cost reductions were obtained using the simplistic strategy of storing LR at roadside for up to two months (the TM scenario). However, for whole trees, the TM scenario was a poor strategy, only obtaining 23% of the cost reductions of the OS scenario. The complexity involved in managing FB under the OS scenario suggested that a management system would be required to implement this strategy operationally.
The substantial cost reductions obtained in the study through increasing spatial FB density suggested that the operators of the power plant should consider pursuing biomass supplies from a range of potential sources from the region surrounding the power plant. For the hypothetical power plant in the study, this could include P. radiata plantations and agricultural biomass sources. Additional biomass supplies are particularly important when whole E. globulus trees are to be used for bioenergy, as only relatively small quantities of whole trees are likely to be available.
Use of forwarders modified to improve LR transport productivity may reduce FB delivered costs, though the study findings suggested that, unless the primary transport cost savings were substantial, the impact on delivered costs would likely be small.
FB removal for bioenergy also removes potential nutrient sources for the next plantation rotation. Further work is required to determine guidelines for minimum retained quantities of LR to maintain site productivity.

Author Contributions

Conceptualisation, M.S.; methodology, M.S.; software, M.A.; validation, M.A.; formal analysis, M.S.; investigation, M.S.; resources, M.S., M.A., P.T. and M.S.T.; data curation, M.S.; writing—original draft preparation, M.S.; writing—review and editing, M.S., M.S.T., P.T. and M.A.; visualisation, M.S.; supervision, P.T. and M.S.T.; project administration, P.T.; funding acquisition, P.T. All authors have read and agreed to the published version of the manuscript.

Funding

This research received no external funding.

Institutional Review Board Statement

Not applicable.

Informed Consent Statement

Not applicable.

Data Availability Statement

The data used in the study are published in this paper or are from sources noted in the paper.

Acknowledgments

The authors would like to thank the ARC Centre for Forest Value, based at the University of Tasmania, for their support.

Conflicts of Interest

The authors declare no conflict of interest.

References

  1. Rothe, A.; Moroni, M.; Neyland, M.; Wilnhammer, M. Current and potential use of forest biomass for energy in Tasmania. Biomass Bioenergy 2015, 80, 162–172. [Google Scholar] [CrossRef]
  2. Repo, A.; Känkänen, R.; Tuovinen, J.-P.; Antikainen, R.; Tuomi, M.; Vanhala, P.; Liski, J. Forest bioenergy climate impact can be improved by allocating forest residue removal. GCB Bioenergy 2012, 4, 202–212. [Google Scholar] [CrossRef] [Green Version]
  3. Björheden, R. Drivers behind the development of forest energy in Sweden. Biomass Bioenergy 2006, 30, 289–295. [Google Scholar] [CrossRef]
  4. International Renewable Energy Agency. Biomass for Power Generation; International Renewable Energy Agency: Abu Dhabi, United Arab Emirates, 2012. [Google Scholar]
  5. Stucley, C.; Schuck, S.; Sims, R.; Bland, J.; Marino, B.; Borowitzka, M.; Abadi, A.; Bartle, J.; Giles, R.; Thomas, Q. Bioenergy in Australia: Status and Opportunities; Bioenergy Australia: St Leonards, NSW, Australia, 2012. [Google Scholar]
  6. Department of the Environment and Energy. Australian Energy Update 2017; Commonwealth of Australia: Canberra, Australia, 2017.
  7. Caputo, A.C.; Palumbo, M.; Pelagagge, P.M.; Scacchia, F. Economics of biomass energy utilization in combustion and gasification plants: Effects of logistic variables. Biomass Bioenergy 2005, 28, 35–51. [Google Scholar] [CrossRef]
  8. Kühmaier, M.; Erber, G. Research trends in European forest fuel supply chains: A review of the last ten years (2007–2016)–part two: Comminution, transport & logistics. Croat. J. For. Eng. 2018, 39, 139–152. [Google Scholar]
  9. Ralevic, P.; Ryans, M.; Cormier, D. Assessing forest biomass for bioenergy: Operational challenges and cost considerations. For. Chron. 2010, 86, 43–50. [Google Scholar] [CrossRef] [Green Version]
  10. Richardson, J.; Björheden, R.; Hakkila, P.; Lowe, A.T.; Smith, C.T. (Eds.) Bioenergy from Sustainable Forestry: Guiding Principles and Practice; Kluwer Academic Publishers: Dordrecht, The Netherlands, 2002. [Google Scholar]
  11. Strandgard, M.; Mitchell, R. Comparison of cost, productivity and residue yield of cut-to-length and fuel-adapted harvesting in a Pinus radiata D.Don final harvest in Western Australia. N. Z. J. For. Sci. 2019, 49. [Google Scholar] [CrossRef] [Green Version]
  12. Adebayo, A.B.; Han, H.-S.; Johnson, L. Productivity and cost of cut-to-length and whole-tree harvesting in a mixed-conifer stand. For. Prod. J. 2007, 57, 59. [Google Scholar]
  13. Ackerman, P.; Talbot, B.; Dahlin, B. Biomass Harvesting and Logistics. In Bioenergy from Wood: Sustainable Production in the Tropics; Seifert, T., Ed.; Springer: Dordrecht, The Netherlands, 2014; pp. 109–135. [Google Scholar] [CrossRef]
  14. Röser, D.; Mola-Yudego, B.; Sikanen, L.; Prinz, R.; Gritten, D.; Emer, B.; Väätäinen, K.; Erkkilä, A. Natural drying treatments during seasonal storage of wood for bioenergy in different European locations. Biomass Bioenergy 2011, 35, 4238–4247. [Google Scholar] [CrossRef]
  15. Erber, G.; Kanzian, C.; Stampfer, K. Modelling natural drying of European beech (Fagus sylvatica L.) logs for energy based on meteorological data. Scand. J. For. Res. 2016, 31, 294–301. [Google Scholar] [CrossRef]
  16. Strandgard, M.; Turner, P.; Mirowski, L.; Acuna, M. Potential application of overseas forest biomass supply chain experience to reduce costs in emerging Australian forest biomass supply chains—A literature review. Aust. For. 2019, 1–9. [Google Scholar] [CrossRef]
  17. Zamora-Cristales, R.; Sessions, J.; Marrs, G. Economic implications of grinding, transporting, and pretreating fresh versus aged forest residues for biofuel production. Can. J. For. Res. 2017, 47, 269–276. [Google Scholar] [CrossRef] [Green Version]
  18. Lock, P.; Whittle, L. Future Opportunities for Using Forest and Sawmill Residues in Australia; ABARES: Canberra, Australia, 2018. [Google Scholar]
  19. Ghaffariyan, M.R.; Brown, M.; Acuna, M.; Sessions, J.; Kuehmaier, M.; Wiedemann, J. Biomass harvesting in Eucalyptus plantations in Western Australia. South. For. 2011, 73, 149–154. [Google Scholar] [CrossRef]
  20. Fung, P.Y.H.; Kirschbaum, M.U.F.; Raison, R.J.; Stucley, C. The potential for bioenergy production from Australian forests, its contribution to national greenhouse targets and recent developments in conversion processes. Biomass Bioenergy 2002, 22, 223–236. [Google Scholar] [CrossRef]
  21. Ximenes, F.; Stephens, M.; Brown, M.; Law, B.; Mylek, M.; Schirmer, J.; Sullivan, A.; McGuffog, T. Mechanical fuel load reduction in Australia: A potential tool for bushfire mitigation. Aust. For. 2017, 80, 88–98. [Google Scholar] [CrossRef]
  22. Taylor, J.; Warnken, M. Wood Recovery and Recycling: A Source Book for Australia; Project No: PNA017-0708; Forests and Wood Products Australia: Melbourne, Australia, 2008; p. 45. [Google Scholar]
  23. Taskhiri, M.S.; Jeswani, H.; Geldermann, J.; Azapagic, A. Optimising cascaded utilisation of wood resources considering economic and environmental aspects. Comput. Chem. Eng. 2019, 124, 302–316. [Google Scholar] [CrossRef]
  24. Acuna, M.; Anttila, P.; Sikanen, L.; Prinz, R.; Asikainen, A. Predicting and controlling moisture content to optimise forest biomass logistics. Croat. J. For. Eng. 2012, 33, 225–238. [Google Scholar]
  25. Asikainen, A.; Kuitto, P.-J. Cost factors in wood fuel procurement. N. Z. J. For. Sci. 2000, 30, 79–87. [Google Scholar]
  26. Nilsson, B.; Nilsson, D.; Thörnqvist, T. Distributions and losses of logging residues at clear-felled areas during extraction for bioenergy: Comparing dried- and fresh-stacked method. Forests 2015, 6, 4212–4227. [Google Scholar] [CrossRef] [Green Version]
  27. Whittaker, C.; Macalpine, W.; Yates, N.E.; Shield, I. Dry matter losses and methane emissions during wood chip storage: The impact on full life cycle greenhouse gas savings of short rotation coppice willow for heat. BioEnergy Res. 2016, 9, 820–835. [Google Scholar] [CrossRef] [Green Version]
  28. Striūgas, N.; Vorotinskienė, L.; Paulauskas, R.; Navakas, R.; Džiugys, A.; Narbutas, L. Estimating the fuel moisture content to control the reciprocating grate furnace firing wet woody biomass. Energy Convers. Manag. 2017, 149, 937–949. [Google Scholar] [CrossRef]
  29. Downham, R.; Gavran, M. Australian Plantation Statistics 2020 Update; ABARES: Canberra, Australia, 2020. [Google Scholar]
  30. ACIL Allen Consulting. Peak Demand and Energy Forecasts; Australian Energy Market Operator: Melbourne, Australia, 2017; p. 111. [Google Scholar]
  31. Strandgard, M.; Béland, M. Economics of forest biomass for bioenergy: Potential site preparation savings from coarse woody harvesting residue removal in a short-rotation Eucalyptus globulus (Labill.) plantation. Silva Balc. 2021, 22, 45–55. [Google Scholar] [CrossRef]
  32. Acuna, M.; Mirowski, L.; Ghaffariyan, M.R.; Brown, M. Optimising transport efficiency and costs in Australian wood chipping operations. Biomass Bioenergy 2012, 46, 291–300. [Google Scholar] [CrossRef]
  33. Pottie, M.; Guimier, D. Harvesting and Transport of Logging Residuals and Residues; FERIC Special Report SR-33; Forest Engineering Research Institute of Canada: Pointe-Claire, QC, Canada, 1986; p. 100.
  34. Paul, K.; Polglase, P.; Snowdon, P.; Theiveyanathan, T.; Raison, J.; Grove, T.; Rance, S. Calibration and uncertainty analysis of a carbon accounting model to stem wood density and partitioning of biomass for Eucalyptus globulus and Pinus radiata. New For. 2006, 31, 513–533. [Google Scholar] [CrossRef]
  35. Núñez-Regueira, L.; Proupín-Castiñeiras, J.; Rodríguez-Añón, J.A. Energy evaluation of forest residues originated from Eucalyptus globulus Labill in Galicia. Bioresour. Technol. 2002, 82, 5–13. [Google Scholar] [CrossRef]
  36. Mateos, E.; Ormaetxea, L. Sustainable Renewable Energy by Means of Using Residual Forest Biomass. Energies 2019, 12, 13. [Google Scholar] [CrossRef] [Green Version]
  37. Strandgard, M.; Mitchell, R.; Wiedemann, J. Comparison of Productivity, Cost and Chip Quality of Four Balanced Harvest Systems Operating in a Eucalyptus globulus Plantation in Western Australia. Croat. J. For. Eng. 2019, 40, 39–48. [Google Scholar]
  38. Acuna, M.; Sessions, J.; Zamora, R.; Boston, K.; Brown, M.; Ghaffariyan, M.R. Methods to manage and optimize forest biomass supply chains: A review. Curr. For. Rep. 2019, 5, 124–141. [Google Scholar] [CrossRef]
  39. Ghaffariyan, M.R.; Acuna, M.; Brown, M. Analysing the effect of five operational factors on forest residue supply chain costs: A case study in Western Australia. Biomass Bioenergy 2013, 59, 486–493. [Google Scholar] [CrossRef]
  40. Strandgard, M.; Mitchell, R.; Acuna, M.; Ghaffariyan, M.; Brown, M. Control and Manage the Moisture Content of Logs and Biomass to Maximise Benefits along the Wood Supply Chain. Forest and Wood Products Australia (FWPA): Melbourne, Australia, 2020. [Google Scholar]
  41. Acuna, M. Timber and biomass transport optimization: A review of planning issues, solution techniques and Decision Support Tools. Croat. J. For. Eng. 2017, 38, 279–290. [Google Scholar]
  42. Strandgard, M.; Acuna, M.; Turner, P.; Mirowski, L. Use of modelling to compare the impact of roadside drying of Pinus radiata D.Don logs and logging residues on delivered costs using high capacity trucks in Australia. Biomass Bioenergy 2021, 147, 106000. [Google Scholar] [CrossRef]
  43. Thörnqvist, T. Drying and storage of forest residues for energy production. Biomass 1985, 7, 125–134. [Google Scholar] [CrossRef]
  44. Filbakk, T.; Høibø, O.; Dibdiakova, J.; Nurmi, J. Modelling moisture content and dry matter loss during storage of logging residues for energy. Scand. J. For. Res. 2011, 26, 267–277. [Google Scholar] [CrossRef]
  45. Pecenka, R.; Lenz, H.; Hering, T. Options for Optimizing the Drying Process and Reducing Dry Matter Losses in Whole-Tree Storage of Poplar from Short-Rotation Coppices in Germany. Forests 2020, 11, 374. [Google Scholar] [CrossRef] [Green Version]
  46. Belbo, H.; Talbot, B. System analysis of ten supply chains for whole tree chips. Forests 2014, 5, 2084–2105. [Google Scholar] [CrossRef] [Green Version]
  47. Hall, P.; Gigler, J.K.; Sims, R.E.H. Delivery systems of forest arisings for energy production in New Zealand. Biomass Bioenergy 2001, 21, 391–399. [Google Scholar] [CrossRef]
  48. Greene, W.D.; Cutshall, J.B.; Dukes, C.C.; Baker, S.A. Improving Woody Biomass Feedstock Logistics by Reducing Ash and Moisture Content. BioEnergy Res. 2014, 7, 816–823. [Google Scholar] [CrossRef]
  49. Sessions, J.; Tuers, K.; Boston, K.; Zamora, R.; Anderson, R. Pricing forest biomass for power generation. West. J. Appl. For. 2013, 28, 51–56. [Google Scholar] [CrossRef]
  50. Batidzirai, B.; van der Hilst, F.; Meerman, H.; Junginger, M.H.; Faaij, A.P. Optimization potential of biomass supply chains with torrefaction technology. Biofuels Bioprod. Biorefin. 2014, 8, 253–282. [Google Scholar] [CrossRef]
  51. Lehtikangas, P. Quality properties of pelletised sawdust, logging residues and bark. Biomass Bioenergy 2001, 20, 351–360. [Google Scholar] [CrossRef]
  52. Allen, J.; Browne, M.; Hunter, A.; Boyd, J.; Palmer, H. Logistics management and costs of biomass fuel supply. Int. J. Phys. Distrib. Logis. Manag. 1998, 28, 463–477. [Google Scholar] [CrossRef]
  53. Singh, J.; Panesar, B.S.; Sharma, S.K. A mathematical model for transporting the biomass to biomass based power plant. Biomass Bioenergy 2010, 34, 483–488. [Google Scholar] [CrossRef]
  54. Mol, R.; Jogems, M.; Van Beek, P.; Gigler, J. Simulation and optimization of the logistics of biomass fuel collection. NJAS Wagening. J. Life Sci. 1997, 45, 217–228. [Google Scholar] [CrossRef]
  55. Rodriguez, L.C.; May, B.; Herr, A.; O’Connell, D. Biomass assessment and small scale biomass fired electricity generation in the Green Triangle, Australia. Biomass Bioenergy 2011, 35, 2589–2599. [Google Scholar] [CrossRef]
  56. Ghaffariyan, M.R.; Spinelli, R.; Magagnotti, N.; Brown, M. Integrated harvesting for conventional log and energy wood assortments: A case study in a pine plantation in Western Australia. South. For. 2015, 77, 249–254. [Google Scholar] [CrossRef]
  57. Brooksbank, K.; Lever, M.; Paterson, H.; Weybury, M. Biomass Scoping Study: Opportunities for Agriculture in Western Australia; Department of Agriculture and Food: Perth, WA, Australian, 2014.
  58. Rentizelas, A.A.; Tolis, A.J.; Tatsiopoulos, I.P. Logistics issues of biomass: The storage problem and the multi-biomass supply chain. Renew. Sustain. Energy Rev. 2009, 13, 887–894. [Google Scholar] [CrossRef] [Green Version]
  59. Gan, J. Supply of biomass, bioenergy, and carbon mitigation: Method and application. Energy Policy 2007, 35, 6003–6009. [Google Scholar] [CrossRef]
  60. Berry, M.D.; Sessions, J. The economics of biomass logistics and conversion facility mobility: An Oregon case study. Appl. Eng. Agric. 2018, 34, 57–72. [Google Scholar] [CrossRef] [Green Version]
  61. O’Connell, A.; Grove, T.; Mendham, D.; Corbeels, M.; McMurtrie, R.; Shammas, K.; Rance, S. Impacts of inter-rotation site management on nutrient stores and fluxes and growth of eucalypt plantations in southwestern Australia. In Site Management and Productivity in Tropical Plantation Forests, Congo and China; Center for International Forestry Research: Bogor Barat, Indonesia, 2004; p. 77. [Google Scholar]
  62. Chen, C.R.; Xu, Z.H. Soil carbon and nitrogen pools and microbial properties in a 6-year-old slash pine plantation of subtropical Australia: Impacts of harvest residue management. For. Ecol. Manag. 2005, 206, 237–247. [Google Scholar] [CrossRef]
  63. Abbas, D.; Current, D.; Phillips, M.; Rossman, R.; Hoganson, H.; Brooks, K.N. Guidelines for harvesting forest biomass for energy: A synthesis of environmental considerations. Biomass Bioenergy 2011, 35, 4538–4546. [Google Scholar] [CrossRef]
  64. Anonymous. Code of Practice for Timber Production 2014; Department of Environment and Primary Industries: Melbourne, VIC, Australia, 2014.
  65. Achat, D.L.; Fortin, M.; Landmann, G.; Ringeval, B.; Augusto, L. Forest soil carbon is threatened by intensive biomass harvesting. Sci. Rep. 2015, 5, 15991. [Google Scholar] [CrossRef] [PubMed]
  66. Shammas, K.; O’Connell, A.M.; Grove, T.S.; McMurtrie, R.; Damon, P.; Rance, S.J. Contribution of decomposing harvest residues to nutrient cycling in a second rotation Eucalyptus globulus plantation in south-western Australia. Biol. Fertil. Soils 2003, 38, 228–235. [Google Scholar] [CrossRef]
  67. Nilsson, D.; Nilsson, B.; Thörnqvist, T.; Bergh, J. Amount of nutrients extracted and left behind at a clear-felled area using the fresh-stacked and dried-stacked methods of logging residue extraction. Scand. J. For. Res. 2018, 33, 437–445. [Google Scholar] [CrossRef] [Green Version]
  68. Nurmi, J. The storage of logging residue for fuel. Biomass Bioenergy 1999, 17. [Google Scholar] [CrossRef]
  69. Brunberg, T.; Eliasson, L. Productivity Standards for Forwarding of Logging Residues; Skogforsk: Uppsala, Sweden, 2011. [Google Scholar]
  70. Eliasson, L.; Nordén, B. A New Grapple with Potential to Increase Productivity; Skogforsk: Uppsala, Sweden, 2010. [Google Scholar]
  71. Visser, R.; Berkett, H.; Spinelli, R. Determining the effect of storage conditions on the natural drying of radiata pine logs for energy use. N. Z. J. For. Sci. 2014, 44, 3. [Google Scholar] [CrossRef] [Green Version]
  72. Lin, Y.; Pan, F. Effect of in-woods storage of unprocessed logging residue on biomass feedstock quality. For. Prod. J. 2013, 63, 119–124. [Google Scholar] [CrossRef]
  73. Kofman, P.D.; Kent, T. Harvesting and Processing Forest Biomass for Energy Production in Ireland: The Forest Energy 2006 Programme; Coford: Dublin, Ireland, 2007. [Google Scholar]
  74. Stanturf, J.A.; Kellison, R.C.; Broerman, F.; Jones, S.B. Innovation and forest industry: Domesticating the pine forests of the southern United States, 1920–1999. For. Policy Econ. 2003, 5, 407–419. [Google Scholar] [CrossRef]
  75. Hewitt, R.; Sowlati, T.; Paradi, J.C. Information Technology Adoption in US and Canadian Forest Products Industries. For. Prod. J. 2011, 61, 161–169. [Google Scholar] [CrossRef]
  76. Ghaffariyan, M.R.; Sessions, J.; Brown, M. Roadside chipping in a first thinning operation for radiata pine in South Australia. Croat. J. For. Eng. 2013, 34, 91–101. [Google Scholar]
  77. Calviño-Cancela, M.; van Etten, E.J.B. Invasive potential of Eucalyptus globulus and Pinus radiata into native eucalypt forests in Western Australia. For. Ecol. Manag. 2018, 424, 246–258. [Google Scholar] [CrossRef]
  78. Janze, P. Biomass Storage Pile Basics. Available online: http://www.advancedbiomass.com/2011/11/biomass-storage-pile-basics/ (accessed on 22 September 2020).
  79. Fernandez-Lacruz, R.; Eriksson, A.; Bergström, D. Simulation-Based Cost Analysis of Industrial Supply of Chips from Logging Residues and Small-Diameter Trees. Forests 2020, 11, 1. [Google Scholar] [CrossRef] [Green Version]
  80. Roos, C.J. Biomass Drying and Dewatering for Clean Heat & Power; Northwest CHP Application Center Olympia: Washington, DC, USA, 2008. [Google Scholar]
  81. Malico, I.; Pereira, R.N.; Gonçalves, A.C.; Sousa, A.M. Current status and future perspectives for energy production from solid biomass in the European industry. Renew. Sustain. Energy Rev. 2019, 112, 960–977. [Google Scholar] [CrossRef]
  82. Shabani, N.; Akhtari, S.; Sowlati, T. Value chain optimization of forest biomass for bioenergy production: A review. Renew. Sustain. Energy Rev. 2013, 23, 299–311. [Google Scholar] [CrossRef]
Figure 1. Log and logging residue (LR) post-harvest arrangements (a) LR conventional; (b) LR fuel-adapted [11].
Forests 12 00455 g001
Figure 2. E. globulus drying curves used in MCPlan. (a) Logging residue; (b) Whole trees.
Forests 12 00455 g002aForests 12 00455 g002b
Figure 3. Delivered costs for the LR conventional, LR fuel-adapted and whole tree FB types for the No Storage (NS), up to Two Months storage (TM) and Optimum Storage (OS) scenarios.
Forests 12 00455 g003
Figure 4. Truck weight and volume utilisation for each FB/harvest system and scenario as a percentage of maximum weight and volume capacities.
Forests 12 00455 g004
Figure 5. Mean MC (%) weighted by chip volume (m3) against transport distance (km) for the (a) TM scenario, and (b) OS scenario.
Forests 12 00455 g005
Figure 6. Volume stored and storage duration of LR conventional, LR fuel-adapted and whole trees during the 2-year planning horizon. (a) LR conventional; (b) LR fuel-adapted; (c) Whole trees.
Forests 12 00455 g006aForests 12 00455 g006b
Figure 7. Cost changes for each FB supply chain activity when monthly storage losses were changed to 0.1% or 2%. (a) LR conventional; (b) LR adaptive; (c) Whole trees.
Forests 12 00455 g007aForests 12 00455 g007b
Table 1. Model parameters for Forest Biomass (FB) types.
ParameterUnits Logging ResidueWhole Trees
Basic density (0% Moisture Content (MC) weight/solid volume) 1kg/m3 450500
Bulk density (chips) (0% MC weight/bulk volume) 2kg/m3 189210
Bulk volume (m3) to solid volume (m3) ratio 2.382.38
Solid content 2 0.420.42
Proportion of FB extracted 2 *% Conventional: 4095
Fuel-adapted: 70
FB yield 2m3/ha Conventional: 45250
Fuel-adapted: 84
Delivered MC range%No storageMC at harvestMC at harvest
Two months≤48≤48
Optimum 3≤35≤35
Material loss rate 4%/month 1.01.0
Harvest age 5years 1010
Energy content @ 0% MCGJ/t 19.0 619.0 7
One-way distancekm 25–150 525–150 5
Interest rate 5%/month 0.50.5
Harvest and transport to roadside 8$/t -6.00
Transport to roadside 8$/tConventional13.00-
Fuel-adapted9.40-
Transport rate 9$/t-km25 km0.200.20
50 km0.150.15
75 km0.150.15
100 km0.140.14
125 km0.130.13
150 km0.120.12
Chipping cost 10$/tMC > 50%9.59.5
MC 36–50%9.79.7
MC ≤ 35%10.010.0
* Proportion of LR refers to the total LR produced. Proportion of whole trees refers to the total aboveground biomass, excluding the stump. 1. Based on published figures [35] and unpublished research. 2. Based on unpublished research. 3. Based on the ISO 17225 standard for non-industrial chipped material (Grade A2). 4. As there are no published eucalypt LR loss rates, a typical figure for coniferous LR was used. 5. Typical values for Australian E. globulus plantations. 6. From Núñez-Regueira, Proupín-Castiñeiras and Rodríguez-Añón [35]. 7. From Mateos and Ormaetxea [36]. 8. From Strandgard, et al. [37] and Strandgard and Mitchell [11]. 9. Cost of secondary transport by semi-trailer. Published and industry sources. 10. Based on Acuna et al. [16] and unpublished sources.
Table 2. Sets, parameters and variables used in the MCPlan model formulation.
TermDefinition
Sets
i, jPeriods, i I = {1, …, 24}, j J = {13, …, 24}
sSupply areas, s S
Parameters
BFsBiomass factor—ratio between solid volume of LR and solid volume of logs produced in each supply area s
LVFLRLoose volume factor—loose volume of chips produced from 1 m3 solid of LR
LVFRWLoose volume factor—loose volume of chips produced from 1 m3 solid of logs
SCRWsSolid volume of logs available in supply area s (m3 s)
EDjEnergy demand of energy plant in period j (energy unit, MWh)
ECLRijEnergy content of chips produced in period j from LR stacked at the roadside from period i (energy unit per loose volume of chips, e.g., MWh/m3 L)
ECRWijEnergy content of chips produced at static chipmill in period j from logs stacked at the roadside from period i (energy unit per loose volume of chips, e.g., MWh/m3 L)
MCRWijMoisture content of logs stacked at the roadside from period i to period j (%)
MCLRijMoisture content of LR stacked at the roadside from period i to period j (%)
MinMCRW, MinMCLRMinimum moisture content of logs and LR delivered to energy plant, respectively (%)
MaxMCRW, MaxMCLRMaximum moisture content of logs and LR delivered to energy plant, respectively (%)
CTRWijs, CTLRijsTransport cost for logs and chips from LR stacked at the roadside in supply area s and period i and delivered to the energy plant in period j, respectively ($/m3 s for logs and $/m3 L for chips from LR)
CHRWis, CHLRisHarvest and primary transport cost for logs and LR produced in period i and supply area s ($/m3 s)
CDRWij, CDLRijDrying cost for logs and LR stacked at the roadside from period i to period j ($/m3 s)
CCHRWij, CCHLRijChipping cost for logs and LR stacked at the roadside from period i to period j ($/m3 s for logs and $/m3 L for LR)
Variables
XijsDecision variable. Solid volume of logs harvested in period i, and dried at the roadside until period j in supply area s (m3 s)
YijsDecision variable. Solid volume of LR collected in period i, and dried at the roadside until period j in supply area s (m3 s)
X’ijsXijs × LVFRW Loose volume of chips produced from logs harvested in period i, and dried at the roadside until period j in supply area s (m3 L)
Y’ijsYijs × LVFLR Loose volume of chips produced from LR collected in period i, and dried at the roadside until period j in supply area s (m3 L)
Table 3. Delivered cost changes for each FB type and scenario in response to increasing or decreasing MC by 5% (percentage delivered cost change shown in brackets).
Delivered Cost ($/MWh) (% Change)
ScenarioFB Type5% MC Decrease5% MC Increase
OSLR conventional10.81 (−4.0)11.78 (4.7)
LR fuel-adapted8.84 (−4.3)9.69 (5.0)
Whole trees7.43 (−5.8)8.39 (6.4)
TMLR conventional12.52 (−3.3)13.46 (3.9)
LR fuel-adapted10.38 (−3.5)11.21 (4.2)
Whole trees8.71 (−8.2)9.70 (2.2)
Publisher’s Note: MDPI stays neutral with regard to jurisdictional claims in published maps and institutional affiliations.

