Article

Genetic Diversity and Population Genetic Structure of Ancient Platycladus orientalis L. (Cupressaceae) in the Middle Reaches of the Yellow River by Chloroplast Microsatellite Markers

Key Comprehensive Laboratory of Forestry, College of Forestry, Northwest A & F University, Yang Ling 712100, China
*
Author to whom correspondence should be addressed.
These authors contributed equally to this work.
Forests 2021, 12(5), 592; https://doi.org/10.3390/f12050592
Submission received: 4 April 2021 / Revised: 30 April 2021 / Accepted: 6 May 2021 / Published: 9 May 2021

Abstract

:
Ancient trees are famous for their life spans of hundreds or even thousands of years. These trees are rare, a testament to history and are important for scientific research. Platycladus orientalis, with the longest life span and a beautiful trunk, has become the most widely planted tree species and is believed to be sacred in China. Extensive declines in habitat area and quality pose the greatest threats to the loss of genetic diversity of ancient P. orientalis trees in the middle reaches of the Yellow River. Strengthening the protection of P. orientalis genetic resources is of great significance for the long-term development of reasonable conservation and breeding strategies. To better understand the genetic diversity and population structure of P. orientalis, we successfully analyzed four polymorphic chloroplast simple sequence repeat (cpSSR) loci and applied them to diversity and population structure analyses of 202 individuals from 13 populations in the middle reaches of the Yellow River. Based on the cpSSR data, 16 alleles were detected across 202 individuals, and a moderate level of genetic diversity was inferred from the genetic diversity parameters (H = 0.367 and AR = 1.964). The mean pairwise genetic differentiation coefficient (Fst) between populations was 0.153, indicating relatively high genetic population differentiations. Analysis of molecular variance (AMOVA) showed that only 8% of the variation occurred among populations. Structure analysis divided the 13 P. orientalis populations into two groups with no significant geographic population structure, which was consistent with the unweighted pair group method with arithmetic mean (UPGMA) and Mantel test results. These results may indicate that transplanting and cultivation by ancient human activities are the main factors responsible for the revealed pattern of genetic differentiation of ancient P. orientalis populations. Our research is of great significance for the future establishment of protection schemes and scientific breeding of P. orientalis.

1. Introduction

Ancient trees are those that have lived for hundreds or even thousands of years [1]. They are precious specimens of natural resources and have important scientific research value [2]. As resources of genetic diversity and reproductive ability, ancient tree populations have many valuable genes in their gene pool [3].
Platycladus orientalis (L.) Franco, belonging to the genus Platycladus (Cupressaceae) of evergreen coniferous tree species, is the main afforestation tree species in the arid regions of the Loess Plateau of Northwest China [4,5,6]. Due to its long lifespan, beautiful trunk, sacred status and important economic value, P. orientalis has been planted in gardens, temples and the vicinity of mausoleums since ancient times [7]. It is the most widely planted cemetery tree species in China [8]. The age of P. orientalis can reach hundreds or even thousands of years [9]. An ancient P. orientalis tree at the Mausoleum of the Yellow Emperor in Shaanxi Province has witnessed the history and culture of China for more than 4000 years, and is known as the oldest ancient P. orientalis tree in the world [1].
The middle reaches of the Yellow River are considered to be one of the important birthplaces of Chinese civilization [10], mainly including Henan Province, Shaanxi Province, Shanxi Province and parts of Gansu Province [11]. This region is not only an area of the dense distribution of ancient P. orientalis trees in China [12,13], but also a region with a long history of human settlement [10]. Temples, cemeteries, and ancient academies in the middle reaches of the Yellow River have the largest number of ancient trees of P. orientalis, and have become tourist destinations with unique cultural value in China [1]. Recently, due to rapid changes in climate and the environment, intense human activities and overexploitation of forest resources, many populations of ancient P. orientalis have decreased their size or even disappeared, and their excellent genetic resources are facing great challenges and threats [9,14].
Accurate assessment the genetic diversity and population structure of ancient trees is an important prerequisite for the protection of their genetic resources [14,15]. Molecular marker technology has greatly facilitated assessments of the genetic resources of plants and the level of genetic diversity in tree species [16], and has been recognized as an effective means of genetic analysis of coniferous species [17]. Chloroplast simple sequence repeats (cpSSRs) are a new and efficient molecular marker technology developed in recent years [18]. Due to their high polymorphism, uniparental inheritance through chloroplast DNA (cpDNA) and lack of sexual recombination [19], cpSSRs allowing to trace haplotype diversity have become ideal markers in population genetic diversity evaluation, population structure analysis and phylogenetic studies [20,21]. Previous research has established that the inheritance pattern of cpDNA in P. orientalis is patrilineal [22], which also makes it an ideal marker for monitoring gene exchange and genetic differentiation among populations [23].
To date, the roles of genetic diversity and population structure in P.orientalis remain largely unexamined. A few published studies have attempted to detect the genetic diversity of P. orientalis with molecular markers such as isozymes [13], amplified fragment length polymorphisms (AFLPs) [24], simple sequence repeat markers (SSRs) [25,26], and single nucleotide polymorphisms (SNPs) [9]. However, Huang, et al. [27] established a set of cpSSR markers that can be transferred between different genera of Cupressaceae, and used eight nuclear SSRs (nSSRs) and four cpSSRs to reconstruct the family of P. orientalis seed gardens in Henan Province, China [27,28]. Surprisingly, no research has surveyed the genetic diversity and population structure of ancient P. orientalis using cpSSR markers. This includes the middle reaches of the Yellow River, an area with rich resources of ancient P. orientalis trees. This lack of research has hindered the protection and utilization of the precious genetic resources hidden in the ancient trees of P. orientalis.
Knowledge of the degree and distribution of genetic diversity can guide efficient gene conservation sampling designs [29]. This study set out to investigate the usefulness of four polymorphic cpSSR loci for evaluating the haplotype diversity level of 13 P. orientalis populations in the middle reaches of the Yellow River and to analyze the genetic diversity and genetic structure of the populations. These results provide a theoretical basis for the protection and utilization of ancient P. orientalis germplasm resources and reveal the population history of P. orientalis in the middle reaches of the Yellow River.

2. Materials and Methods

2.1. Plant Material

We collected a total of 202 individuals from 13 populations of ancient P. orientalis in four provinces (Gansu, Shanxi, Henan and Shaanxi) of China (the oldest and best-preserved ancient P. orientalis populations in the middle reaches of the Yellow River) (Figure 1, Table 1). The decision for sample collection was approved by the Yellow Emperor Mausoleum Administration (Letter No. 036-043). All of the samples were carefully identified by Professor Yongxiang Kang of Northwest A&F University based on the descriptions in Flora of China. All ancient trees of P. orientalis were over 500 years old. The age was based on the diameter at breast height (DBH) [9] of the selected trees and the historical records provided by the local government department responsible for managing ancient trees. The fresh young leaves were collected in the field preserved with silica gel, transferred to the laboratory of the Ancient and Famous Tree Protection and Breeding Engineering Technology Research Center of the National Forestry and Grassland Administration, and stored at −80 °C until the DNA was extracted.

2.2. DNA Extraction and cpSSR Analysis

Total genomic DNA was extracted with a Plant Genome DNA Extraction Kit (BioTeke, Beijing, China). The quality and concentration of DNA were verified by 1.5% agarose gel electrophoresis and a NanoDrop2000 (BioTeke Instruments, Winooski, VT, USA). For cpSSR analysis, DNA was diluted to 50 ng/μL and stored at −20 °C. The screening of cpSSR polymorphic primers was based on a set of cpSSR marker systems established by Huang et al. [27], which was transferable among different genera of Cupressaceae. We used all DNA samples from 13 ancient populations of P. orientalis for polymerase chain reaction (PCR) amplification. A total of 22 of the 26 cpSSR loci (N1, N2, N4, N6, N8, N9, N10, N13, N14, N15, N18, N19, N20, N22, N23, N25, N27, N28, N31, N32, N33, and N35) in the ancient P. orientalis trees were amplified successfully (Table S1), and used an ABI 3730 sequencer to perform fluorescence capillary electrophoresis to detect their polymorphism levels. However, only four cpSSR loci were polymorphic (N1, N2, N6, and N33) (Table 2). All the primers used in this study were synthesized by Sangon Biotech (Shanghai, China).
PCR amplifications were performed using 25 μL reactions containing 50 ng of genomic DNA, 2 × Taq Master Mix, and 10 pmol of forward and reverse primers. The PCR conditions were as follows: an initial denaturation at 95 °C for 3 min; followed by 35 cycles of 30 s at 95 °C, 30 s at 56 °C, and 30 s at 72 °C; and a final extension 5 min at 72 °C. An ABI3730XL DNA analyzer (Applied Biosystems, Foster City, CA, USA) was used to separate fluorescently labeled PCR products (FAM, HEX, TAMRA, ROX), and the data were analyzed with Gene Mapperv4.0 software (Applied Biosystems, Foster City, CA, USA).

2.3. Statistical Analysis

POPGENE ver.1.3.2 [30] and GenALEx ver.6.5 [31] were used to characterize and calculate the polymorphism level of four cpSSR loci (Table 2). The metrics calculated included the number of alleles per locus (Na), the number of effective alleles per locus (Ne), the mean number of private alleles (Apriv) per locus, Shannon–Weiner index (I), Nei’s gene diversity (H), the genetic differentiation coefficient (Fst) and gene flow (Nm), Nm = [(1/Fst) − 1]/4. The allelic richness (AR, based on a randomization of a minimum of six individuals at one locus) was determined via FSTAT 2.9.3 software [32]. PIC_CALC v.0.6 [33] was used to calculate the polymorphism information content (PIC) of genets. Tests of deviation from Hardy–Weinberg equilibrium per locus and the linkage disequilibrium between the pairs of loci in each population were performed at a significance level of 0.05, using GENEPOP v1.2 [34].
To test for recent bottleneck events in the targeted populations, Bottleneck v.1.2 [35] was applied (with the stepwise mutation model (SMM) and two-phase model (TPM), and their significance was tested. The proportion of the SMM was set to 70% under default settings. Genetic analysis in the Excel (GenAlEX ver.6.5) package was used to determine Nei’s genetic distance (D) and Nei’s genetic identity among populations. The significance of Fst values for the targeted populations across all loci was calculated by Holm’s sequential Bonferroni correction.
Analysis of molecular variance (AMOVA) was performed using Arlequin version 3.1 and significance was tested based on 1000 permutations [36]. In addition, to test for a correlation between genetic distances and geographical distances (in kilometers) among populations, the Mantel matrix correspondence test was performed [37].
Nei’s genetic identity was applied to evaluate the genetic relationships among populations. The unweighted pair group method with arithmetic mean (UPGMA) was used to perform cluster analysis on the genetic similarity data, and NTSYS ver. 2.1 (Applied Biostatistics, Port Jefferson, New York, NY, USA) software was used to obtain tree diagrams [38].
Population structure was explored by using STRUCTURE ver.2.3.4 with a Bayesian clustering approach [39]. Testing ten independent runs with K from 1 to 13, each run had a burn-in period of 100,000 iterations and 500,000 Monte Carlo Markov iterations, assuming an admixture model. The targeted populations were separated into groups by the Structure Harvester program [40] based on the ∆K values [41].

3. Results

3.1. Microsatellite Analysis

Sixteen different alleles were detected for the four cpSSR loci across all 202 individuals in the thirteen populations of P. orientalis (Table 3, File S1). The N2 locus exhibited the largest Na (six), while the N1 locus exhibited the largest Ne (1.833), I (0.793), PIC (0.397), H (0.455) and Fst (0.210). However, locus N33 showed lower than mean values of mentioned above statistics. The I ranged from 0.548 (N33) to 0.793 (N1) with a mean of 0.673. In terms of PIC values, three loci (N1, N2 and N6) had highly informative alleles with values higher than 0.3, while only N33 had less informative alleles, with a value less than 0.25. The mean H and Nm values were 0.367 (0.258–0.455) and 1.503 (0.221–1.935), respectively. This shows that there was a high level of historical gene exchange among populations. The mean Fst for the loci was 0.153 (0.114–0.210). The results showed that the four cpSSR loci selected in this study had high polymorphism in the thirteen populations of P. orientalis in the middle reaches of the Yellow River of China.

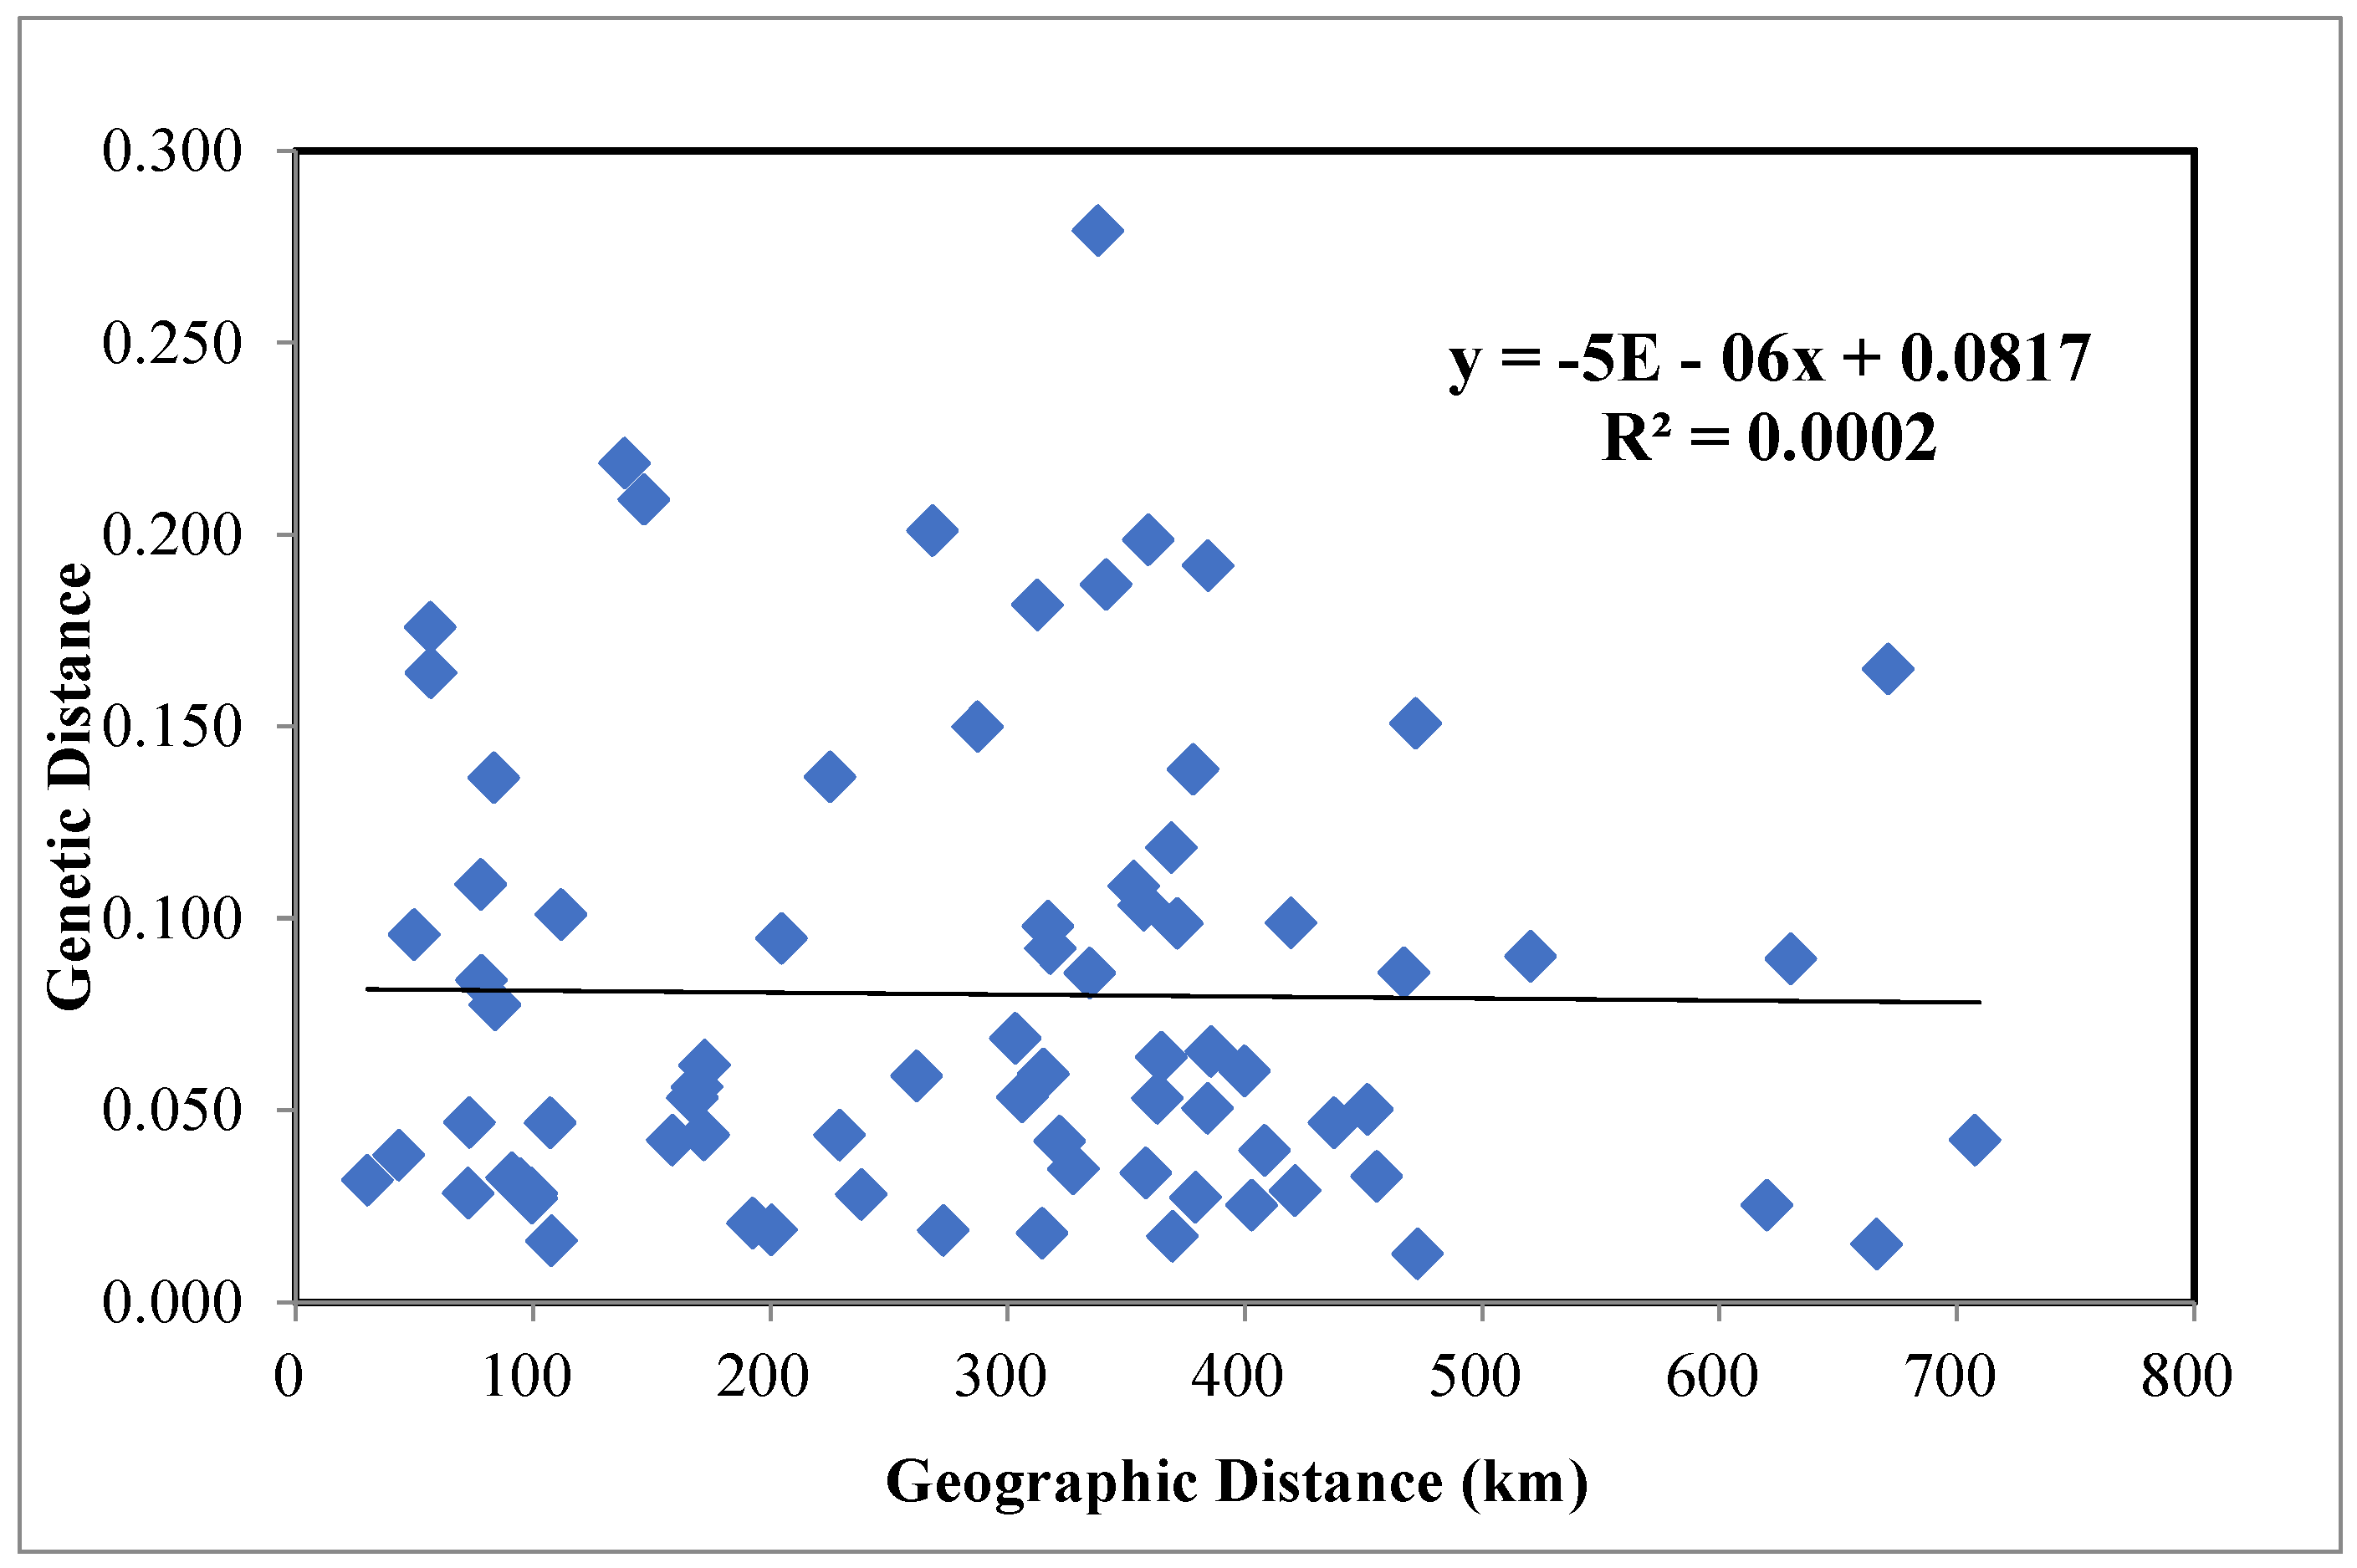
3.2. Genetic Diversity and Mantel Test Results in P. orientalis

The four cpSSR loci were amplified consistently under standard conditions, produced clear products and were used to assess population genetic structure. Genetic diversity was recorded at the population level (Table 1). The data showed that the mean Na in the populations was 2.173 (1.250–2.750) and that the mean Ne was 1.482 (1.096–1.858). The AR of the ancient P. orientalis calculated for a minimum sample size of six individuals per population was compared with that of the other populations, which on the average was 1.964 (1.250–2.371). The mean of Apriv was 0.096 (0.000–0.250). The YCSD population had the lowest values for allelic richness and private alleles (AR = 1.250 and Apriv = 0.000), and TSQC population (AR = 2.371 and Apriv = 0.250) had the highest values. The Shannon–Weiner index (I) ranged from 0.113 (YCSD) to 0.678 (TSQC), with an average of 0.462. In the bottleneck analysis, no significant heterozygote deficits were detected in the thirteen populations under the TPM and SMM models (Table 1). This suggests that none of the populations in this study exhibited signs of a recent bottleneck.
AMOVA was performed based on 295.614 permutations and revealed the genetic variation among and within populations for ancient P. orientalis (Table 4). The AMOVA showed that 8% of the total genetic variation occurred among populations and a significant amount (92%, p < 0.001) of the total variation occurred within populations.
We further analyzed the correlation between genetic distance and geographical distance (File S2) for the 13 populations using the Mantel test (Figure 2). Nei’s genetic distances are listed in Table 5. There was no significant correlation between genetic distance and geographic distance (R2 = 0.0002, p = 0.470).

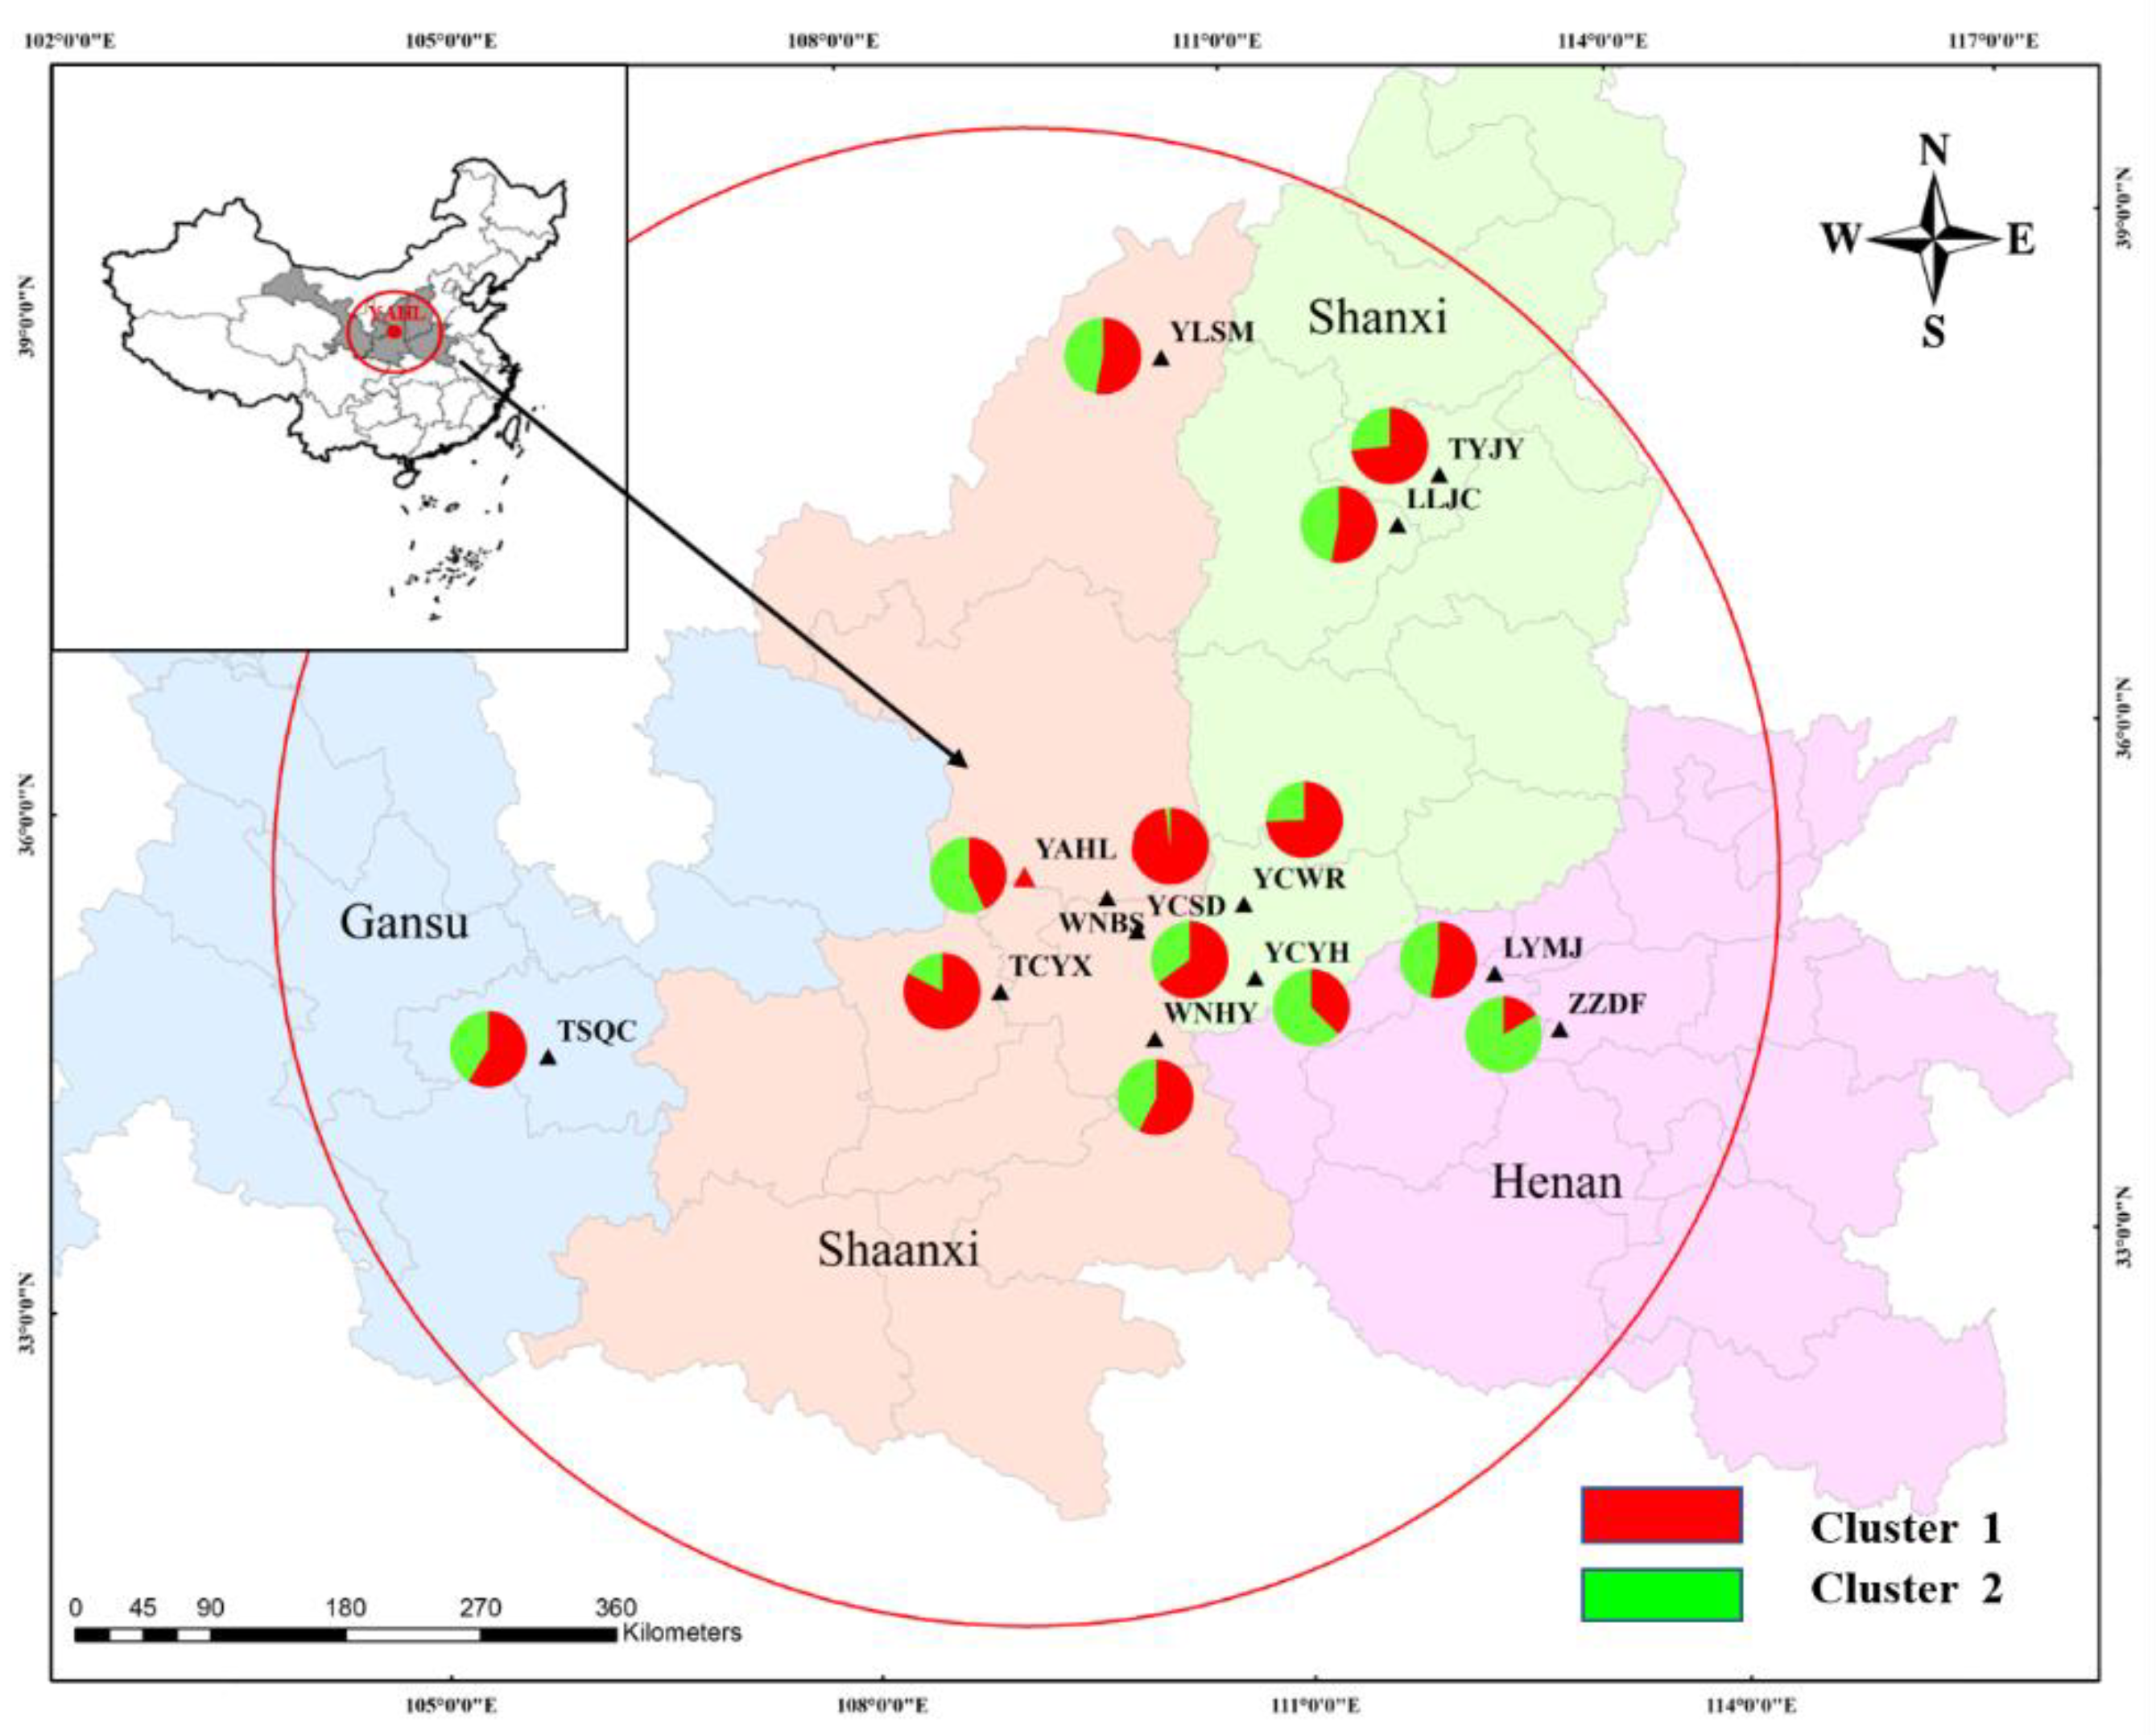
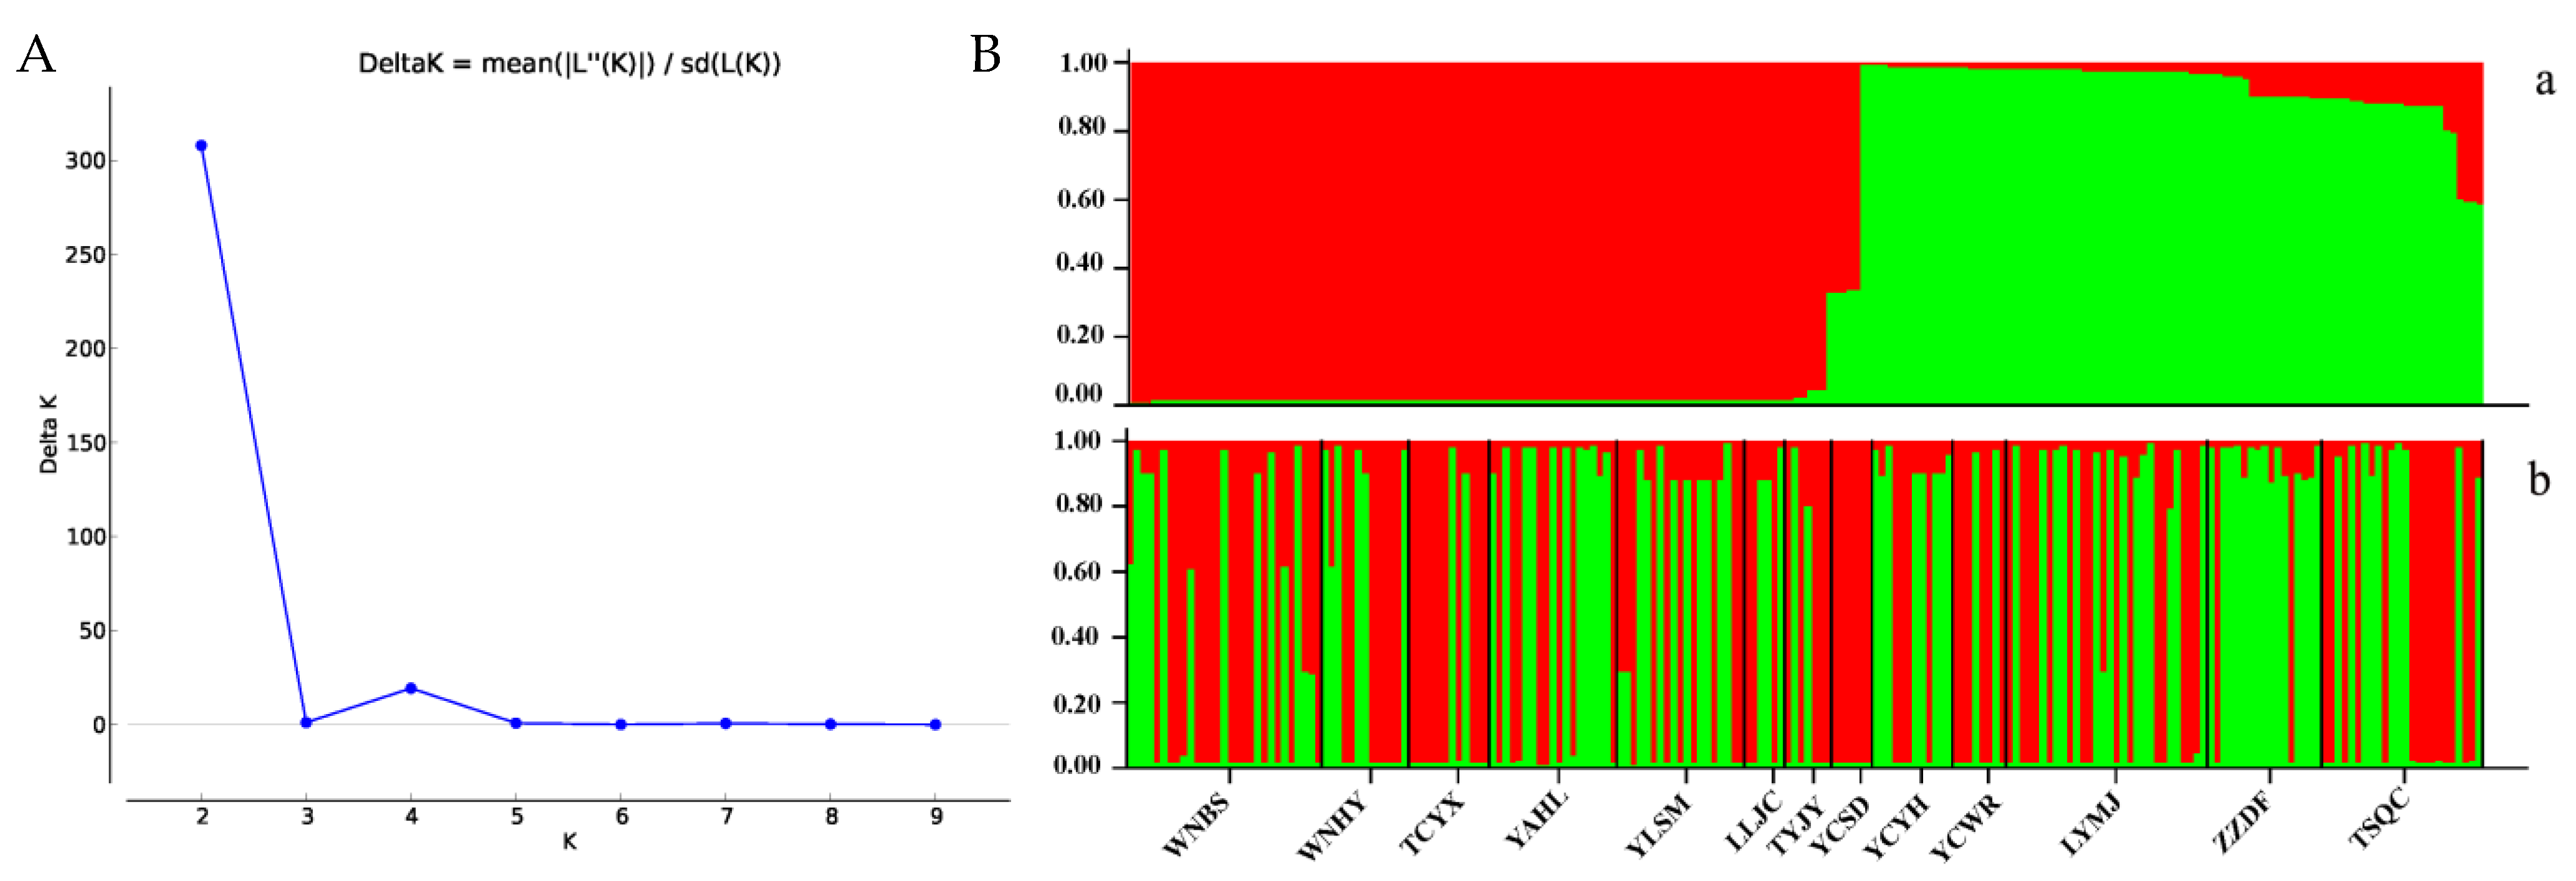
3.3. Population Clustering and Genetic Structure of P. orientalis

The values of Nei’s genetic distance among the studied populations ranged from 0.013 (YCWR/TSQC) to 0.279 (YAHL/TSQC). Similarly, the genetic identity varied from 0.756 (YCSD/ZZDF) to 0.987 (TYJY/YCSD) (Table 5). The clustering of populations according to the UPGMA dendrogram, which was based on pairwise genetic identity, showed that two groups were separated clearly at the population level (Figure 3). The resulting tree showed two groups among the 202 individuals from the 13 P. orientalis populations. The first group was composed of ten populations (WNBS, WNHY, YCWR, TCYX, TYJY, YCSD, YLSM, LLJC, LYMJ, and TSQC), and the second group was composed of three populations (YAHL, ZZDF, and YCYH).
In the population structure analysis, the highest ∆K value (307.899) (Figure 4A) had a clear peak for the 202 individuals from 13 populations when K = 2, indicating that 2 was the optimal number of genetic clusters and that all the studied plants exhibited admixture from two groups (Pop-red and Pop-green) (Figure 4B). The cluster membership probabilities of each individual from the 13 populations are shown in Figure 4B. Individuals with a proportion above 0.75 were considered pure; otherwise, they were considered admixed [42]. Pop-red contained 109 individuals, with 104 pure and five admixed individuals, while Pop-green contained 93 individuals, with 89 pure and four admixed individuals. Nearly all populations were composed of mixed individuals from two clusters (Pop-red and Pop-green), except the YCSD population, which was entirely composed of individuals from the red cluster (Pop-red). On the basis of the Q values (the probability that the genomic variation of population No. I material originated from the K population), we also graphed the cluster membership probabilities for each population at K = 2 (Figure 1). The chart shows that there is no obvious geographical distribution among the populations, which is consistent with the results of the Mantel test and cluster analysis.

4. Discussion

Ancient tree populations have specific alleles that are not found in other populations, constituting a set of unique genetic resources [14]. Nowakowska et al. [43] studied monumental Norway spruce trees in the Białowieża Primeval Forest in Europe on the basis of the frequencies of 11 nuclear microsatellite loci. Their results demonstrated that the loss of old spruce trees will cause a decrease in genetic variability in the Norway spruce population within the exceptionally valuable Białowieża Primeval Forest. The ancient trees of P. orientalis growing in the middle reaches of the Yellow River are precious plant genetic resources as well as important symbols and products of thousands of years of history and culture in China [8]. Prior studies have noted the importance of habitat loss and fragmentation as two of the greatest threats to the loss of diversity of P. orientalis [44,45]. Meanwhile, genetic diversity and genetic structure play an important role in the survival and adaptation of a species [29,46,47]. In our field investigation, we found that almost all of the ancient P. orientalis trees in the middle reaches of the Yellow River are scattered sporadically, growing slowly, or even withered. At some sample sites, there were fewer than ten individuals. Compared with other non-ancient tree species, the remaining samples are precious [9,14]. Therefore, a more exhaustive study on the genetic resources and genetic structure of ancient P. orientalis trees in the middle reaches of the Yellow River will provide a basis for establishing a germplasm resource bank of ancient P. orientalis and exploring the population history of this species in the future.
Xie et al. [13] used 19 isozymes to analyze the genetic structure of 14 natural P. orientalis populations and found that most variation occurred among individuals within populations. Wang et al. [24] used AFLP molecular markers to analyze the genetic diversity of 18 P. orientalis provenances from China and found that the genetic diversity of the P. orientalis provenances was relatively high. Zhu et al. [25] developed nine polymorphic nuclear microsatellite markers for P. orientalis, an evergreen tree. Jin et al. [26] used microsatellite loci developed based on P. orientalis transcriptome data to evaluate the genetic diversity of 192 elite individuals of P. orientalis in the seed orchards of Henan Province, and the obtained data will contribute to the upgrading of P. orientalis seed orchards in the future. Chang et al. [9] analyzed the distribution pattern of ancient P. orientalis in China based on 13 bioclimatic factors, and used the specific-locus amplified fragment (SLAF) sequencing method to detect SNPs in 100 germplasm resources. Unfortunately, the study did not consider the genetic diversity and population structure of this collection of P. orientalis, which represents the most valuable germplasm resource bank of this species.
Compared with nSSR markers, cpSSR are usually located within noncoding regions [48], with a lower evolutionary rate and higher transferability, which enables us to analyze the genetic diversity level and genetic structure of plant populations at the unique chloroplast genome level [27,49,50]. We used all 202 sample trees from different populations to amplify the polymorphisms of 26 cpSSR markers, and the results showed that only four cpSSR markers (N1, N2, N6 and N33) showed a certain degree of polymorphism. The other 22 cpSSR markers showed monomorphism with very low specificity or were even unable to be amplified. Two possible reasons for this result are the different degrees of genetic variation among the samples and the specificities among different species of Cupressaceae. In addition, in the study of Huang et al. [27], four species of Cupressaceae were selected for the development of polymorphic cpSSR markers, and the P. orientalis test materials were selected only from the P. orientalis seed orchard in Henan Province.
Numerous studies have shown that 4–6 high-level polymorphic loci are sufficient to assess genetic diversity and gene flow among populations [51,52,53]. In our study, a total number of 16 alleles were amplified with the use of four cpSSR loci was slightly lower than that reported by Huang et al. [28]. The number of alleles in the ancient tree populations can be driven by many factors, such as the initial genetic composition, the genetic selection, the genetic drift of the population, and direct and indirect human activity. In addition, our study showed that the P. orientalis populations in the middle reaches of the Yellow River have moderate genetic diversity, as measured by the Ne, AR, and H. The high diversity of germplasm resources is essential for the formulation of long-term effective breeding programs [26]. Thus, these trees should be protected as an important genetic resource bank. The results of this study are consistent with those of most current research revealing genetic diversity in ancient P. orientalis in Beijing [9,14]. However, compared with the genetic diversity metrics obtained with nSSRs, those obtained with cpSSRs for the ancient populations of P. orientalis were lower. The chloroplast genome of conifers has no inverted repeat (IR) region [54], which has a significant impact on the evolution rate of the plastid genome compared with that in angiosperms.
Population structure and genetic relationships are important for establishing the appropriate scale and subunits for conservation management [55]. Population structure is manifested mainly as genetic differentiation among populations [44]. In our study, the genetic differentiation of ancient P. orientalis populations across the four cpSSR loci was high (Fst = 0.153). For long-lived tree species, population history seems to be the main factor responsible for this observation. We also observed similar results in previous studies [56,57]. Furthermore, due to the limited size of ancient P. orientalis populations in our study, genetic drift is also an important factor, which might shape the observed genetic differentiation [58,59]. The AMOVA results revealed that only 8% of the total variance were explained by differences among populations, whereas most of the genetic variation of the P. orientalis population from the middle reaches of the Yellow River was located among individuals. The most obvious finding that emerged from the UPGMA analysis was that the 13 P. orientalis populations could be divided into two groups (with the genetic similarity coefficient between them of 0.89) that did not correspond to their geographic distributions across China. Furthermore, both the Mantel test and population STRUCTURE analysis revealed that there were almost no obvious geographical boundaries for the 13 ancient P. orientalis populations. The influence of ancient human activities may be the main reason for this result. This supports the findings of previous research that past human activities had a significant impact on the population structure and genetic diversity of tree populations [60,61]. In ancient times, temples or royal cemeteries were important places for people to pray for blessings or hold large-scale sacrificial events. P. orientalis from different regions was separated from its original habitat and established spontaneous stands.
The ancient P. orientalis population with a history spanning several thousands of years has an abundance of genetic resources. Our results confirm those of previous studies that cemeteries and ancient temples played an important role in maintaining the genetic diversity and reproductive capacity of P. orientalis [14]. With the destruction of habitats and improper management, the populations of P. orientalis are gradually shrinking. The genetic consequences of reduced population sizes include increased genetic drift and inbreeding, leading to a loss of genetic variation [56,62]. Therefore, it is urgently important that in situ conservation of ancient populations of P. orientalis be carried out, especially populations with high genetic diversity and unique alleles, such as the YAHL population and the TCYX population in Shaanxi Province, the ZZDF population in Henan Province and the TSQC population in Gansu Province.

5. Conclusions

This is the first study to use cpSSR markers to investigate the genetic composition of P. orientalis populations in the middle reaches of the Yellow River. The results confirmed that ancient P. orientalis in the middle reaches of the Yellow River has a moderate level of genetic diversity and high genetic differentiations among populations. The 13 populations of P. orientalis in the middle reaches of the Yellow River were divided into two groups with no significant geographic population structure and extensive admixture. Our study sheds light on the population history of this species and genetic diversity among populations. Moreover, a reasonable plan to protect the precious genetic resources of P. orientalis should be established based on our research results to prevent the gradual loss of ancient P. orientalis populations.

Supplementary Materials

The following are available online at https://0-www-mdpi-com.brum.beds.ac.uk/article/10.3390/f12050592/s1, Table S1: Characteristics of 26 cpSSR loci for PCR amplification in ancient P. orientalis; File S1: Raw and Statistical data-Excel. Zip, contains two files: File A: 1-Raw data of 13 ancient P. orientalis populations; File B: 2-Statistical data of 13 ancient P. orientalis populations; File S2: Pairwise geographic distance among the 13 populations of P. orientalis-Excel.

Author Contributions

Conceptualization: B.C. and P.D.; methodology: B.C. and P.D.; software: B.C. and P.D.; validation: S.Z. and Z.Z.; investigation: B.C., P.D., and S.Z.; resources: Z.Z.; data curation: B.C. and P.D.; writing—original draft preparation: B.C. and P.D.; writing—review and editing: B.C. and P.D.; supervision: Z.Z.; project administration: Z.Z. All authors have read and agreed to the published version of the manuscript.

Funding

This research was funded by the National Forestry Industry Research Special Funds for Public Welfare Projects (China) (201404302).

Institutional Review Board Statement

Not applicable.

Informed Consent Statement

Not applicable.

Data Availability Statement

Data is contained within the article or supplementary material.

Acknowledgments

We thank the Yellow Emperor Mausoleum Administration for supporting our sample collection work. We thank Dinh Duy Vu (Institute of Tropical Ecology, Vietnam-Russia for his guidance Tropical Centre) for his guidance on data analysis.

Conflicts of Interest

The authors declare no conflict of interest.

References

  1. Zhou, Q.Y.; Jiang, Z.H.; Zhang, X.; Zhang, T.; Zhu, H.L.; Cui, B.; Li, Y.M.; Zhao, F.; Zhao, Z. Leaf anatomy and ultrastructure in senescing Ancient tree, Platycladus orientalis L. (Cupressaceae). PeerJ 2019, 7, e6766. [Google Scholar] [CrossRef] [Green Version]
  2. Zhang, Z.M.; Yang, X.H.; Liu, J.L. Distribution and rejuvenation technology of ancient and famous tree in Beijing. Int. J. Med. Plant. Res. 2013, 26, 188. [Google Scholar] [CrossRef]
  3. Neale, D.B.; Kremer, A. Forest tree genomics: Growing resources and applications. Nat. Rev. Genet. 2011, 12, 111–122. [Google Scholar] [CrossRef]
  4. Seyed, M.H.; Seyed, A.S. Chemical constituents and toxicity of essential oils of Oriental Arborvitae, Platycladus orientalis (L.) Franco, against three stored-product beetles. Chil. J. Agric. Res. 2012, 72, 188–194. [Google Scholar]
  5. Wang, F.; Wu, D.J.; Yamamoto, H.; Xing, S.Y.; Zang, L.P. Digital image analysis of different crown shape of Platycladus orientalis. Ecol. Inform. 2016, 34, 146–152. [Google Scholar] [CrossRef]
  6. Hu, X.G.; Wang, T.L.; Liu, S.S.; Jiao, S.Q.; Jia, K.H.; Zhou, S.S.; Jin, Y.Q.; Li, Y.; Yousry, A.E.-K.; Mao, J.F. Predicting future seed sourcing of Platycladus orientalis (L.) for future climates using climate niche models. Forests 2017, 8, 471. [Google Scholar] [CrossRef] [Green Version]
  7. Zhou, Q.Y.; Jiang, Z.H.; Li, Y.M.; Zhang, T.; Zhao, Z. Mesophyll protoplast isolation technique and flow cytometry analysis of ancient Platycladus orientalis (Cupressaceae). Turk. J. Agric. 2019, 43, 275–287. [Google Scholar] [CrossRef]
  8. Zhou, Q.Y.; Jiang, Z.H.; Zhang, X.; Lai, Q.; Zhao, Z. Tree age did not affect the leaf anatomical structure or ultrastructure of Platycladus orientalis L. (Cupressaceae). PeerJ 2019, 7, e7938. [Google Scholar] [CrossRef] [Green Version]
  9. Chang, E.M.; Tian, Y.X.; Wang, C.Y.; Deng, N.; Liu, C.X. Exploring the Phylogeography of Ancient Platycladus orientalis in China by Specific-Locus Amplified Fragment Sequencing. Int. J. Mol. Sci. 2019, 20, 3871. [Google Scholar] [CrossRef] [PubMed] [Green Version]
  10. Rosen, A.M.; Lee, J.; Li, M.; Wright, J.; Wright, H.T.; Fang, H. The Anthropocene and the landscape of Confucius: A historical ecology of landscape changes in northern and eastern China during the middle to late-Holocene. Holocene 2015, 25, 75–97. [Google Scholar] [CrossRef]
  11. Hua, S.Z.; Mou, J.Z. Harnessing and development of the Loess Plateau in the middle reaches of the Yellow River. In Taming the Yellow River: Silt and Floods: Proceedings of a Bilateral Seminar on Problems in the Lower Reaches of the Yellow River, China; Brush, L.M., Wolman, M.G., Bing-Wei, H., Eds.; Springer: Dordrecht, The Netherlands, 1989; pp. 517–528. [Google Scholar]
  12. Kai, L.; Wu, Z.-Y.; Raven, P.H. Flora of China 4. Cycadaceae through Fagaceae. Nord. J. Bot. 1999, 19, 580. [Google Scholar]
  13. Xie, C.Y.; Dancik, B.P.; Yeh, F.C. Genetic structure of Thuja orientalis. Biochem. Sys. Ecol. 1992, 20, 433–441. [Google Scholar] [CrossRef]
  14. Zhu, L.; Lou, A.R. Old-growth Platycladus orientalis as a resource for reproductive capacity and genetic diversity. PLoS ONE 2013, 8, e56489. [Google Scholar] [CrossRef] [PubMed]
  15. Martin, M.A.; Mattioni, C.; Lusini, I.; Molina, J.R.; Cherubini, M.; Drake, F.; Herrera, M.A.; Villani, F.; Martin, L.M. New insights into the genetic structure of Araucaria araucana forests based on molecular and historic evidences. Tree Genet. Genomes 2014, 10, 839–851. [Google Scholar] [CrossRef]
  16. Van Vuuren, B. Introduction to Conservation Genetics (Book); Cambridge University Press: Cambridge, UK, 2010. [Google Scholar]
  17. Cato, S.A.; Richardson, T.E. Inter- and intraspecific polymorphism at chloroplast SSR loci and the inheritance of plastids in Pinus radiata D. Don. Theor. Appl. Genet. 1996, 93, 587–592. [Google Scholar] [CrossRef] [PubMed]
  18. Morgante, M.; Pfeiffer, A.; Costacurta, A.; Olivieri, A.M. Molecular tools for population and ecological genetics in coniferous trees. Ann. Rei Bot. 1996, 36, 129–138. [Google Scholar]
  19. Cheng, Y.J.; Guo, W.W.; Deng, X.X. cpSSR: A new tool to analyse chloroplast genome of Citrus somatic hybrids. Acta. Bot. Sin. 2003, 45, 906–909. [Google Scholar]
  20. Rai, K.C.; Ginwal, H.S. Microsatellite analysis to study genetic diversity in Khasi Pine (Pinus Kesiya Royle Ex. Gordon) using chloroplast SSR markers. Silvae Genet. 2018, 67, 99–105. [Google Scholar] [CrossRef] [Green Version]
  21. Ebert, D.; Peakall, R. Chloroplast simple sequence repeats (cpSSRs): Technical resources and recommendations for expanding cpSSR discovery and applications to a wide array of plant species. Mol. Ecol. Resour. 2010, 9, 673–690. [Google Scholar] [CrossRef] [PubMed]
  22. Shota, S.; Tsumura, Y.; Crisp, M.D.; Bowman, D.M.J.S.; Isagi, Y. Genetic evidence for paternal inheritance of the chloroplast in four Australian Callitris species (Cupressaceae). J. For. Res. 2014, 19, 244–248. [Google Scholar]
  23. Vendramin, G.G.; Lelli, L.; Rossi, P.; Morgante, M. A set of primers for the amplification of 20 chloroplast microsatellites in Pinaceae. Mol. Ecol. 2010, 5, 595–598. [Google Scholar] [CrossRef]
  24. Wang, Y.S.; Xing, S.Y.; Tang, H.X.; Feng, D.Q. Genetic diversity of Platycladus orientalis provenances. Sci. Silvae Sin. 2011, 47, 91–96. [Google Scholar]
  25. Zhu, L.; Lou, A.R. Development and characterization of nine highly polymorphic microsatellite primers for Platycladus orientalis (Cupressaceae). Am. J. Bot. 2012, 99, e280–e282. [Google Scholar] [CrossRef] [PubMed] [Green Version]
  26. Jin, Y.Q.; Ma, Y.Q.; Wang, S.; Hu, X.G.; Huang, L.S.; Li, Y.; Wang, X.R.; Mao, J.F. Genetic evaluation of the breeding population of a valuable reforestation conifer Platycladus orientalis (Cupressaceae). Sci. Rep. 2016, 6, 34821. [Google Scholar] [CrossRef] [Green Version]
  27. Huang, L.S.; Sun, Y.; Jin, Y.Q.; Gao, Q.; Hu, X.G.; Gao, F.L.; Yang, X.L.; Zhu, J.; El-Kassaby, Y.A.; Mao, J.F. Development of high transferability cpSSR markers for individual identification and genetic investigation in Cupressaceae species. Ecol. Evol. 2018, 8, 4967–4977. [Google Scholar] [CrossRef] [PubMed] [Green Version]
  28. Huang, L.S.; Song, J.; Sun, Y.Q.; Gao, Q.; Jiao, S.Q.; Zhou, S.S.; Jin, Y.; Yang, X.L.; Zhu, J.J.; Gao, F.L. Pollination dynamics in a Platycladus orientalis seed orchard as revealed by partial pedigree reconstruction. Can. J. For. Res. 2018, 48, 952–957. [Google Scholar] [CrossRef]
  29. Richards, C.M.; Antolin, M.F.; Reilley, A.; Poole, J.; Walters, C. Capturing genetic diversity of wild populations for ex situ conservation: Texas wild rice (Zizania texana) as a model. Genet. Resour. Crop. Evol. 2007, 54, 837–848. [Google Scholar] [CrossRef]
  30. Yeh, F.C.; Yang, R.C.; Boyle, T. POPGENE Version 1.32 Microsoft Windows-Based Freeware for Populations Genetic Analysis; University of Alberta: Edmonton, AB, Canada, 1999. [Google Scholar]
  31. Peakall, R.; Smouse, P.E. genalex 6: Genetic analysis in Excel. Population genetic software for teaching and research. Mol. Ecol. Notes 2006, 6, 288–295. [Google Scholar] [CrossRef]
  32. Goudet, J. FSTAT (version 1.2): A computer program to calculate Fstatistics. J. Hered. 1995, 86, 485–486. [Google Scholar] [CrossRef]
  33. Nagy, S.; Poczai, P.; Cernák, I.; Gorji, A.M.; Hegedűs, G.; Taller, J. PICcalc: An online program to calculate polymorphic information content for molecular genetic studies. Biochem. Genet. 2012, 50, 670–672. [Google Scholar] [CrossRef] [PubMed] [Green Version]
  34. Raymond, M.; Rousset, F. GENEPOP (Version 1.2): Population genetics software for exact tests and ecumenicism. J. Hered. 1995, 86, 248–249. [Google Scholar] [CrossRef]
  35. Cristescu, R.; Sherwin, W.B.; Handasyde, K.; Cahill, V.; Cooper, D.W. Detecting bottlenecks using BOTTLENECK 1.2.02 in wild populations: The importance of the microsatellite structure. Conserv. Gene. 2010, 11, 1043–1049. [Google Scholar] [CrossRef]
  36. Excoffier, L.; Laval, G.; Schneider, S. Arlequin (version 3.0): An integrated software package for population genetics data analysis. Evol. Bioinf. Online 2005, 1, 47–50. [Google Scholar] [CrossRef] [Green Version]
  37. Legendre, P.; FORTIN, M.-J. Comparison of the Mantel test and alternative approaches for detecting complex multivariate relationships in the spatial analysis of genetic data. Mol. Ecol. Resour. 2010, 10, 831–844. [Google Scholar] [CrossRef]
  38. Naoko, T.; Masatoshi, N.; Koichiro, T. POPTREE2: Software for constructing population trees from allele frequency data and computing other population statistics with windows interface. Mol. Biol. Evol. 2010, 27, 747–752. [Google Scholar]
  39. Pritchard, J.; Mj, S.; Donnelly, P.J. Inference of population structure using multilocus genotype data. Genetics 2000, 155, 945–959. [Google Scholar] [CrossRef] [PubMed]
  40. Earl, D.A.; Vonholdt, B.M. STRUCTURE HARVESTER: A website and program for visualizing STRUCTURE output and implementing the Evanno method. Conserv. Genet. Resour. 2012, 4, 359–361. [Google Scholar] [CrossRef]
  41. Evanno, G.; Regnaut, S.; Goudet, J. Detecting the number of clusters of individuals using the software STRUCTURE: A simulation study. Mol. Ecol. 2005, 14, 2611–2620. [Google Scholar] [CrossRef] [Green Version]
  42. Zhong, Y.; Yang, A.; Li, Z.; Zhang, H.; Liu, L.; Wu, Z.; Li, Y.; Liu, T.; Xu, M.; Yu, F. Genetic diversity and population genetic structure of Cinnamomum camphora in South China revealed by EST-SSR markers. Forests 2019, 10, 1019. [Google Scholar] [CrossRef] [Green Version]
  43. Nowakowska, J.A.; Hsiang, T.; Patynek, P.; Stere´nczak, K.; Olejarski, I.; Oszako, T. Health Assessment and Genetic Structure of Monumental Norway Spruce Trees during A Bark Beetle (Ips typographus L.) Outbreak in the Białowie˙za Forest District, Poland. Forests 2020, 11, 647. [Google Scholar] [CrossRef]
  44. Frankham, R.; Ballou, J.D.; Briscoe, D.A. Introduction to conservation genetics. Genet. Res. 2002, 83, 1–617. [Google Scholar]
  45. Vanden-Broeck, A.; Gruwez, R.; Cox, K.; Adriaenssens, S.; Michalczyk, I.M.; Verheyen, K. Genetic structure and seed-mediated dispersal rates of an endangered shrub in a fragmented landscape: A case study for Juniperus communis in northwestern Europe. BMC Genet. 2011, 12, 1–7. [Google Scholar] [CrossRef] [PubMed] [Green Version]
  46. Liu, Z.M.; Zhao, A.M.; Kang, X.Y.; Zhou, S.L.; López-Pujol, J. Genetic diversity, population structure, and conservation of Sophora moorcroftiana (Fabaceae), a shrub endemic to the Tibetan Plateau. Plant Biol. 2006, 8, 81–92. [Google Scholar] [CrossRef]
  47. Wang, H.Z.; Kang, J.Y.; Liu, J.J.; Qiu, S.; Chen, Z. Dendrobium SSR Markers play a good role in genetic diversity and phylogenetic analysis of Orchidaceae species. Sci. Hortic. 2015, 183, 160–166. [Google Scholar]
  48. Yue, X.Y.; Zheng, X.Y.; Zong, Y.; Jiang, S.; Hu, C.Y.; Yu, P.Y.; Liu, G.Q.; Cao, Y.F.; Hu, H.J.; Teng, Y.W. Combined analyses of chloroplast DNA haplotypes and microsatellite markers reveal new insights into the origin and dissemination route of cultivated pears native to East Asia. Front. Plant Sci. 2018, 9, 591. [Google Scholar] [CrossRef] [PubMed]
  49. Powell, W.; Morgante, M.; Andre, C.; Mcnicol, J.W.; Rafalski, J.A. Hypervariable microsatellites provide a general source of polymorphic DNA markers for the chloroplast genome. Curr. Biol. 1995, 5, 1023–1029. [Google Scholar] [CrossRef] [Green Version]
  50. Powell, W.; Machray, G.C.; Provan, J. Polymorphism revealed by simple sequence repeats. Trends Plant Sci. 1996, 1, 215–222. [Google Scholar] [CrossRef]
  51. Dow, B.D.; Ashley, M.V. High levels of gene flow in bur oak revealed by paternity analysis using microsatellites. J. Hered. 2000, 69, 62–70. [Google Scholar] [CrossRef] [Green Version]
  52. Gerber, S.; Mariette, S.; Streiff, R.; Bodenes, C.; Kremer, A. Comparison of microsatellites and amplified fragment length polymorphism markers for parentage analysis. Mol. Ecol. 2000, 9, 1037–1048. [Google Scholar] [CrossRef]
  53. Selkoe, K.A.; Toonen, R.J. Microsatellites for ecologists: A practical guide to using and evaluating microsatellite markers. Ecol. Lett. 2010, 9, 615–629. [Google Scholar] [CrossRef]
  54. Adelalu, K.F.; Zhang, X.; Qu, X.J.; Landis, J.B.; Wang, H. Plastome Phylogenomic and Biogeographical Study on Thuja (Cupressaceae). Biomed. Res. Int. 2020, 26, 1–13. [Google Scholar] [CrossRef] [PubMed]
  55. Ferrão, L.F.V.; Caixeta, E.T.; Pena, G.; Zambolim, E.M.; Cruz, C.D.; Zambolim, L.; Ferrao, M.A.G.; Sakiyama, N.S. New EST–SSR markers of Coffea arabica: Transferability and application to studies of molecular characterization and genetic mapping. Mol. Breed. 2015, 35, 31. [Google Scholar] [CrossRef] [Green Version]
  56. Reisch, C.; Mayer, F.; Ruether, C.; Nelle, O. Forest history affects genetic diversity–molecular variation of Dryopteris dilatata (Dryopteridaceae) in ancient and recent forests. Nord. J. Bot. 2007, 25, 366–371. [Google Scholar] [CrossRef]
  57. Jacquemart, A.L.; Buyens, C.; Delescaille, L.M.; Rossum, F.V. Using genetic evaluation to guide conservation of remnant Juniperus communis (Cupressaceae) populations. Plant Biol. 2020, 23, 193–204. [Google Scholar] [CrossRef]
  58. Loveless, M.D.; Hamrick, J.L. Ecological determinants of genetic structure in plant populations. Annu. Rev. Ecol. Syst. 1984, 15, 65–95. [Google Scholar] [CrossRef]
  59. SJakob, S.; Burgi, L. Patterns of variation of a common fern (Athyrium filix-femina; Woodsiaceae): Population structure along and between altitudinal gradients. Am. J. Bot. 2007, 94, 965–971. [Google Scholar]
  60. Bradshaw, R.H.W. Past anthropogenic influence on European forests and some possible genetic consequences. For. Ecol. Manag. 2004, 197, 203–212. [Google Scholar] [CrossRef]
  61. Patino, J.; Werner, O.; González-Mancebo, J.M. The impact of forest disturbance on the genetic diversity and population structure of a late-successional moss. Trans. Br. Bryol. Soc. 2010, 32, 220–231. [Google Scholar] [CrossRef]
  62. Ellstrand, N.C.; Elam, D.R. Population genetic consequences of small population size: Implications for plant conservation. Annu. Rev. Ecol. Syst. 1993, 24, 217–242. [Google Scholar] [CrossRef]
Figure 1. Geographical distribution of plant materials. Triangle points indicate the populations that were collected in the middle reaches of the Yellow River. The sector map shows the mean cluster membership proportions of the analyzed individuals in each of the 13 P. orientalis populations based on the structure at K = 2.
Forests 12 00592 g001
Figure 2. Mantel test between genetic distance and geographical distance of 13 P. orientalis populations.
Forests 12 00592 g002
Figure 3. Genetic divergence among 13 populations of P. orientalis based on UPGMA clustering analysis.
Forests 12 00592 g003
Figure 4. Population genetic structure. (A) Estimation of the best subpopulation numbers based on the appropriate K value: the mean ∆K values among the 10 runs reached a maximum at K = 2. (B) Genetic structural plot of 13 P. orientalis populations based on structure analysis. a K = 2, sorted by Q via STRUCTURE. b K = 2, samples displayed in order of collection. Red for Pop-A, and green for Pop-B in a and b.
Forests 12 00592 g004
Table 1. Geographical location and genetic variability statistics for 13 ancient P. orientalis populations in the middle reaches of the Yellow River.
PopulationsSample SizeLocationsLatitude
(N)
Longitude
(E)
Elevation
(m)
Average Age (years)NaNeARAprivITPMSMM
WNBS29Weinan, Shaanxi35°22′109°41′81623142.7501.4362.1230.2500.5100.2900.253
WNHY13Weinan, Shaanxi34°34′110°06′31515182.2501.6112.1800.0000.5460.5620.384
TCYX12Tongchuan, Shaanxi34°54′108°59′71712381.7501.1481.5710.2500.2130.2410.217
YAHL19Yan’an, Shaanxi35°35′109°16′86527112.2501.6892.0630.2500.5880.6860.680
YLSM19Yulin, Shaanxi38°40′110°25′117216682.7501.5832.2940.2500.6100.2290.200
LLJC6Lvliang, Shanxi37°34′112°07′88412001.5001.3461.5000.0000.2860.7390.715
TYJY7Taiyuan, Shanxi37°42′112°26′81618712.0001.3661.9890.0000.4040.0810.063
YCSD6Yuncheng, Shanxi35°07′110°54′39824171.2501.0961.2500.0000.1130.5160.477
YCYH12Yuncheng, Shanxi34°54′110°50′32513082.0001.4141.8690.0000.4110.4440.481
YCWR8Yuncheng, Shanxi35°21′110°48′77022501.7501.3211.7250.0000.3240.6610.713
LYMJ30Luoyang, Henan34°50′112°35′12415002.7501.6932.3300.0000.6680.6340.562
ZZDF17Zhengzhou, Henan34°27′113°04′35014352.5001.8582.2750.0000.6590.6580.629
TSQC24Tianshui, Gansu34°34′105°42′11739292.7501.7092.3710.2500.6780.6340.577
Mean15.538----17202.1731.4821.9640.0960.4620.4900.457
Note: Observed number of alleles per locus (Na); Mean number of effective alleles (Ne); Allelic richness (AR); Mean number of private alleles (Apriv); Shannon-Weiner index (I); P value of bottleneck under two phase model (TPM); P value of bottleneck under stepwise mutation model (SMM). Baishui, Weinan city (WNBS); Huayin, Weinan city (WNHY); Yaoxian, Tongchuan city (TCYX); Huangling, Yan’an city (YAHL); Shenmu, Yulin city (YLSM); Jiaocheng, Lvliang city (LLJC); Jinyuan, Taiyuan city (TYJY); Shundi, Yuncheng city (YCSD); Yanhu, Yuncheng city (YCYH); Wanrong, Yuncheng city (YCWR); Mengjin, Luoyang city (LYMJ); Dengfeng, Zhengzhou city (ZZDF); Qinchuan, Tianshui city (TSQC).
Table 2. Characteristics of four cpSSR loci for PCR amplification in P. orientalis.
IDPrimer Sequence (5’–3’)Repeat MotifExpected PCR Product Size (bp)LocationTm (°C)Species
N1TTCTAGCTCGCACCCAAACT
TTGTTTCGCCGATATGTTCA
(AC)6260rbcL/accD IR56Cupressus gigantean
N2TGGTCATACCATTGCTGTTCA TGGGCTACTCTACGTGCTTT(AT)5395rps19/rp122 IR56Cupressus gigantean
N6GGGAACAACCAGAATTGGAA GCCACTTTTATGGCACGACT(TA)5360ycf156Cupressus gigantean
N33CTGTTCCCCTGTGCATCATA AGGAGGAAAATCCGTTGGTT(TCT)5400trnF-GAA/trnL-UAA IR56Juniperus scopulorum
Table 3. Diversity statistics of the four cpSSR loci across 202 P. orientalis individuals.
IDNaNeIPICHFstNm
N141.8330.7930.3970.4550.2100.938
N261.53390.7610.3320.3500.1151.919
N621.6690.5900.3200.4000.1700.221
N3341.3480.5480.2450.2580.1141.935
Mean41.5970.6730.3240.3670.1531.503
Note: Observed number of alleles per locus (Na); Mean number of effective alleles (Ne); Shannon-Weiner index (I); Polymorphism information content (PIC); Nei’s gene diversity index (H); Genetic differentiation coefficient (Fst); Gene flow (Nm).
Table 4. Analysis of molecular variance (AMOVA) of 202 individuals in 13 populations of P. orientalis.
Source of Variationd.f.Sum of SquaresVariance ComponentsTotal Variation (%)p Value
Among populations938.9790.0628<0.001
Among individuals within populations189256.6350.67992
Total403295.6140.741100
Note: degrees of freedom (d.f.).
Table 5. Nei’s genetic identity (above diagonal) and genetic distance (D) (below diagonal) of 13 P. orientalis populations.
PCWNBSWNHYTCYXYAHLYLSMLLJCTYJYYCSDYCYHYCWRLYMJZZDFTSQC
WNBS-0.9810.9800.9060.9510.9180.9830.9750.9140.9680.9480.8200.954
WNHY0.027-0.9620.9020.9380.9180.9820.9590.8700.9710.9670.8250.951
TCYX0.0310.047-0.9070.9590.9480.9810.9850.8970.9730.9420.8290.961
YAHL0.1760.2190.084-0.9250.9590.9090.8600.9100.8970.9040.9480.945
YLSM0.0530.0330.0470.199-0.9720.9540.9410.8610.9720.9690.8720.972
LLJC0.0600.0270.0400.1870.021-0.9400.9140.8490.9570.9430.9120.966
TYJY0.0340.0290.0500.1920.0190.038-0.9870.8720.9840.9680.8110.957
YCSD0.0320.0280.0280.1370.0510.0420.064-0.8480.9750.9370.7560.934
YCYH0.1010.1090.0560.0530.0990.0980.1030.078-0.8180.8340.8880.906
YCWR0.0330.0160.0440.2090.0170.0190.0180.0470.096-0.9730.8040.954
LYMJ0.0590.0440.0350.0920.0860.0540.0860.0280.0420.062-0.8390.970
ZZDF0.1820.2010.0990.1180.0900.1080.1390.1500.0950.1370.164-0.920
TSQC0.0650.0250.0690.2790.0250.0150.0420.0600.1510.0130.0900.165-
Publisher’s Note: MDPI stays neutral with regard to jurisdictional claims in published maps and institutional affiliations.

