
Temperature Sensitivity of CO2 and CH4 Fluxes from Coarse Woody Debris in Northern Boreal Forests

 ,
,
Abstract
:1. Introduction
2. Materials and Methods
- DC I: Wood has not lost its solidity; log has bark; small to medium branches are present;
- DC II: Wood has lost some of its solidity; bark easily flakes from wood, but bark and larger branches are present on the log;
- DC III: Wood has lost its initial solidity; some bark and large branches can remain on the log.
Experimental Design
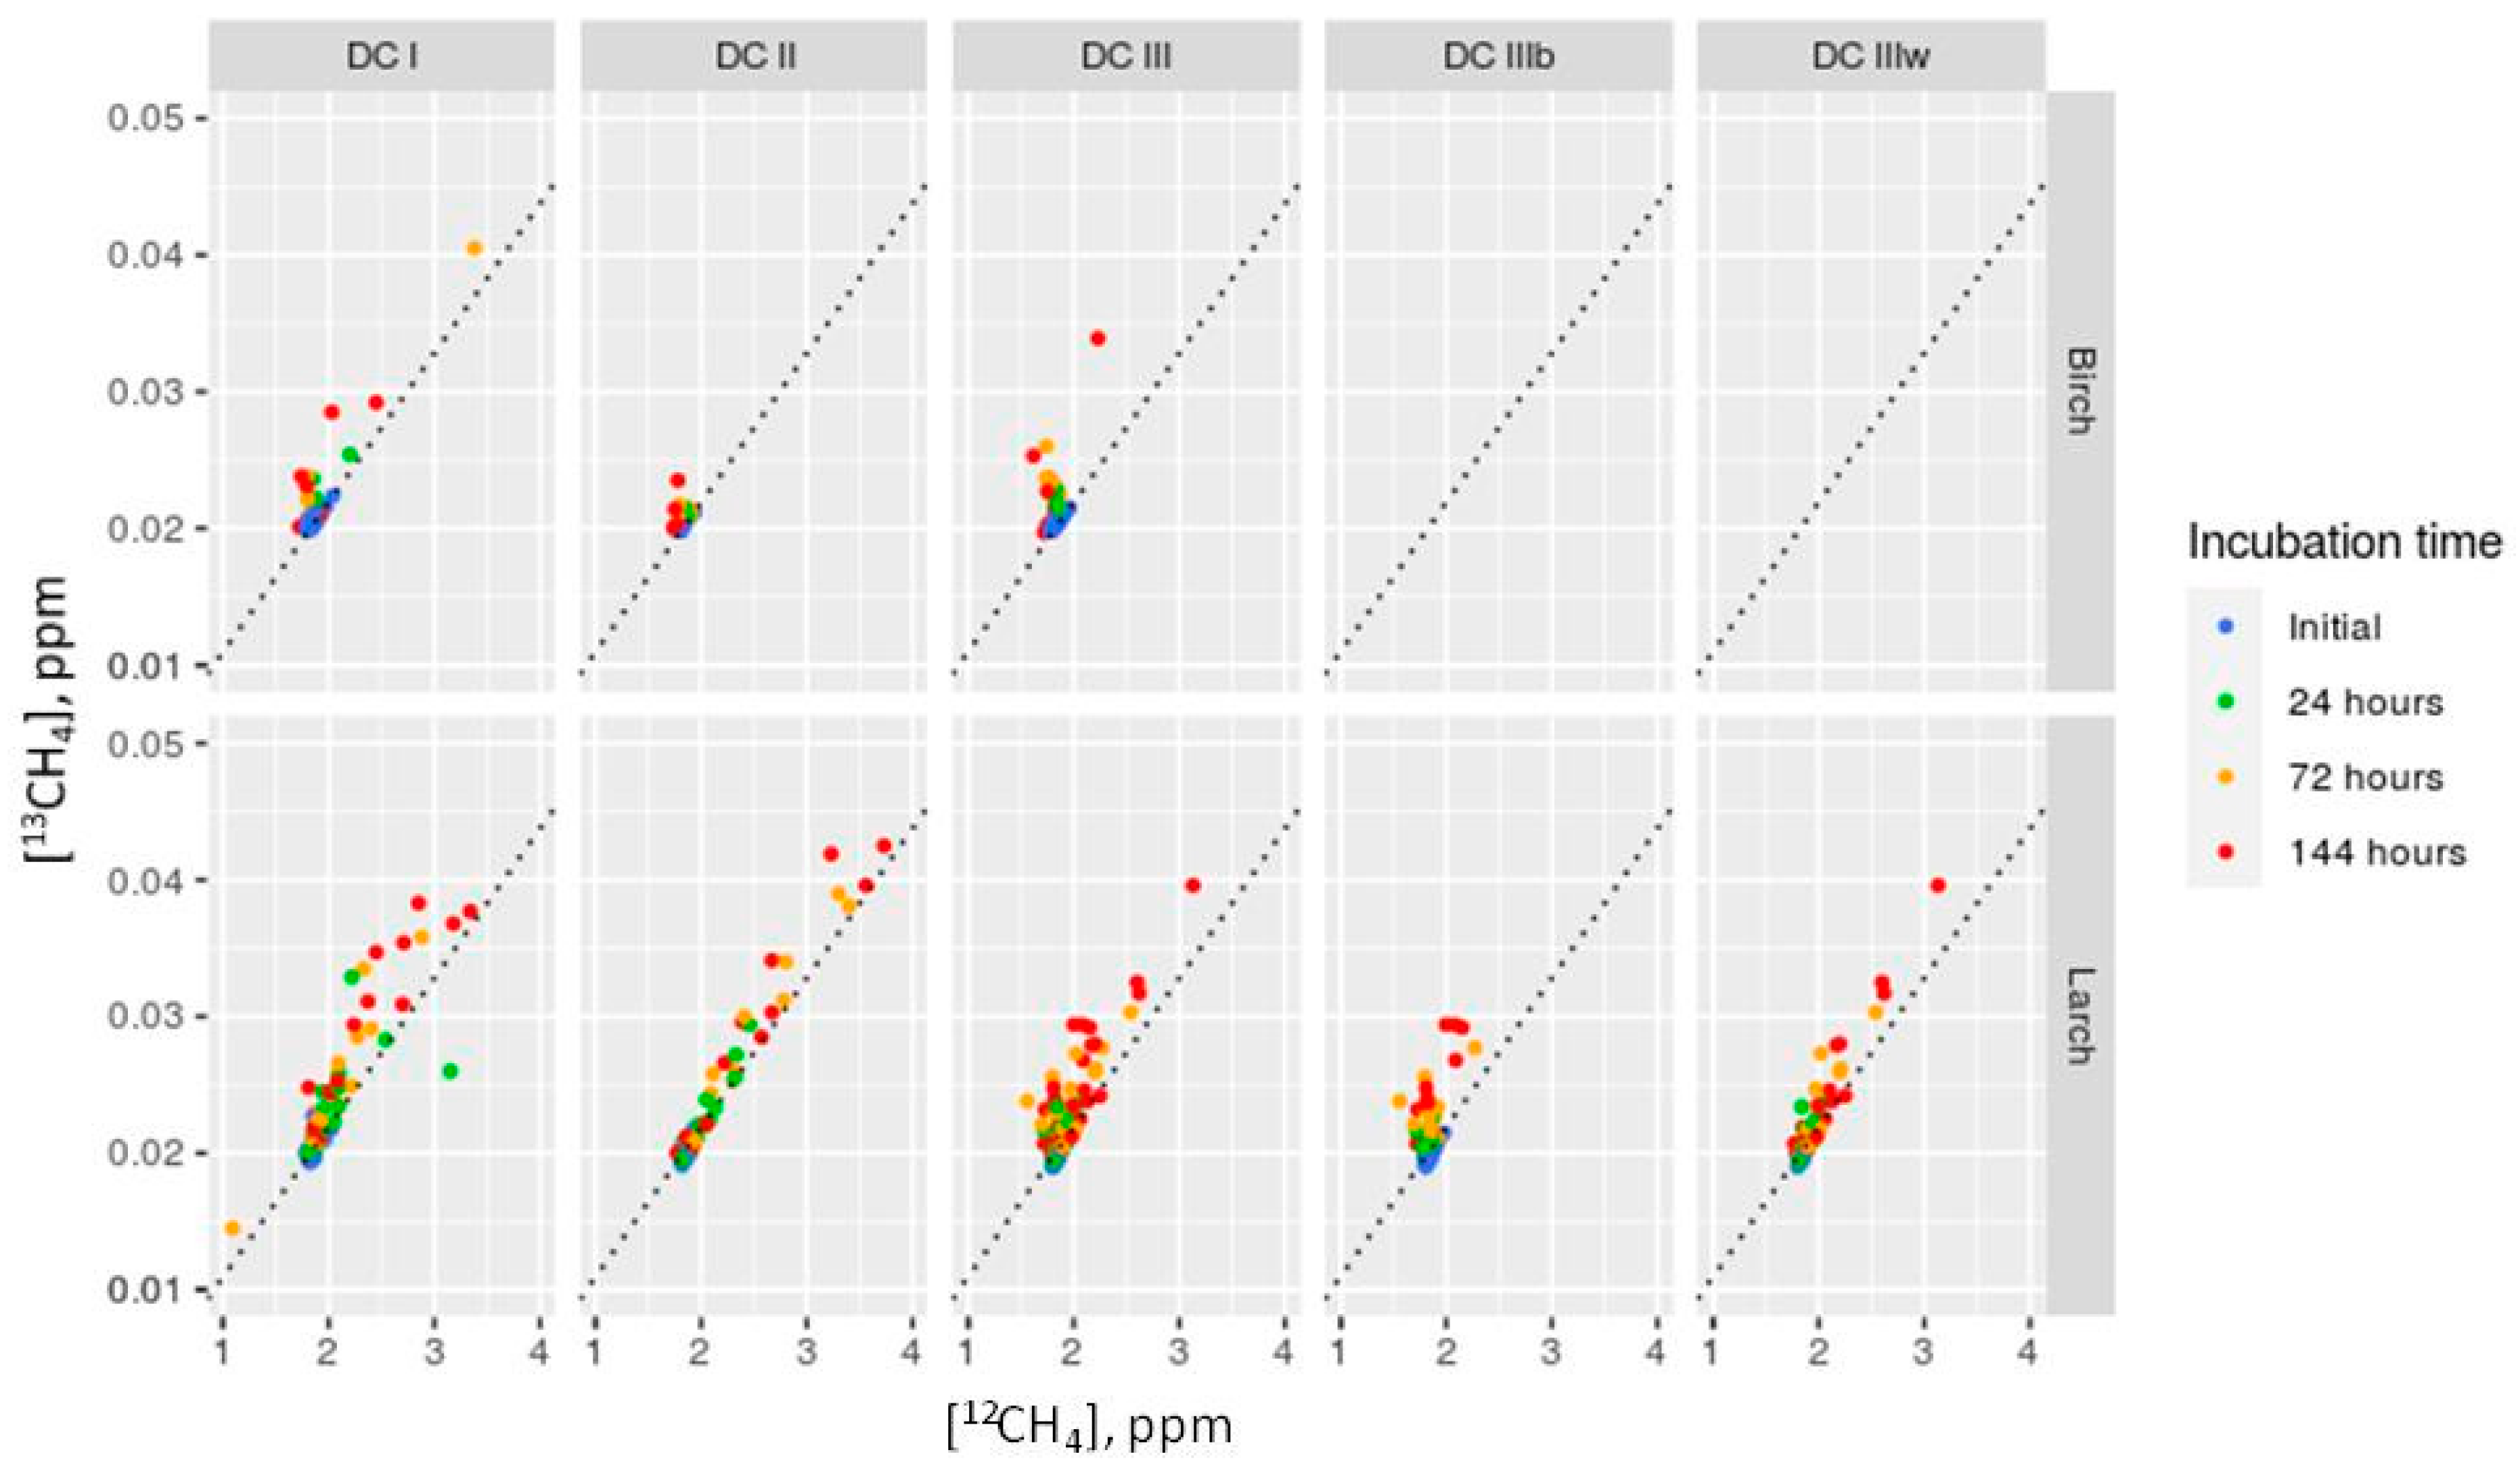
- The amount of evolved 13CH4 (Δ13CH4) was calculated as a difference between concentration of 13CH4 measured at the time t and initial 13CH4 concentration in the box headspace;
- Using Equation (2) (the main equation for δ13C), we calculated which amount of 12CH4 ([12CH4]) could be produced if supposing that there was no fractionation during methanogenesis and produced methane had δ13C similar to that in the substrate (wood):where δ13C-CH4_prod is a stable carbon isotopes ratio in produced methane and δ13C-CH4_prod = δ13Cwood.RCH4 = [13CH4]/[12CH4] = Rstandard × (δ13C − CH4_prod/1000 + 1),
- 3.
- The rate of methane production was calculated for the sum of Δ12CH4 and Δ13CH4 using Equation (3).
3. Results
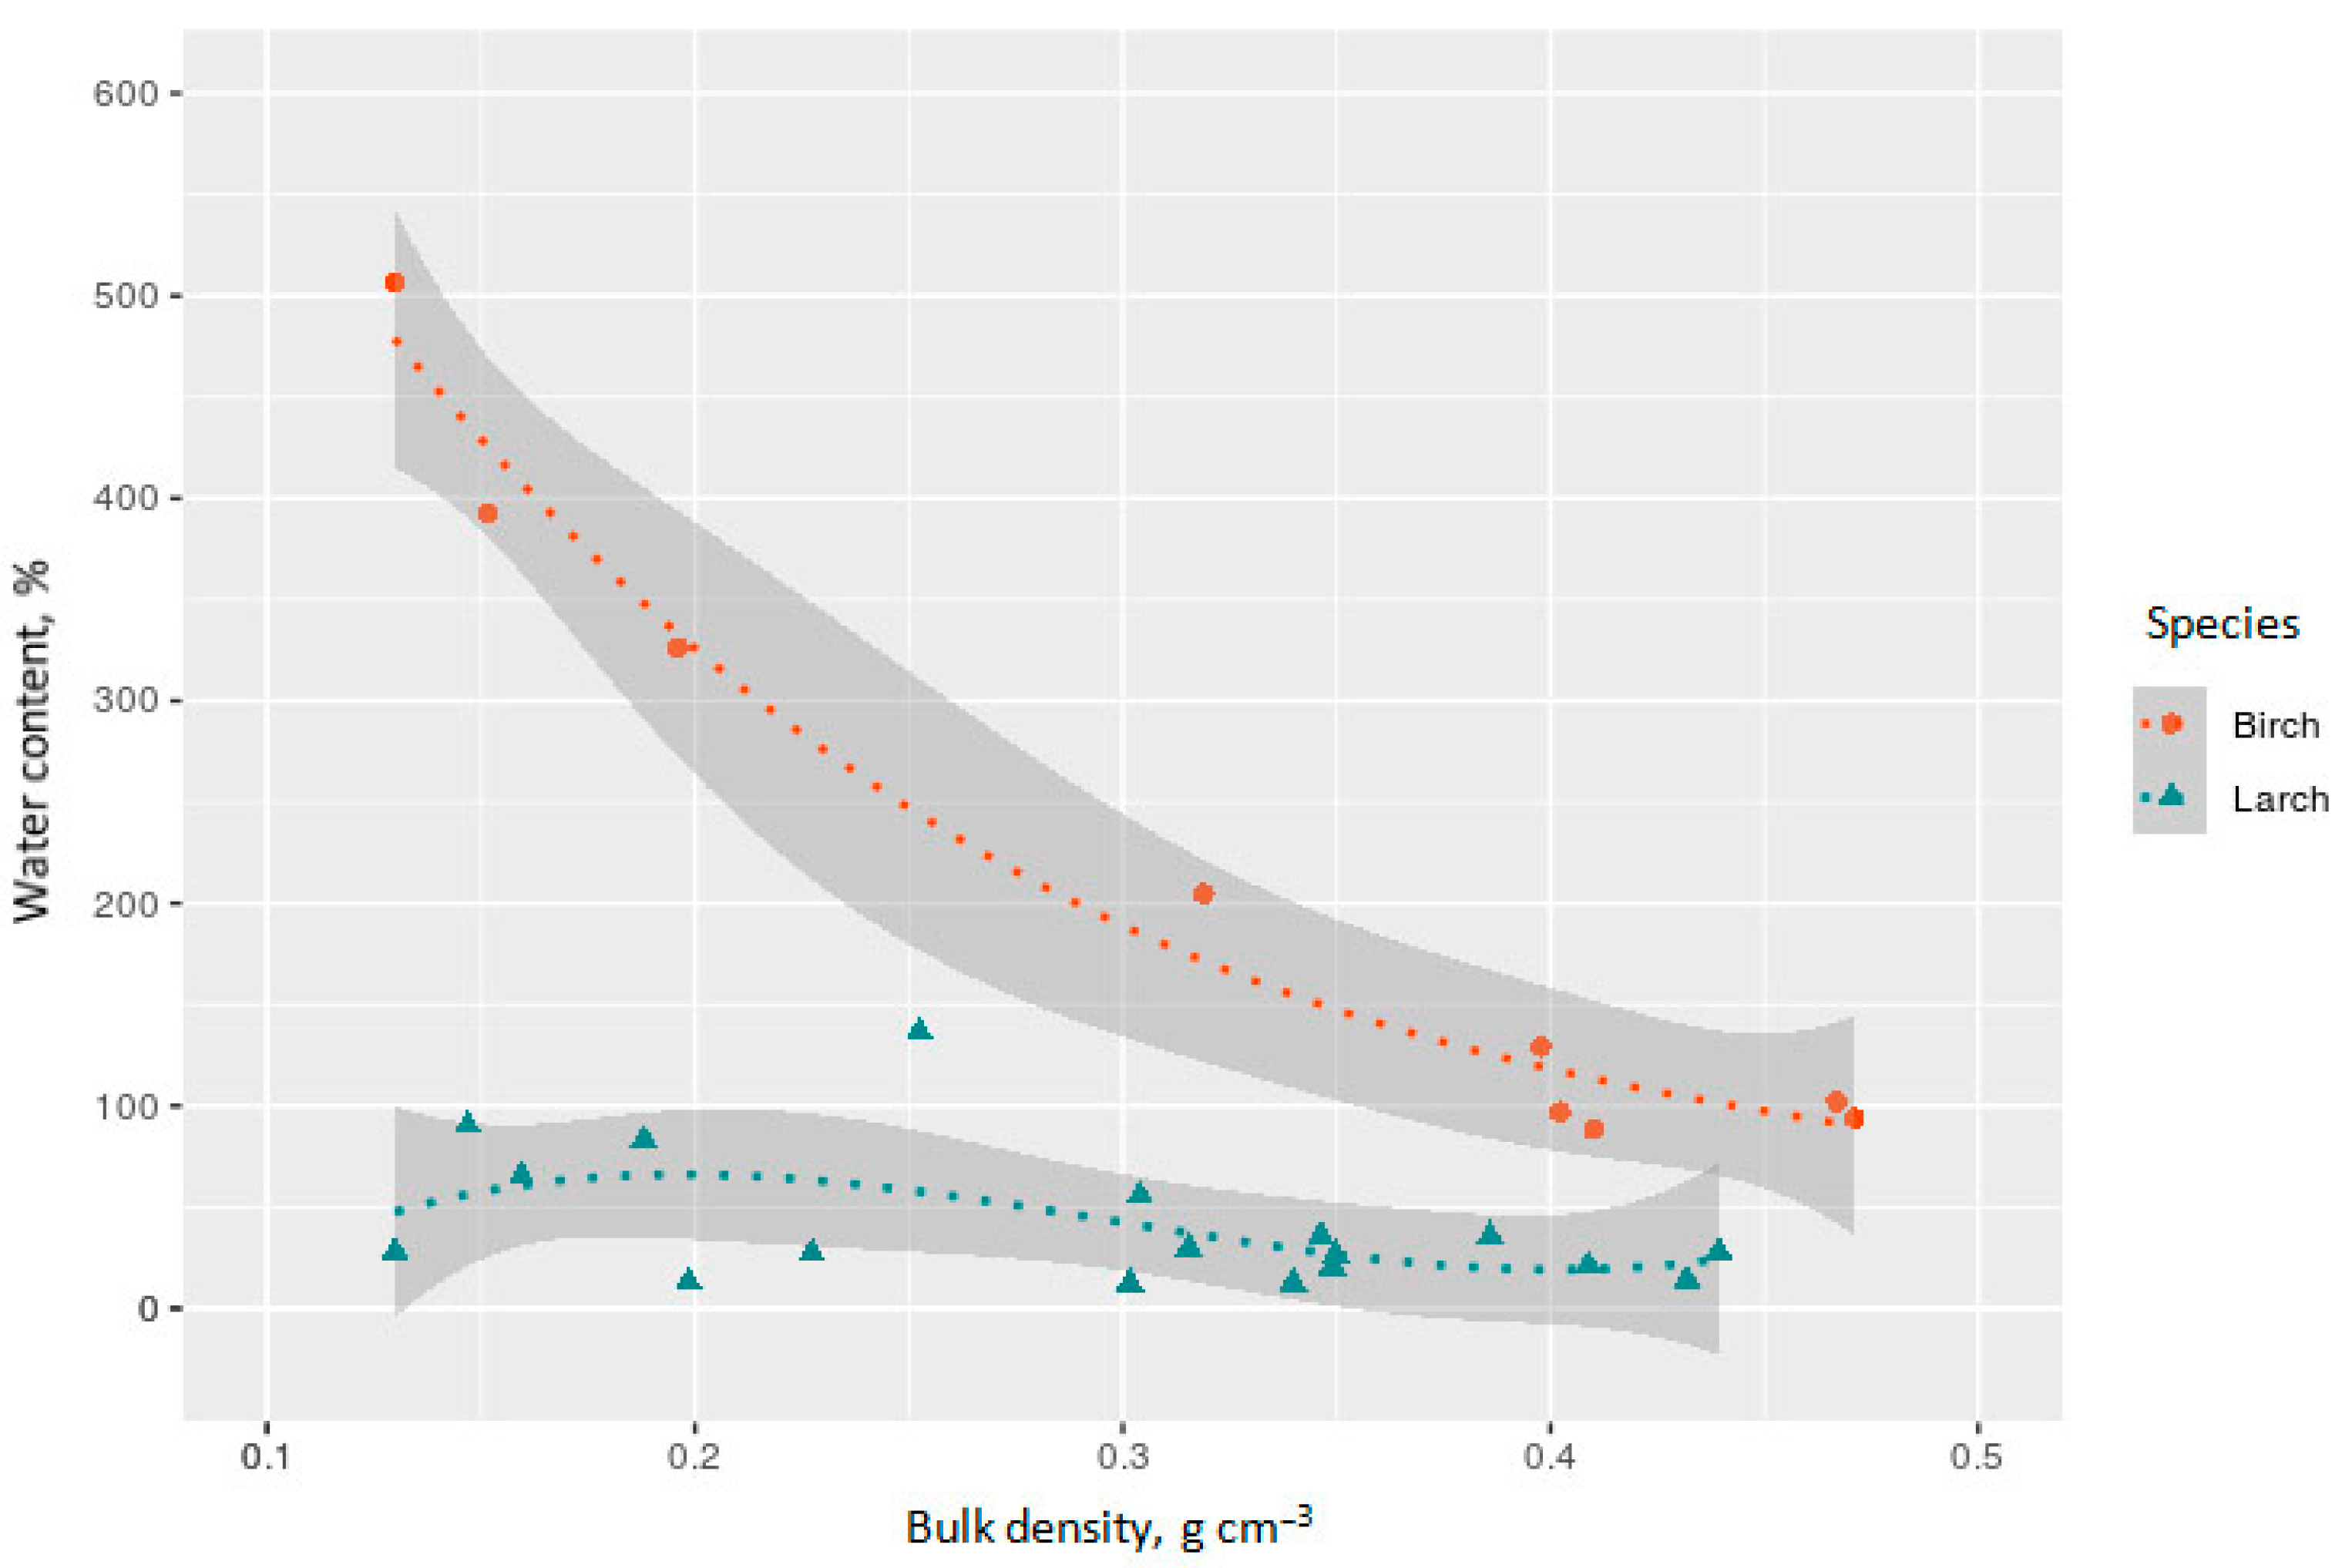
3.1. Bulk Density, Water Content, and Chemical Composition of Studied CWD
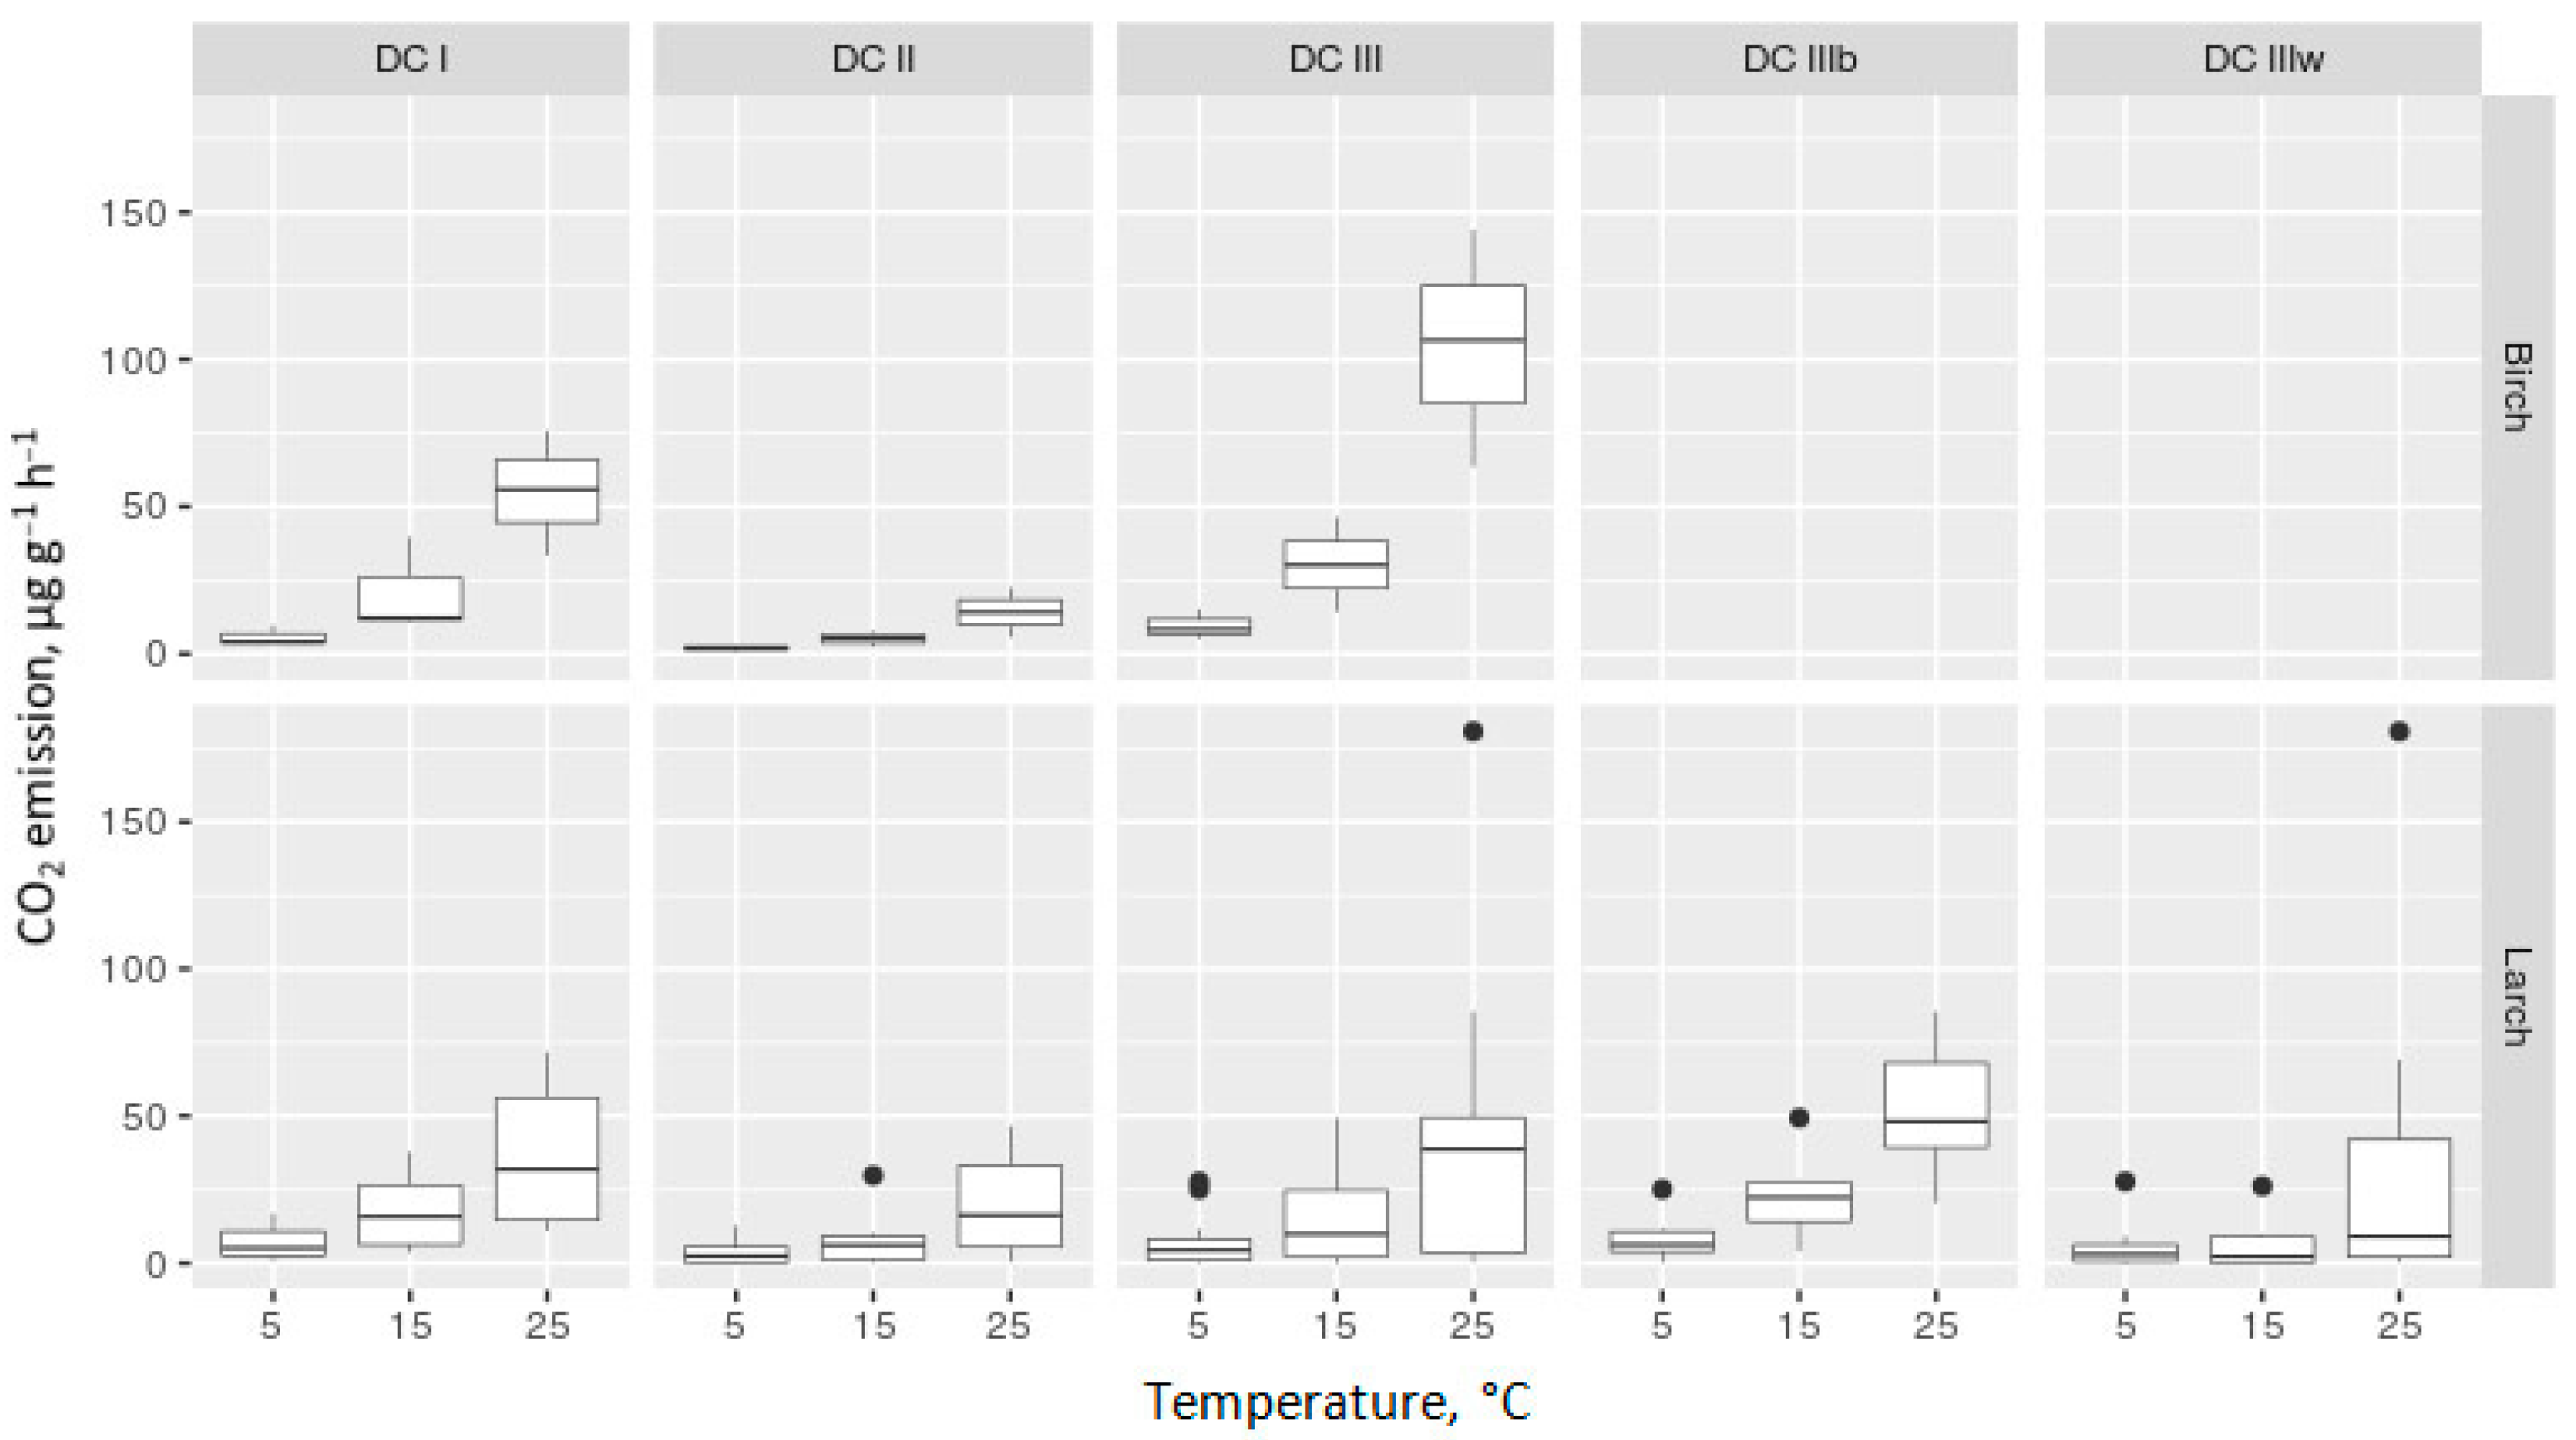
3.2. CO2 Flux from Decomposing CWD Samples
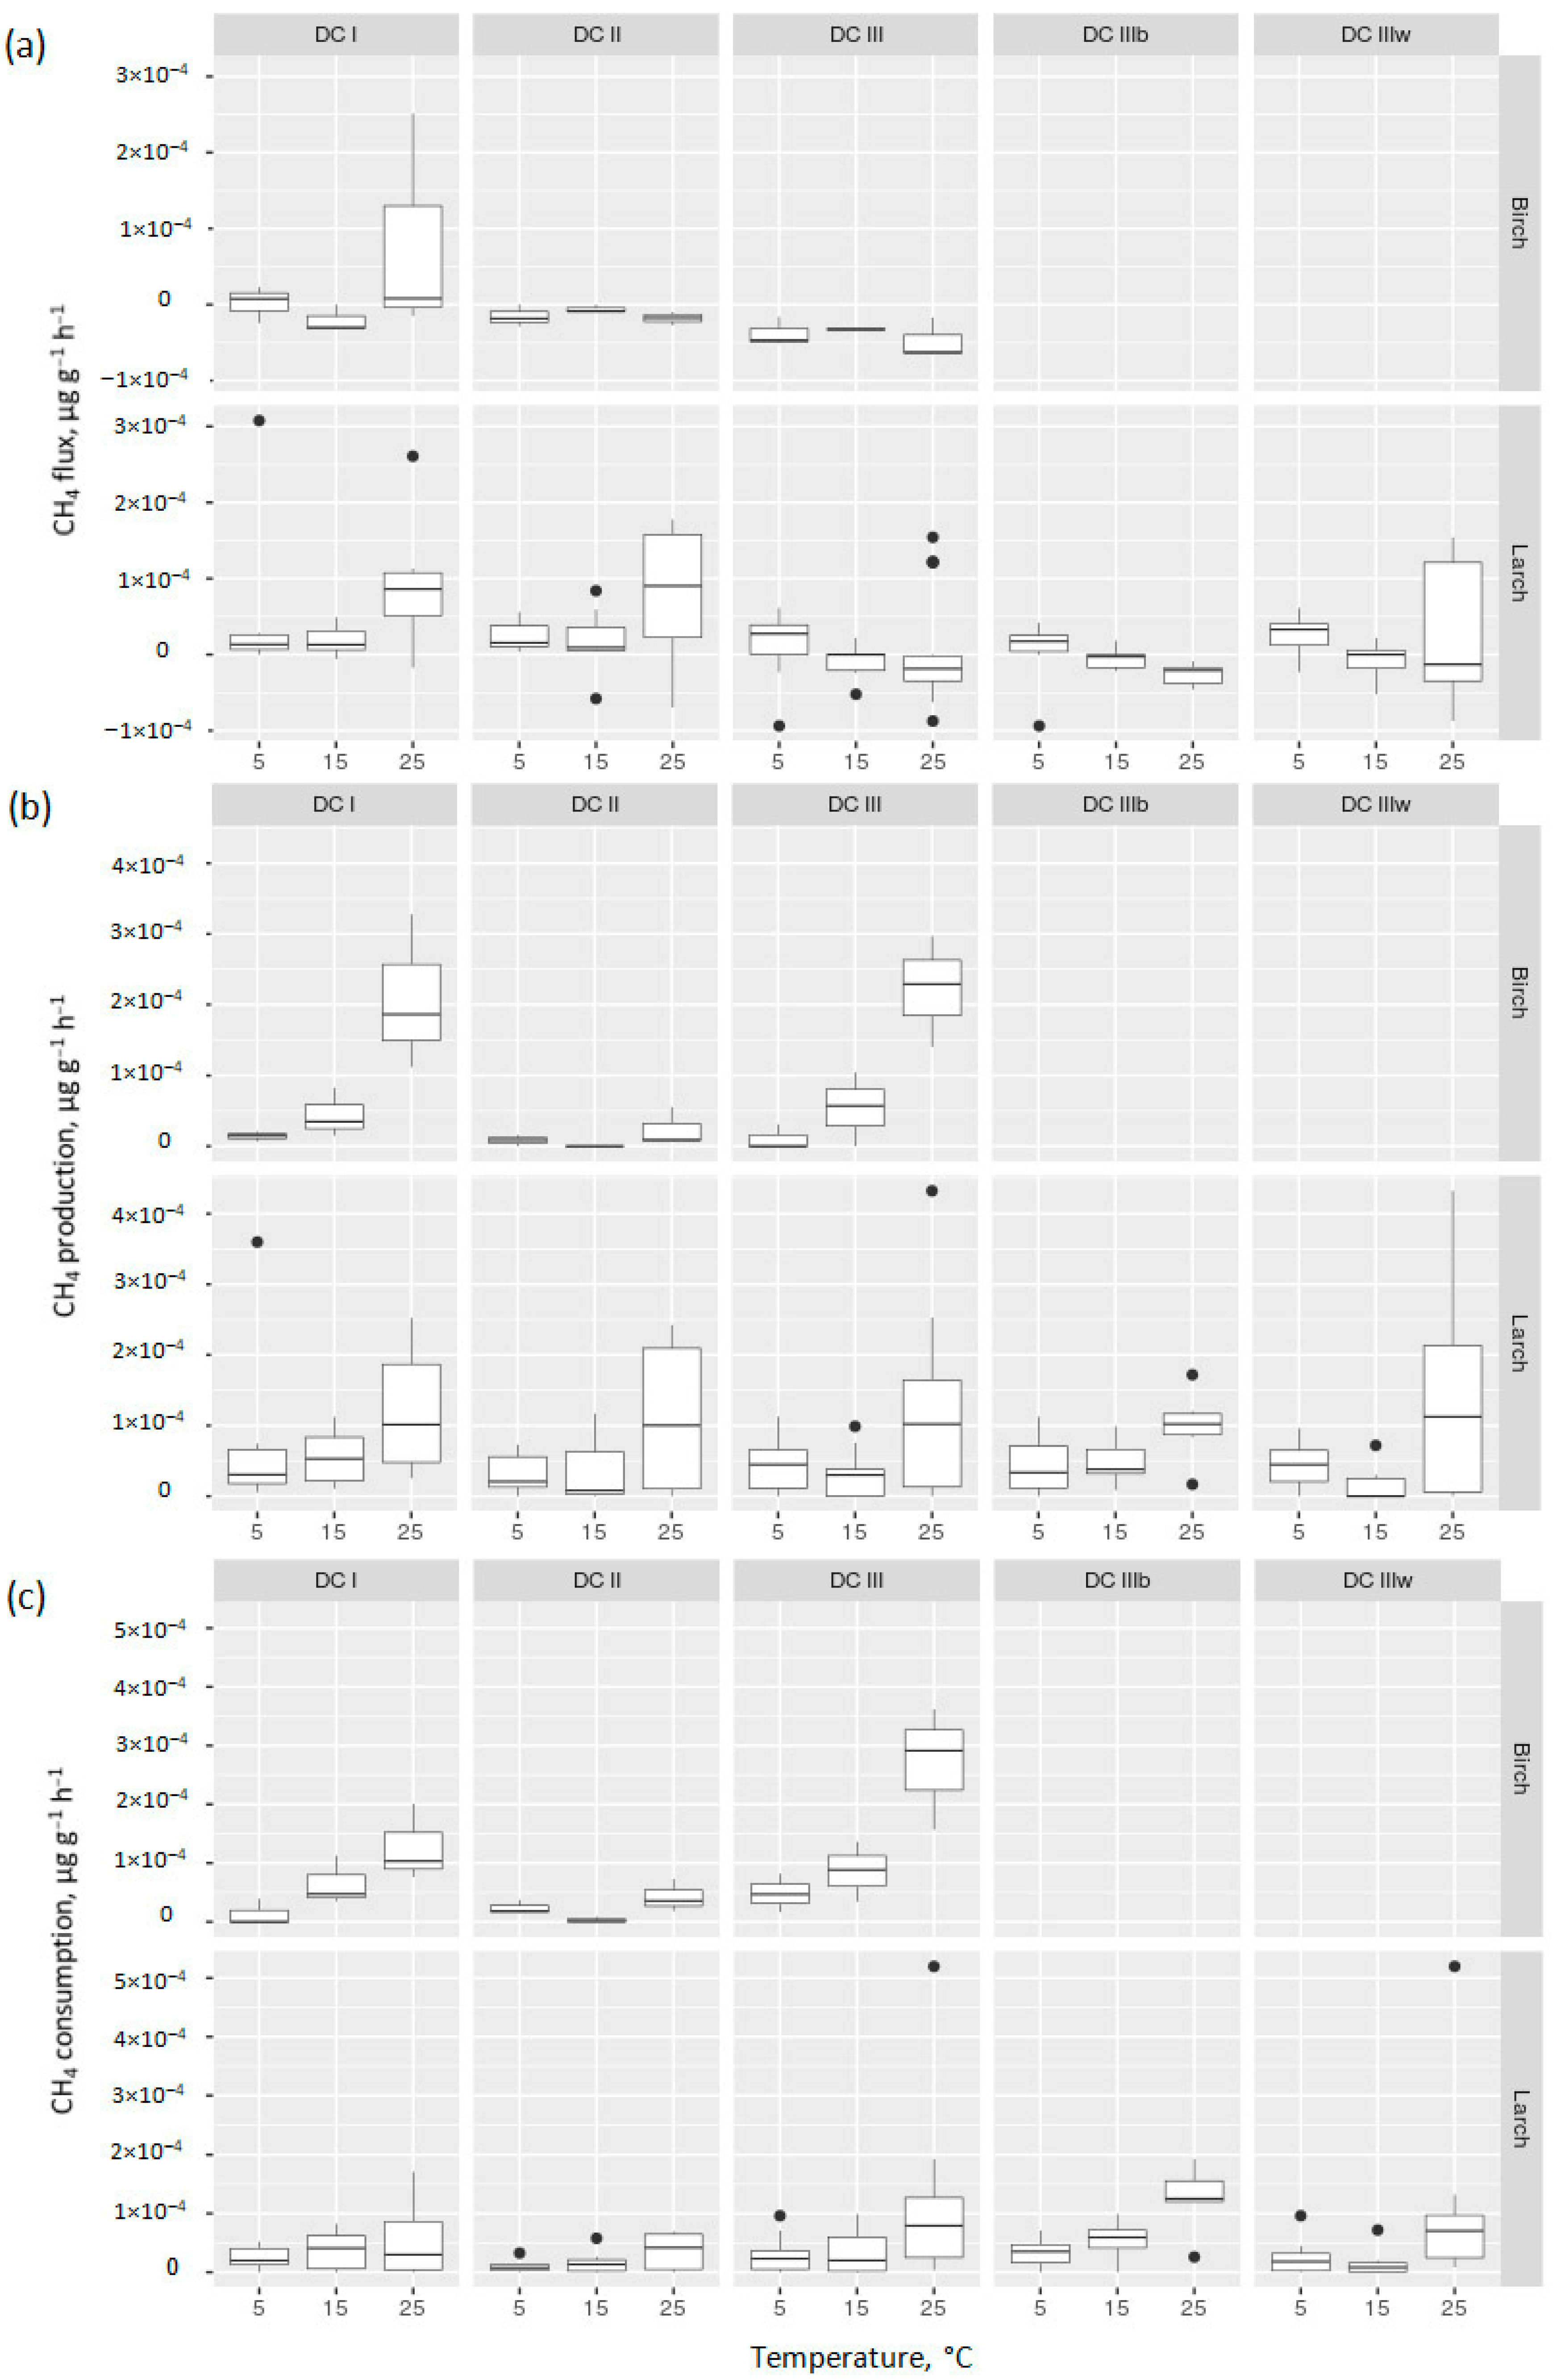
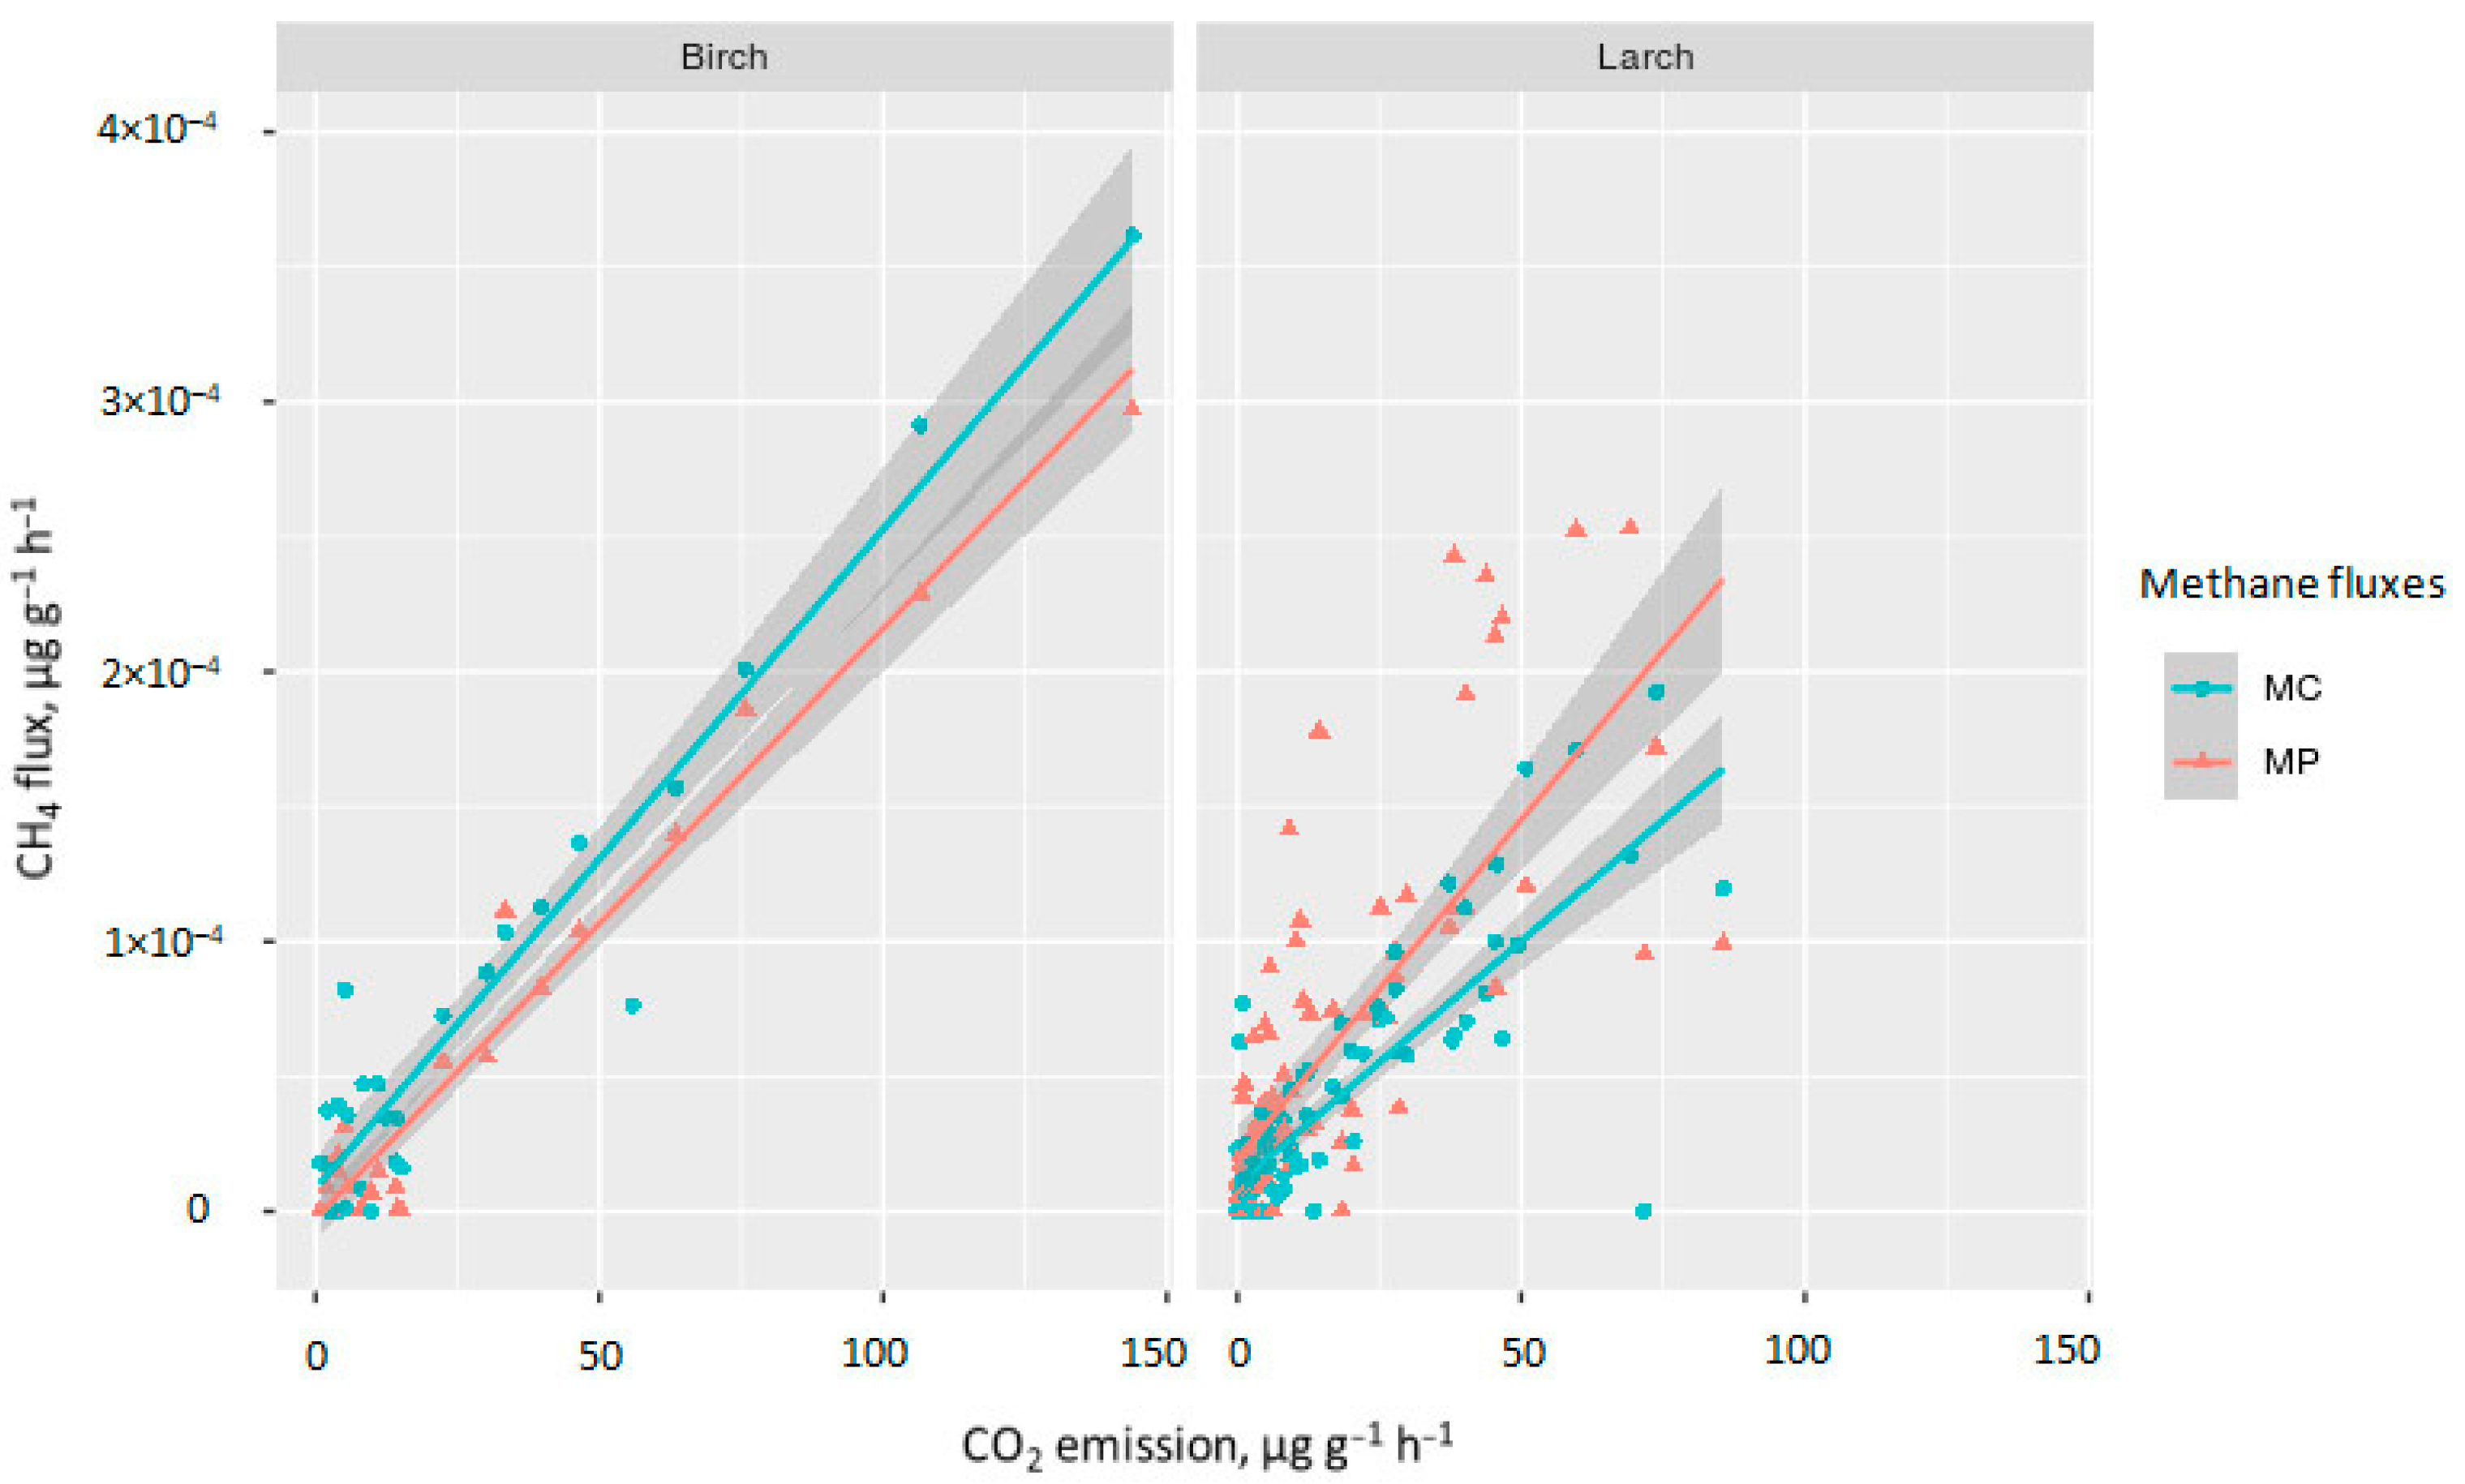
3.3. Methane Fluxes from Decomposing CWD Samples
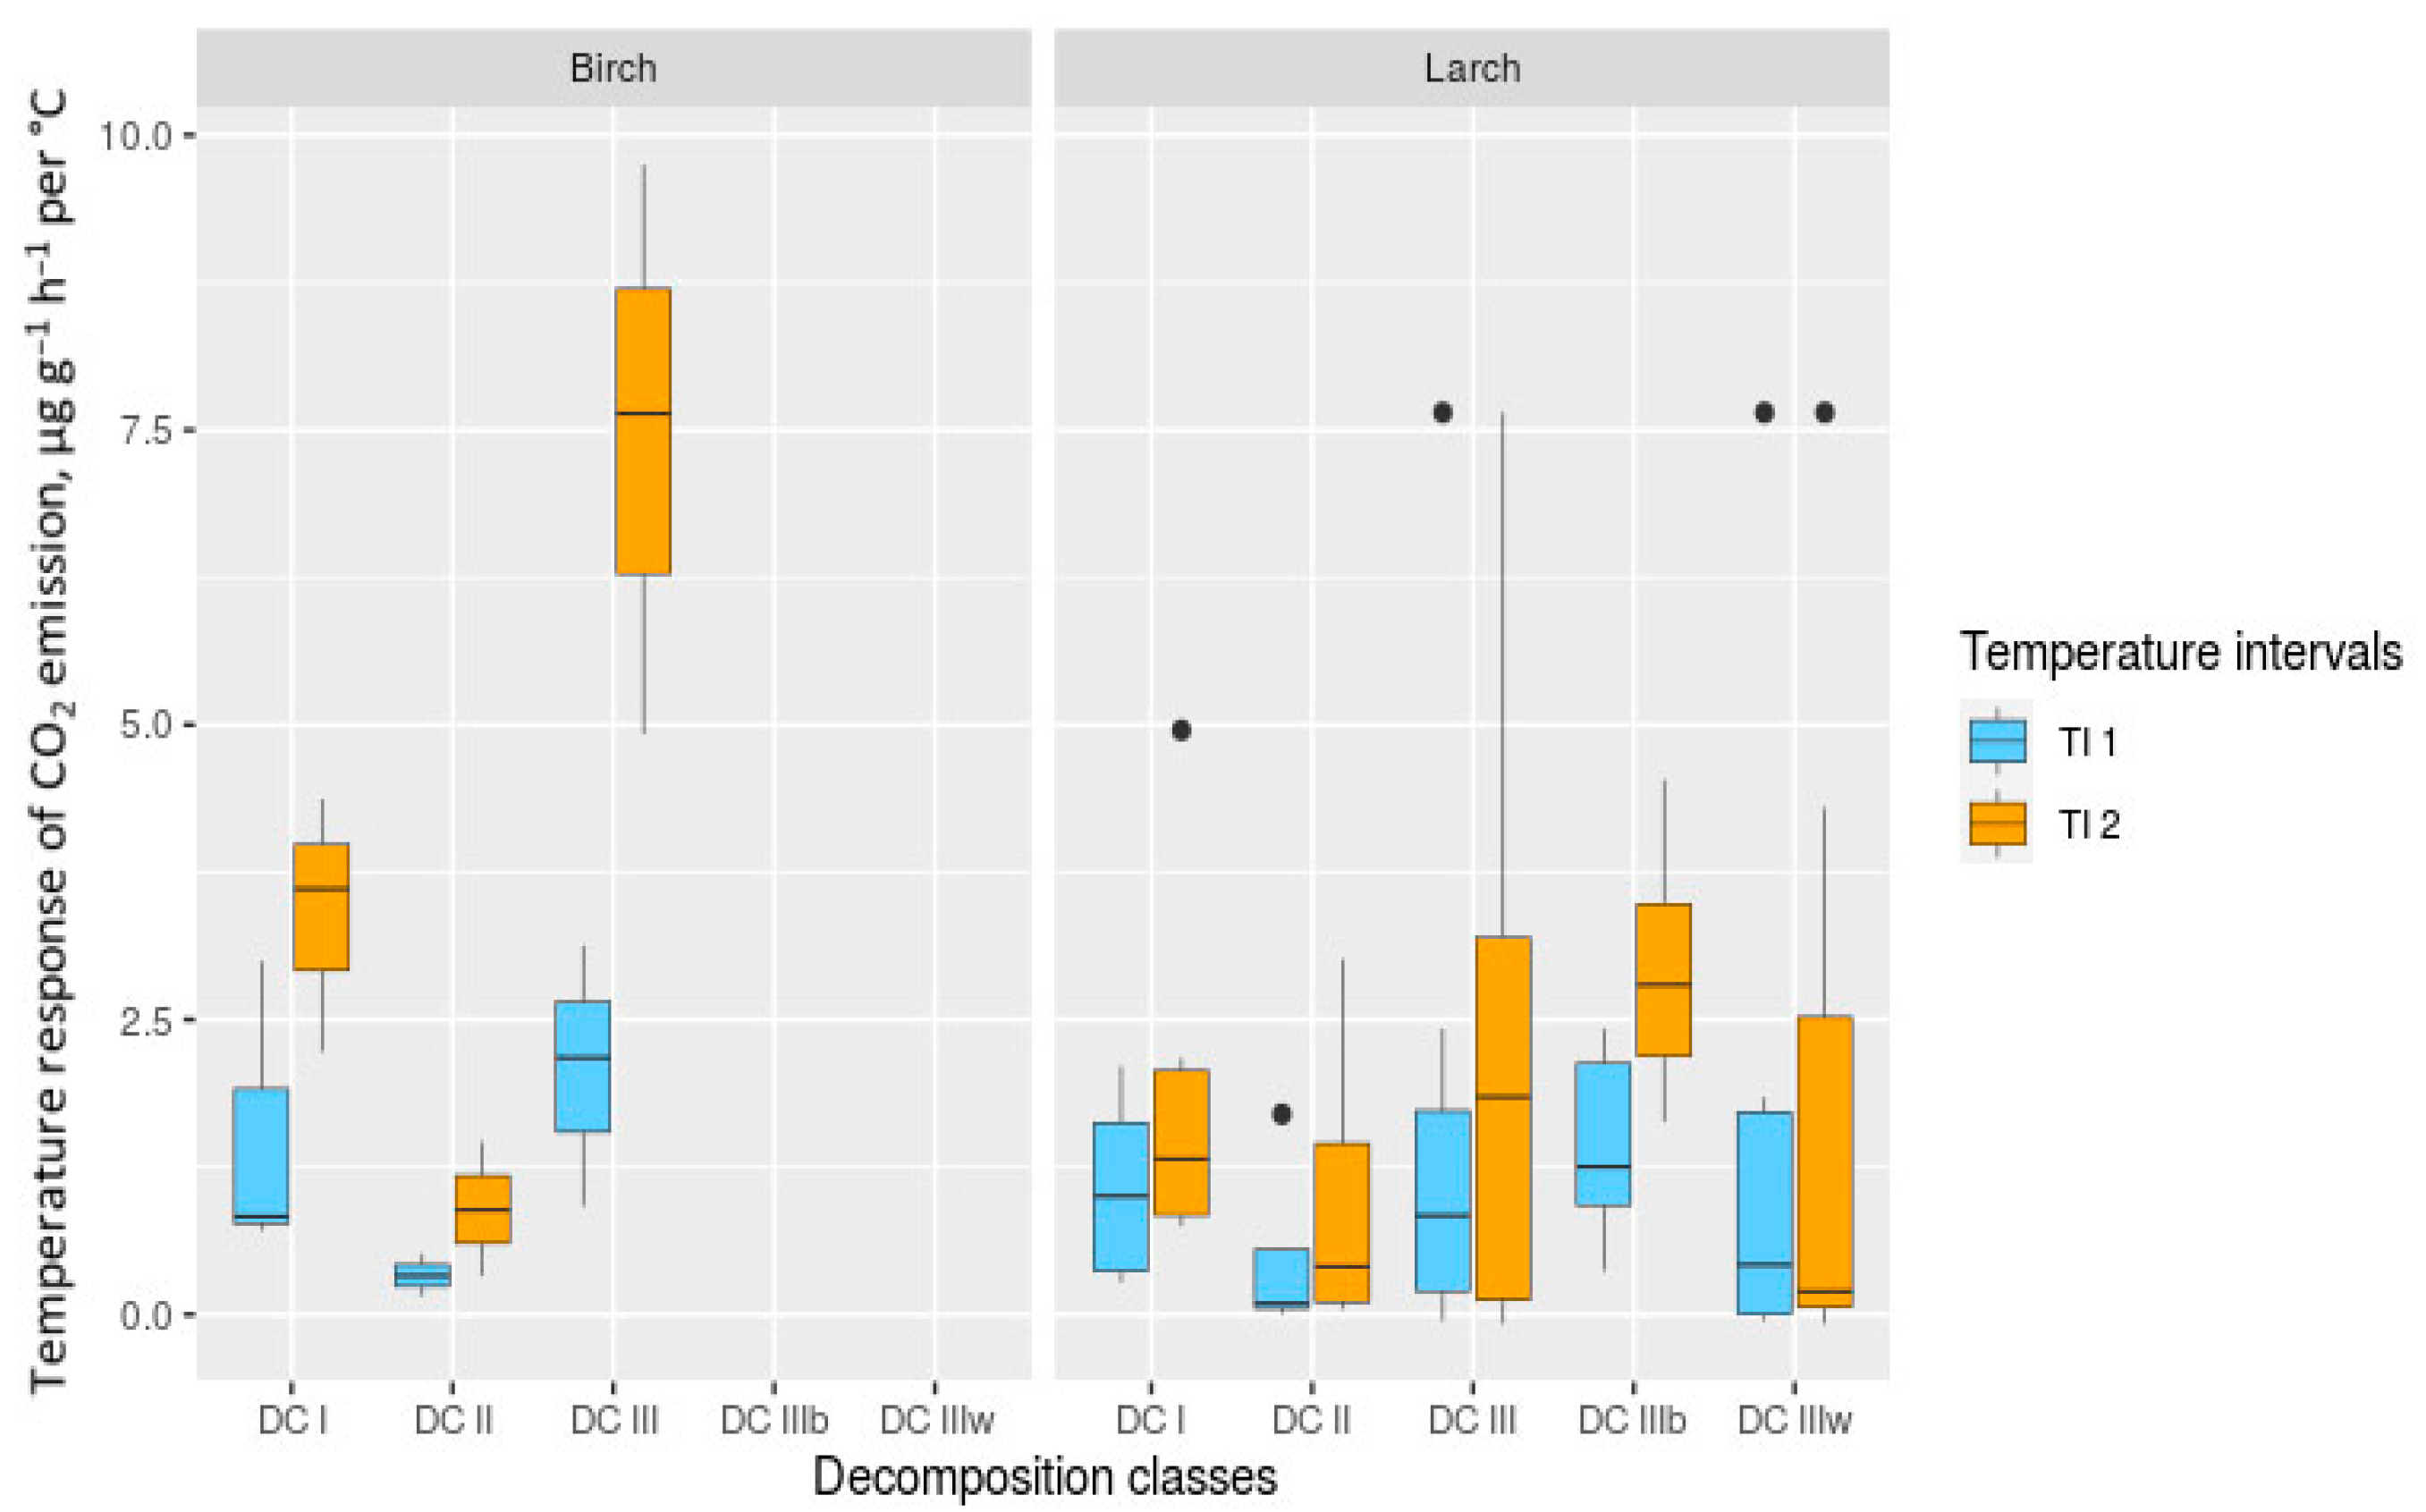
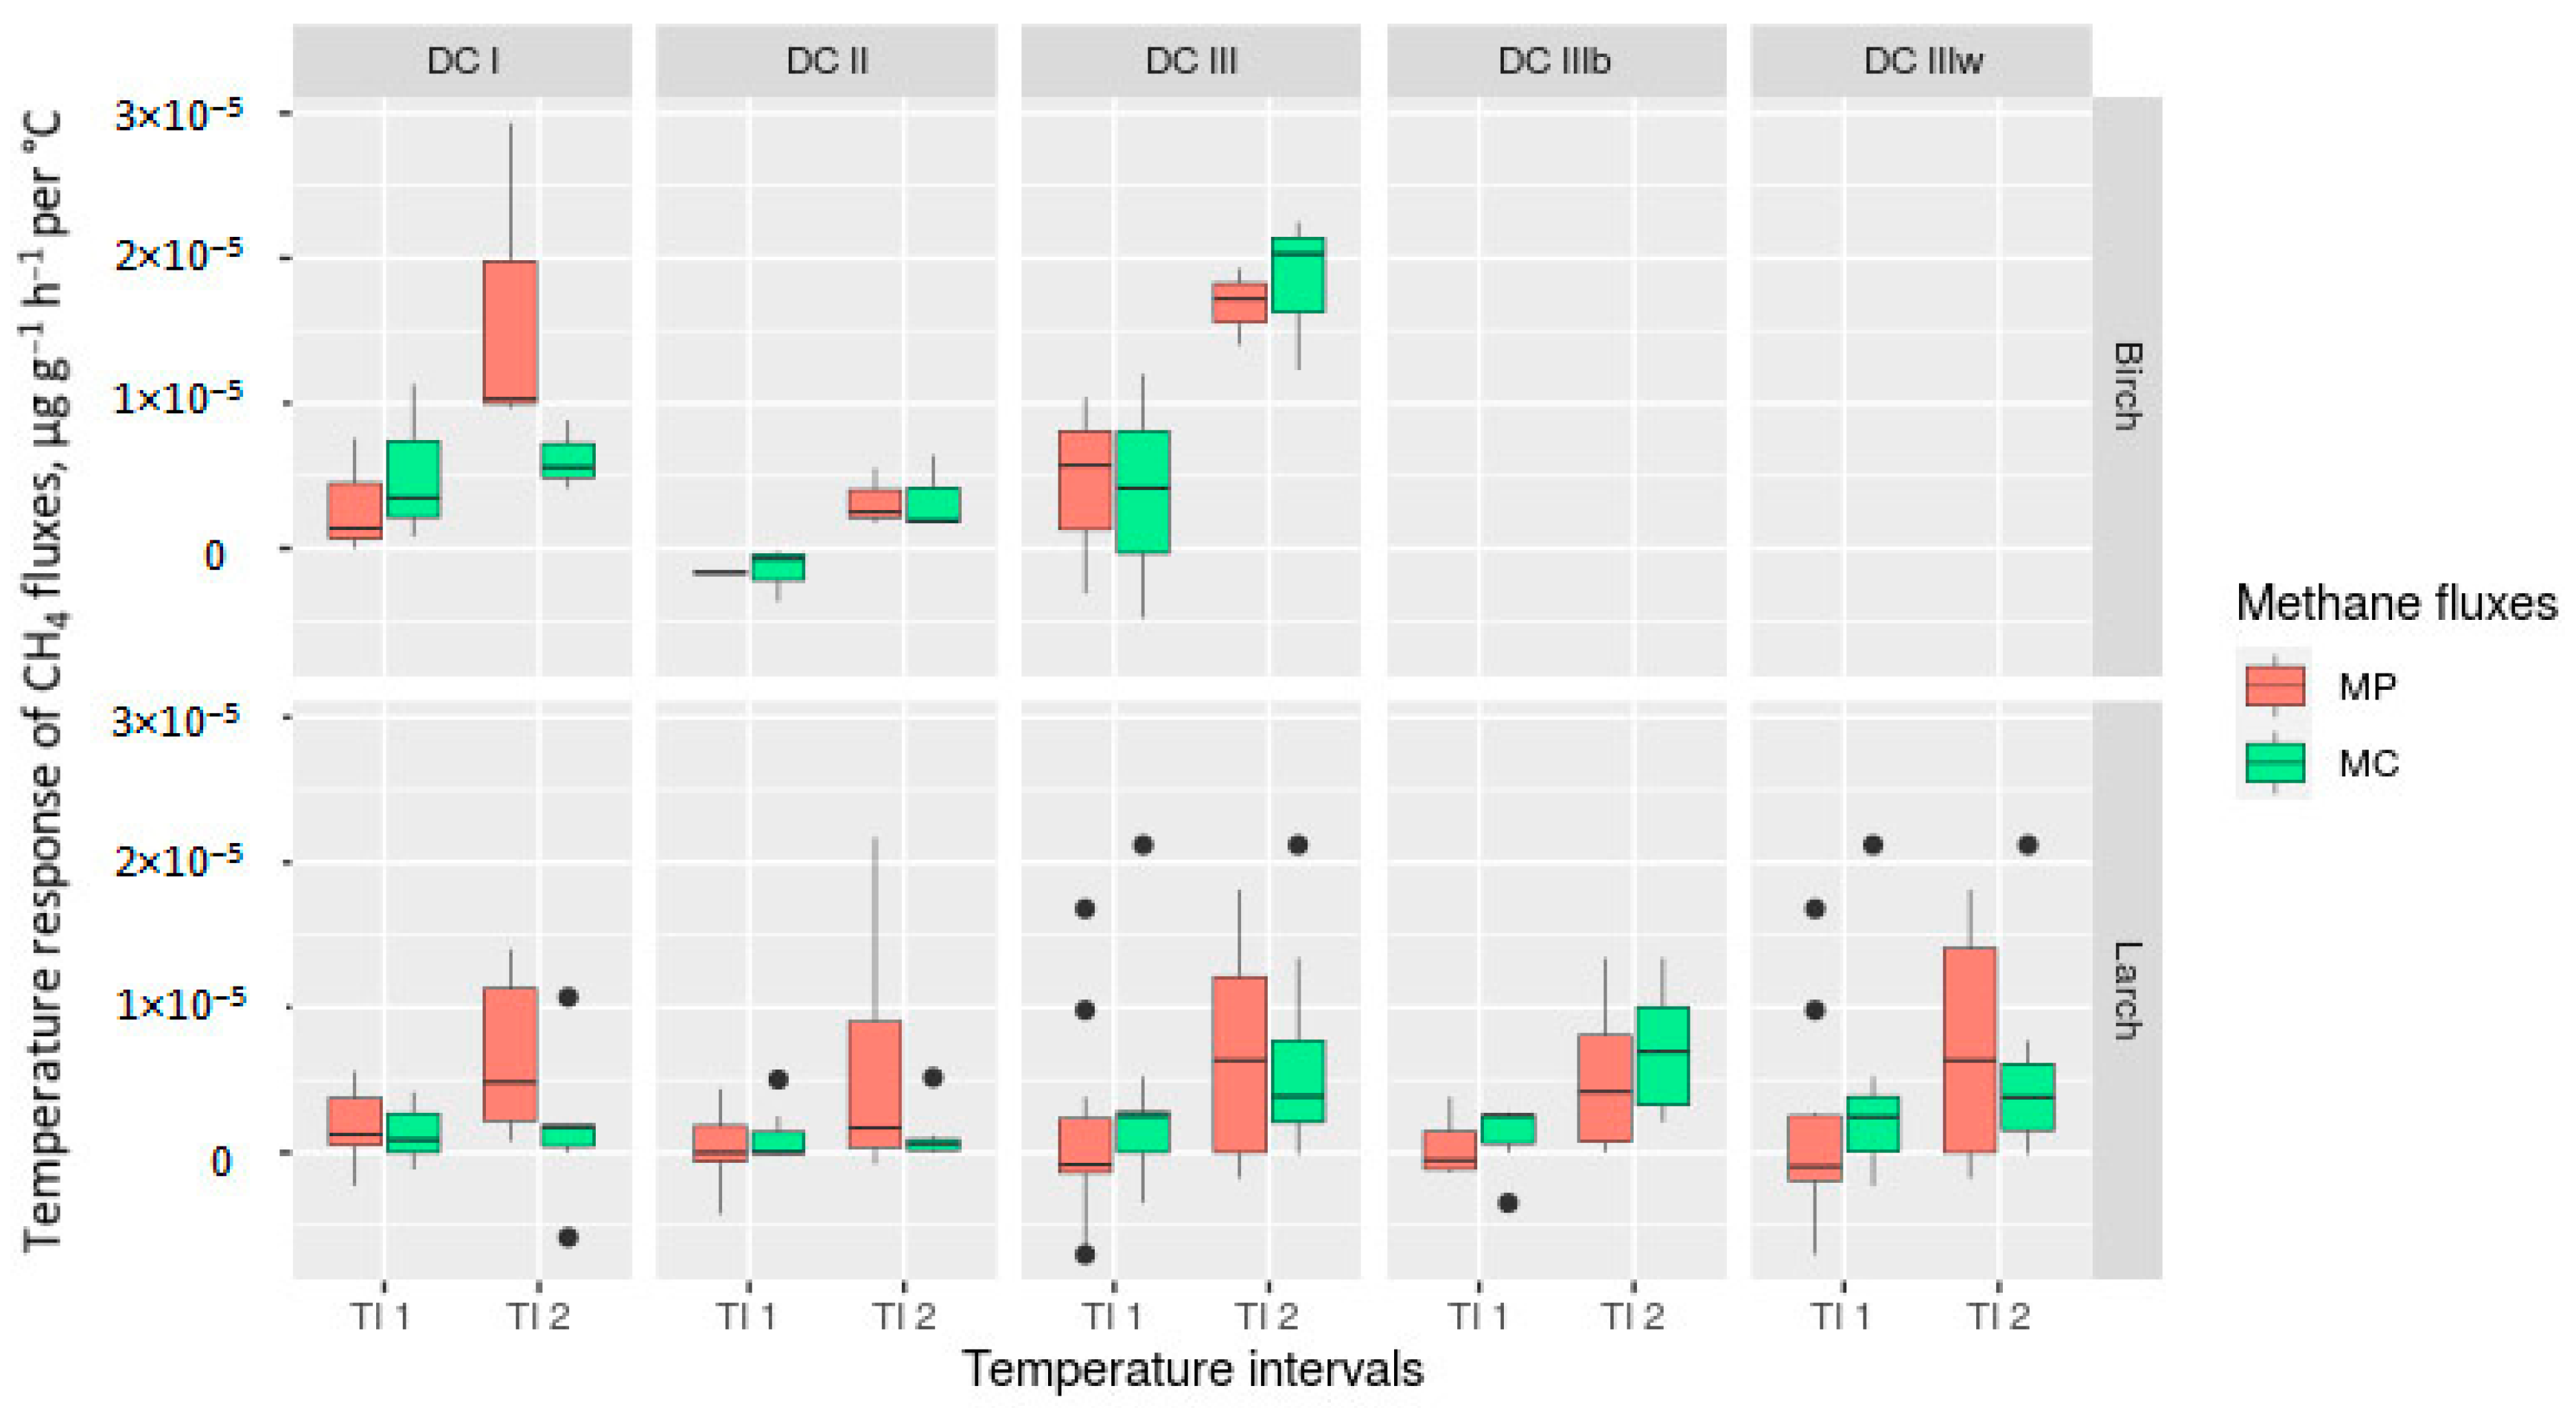
3.4. Temperature Sensitivity and Temperature Response of CO2 and CH4 Fluxes
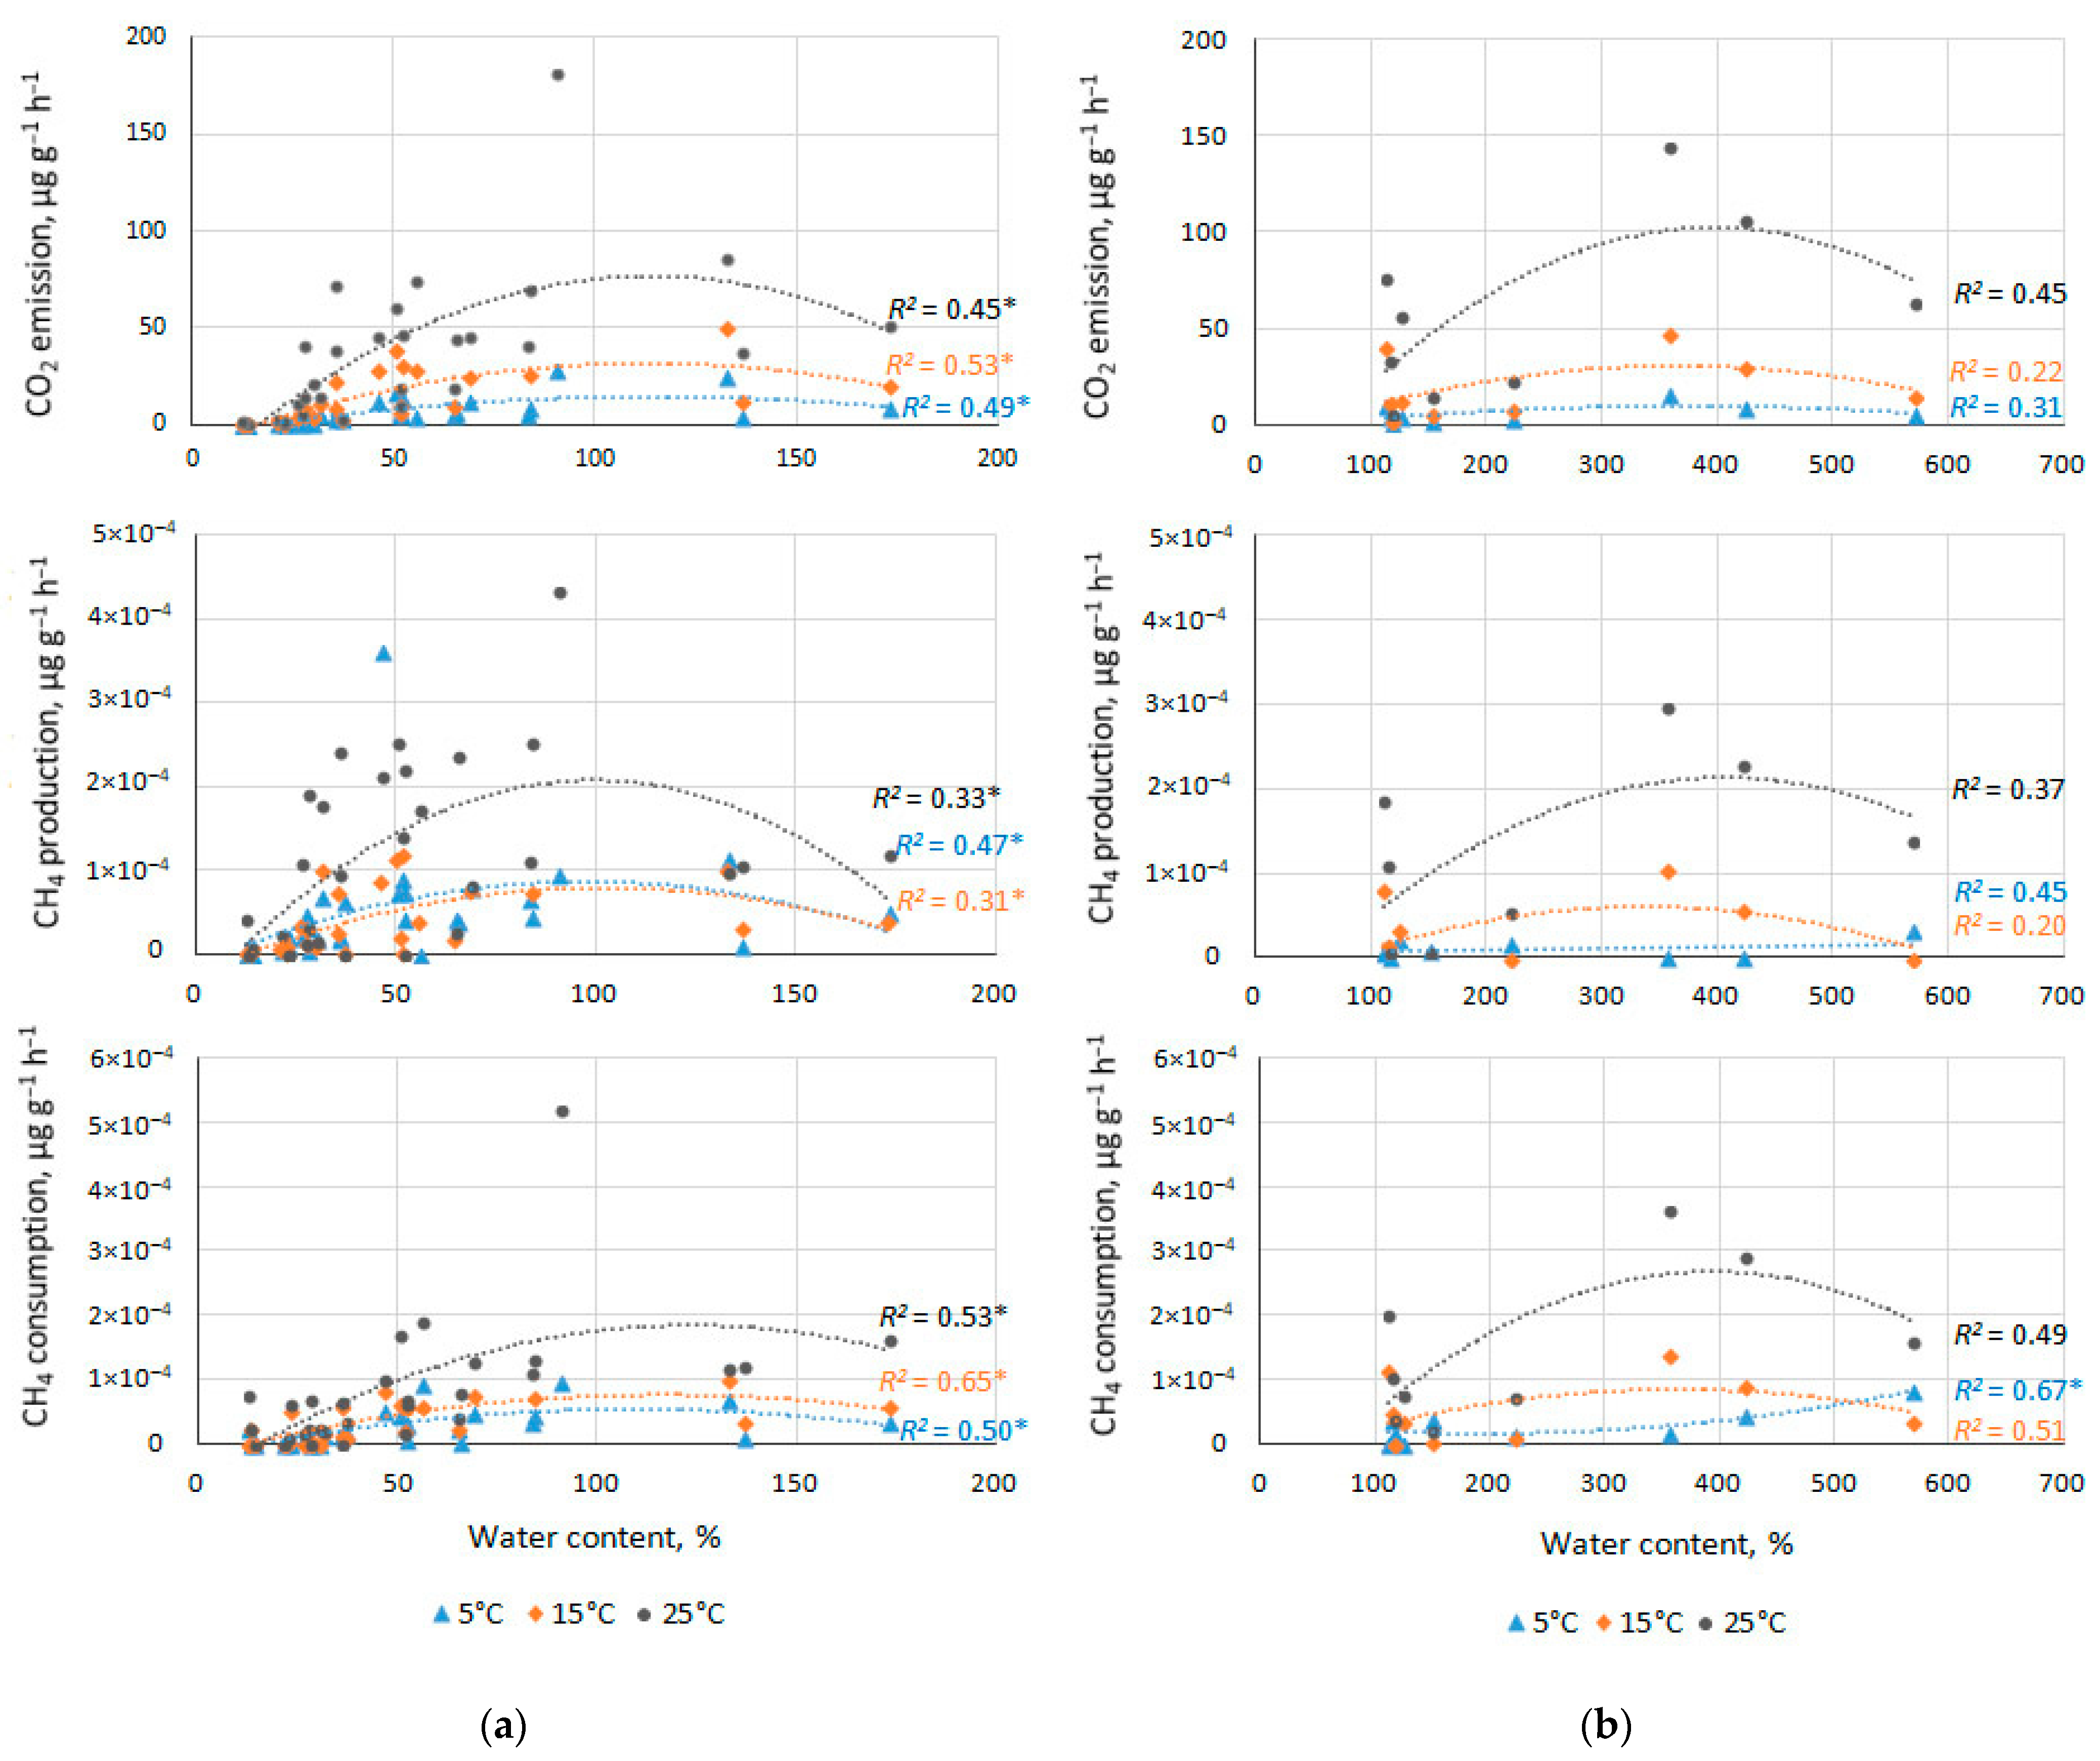
3.5. Effect of Water Content on CO2 and CH4 Fluxes
3.6. Analysis of The Main Factors Affecting on CO2 and CH4 Fluxes
3.7. Effect of The Main Factors on Temperature Sensitivity (Q10) and Temperature Response of CO2 and CH4 Fluxes
4. Discussion
4.1. CO2 and CH4 Fluxes from Decomposing CWD
4.2. Effect of Water Content on CO2 and CH4 Fluxes
4.3. Temperature Sensitivity of CO2 Flux
4.4. Temperature Sensitivity and Temperature Response of Methane Fluxes
5. Conclusions
Supplementary Materials
Author Contributions
Funding
Data Availability Statement
Acknowledgments
Conflicts of Interest
References
- NASA GISS: Science Briefs: Greenhouse Gas Influence on Northern Hemisphere Winter Climate Trends. Available online: https://www.giss.nasa.gov/research/briefs/shindell_04/ (accessed on 7 July 2020).
- Zamolodchikov, D.G.; Utkin, A.I.; Korovin, G.N.; Chestnykh, O.V. Dynamics of Carbon Pools and Fluxes in Russia’s Forest Lands. Russ. J. Ecol. 2005, 36, 291–301. [Google Scholar] [CrossRef]
- Harmon, M.E.; Fasth, B.G.; Yatskov, M.; Kastendick, D.; Rock, J.; Woodall, C.W. Release of Coarse Woody Detritus-Related Carbon: A Synthesis across Forest Biomes. Carbon Balance Manag. 2020, 15, 1–21. [Google Scholar] [CrossRef] [PubMed]
- Weedon, J.T.; Cornwell, W.K.; Cornelissen, J.H.C.; Zanne, A.E.; Wirth, C.; Coomes, D.A. Global Meta-Analysis of Wood Decomposition Rates: A Role for Trait Variation among Tree Species? Ecol. Lett. 2009, 12, 45–56. [Google Scholar] [CrossRef]
- Fournier, T.P.; Brossier, B.; Gasssuthier, O.; Carcaillet, C. Post-Fire Dynamics and Spatial Heterogeneity of Woody Debris Associated with Pinus Halepensis in an Oak-Pine Mediterranean Ecosystem. Écoscience 2012, 19, 356–363. [Google Scholar] [CrossRef]
- Mukhortova, L. Carbon Budget Recovery and Role of Coarse Woody Debris in Post-Logging Forest Ecosystems of Southern Siberia. Bosque 2012, 33, 261–265. [Google Scholar] [CrossRef] [Green Version]
- Osone, Y.; Toma, T.; Warsudi; Sutedjo; Sato, T. High Stocks of Coarse Woody Debris in a Tropical Rainforest, East Kalimantan: Coupled Impact of Forest Fires and Selective Logging. For. Ecol. Manag. 2016, 374, 93–101. [Google Scholar] [CrossRef]
- Vedrova, E.F.; Evdokimenko, M.D.; Bezkorovaynaya, I.N.; Mukhortova, L.V.; Cherednikova, Y.S. Reserves of Carbon in the Organic Matter of Postfire Pine Forests in the Southwest of the Baikal Region. Contemp. Probl. Ecol. 2012, 5, 645–653. [Google Scholar] [CrossRef]
- Mukhin, V.A.; Voronin, P.Y. Mycogenic Decomposition of Wood and Carbon Emission in Forest Ecosystems. Russ. J. Ecol. 2007, 38, 22–26. [Google Scholar] [CrossRef]
- Komhyr, W.D.; Gammon, R.H.; Harris, T.B.; Waterman, L.S.; Conway, T.J.; Taylor, W.R.; Thoning, K.W. Global Atmospheric CO2 Distribution and Variations from 1968–1982 NOAA/GMCC CO2 Flask Sample Data. J. Geophys. Res. Atmos. 1985, 90, 5567–5596. [Google Scholar] [CrossRef]
- Haines, A. Climate Change 2001: The Scientific Basis. In Contribution of Working Group 1 to the Third Assessment Report of the Intergovernmental Panel on Climate Change; Houghton, J.T., Ding, Y., Griggs, D.J., Noguer, M., van der Winden, P.J., Dai, X., Eds.; Cambridge University Press: Cambridge, UK, 2001; p. 881. [Google Scholar]
- Pleshikov, F.I.; Vaganov, E.A.; Vedrova, E.F. Forest Ecosystems of the Yenisey Meridian; Publishing House of SB RAS: Novosibirsk, Russia, 2002. [Google Scholar]
- Abaimov, A.P.; Zyryanova, O.A.; Prokushkin, S.G.; Koike, T.; Matsuura, Y. Forest Ecosystems of the Cryolithic Zone of Siberia: Regional Features, Mechanisms of Stability and Pyrogenic Changes. Eurasian J. For. Res. 2000, 1, 1–10. [Google Scholar]
- Zyryanova, O.A.; Abaimov, A.P.; Daimaru, H.; Matsuura, Y. Floristic Diversity and its Geographical Background in Central Siberia. In Permafrost Ecosystems: Siberian Larch Forests; Osawa, A., Zyryanova, O.A., Matsuura, Y., Kajimoto, T., Wein, R.W., Eds.; Ecological Studies; Springer: Dordrecht, The Netherlands, 2010; pp. 17–39. ISBN 978-1-4020-9693-8. [Google Scholar]
- Zyryanova, O.A.; Yaborov, V.T.; Tchikhacheva, T.L.; Koike, T.; Kobayashi, M.; Matsuura, Y.; Satoh, F.; Zyryanov, V. The Structure and Biodiversity after Fire Disturbance in Larix Gmelinii (Rupr.). Eurasian J. For. Res. 2007, 10, 19–29. [Google Scholar]
- Koropachinskiy, I.Y. North Asian Woody Plants: In 2 Volumes; Publishing House “Geo”. Available online: http://www.izdatgeo.ru/index.php?action=book&id=376 (accessed on 23 December 2020).
- Krivobokov, L.V.; Zverev, A.A.; Mukhortova, L.V. Floristic Characteristics, Types and Ecology of Larch Forests of the Middle Siberia of Northern Boreal Subzone. Ecol. Saf. 2015, 9, 190–198. [Google Scholar]
- Schimel, D.S.; House, J.I.; Hibbard, K.A.; Bousquet, P.; Ciais, P.; Peylin, P.; Braswell, B.H.; Apps, M.J.; Baker, D.; Bondeau, A.; et al. Recent Patterns and Mechanisms of Carbon Exchange by Terrestrial Ecosystems. Nature 2001, 414, 169–172. [Google Scholar] [CrossRef] [PubMed]
- Mukhortova, L.; Trefilova, O.; Krivobokov, L.; Klimchenko, A.; Vedrova, E. Coarse Woody Debris Stock in Forest Ecosystems on Latitudinal Gradient of Central Siberia. Int. Multidiscip. Sci. GeoConf. SGEM 2016, 2, 495–502. [Google Scholar]
- Kajimoto, T.; Osawa, A.; Usoltsev, V.A.; Abaimov, A.P. Biomass and Productivity of Siberian Larch Forest Ecosystems. In Permafrost Ecosystems: Siberian Larch Forests; Osawa, A., Zyryanova, O.A., Matsuura, Y., Kajimoto, T., Wein, R.W., Eds.; Ecological Studies; Springer: Dordrecht, The Netherlands, 2010; pp. 99–122. ISBN 978-1-4020-9693-8. [Google Scholar]
- Osawa, A.; Matsuura, Y.; Kajimoto, T. Characteristics of Permafrost Forests in Siberia and Potential Responses to Warming Climate. In Permafrost Ecosystems: Siberian Larch Forests; Osawa, A., Zyryanova, O.A., Matsuura, Y., Kajimoto, T., Wein, R.W., Eds.; Ecological Studies; Springer: Dordrecht, The Netherlands, 2010; pp. 459–481. ISBN 978-1-4020-9693-8. [Google Scholar]
- Sofronov, M.A.; Volokitina, A.V. Wildfire Ecology in Continuous Permafrost Zone. In Permafrost Ecosystems: Siberian Larch Forests; Osawa, A., Zyryanova, O.A., Matsuura, Y., Kajimoto, T., Wein, R.W., Eds.; Ecological Studies; Springer: Dordrecht, The Netherlands, 2010; pp. 59–82. ISBN 978-1-4020-9693-8. [Google Scholar]
- Serreze, M.C.; Walsh, J.E.; Chapin, F.S.; Osterkamp, T.; Dyurgerov, M.; Romanovsky, V.; Oechel, W.C.; Morison, J.; Zhang, T.; Barry, R.G. Observational Evidence of Recent Change in the Northern High-Latitude Environment. Clim. Chang. 2000, 46, 159–207. [Google Scholar] [CrossRef]
- Reichstein, M.; Bahn, M.; Ciais, P.; Frank, D.; Mahecha, M.D.; Seneviratne, S.I.; Zscheischler, J.; Beer, C.; Buchmann, N.; Frank, D.C.; et al. Climate Extremes and the Carbon Cycle. Nature 2013, 500, 287–295. [Google Scholar] [CrossRef] [PubMed]
- Seidl, R.; Thom, D.; Kautz, M.; Martin-Benito, D.; Peltoniemi, M.; Vacchiano, G.; Wild, J.; Ascoli, D.; Petr, M.; Honkaniemi, J.; et al. Forest Disturbances under Climate Change. Nat. Clim. Chang. 2017, 7, 395–402. [Google Scholar] [CrossRef] [Green Version]
- McDowell, N.G.; Michaletz, S.T.; Bennett, K.E.; Solander, K.C.; Xu, C.; Maxwell, R.M.; Middleton, R.S. Predicting Chronic Climate-Driven Disturbances and Their Mitigation. Trends Ecol. Evol. 2018, 33, 15–27. [Google Scholar] [CrossRef] [PubMed]
- Cross, W.F.; Hood, J.M.; Benstead, J.P.; Huryn, A.D.; Nelson, D. Interactions between Temperature and Nutrients across Levels of Ecological Organization. Glob. Chang. Biol. 2015, 21, 1025–1040. [Google Scholar] [CrossRef] [PubMed] [Green Version]
- Zhu, J.; Hu, H.; Tao, S.; Chi, X.; Li, P.; Jiang, L.; Ji, C.; Zhu, J.; Tang, Z.; Pan, Y.; et al. Carbon Stocks and Changes of Dead Organic Matter in China’s Forests. Nat. Commun. 2017, 8, 151. [Google Scholar] [CrossRef]
- Alster, C.J.; von Fischer, J.C.; Allison, S.D.; Treseder, K.K. Embracing a New Paradigm for Temperature Sensitivity of Soil Microbes. Glob. Chang. Biol. 2020, 26, 3221–3229. [Google Scholar] [CrossRef]
- Sierra, C.A. Temperature Sensitivity of Organic Matter Decomposition in the Arrhenius Equation: Some Theoretical Considerations. Biogeochemistry 2012, 108, 1–15. [Google Scholar] [CrossRef]
- Mukhin, V.; Voronin, P. Methane Emission during Wood Fungal Decomposition. Dokl. Biol. Sci. 2007, 413, 159–160. [Google Scholar] [CrossRef]
- Abril, G.; Parize, M.; Pérez, M.A.P.; Filizola, N. Wood Decomposition in Amazonian Hydropower Reservoirs: An Additional Source of Greenhouse Gases. J. S. Am. Earth Sci. 2013, 44, 104–107. [Google Scholar] [CrossRef]
- Covey, K.R.; Wood, S.A.; Warren, R.J.; Lee, X.; Bradford, M.A. Elevated Methane Concentrations in Trees of an Upland Forest. Geophys. Res. Lett. 2012, 39. [Google Scholar] [CrossRef] [Green Version]
- Warner, D.L.; Villarreal, S.; McWilliams, K.; Inamdar, S.; Vargas, R. Carbon Dioxide and Methane Fluxes From Tree Stems, Coarse Woody Debris, and Soils in an Upland Temperate Forest. Ecosystems 2017, 20, 1205–1216. [Google Scholar] [CrossRef]
- Carmichael, M.J.; Helton, A.M.; White, J.C.; Smith, W.K. Standing Dead Trees Are a Conduit for the Atmospheric Flux of CH4 and CO2 from Wetlands. Wetlands 2018, 38, 133–143. [Google Scholar] [CrossRef] [Green Version]
- Covey, K.R.; Megonigal, J.P. Methane Production and Emissions in Trees and Forests. New Phytol. 2019, 222, 35–51. [Google Scholar] [CrossRef]
- Lyu, Z.; Shao, N.; Akinyemi, T.; Whitman, W.B. Methanogenesis. Curr. Biol. 2018, 28, R727–R732. [Google Scholar] [CrossRef] [Green Version]
- Keppler, F.; Boros, M.; Frankenberg, C.; Lelieveld, J.; McLeod, A.; Pirttilä, A.M.; Röckmann, T.; Schnitzler, J.-P.; Keppler, F.; Boros, M.; et al. Methane Formation in Aerobic Environments. Environ. Chem. 2009, 6, 459–465. [Google Scholar] [CrossRef]
- Lenhart, K.; Bunge, M.; Ratering, S.; Neu, T.R.; Schüttmann, I.; Greule, M.; Kammann, C.; Schnell, S.; Müller, C.; Zorn, H.; et al. Evidence for Methane Production by Saprotrophic Fungi. Nat. Commun. 2012, 3, 1046. [Google Scholar] [CrossRef] [Green Version]
- Stein, L.Y. Methane Oxidation. In Encyclopedia of Astrobiology; Gargaud, M., Irvine, W.M., Amils, R., Cleaves, H.J., Pinti, D., Cernicharo Quintanilla, J., Viso, M., Eds.; Springer: Berlin/Heidelberg, Germany, 2019; pp. 1–4. ISBN 978-3-642-27833-4. [Google Scholar]
- Quay, P.; Stutsman, J.; Wilbur, D.; Snover, A.; Dlugokencky, E.; Brown, T. The Isotopic Composition of Atmospheric Methane. Glob. Biogeochem. Cycles 1999, 13, 445–461. [Google Scholar] [CrossRef]
- Keppler, F.; Hamilton, J.T.G.; Braß, M.; Röckmann, T. Methane Emissions from Terrestrial Plants under Aerobic Conditions. Nature 2006, 439, 187–191. [Google Scholar] [CrossRef] [PubMed]
- Craig, H. The Geochemistry of the Stable Carbon Isotopes. Geochim. Cosmochim. Acta 1953, 3, 53–92. [Google Scholar] [CrossRef]
- Coplen, T.B. Discontinuance of SMOW and PDB. Nature 1995, 375, 285. [Google Scholar] [CrossRef]
- Wagner, T.; Magill, C.R.; Herrle, J.O. Carbon Isotopes. In Encyclopedia of Geochemistry: A Comprehensive Reference Source on the Chemistry of the Earth; White, W.M., Ed.; Springer International Publishing: Cham, Switzerland, 2018; pp. 194–204. ISBN 978-3-319-39312-4. [Google Scholar]
- Bréas, O.; Guillou, C.; Reniero, F.; Wada, E. The Global Methane Cycle: Isotopes and Mixing Ratios, Sources and Sinks. Isot. Environ. Health Stud. 2001, 37, 257–379. [Google Scholar] [CrossRef] [PubMed]
- Whiticar, M.J. Carbon and Hydrogen Isotope Systematics of Bacterial Formation and Oxidation of Methane. Chem. Geol. 1999, 161, 291–314. [Google Scholar] [CrossRef]
- Henn, M.R.; Chapela, I.H. Differential C Isotope Discrimination by Fungi during Decomposition of C3- and C4-Derived Sucrose. Appl. Environ. Microbiol. 2000, 66, 4180–4186. [Google Scholar] [CrossRef] [PubMed] [Green Version]
- Fernandez, I.; Mahieu, N.; Cadisch, G. Carbon Isotopic Fractionation during Decomposition of Plant Materials of Different Quality. Glob. Biogeochem. Cycles 2003, 17. [Google Scholar] [CrossRef]
- Fernandez, I.; Cadisch, G. Discrimination against 13C during Degradation of Simple and Complex Substrates by Two White Rot Fungi. Rapid Commun. Mass Spectrom. 2003, 17, 2614–2620. [Google Scholar] [CrossRef]
- Barker, J.F.; Fritz, P. Carbon Isotope Fractionation during Microbial Methane Oxidation. Nature 1981, 293, 289–291. [Google Scholar] [CrossRef]
- Coleman, D.D.; Risatti, J.B.; Schoell, M. Fractionation of Carbon and Hydrogen Isotopes by Methane-Oxidizing Bacteria. Geochim. Cosmochim. Acta 1981, 45, 1033–1037. [Google Scholar] [CrossRef]
- Holler, T.; Wegener, G.; Knittel, K.; Boetius, A.; Brunner, B.; Kuypers, M.; Widdel, F. Substantial 13C/12C and D/H Fractionation during Anaerobic Oxidation of Methane by Marine Consortia Enriched in Vitro. Environ. Microbiol. Rep. 2009, 1, 370–376. [Google Scholar] [CrossRef]
- Uhlig, C.; Loose, B. Using Stable Isotopes and Gas Concentrations for Independent Constraints on Microbial Methane Oxidation at Arctic Ocean Temperatures. Limnol. Oceanogr. Methods 2017, 15, 737–751. [Google Scholar] [CrossRef] [Green Version]
- Wang, C.; Bond-Lamberty, B.; Gower, S.T. Environmental Controls on Carbon Dioxide Flux from Black Spruce Coarse Woody Debris. Oecologia 2002, 132, 374–381. [Google Scholar] [CrossRef]
- Olajuyigbe, S.; Tobin, B.; Nieuwenhuis, M. Temperature and Moisture Effects on Respiration Rate of Decomposing Logs in a Sitka Spruce Plantation in Ireland. For. Int. J. For. Res. 2012, 85, 485–496. [Google Scholar] [CrossRef] [Green Version]
- Yoon, T.K.; Noh, N.J.; Kim, S.; Han, S.; Son, Y. Coarse Woody Debris Respiration of Japanese Red Pine Forests in Korea: Controlling Factors and Contribution to the Ecosystem Carbon Cycle. Ecol. Res. 2015, 30, 723–734. [Google Scholar] [CrossRef]
- Yoon, T.K.; Han, S.; Lee, D.; Han, S.H.; Noh, N.J.; Son, Y. Effects of Sample Size and Temperature on Coarse Woody Debris Respiration from Quercus Variabilis Logs. J. For. Res. 2014, 19, 249–259. [Google Scholar] [CrossRef]
- Chambers, J.Q.; Schimel, J.P.; Nobre, A.D. Respiration from Coarse Wood Litter in Central Amazon Forests. Biogeochemistry 2001, 52, 115–131. [Google Scholar] [CrossRef]
- Wu, J.; Zhang, X.; Wang, H.; Sun, J.; Guan, D. Respiration of Downed Logs in an Old-Growth Temperate Forest in North-Eastern China. Scand. J. For. Res. 2010, 25, 500–506. [Google Scholar] [CrossRef]
- Liu, W.H.; Bryant, D.M.; Hutyra, L.R.; Saleska, S.R.; Hammond-Pyle, E.; Curran, D.; Wofsy, S.C. Woody Debris Contribution to the Carbon Budget of Selectively Logged and Maturing Mid-Latitude Forests. Oecologia 2006, 148, 108. [Google Scholar] [CrossRef] [PubMed]
- Middle Siberia. Natural Conditions and Natural Resources of USSR. Available online: https://litmy.ru/knigi/estesstv_nauki/342782-srednyaya-sibir-prirodnye-usloviya-i-estestvennye-resursy-sssr.html (accessed on 23 December 2020).
- Peel, M.C.; Finlayson, B.L.; McMahon, T.A. Updated World Map of the Köppen-Geiger Climate Classification. Hydrol. Earth Syst. Sci. 2007, 11, 1633–1644. [Google Scholar] [CrossRef] [Green Version]
- Fraver, S.; Wagner, R.G.; Day, M. Dynamics of Coarse Woody Debris Following Gap Harvesting in the Acadian Forest of Central Maine, USA. Can. J. For. Res. 2011. [Google Scholar] [CrossRef]
- Olesen, P.O. Water Displacement Method; a Fast and Accurate Method of Determining the Green Volume of Wood Samples. For. Tree Improv. 1971, 3, 3–23. [Google Scholar]
- Craig, H. Isotopic Standards for Carbon and Oxygen and Correction Factors for Mass-Spectrometric Analysis of Carbon Dioxide. Geochim. Cosmochim. Acta 1957, 12, 133–149. [Google Scholar] [CrossRef]
- Grossman, E.L.; Cifuentes, L.A.; Cozzarelli, I.M. Anaerobic Methane Oxidation in a Landfill-Leachate Plume. Environ. Sci. Technol. 2002, 36, 2436–2442. [Google Scholar] [CrossRef] [PubMed]
- Berg, B.; McClaugherty, C. Plant Litter: Decomposition, Humus Formation, Carbon Sequestration, 2nd ed.; Springer: Berlin, Germany, 2008; ISBN 978-3-540-74922-6. [Google Scholar]
- Holub, S.M.; Spears, J.D.; Lajtha, K. A Reanalysis of Nutrient Dynamics in Coniferous Coarse Woody Debris. Can. J. For. Res. 2001, 31, 1894–1902. [Google Scholar] [CrossRef]
- Laiho, R.; Prescott, C.E. Decay and Nutrient Dynamics of Coarse Woody Debris in Northern Coniferous Forests: A Synthesis. Can. J. For. Res. 2004, 34, 763–777. [Google Scholar] [CrossRef]
- Palviainen, M.; Finér, L.; Laiho, R.; Shorohova, E.; Kapitsa, E.; Vanha-Majamaa, I. Carbon and Nitrogen Release from Decomposing Scots Pine, Norway Spruce and Silver Birch Stumps. For. Ecol. Manag. 2010, 259, 390–398. [Google Scholar] [CrossRef]
- Köster, K.; Metslaid, M.; Engelhart, J.; Köster, E. Dead Wood Basic Density, and the Concentration of Carbon and Nitrogen for Main Tree Species in Managed Hemiboreal Forests. For. Ecol. Manag. 2015, 354, 35–42. [Google Scholar] [CrossRef]
- Mukhortova, L.V. Carbon and Nutrient Release during Decomposition of Coarse Woody Debris in Forest Ecosystems of Central Siberia. Folia For. Ser. For. 2012, 54, 71–83. [Google Scholar] [CrossRef]
- Rajala, T.; Peltoniemi, M.; Pennanen, T.; Mäkipää, R. Fungal Community Dynamics in Relation to Substrate Quality of Decaying Norway Spruce (Picea Abies [L.] Karst.) Logs in Boreal Forests. FEMS Microbiol. Ecol. 2012, 81, 494–505. [Google Scholar] [CrossRef] [PubMed] [Green Version]
- Bebber, D.P.; Watkinson, S.C.; Boddy, L.; Darrah, P.R. Simulated Nitrogen Deposition Affects Wood Decomposition by Cord-Forming Fungi. Oecologia 2011, 167, 1177–1184. [Google Scholar] [CrossRef]
- Mukhortova, L.V.; Kirdyanov, A.V.; Myglan, V.S.; Guggenberger, G. Wood Transformation in Dead-Standing Trees in the Forest-Tundra of Central Siberia. Biol. Bull. Russ. Acad. Sci. 2009, 36, 58–65. [Google Scholar] [CrossRef]
- Yatskov, M.; Harmon, M.E.; Krankina, O.N. A Chronosequence of Wood Decomposition in the Boreal Forests of Russia. Can. J. For. Res. 2003, 33, 1211–1226. [Google Scholar] [CrossRef]
- Rasigraf, O.; Vogt, C.; Richnow, H.-H.; Jetten, M.S.M.; Ettwig, K.F. Carbon and Hydrogen Isotope Fractionation during Nitrite-Dependent Anaerobic Methane Oxidation by Methylomirabilis Oxyfera. Geochim. Cosmochim. Acta 2012, 89, 256–264. [Google Scholar] [CrossRef] [Green Version]
- Kinnaman, F.S.; Valentine, D.L.; Tyler, S.C. Carbon and Hydrogen Isotope Fractionation Associated with the Aerobic Microbial Oxidation of Methane, Ethane, Propane and Butane. Geochim. Cosmochim. Acta 2007, 71, 271–283. [Google Scholar] [CrossRef]
- Rajala, T.; Tuomivirta, T.; Pennanen, T.; Mäkipää, R. Habitat Models of Wood-Inhabiting Fungi along a Decay Gradient of Norway Spruce Logs. Fungal Ecol. 2015, 18, 48–55. [Google Scholar] [CrossRef] [Green Version]
- Mäkipää, R.; Leppänen, S.M.; Sanz Munoz, S.; Smolander, A.; Tiirola, M.; Tuomivirta, T.; Fritze, H. Methanotrophs Are Core Members of the Diazotroph Community in Decaying Norway Spruce Logs. Soil Biol. Biochem. 2018, 120, 230–232. [Google Scholar] [CrossRef]
- Rajala, T.R.; Peltoniemi, M.P.; Pennanen, T.P.; Mäkipää, R.M. Relationship between Wood-Inhabiting Fungi Determined by Molecular Analysis (Denaturing Gradient Gel Electrophoresis) and Quality of Decaying Logs. Can. J. For. Res. 2010. [Google Scholar] [CrossRef]
- Herrmann, S.; Bauhus, J. Effects of Moisture, Temperature and Decomposition Stage on Respirational Carbon Loss from Coarse Woody Debris (CWD) of Important European Tree Species. Scand. J. For. Res. 2013, 28, 346–357. [Google Scholar] [CrossRef]
- Bond-Lamberty, B.; Wang, C.; Gower, S.T. Annual Carbon Flux from Woody Debris for a Boreal Black Spruce Fire Chronosequence. J. Geophys. Res. Atmos. 2002, 107, WFX 1-1–WFX 1-10. [Google Scholar] [CrossRef]
- Köster, E.; Köster, K.; Berninger, F.; Prokushkin, A.; Aaltonen, H.; Zhou, X.; Pumpanen, J. Changes in Fluxes of Carbon Dioxide and Methane Caused by Fire in Siberian Boreal Forest with Continuous Permafrost. J. Environ. Manag. 2018, 228, 405–415. [Google Scholar] [CrossRef] [PubMed] [Green Version]
- Masyagina, O.V.; Evgrafova, S.Y.; Menyailo, O.V.; Mori, S.; Koike, T.; Prokushkin, S.G. Age-Dependent Changes in Soil Respiration and Associated Parameters in Siberian Permafrost Larch Stands Affected by Wildfire. Forests 2021, 12, 107. [Google Scholar] [CrossRef]
- Grodnitskaya, I.D.; Sorokin, N.D.; Evgrafova, S.Y.; Antonov, G.I.; Syrtsov, S.N.; Aleksandrov, D.E.; Trusova, M.Y.; Koroban, N.V. Microbial transformation of carbon CH4 and CO2 in permafrost-affected soils in tundra and forest ecosystems in Siberia. Lesovedenie 2017, 2, 111–127. [Google Scholar]
- Wall, D.H.; Bradford, M.A.; John, M.G.S.; Trofymow, J.A.; Behan-Pelletier, V.; Bignell, D.E.; Dangerfield, J.M.; Parton, W.J.; Rusek, J.; Voigt, W.; et al. Global Decomposition Experiment Shows Soil Animal Impacts on Decomposition Are Climate-Dependent. Glob. Chang. Biol. 2008, 14, 2661–2677. [Google Scholar] [CrossRef] [Green Version]
- Adair, E.C.; Parton, W.J.; Grosso, S.J.D.; Silver, W.L.; Harmon, M.E.; Hall, S.A.; Burke, I.C.; Hart, S.C. Simple Three-Pool Model Accurately Describes Patterns of Long-Term Litter Decomposition in Diverse Climates. Glob. Chang. Biol. 2008, 14, 2636–2660. [Google Scholar] [CrossRef]
- Boddy, L. Effect of Temperature and Water Potential on Growth Rate of Wood-Rotting Basidiomycetes. Trans. Br. Mycol. Soc. 1983, 80, 141–149. [Google Scholar] [CrossRef]
- Rayner, A.D.M.; Boddy, L. Fungal Decomposition of Wood. Its Biology and Ecology. In Fungal Decomposition of Wood. Its Biology and Ecology; John Wiley & Sons Ltd.: Hoboken, NJ, USA, 1988. [Google Scholar]
- Griffith, G.S.; Boddy, L. Fungal Decomposition of Attached Angiosperm Twigs. New Phytol. 1991, 117, 259–269. [Google Scholar] [CrossRef]
- Criquet, S.; Ferre, E.; Farnet, A.M.; Le petit, J. Annual Dynamics of Phosphatase Activities in an Evergreen Oak Litter: Influence of Biotic and Abiotic Factors. Soil Biol. Biochem. 2004, 36, 1111–1118. [Google Scholar] [CrossRef]
- Baldrian, P.; Šnajdr, J.; Merhautová, V.; Dobiášová, P.; Cajthaml, T.; Valášková, V. Responses of the Extracellular Enzyme Activities in Hardwood Forest to Soil Temperature and Seasonality and the Potential Effects of Climate Change. Soil Biol. Biochem. 2013, 56, 60–68. [Google Scholar] [CrossRef]
- A’Bear, A.D.; Jones, T.H.; Kandeler, E.; Boddy, L. Interactive Effects of Temperature and Soil Moisture on Fungal-Mediated Wood Decomposition and Extracellular Enzyme Activity. Soil Biol. Biochem. 2014, 70, 151–158. [Google Scholar] [CrossRef]
- Käärik, A.A. 5-Decomposition of Wood. In Biology of Plant Litter Decomposition; Dickinson, C.H., Pugh, G.J.F., Eds.; Academic Press: New York, NY, USA, 1974; pp. 129–174. ISBN 978-0-12-215001-2. [Google Scholar]
- Schmidt, O.; Czeschlik, D. Wood and Tree Fungi: Biology, Damage, Protection, and Use; Springer: Berlin, Germany, 2006; ISBN 978-3-540-32138-5. [Google Scholar]
- Harmon, M.E. Ecology of Coarse Woody Debris in Temperate Ecosystems. Adv. Ecol. Res. 1986, 15, 133–302. [Google Scholar]
- Rinne-Garmston, K.T.; Peltoniemi, K.; Chen, J.; Peltoniemi, M.; Fritze, H.; Mäkipää, R. Carbon Flux from Decomposing Wood and Its Dependency on Temperature, Wood N2 Fixation Rate, Moisture and Fungal Composition in a Norway Spruce Forest. Glob. Chang. Biol. 2019, 25, 1852–1867. [Google Scholar] [CrossRef] [PubMed] [Green Version]
- Jomura, M.; Kominami, Y.; Dannoura, M.; Kanazawa, Y. Spatial Variation in Respiration from Coarse Woody Debris in a Temperate Secondary Broad-Leaved Forest in Japan. For. Ecol. Manag. 2008, 255, 149–155. [Google Scholar] [CrossRef]
- Forrester, J.A.; Mladenoff, D.J.; Gower, S.T.; Stoffel, J.L. Interactions of Temperature and Moisture with Respiration from Coarse Woody Debris in Experimental Forest Canopy Gaps. For. Ecol. Manag. 2012, 265, 124–132. [Google Scholar] [CrossRef]
- Pettersen, R.C. The Chemical Composition of Wood. In The Chemistry of Solid Wood; Advances in Chemistry; American Chemical Society: Washington, DC, USA, 1984; Volume 207, pp. 57–126. ISBN 978-0-8412-0796-7. [Google Scholar]
- Gough, C.M.; Vogel, C.S.; Kazanski, C.; Nagel, L.; Flower, C.E.; Curtis, P.S. Coarse Woody Debris and the Carbon Balance of a North Temperate Forest. For. Ecol. Manag. 2007, 244, 60–67. [Google Scholar] [CrossRef]
- Ivanov, A.V.; Braun, M.; Zamolodchikov, D.G.; Loshakov, S.Y.; Pototskii, O.V. Carbon Emission from the Surface of Coarse Woody Debris in Korean Pine Forests of Southern Primorye. Russ. J. Ecol. 2018, 49, 306–311. [Google Scholar] [CrossRef]
- Mackensen, J.; Bauhus, J.; Webber, E. Decomposition Rates of Coarse Woody Debris—A Review with Particular Emphasis on Australian Tree Species. Aust. J. Bot. 2003, 51, 27–37. [Google Scholar] [CrossRef]
- Carrier, M.; Auret, L.; Bridgwater, A.; Knoetze, J.H. Using Apparent Activation Energy as a Reactivity Criterion for Biomass Pyrolysis. Energy Fuels 2016, 30, 7834–7841. [Google Scholar] [CrossRef] [Green Version]


| Decomposition Class | Bulk Density, g cm−3 | Water Content, % | Carbon | Nitrogen, % | C:N | |
|---|---|---|---|---|---|---|
| % | δ13Cwood, ‰ | |||||
| Larch | ||||||
| DC I | 0.392 (0.018) | 41.8 (11.9) | 47.6 (0.14) | −26.4 (1.48) | 0.060 (0.008) | 819 (108.0) |
| DC II | 0.396 (0.019) | 29.4 (10.2) | 47.8 (0.25) | −24.8 (0.33) | 0.092 (0.008) | 564 (66.9) |
| DC III w | 0.204 (0.031) | 46.7 (25.5) | 47.2 (0.19) | −25.3 (0.30) | 0.267 (0.116) | 201 (57.6) |
| DC III b | 0.291 (0.014) | 99.4 (48.0) | 49.5 (0.54) | −26.6 (0.40) | 0.235 (0.061) | 229 (53.5) |
| Birch | ||||||
| DC I | 0.449 (0.015) | 117.6 (4.5) | 47.5 (0.28) | −26.7 (0.43) | 0.157 (0.041) | 322 (69.1) |
| DC II | 0.373 (0.020) | 163.7 (38.9) | 47.4 (0.19) | −27.2 (0.26) | 0.109 (0.007) | 436 (30.8) |
| DC III | 0.159 (0.014) | 449.9 (79.7) | 47.2 (0.97) | −27.1 (0.17) | 0.348 (0.067) | 141 (22.9) |
Publisher’s Note: MDPI stays neutral with regard to jurisdictional claims in published maps and institutional affiliations. |
© 2021 by the authors. Licensee MDPI, Basel, Switzerland. This article is an open access article distributed under the terms and conditions of the Creative Commons Attribution (CC BY) license (https://creativecommons.org/licenses/by/4.0/).
Share and Cite
Mukhortova, L.; Pashenova, N.; Meteleva, M.; Krivobokov, L.; Guggenberger, G. Temperature Sensitivity of CO2 and CH4 Fluxes from Coarse Woody Debris in Northern Boreal Forests. Forests 2021, 12, 624. https://0-doi-org.brum.beds.ac.uk/10.3390/f12050624
Mukhortova L, Pashenova N, Meteleva M, Krivobokov L, Guggenberger G. Temperature Sensitivity of CO2 and CH4 Fluxes from Coarse Woody Debris in Northern Boreal Forests. Forests. 2021; 12(5):624. https://0-doi-org.brum.beds.ac.uk/10.3390/f12050624
Chicago/Turabian StyleMukhortova, Liudmila, Natalia Pashenova, Maria Meteleva, Leonid Krivobokov, and Georg Guggenberger. 2021. "Temperature Sensitivity of CO2 and CH4 Fluxes from Coarse Woody Debris in Northern Boreal Forests" Forests 12, no. 5: 624. https://0-doi-org.brum.beds.ac.uk/10.3390/f12050624