
Asynchrony and Time-Lag between Primary and Secondary Growth of Norway Spruce Growing in Different Elevations


1
Department of Forest Ecology, Mendel University in Brno, Zemědělská 3, 613 00 Brno, Czech Republic
2
Global Change Research Institute CAS, Bělidla 986/4a, 603 00 Brno, Czech Republic
*
Author to whom correspondence should be addressed.
Forests 2021, 12(5), 627; https://0-doi-org.brum.beds.ac.uk/10.3390/f12050627
Submission received: 7 April 2021
/
Revised: 7 May 2021
/
Accepted: 12 May 2021
/
Published: 14 May 2021
(This article belongs to the Section Forest Inventory, Modeling and Remote Sensing)
Abstract
:Norway spruce is one of the most economically important coniferous species in Europe, but it has faced high mortality rates in the last few decades due to the increasing frequency of extreme weather events. Primary and secondary growth development may be affected by these non-optimal conditions. In this study, we aimed to analyze the timing, possible asynchrony and time-lag between the growth processes of Norway spruce. We used a novel methodological approach of primary (based on phenocamera picture evaluation) and secondary (dendrometers) growth detection. The combination of these novel approaches allowed us to compare these growth process in high temporal resolution. Measurements were performed in two experimental plots with contrasting climatic conditions (middle and higher elevations) in the years 2016–2019, during the presence of extreme climatic conditions. We demonstrated a significant elongation of the growing season, with a more pronounced effect at higher elevation. Compared to the long-term mean, we observed an additional 50 days with a temperature above 15 °C at the higher elevation plot. There were no found patterns in the time-shift of both growth processes between plots. On the other hand we observed asynchrony of radial growth and meristems growth. Radial growth began earlier than the phenology of apical meristems growth. The onset, end and duration of meristem growth differed between studied plots and years as well. The onset of radial growth did not follow the gradient of microclimatic parameters; however, the differences in climatic conditions between plots did cause a shift in the onset of meristem growth. The process of the radial growth was twice as long as for apical meristem development. On average, radial growth requires 71 days more than meristem phenology to reach full process completion. Our data confirmed that these growth processes are strongly affected by external weather conditions and the duration of the growing season. More advanced and detailed monitoring of these processes can provide more accurate data of the health status of trees in the forest.
Keywords:
Picea abies [L.] Karts; elongation; growth rate; growing season; dendrometer; shoots; phenocamera1. Introduction
Despite the fact that primary (e.g., shoots) and secondary (e.g., xylem and phloem formation) growth are important for global carbon capture [1], we have limited knowledge about the timing and duration of these processes. Forests cover more than 40% of Europe’s land area, which means a huge carbon sink in tree biomass [2]. Norway spruce (Picea abies [L.] Karst.) grows in many European countries. Due to the species’ economic importance in the Czech Republic, and across Europe [3], it is the predominant tree species and accounts for half of the country’s total forest area. In contrast, the naturally occurring proportion of this species is estimated to be only 11% [4].
Forest production is constrained by water availability and decreasing annual precipitation or changes in inter and intra-annual distribution are likely to result in stronger water limitations. Production decreases at lower elevations vulnerable to water stress and increases where the increased evaporative demand under the elevated temperature is balanced by an increase in precipitation. Impacts on individual species depending on the site conditions and regional climatic changes [5].
In recent decades, forest ecosystems in the Czech Republic and all over the world have faced the effects of a changing climate. Due to increased air temperature, unequal distribution of precipitation [6] and disturbances caused by bark beetle (Ips typographus [L.]) attacks, tree mortality has become more frequent [7]. Changes in growth [8], drought-induced mortality [9], increases in temperature, changes in precipitation distribution and rapid increases in climatic extremes have already been observed [10]. These stressors have different impacts on forests, and responses to climate change can differ across latitudinal and altitudinal gradients [11]. Trees in the temperate zone are adapted to the seasonal cycle, with a dormancy period during the winter and a growing season (GS) during the summer [12]. Many recent studies have reported on earlier spring events [13] and changes in the timing of onset, length, and end of the GS as manifestations of climate change [12,13]. However, it is still unclear exactly when primary and secondary growth take place and how simultaneously these processes occur. Knowledge about the timing of these processes is essential in understanding the consequences of advancing global change.
Investigations into primary and secondary growth in co-occurring species will aid in the assessment of the physiological adaptation of species and the prediction of forest stand structure dynamics. Primary (e.g., budburst, needle, and shoot) growth and secondary growth (e.g., cambial activity and xylem differentiation) of plants play a vital role in long-term carbon sequestration in terrestrial ecosystems [14,15]. Based on empirical phenological observations, earlier bud burst, leafing, shooting, and flowering have been recorded for these sequential phases because of the recent early spring warming and extended growing season length [16]. Studies on secondary growth have revealed an early onset of cambium activity, as well as a longer duration of xylem formation, and this has often been related to the influences of ongoing climate change [17,18]. Therefore, investigations into primary and secondary growth help to assess the physiological adaptation of species to the local environment [19] and predict changes in the growing season under current global warming [20].
Traditional ground-based observations are typically made on a limited number of individual species, across a limited geographic area. Instead, phenocameras (or digital photography) are widely used to monitor bud phenology or primary growth itself as they provide information with high temporal and spatial resolutions [21,22]. Frequent, stable, and accurate phenological observations can be recorded for the whole canopy or for specific features by means of time-lapse digital phenocameras mounted on towers above the forest. Anomalies such as plant damage caused by frost or drought and second flowerings can be easily detected by phenocameras [21,23,24]. Secondary growth of the stem is often monitored by another method—automatic dendrometers. The automatic dendrometer is a valuable tool allowing stem diameter variation (SDV) measurement in high-frequency record [25,26]. Continuous monitoring of SDV provides valuable information about the production of new cells [27], tree water status [28] and the timing of these processes [26].
There is considerable overlap between growth processes, so the development of one process can limit the development of others occurring simultaneously. Furthermore, the climate and its variations can modify these interactions [29]. Such findings highlight the need to know the precise timing of development of each current-year shoot component, stem radial increment and the interactions among them. However, the links between primary and secondary growth have only been explored to a limited degree in plant and forest ecology, despite these growth types being fundamental for the understanding of the development and persistence of trees.
There are still only a few ecological studies that focus on explaining the relationships between primary and secondary growth at different altitudes. The objective of this study was to assess two even-aged stands of exclusively Norway spruce at different altitudes and along a gradients of key microclimatic characteristics. The aims of this study were to evaluate: (1) the timing of primary and secondary growth (i.e., onset, end and duration) at different localities and in different years with maximal and minimal growth rate; (2) the synchrony or asynchrony between primary and secondary growth; and (3) the assessment of inter/intra annual weather condition and the length of the growing season. We expected one of three alternative tree responses. In the first, the primary and secondary growth occur at the same time (i.e., onset, end and duration coincide). In the second, primary growth precedes the secondary or vice versa. Finally, there is an asynchrony and time-lag between primary (Pgrowth) and secondary growth (Sgrowth).
2. Materials and Methods
2.1. Experimental Study Plots
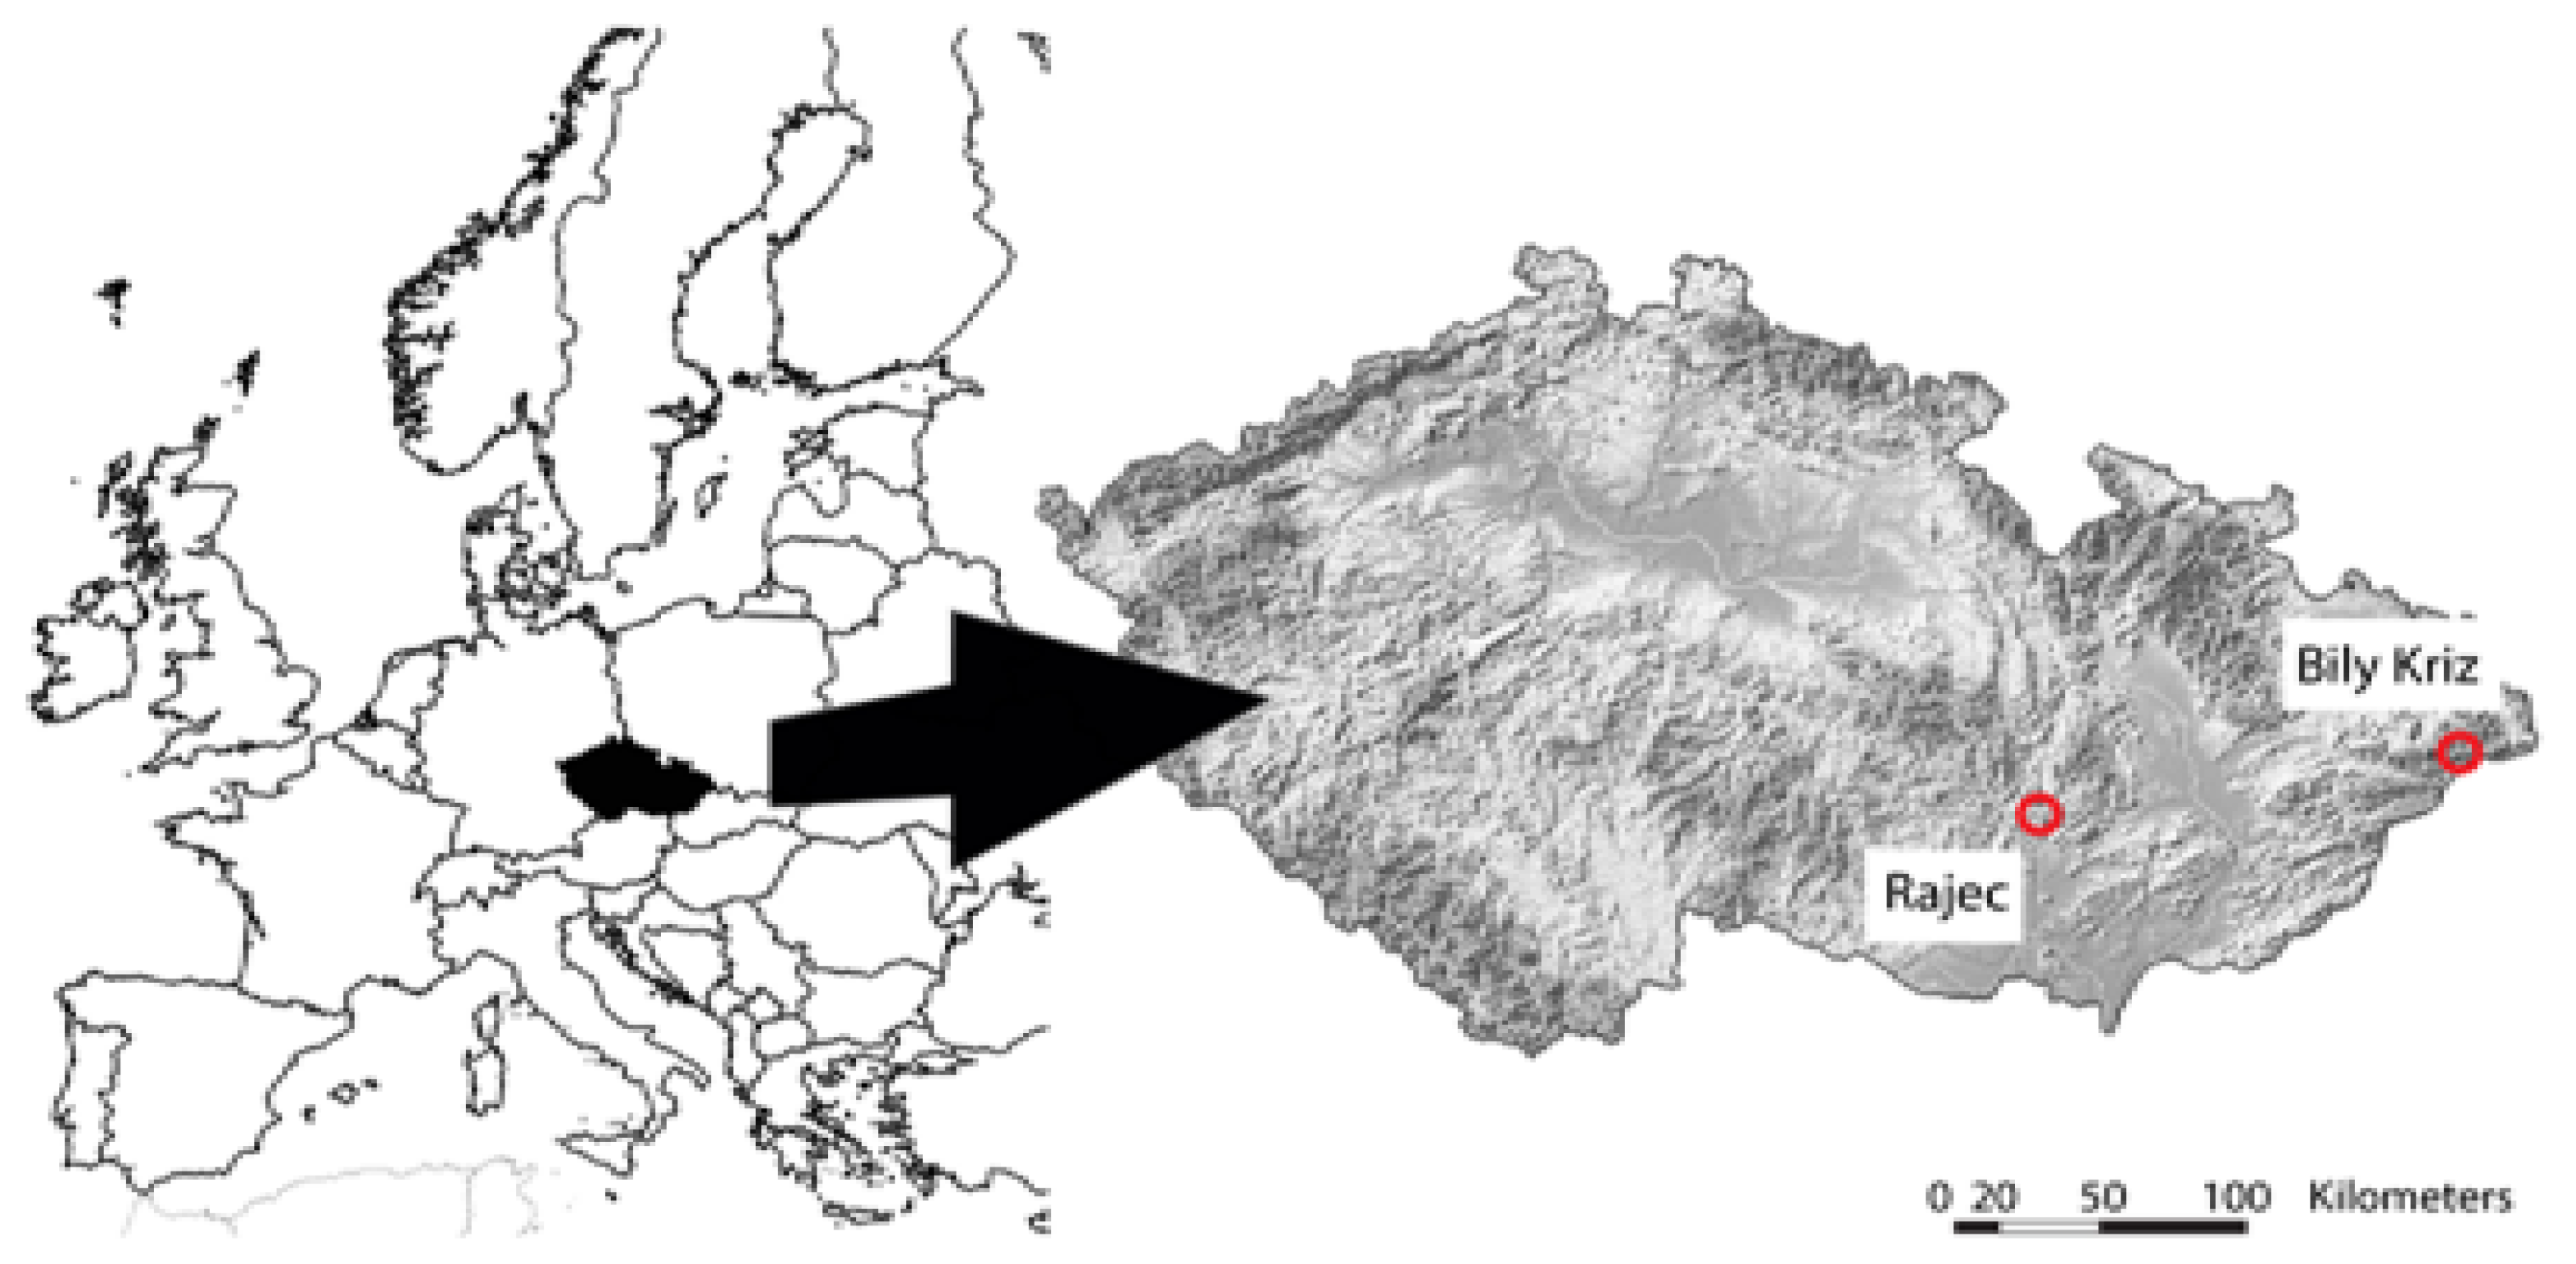
Our study was conducted in even-aged pure monocultures of Norway spruce (Picea abies [L.] Karst.), located at the experimental study plots (ESP) in Rajec (the Drahanska vrchovina Highland, the Czech Republic) and in Bily Kriz (the Moravian-Silesian Beskids Mts., the Czech Republic), (Figure 1). The measurement was conducted from 2016 to 2019, during the occurrence of extreme climatic conditions. The age of both stands was 40–44 years at the start of the observation period. The Rajec plot is situated at 625 m.a.s.l.; the geographical position is 49°26′37″ N, 16°41′48″ E. The region is characterized by a moderate climate [30]. According to long-term measurements (LTM) from 1961 to 2010, the mean annual air temperature is 7.0 °C and the mean annual sum of precipitation is 663 mm. The Bily Kriz plot is situated at 890 m.a.s.l.; the geographical position is 49°30′07″ N, 18°32′12″ E. The region is characterized by a cold climate [30]. The mean annual air temperature is 5.6 °C and the mean annual sum of precipitation is 1217 mm. Detailed descriptions of the ESPs are provided in Pokorny et al. [31].
2.2. Micrometeorological Conditions
The microclimatic characteristics were measured by specific sensors installed on the meteorological tower located in the stands. The air temperature (Ta) and relative air humidity (RH) were measured by EMS 33 sensors (EMS Brno, the Czech Republic) placed 2 m above the forest floor. Precipitation (P) was measured by a 386C rain gauge (MetOne, Washington, OR, USA) situated above the forest canopy on the meteorological tower. Vapor pressure deficit (VPD) was calculated from Ta and RH measured at each ESP. Measured data were compared with long-term measurements (1961–2010) from the nearby Czech Hydrometeorological Institute (CHMI) stations. We used daily averages of Ta to identify parts of the growing seasons (GS). Parts of the GS were defined as follows: average daily Ta above 5 °C as the growing season (GS5°C); above 10 °C as the main growing season (GS10°C); and above 15 °C as the vegetation summer (GS15°C). The onset or end of the GS were assigned to the first (or last) day of the continuous five-day period with average daily Ta above (or below) the respective temperature baseline threshold [32].
2.3. Primary Growth
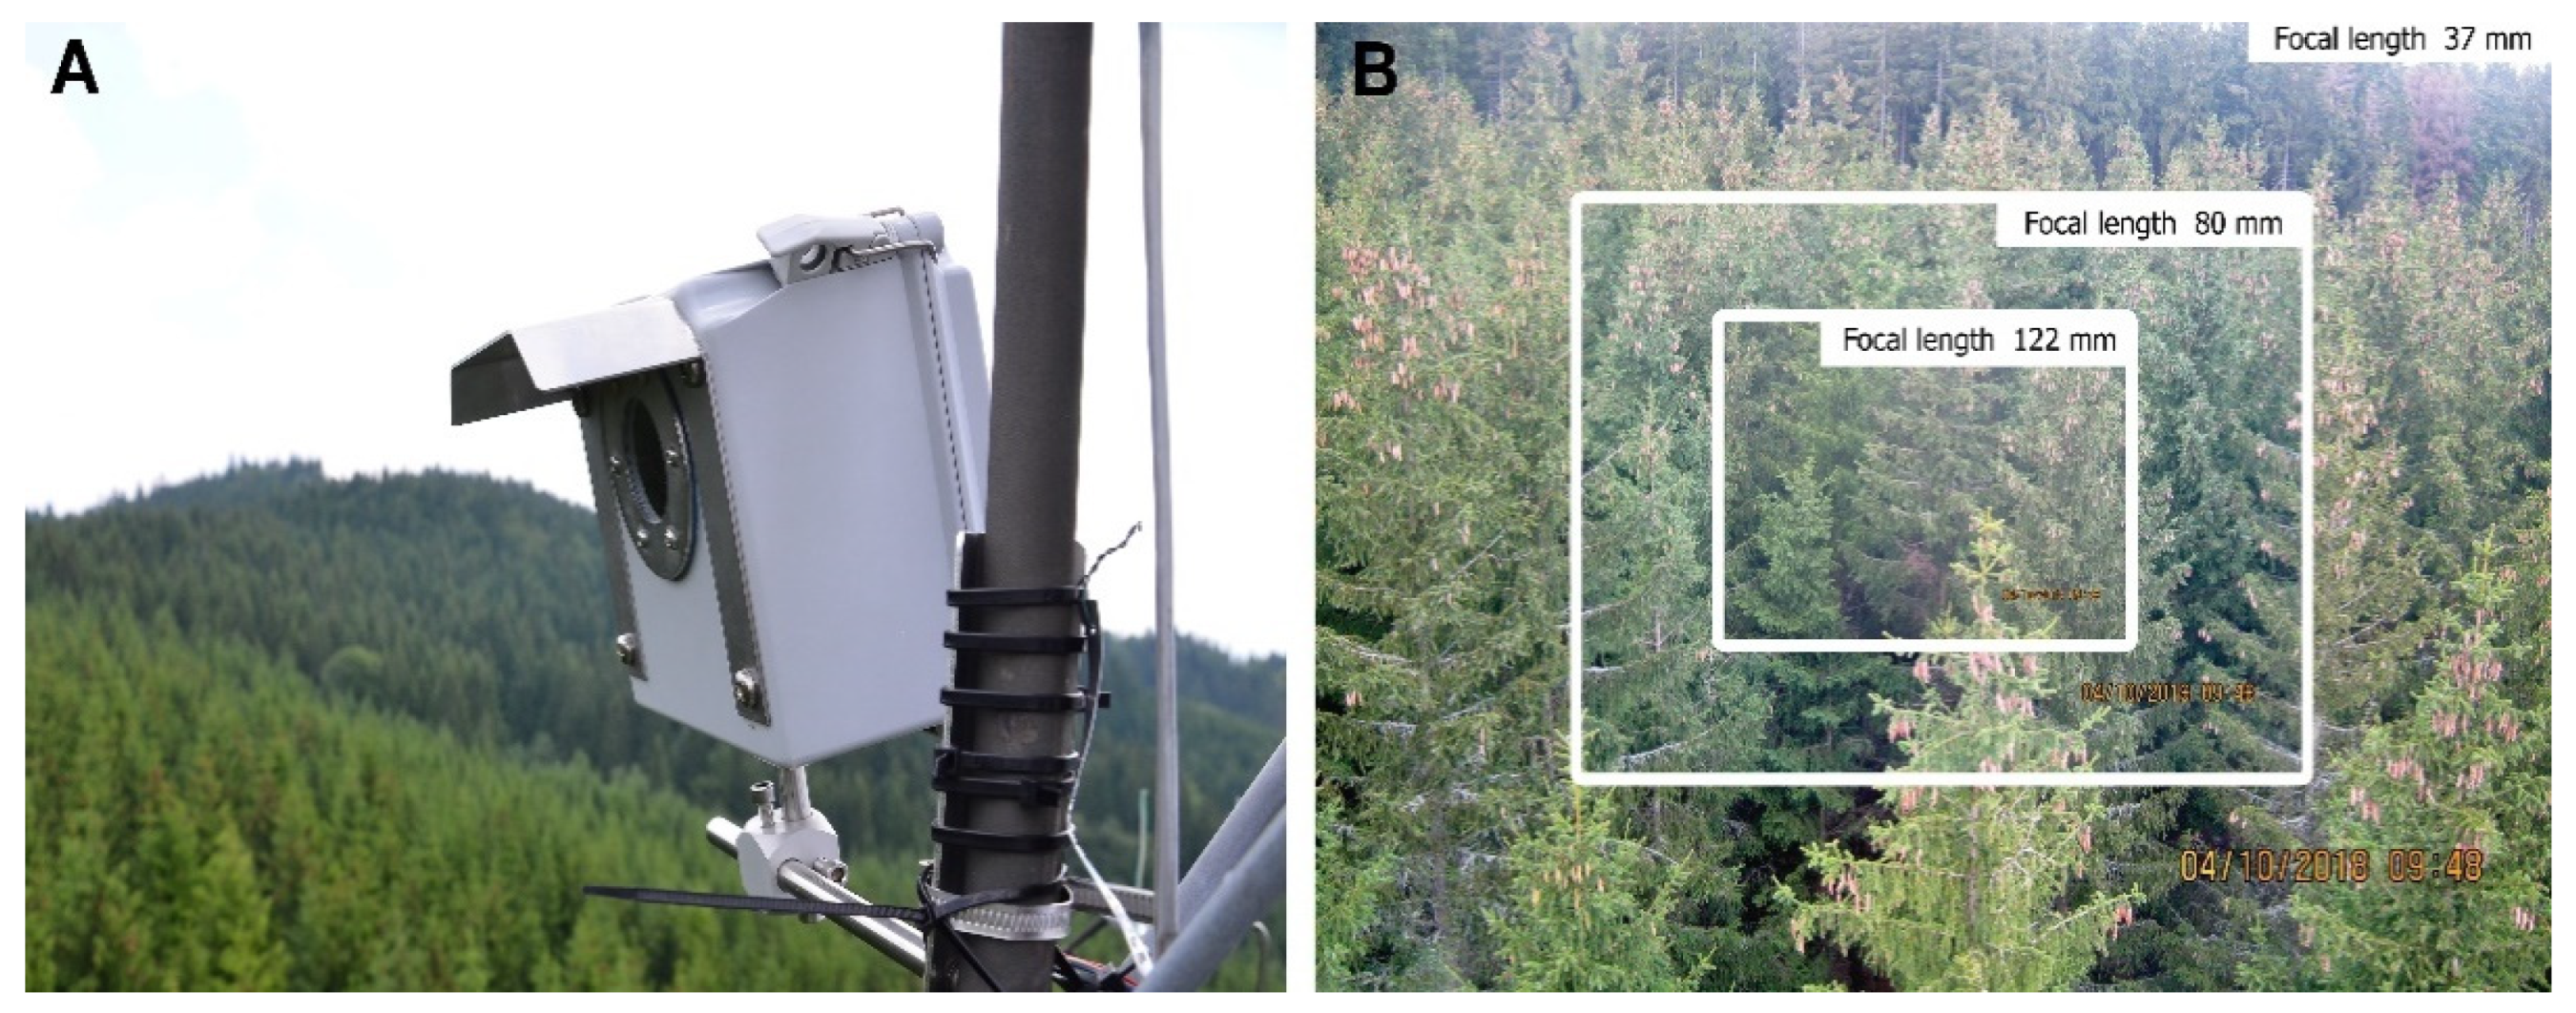
The dynamic of development of the Pgrowth was monitored by phenocameras, model PhenoCam EMS 800 (EMS Brno, the Czech Republic). The phenocameras were fixed on the top of the meteorological tower (Figure 2A). Images were taken daily, every hour between 10 a.m. and 3 p.m. during the GS. The images were captured by a CCD sensor and saved at maximum resolution (3648 × 2736 pixels) in JPEG format. Three different degrees of zoom (focal length 37, 80 and 122 mm) were captured at the same time (Figure 2B). The cameras were set to a fixed white balance regime with automatic exposure measuring. For the analysis of onset, end and duration of Pgrowth, two rules were used. The first was that only the closest trees in view angle camera were considered. The second was using the optimal distance from camera for sufficient resolution for pixel analysis. Five trees fulfilling these rules were selected at each ESP.
For post-processing of the captured images, ImageJ software was used [33]. The terminal shoot length of each selected tree was measured in pixels from the photo, where the climatic condition allowed good visibility for cameras. According to pixel analysis of shoot length, the Pgrowth for each tree was calculated in relative scale (0–100). Onset and end of Pgrowth was defined by pixel measurement. According to year mean height increment of trees at study plots, the mean resolution of Pgrowth measurements was 2 mm. Daily measured data of Pgrowth were fitted by the non-decreasing function to eliminate negative changes. When we measured some daily values of shoot length lower than the previous record, the first not lower value is connected by the line with the next daily higher value (linear growth concept used for dendrometer data [26]). The concept assumes linear growth over the period when some lower values occur. The onset and end of Pgrowth were derived from non-decreasing fit, and threshold values of 5% and 95% of annual Pgrowth were applied.
2.4. Secondary Growth
The same trees were used for Sgrowth observations. These were selected from dominant or co-dominant tree classes; these tree classes were most dominant on the phenocamera’s picture where Pgrowth analysis was performed. Stem diameter variation was measured at approximately 1.3 m height aboveground by automatic band dendrometers DRL26C (EMS Brno, the Czech Republic) with 1 µm resolution; the measuring and storing intervals were 1 h. Changes in the circumference of the tree were recalculated to changes in stem radial increment (SRI, µm). Stem diameter variation contains two components: (1) irreversible stem diameter growth, including cell division and cell enlargement, and (2) water-related processes driven by tree water potential gradient. The zero-growth concept [26] was used to separate irreversible growth from stem diameter variation. The rate of SRI was calculated from separated irreversible growth only with daily resolution. The onset and end of Sgrowth were derived from the irreversible growth function, and threshold values of 5% and 95% of annual Sgrowth were used.
2.5. Statistical Analysis
3. Results
3.1. Variation of Climatic Conditions and GS Prolongation
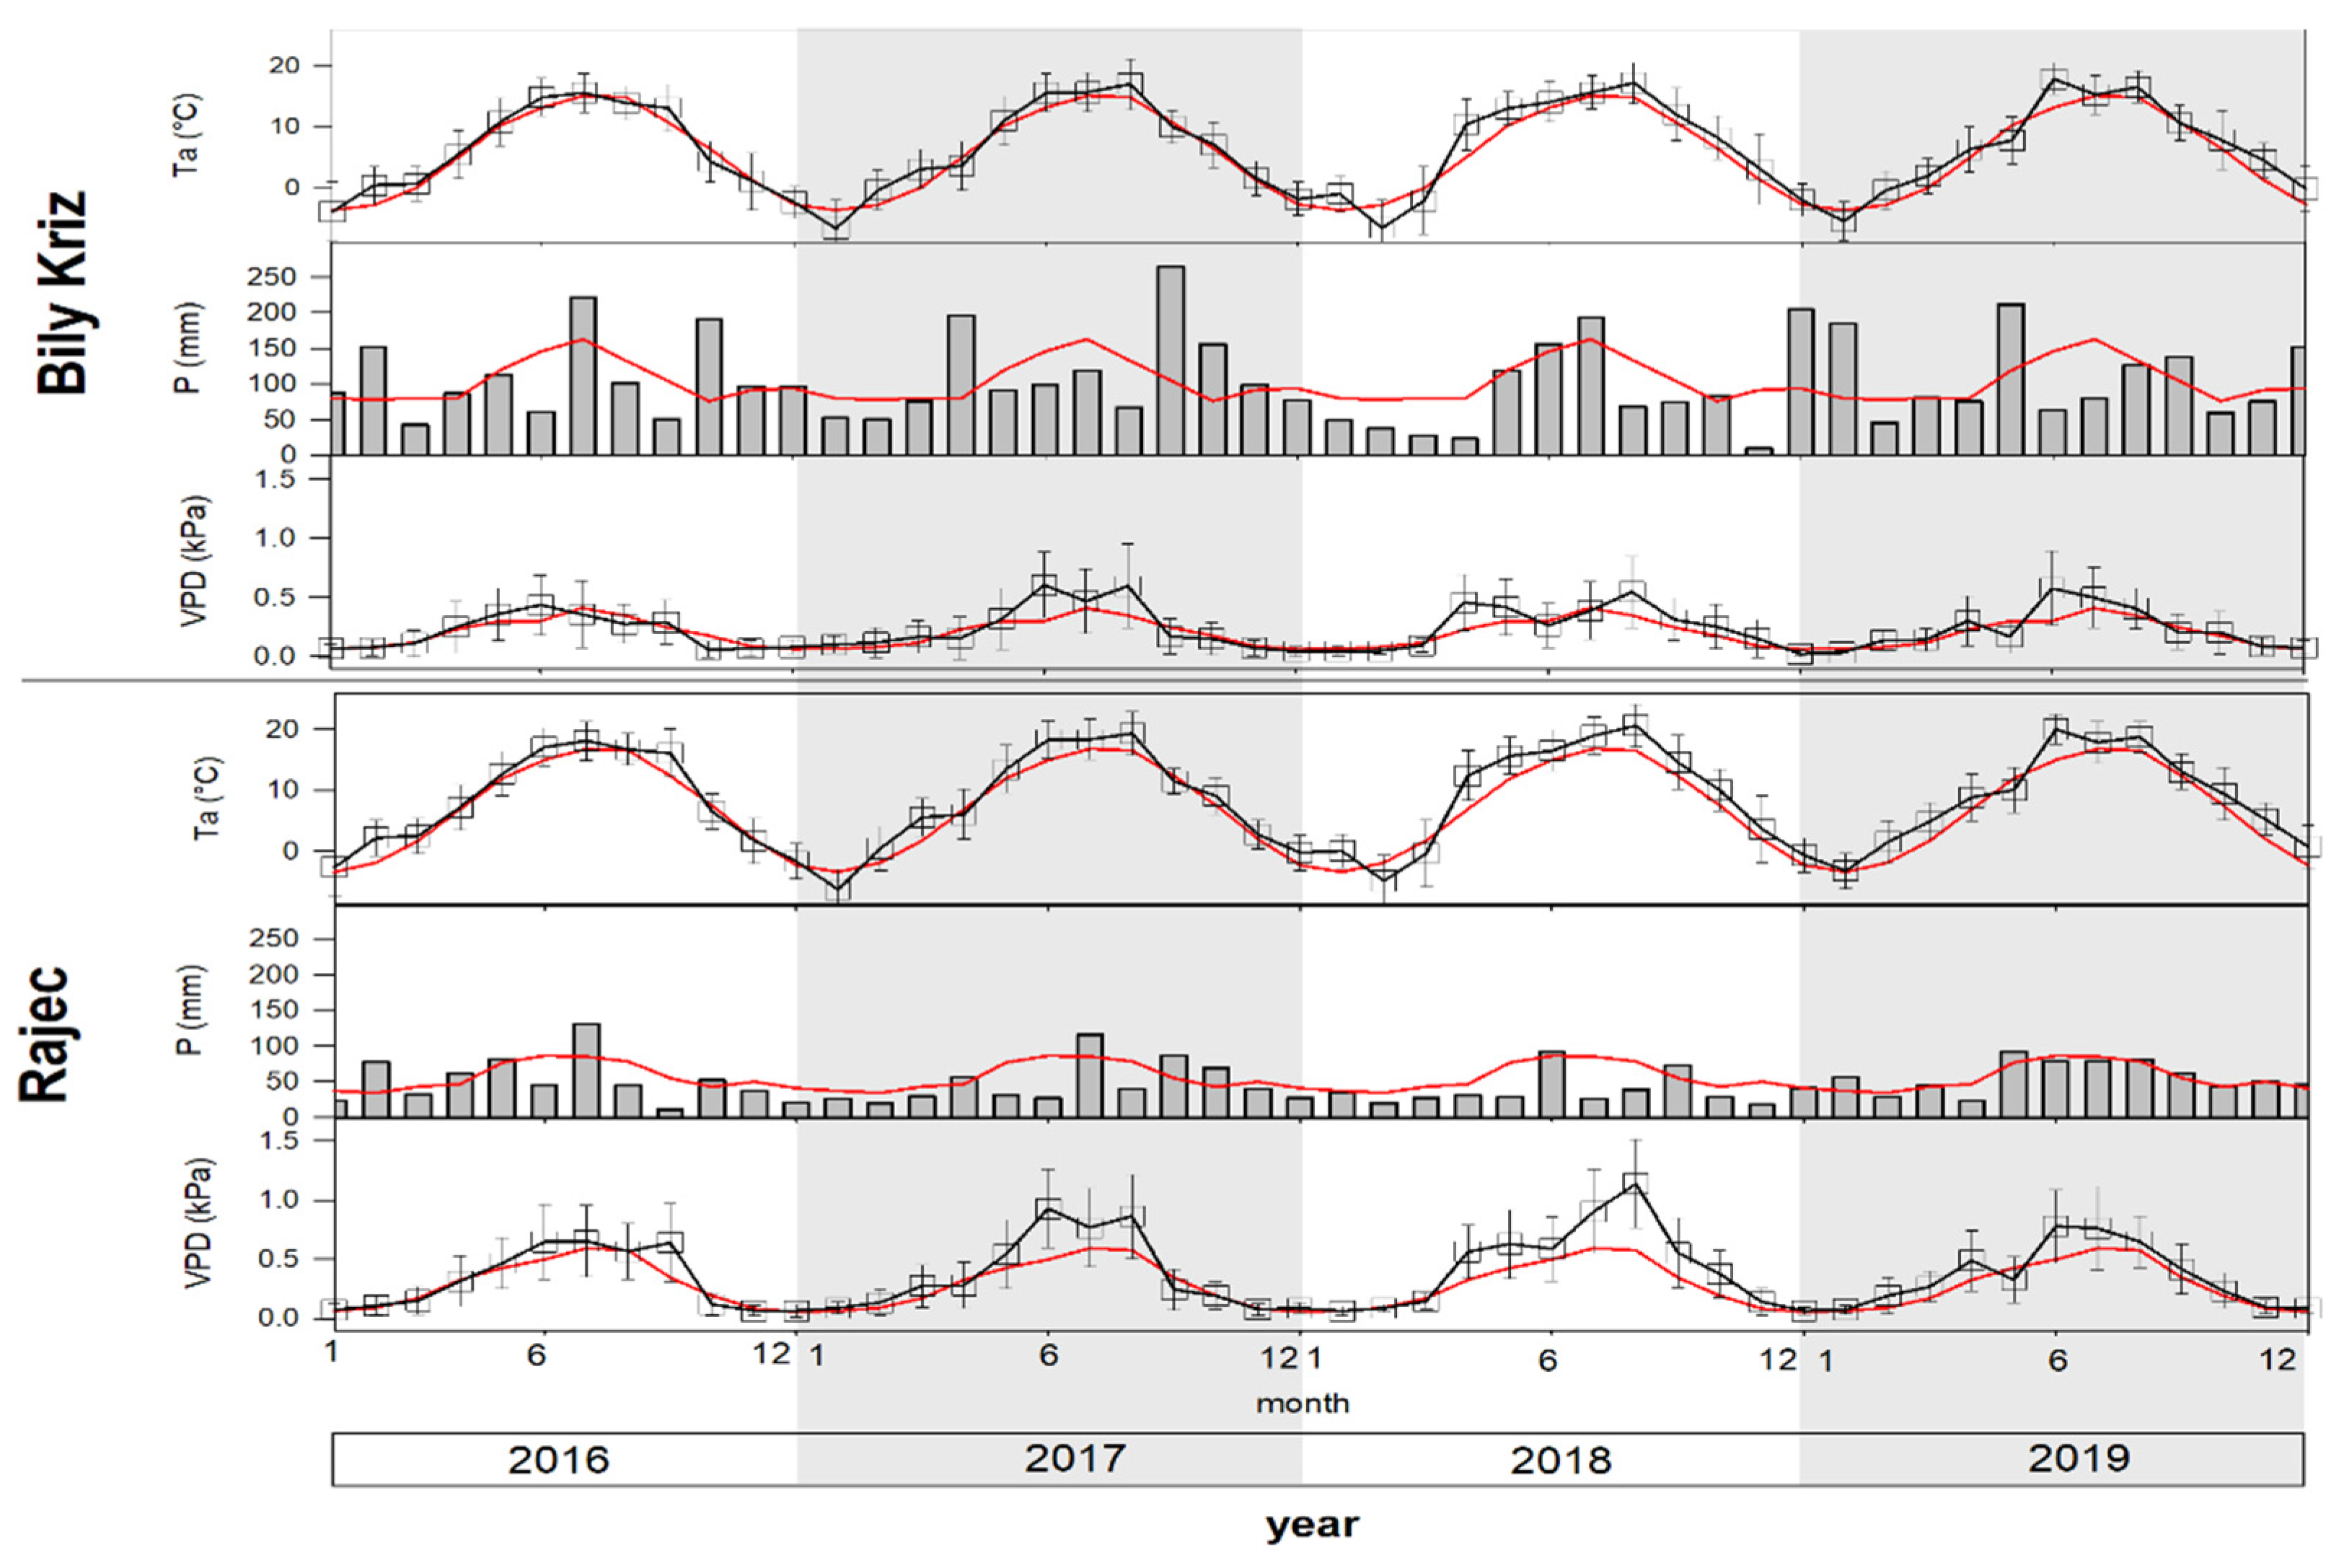
For all measured climatic conditions, significant shifts were found between studied plots in the years 2016–2019 and LTM (1961–2010). The average annual air temperature of 8.6°C at Rajec (+1.6 °C compared to LTM) was significantly higher than the average of 6.5°C at Bily Kriz (+0.9 °C compared to LTM). Almost two thirds of all observed months had a temperature deviation more than +0.5 °C for both study plots. The coldest month was January 2017, with an average monthly temperature of −6.3 °C in Rajec and −6.8 °C in Bily Kriz; the hottest month was July 2018 (20.6 °C and 17.2 °C, respectively). The highest average monthly temperature deviation was observed in April 2018, with +5.5 °C of LTM in Rajec and +5.4 °C of LTM in Bily Kriz. The average temperature during GS5°C (April–October) was +1.7 °C of LTM in Rajec and +1.0 °C in Bily Kriz (Table 1).
The average annual sum of precipitation was 582.4 mm in Rajec (78% of LTM) and 1245.1 mm in Bily Kriz (102% of LTM). More than 48% of all observed months had a monthly sum of precipitation less than 80% of LTM. The average annual sum of precipitation during GS was 88% of LTM in Rajec and 102% in Bily Kriz. The trend of VPD development was similar to previous parameters. We found a significant positive shift, especially in summer months.
According to LTM, 2018 was the most extreme year. Temperature deviation was 2.0 °C and the sum of precipitation achieved only 68% of LTM at the study plot Rajec (Table 1). Only 4 months of 2018 reached the normal monthly sum of precipitation. The VPD value achieved more than 1.0 kPa in Rajec. The Bily Kriz plot showed more favorable weather conditions during the extreme year, but also showed a lower sum of precipitation. On the other hand, 2016 had a similar temperature and precipitation regime compared to LTM (Table 1, Figure 3).
We observed a significant prolongation of the GS5°C at both ESPs during the study years of 2016–2019 compared to LTM. The average difference between ESPs in the duration of the parts of the GS was 20 days, due to the elevation gradient of more than 260 m. Bily Kriz, the station located at the higher elevation, showed a greater increase in the number of days with average daily temperature above 10 °C and 15 °C. The average (2016–2019) length of GS5°C was 211 days in Rajec and 194 days in Bily Kriz. GS10°C lasted 162 days and 135 days, respectively; GS15°C lasted 106 days and 90 days, respectively. The longest GS5°C occurred in 2018 at the Rajec plot (225 days) and in 2017 at the Bily Kriz plot (213 days). Compared to LTM, the length of the hottest time of the year GS15°C increased by 37 days in Rajec and by 54 days in Bily Kriz.
3.2. Primary Growth
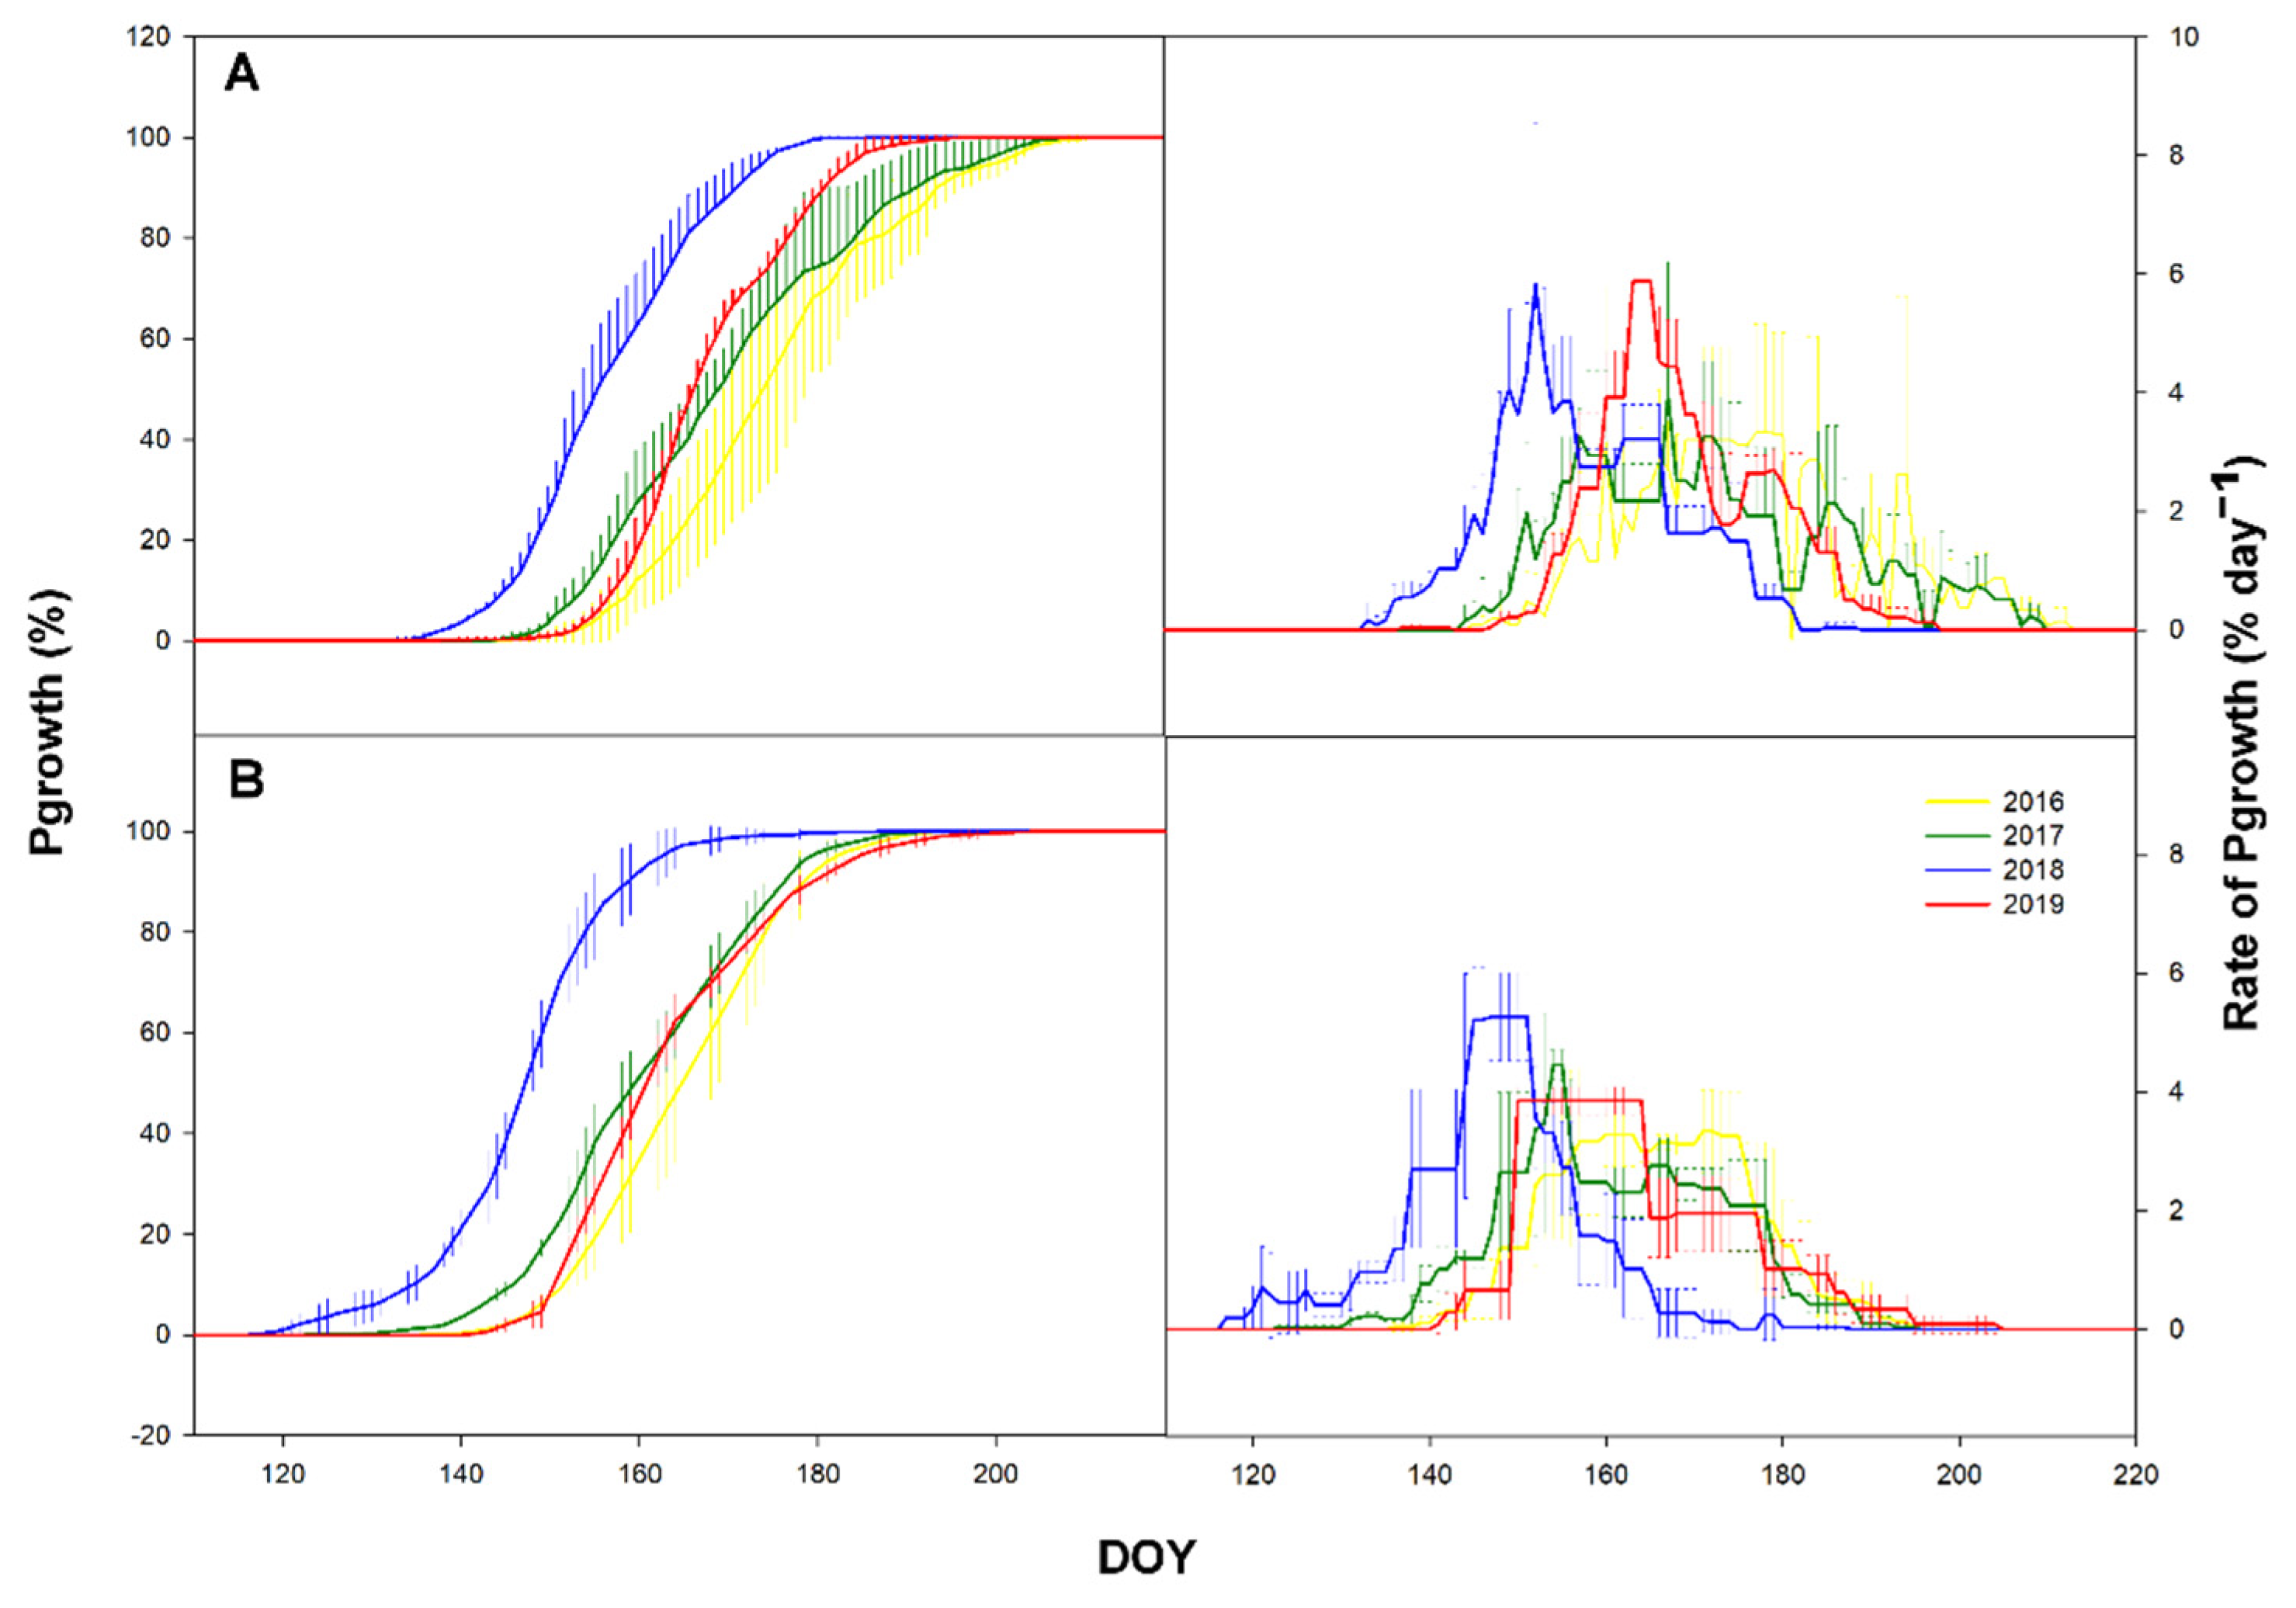
The onset and end of the Pgrowth differed significantly between study plots and years (p ≤ 0.001). In the case of Pgrowth duration, a significant difference was only observed between years (Table 2, Figure 4). Pgrowth in Bily Kriz was significantly delayed by approx. 20 days (Figure 4). The growth curve pattern showed a smooth sigmoidal curve with the start of Pgrowth in the range DOY 119–148 for Rajec and DOY 134–152 for Bily Kriz. The rate was similar between plots, but the plot in Rajec sustained longer periods with a higher rate of Pgrowth. The maximum rate was similar for both plots (Figure 4). The end of Pgrowth was in the range of DOY 164–205 for Rajec and DOY 183–210 in Bily Kriz. The whole period lasted about 55 days in both localities (Table 3).
3.3. Secondary Growth
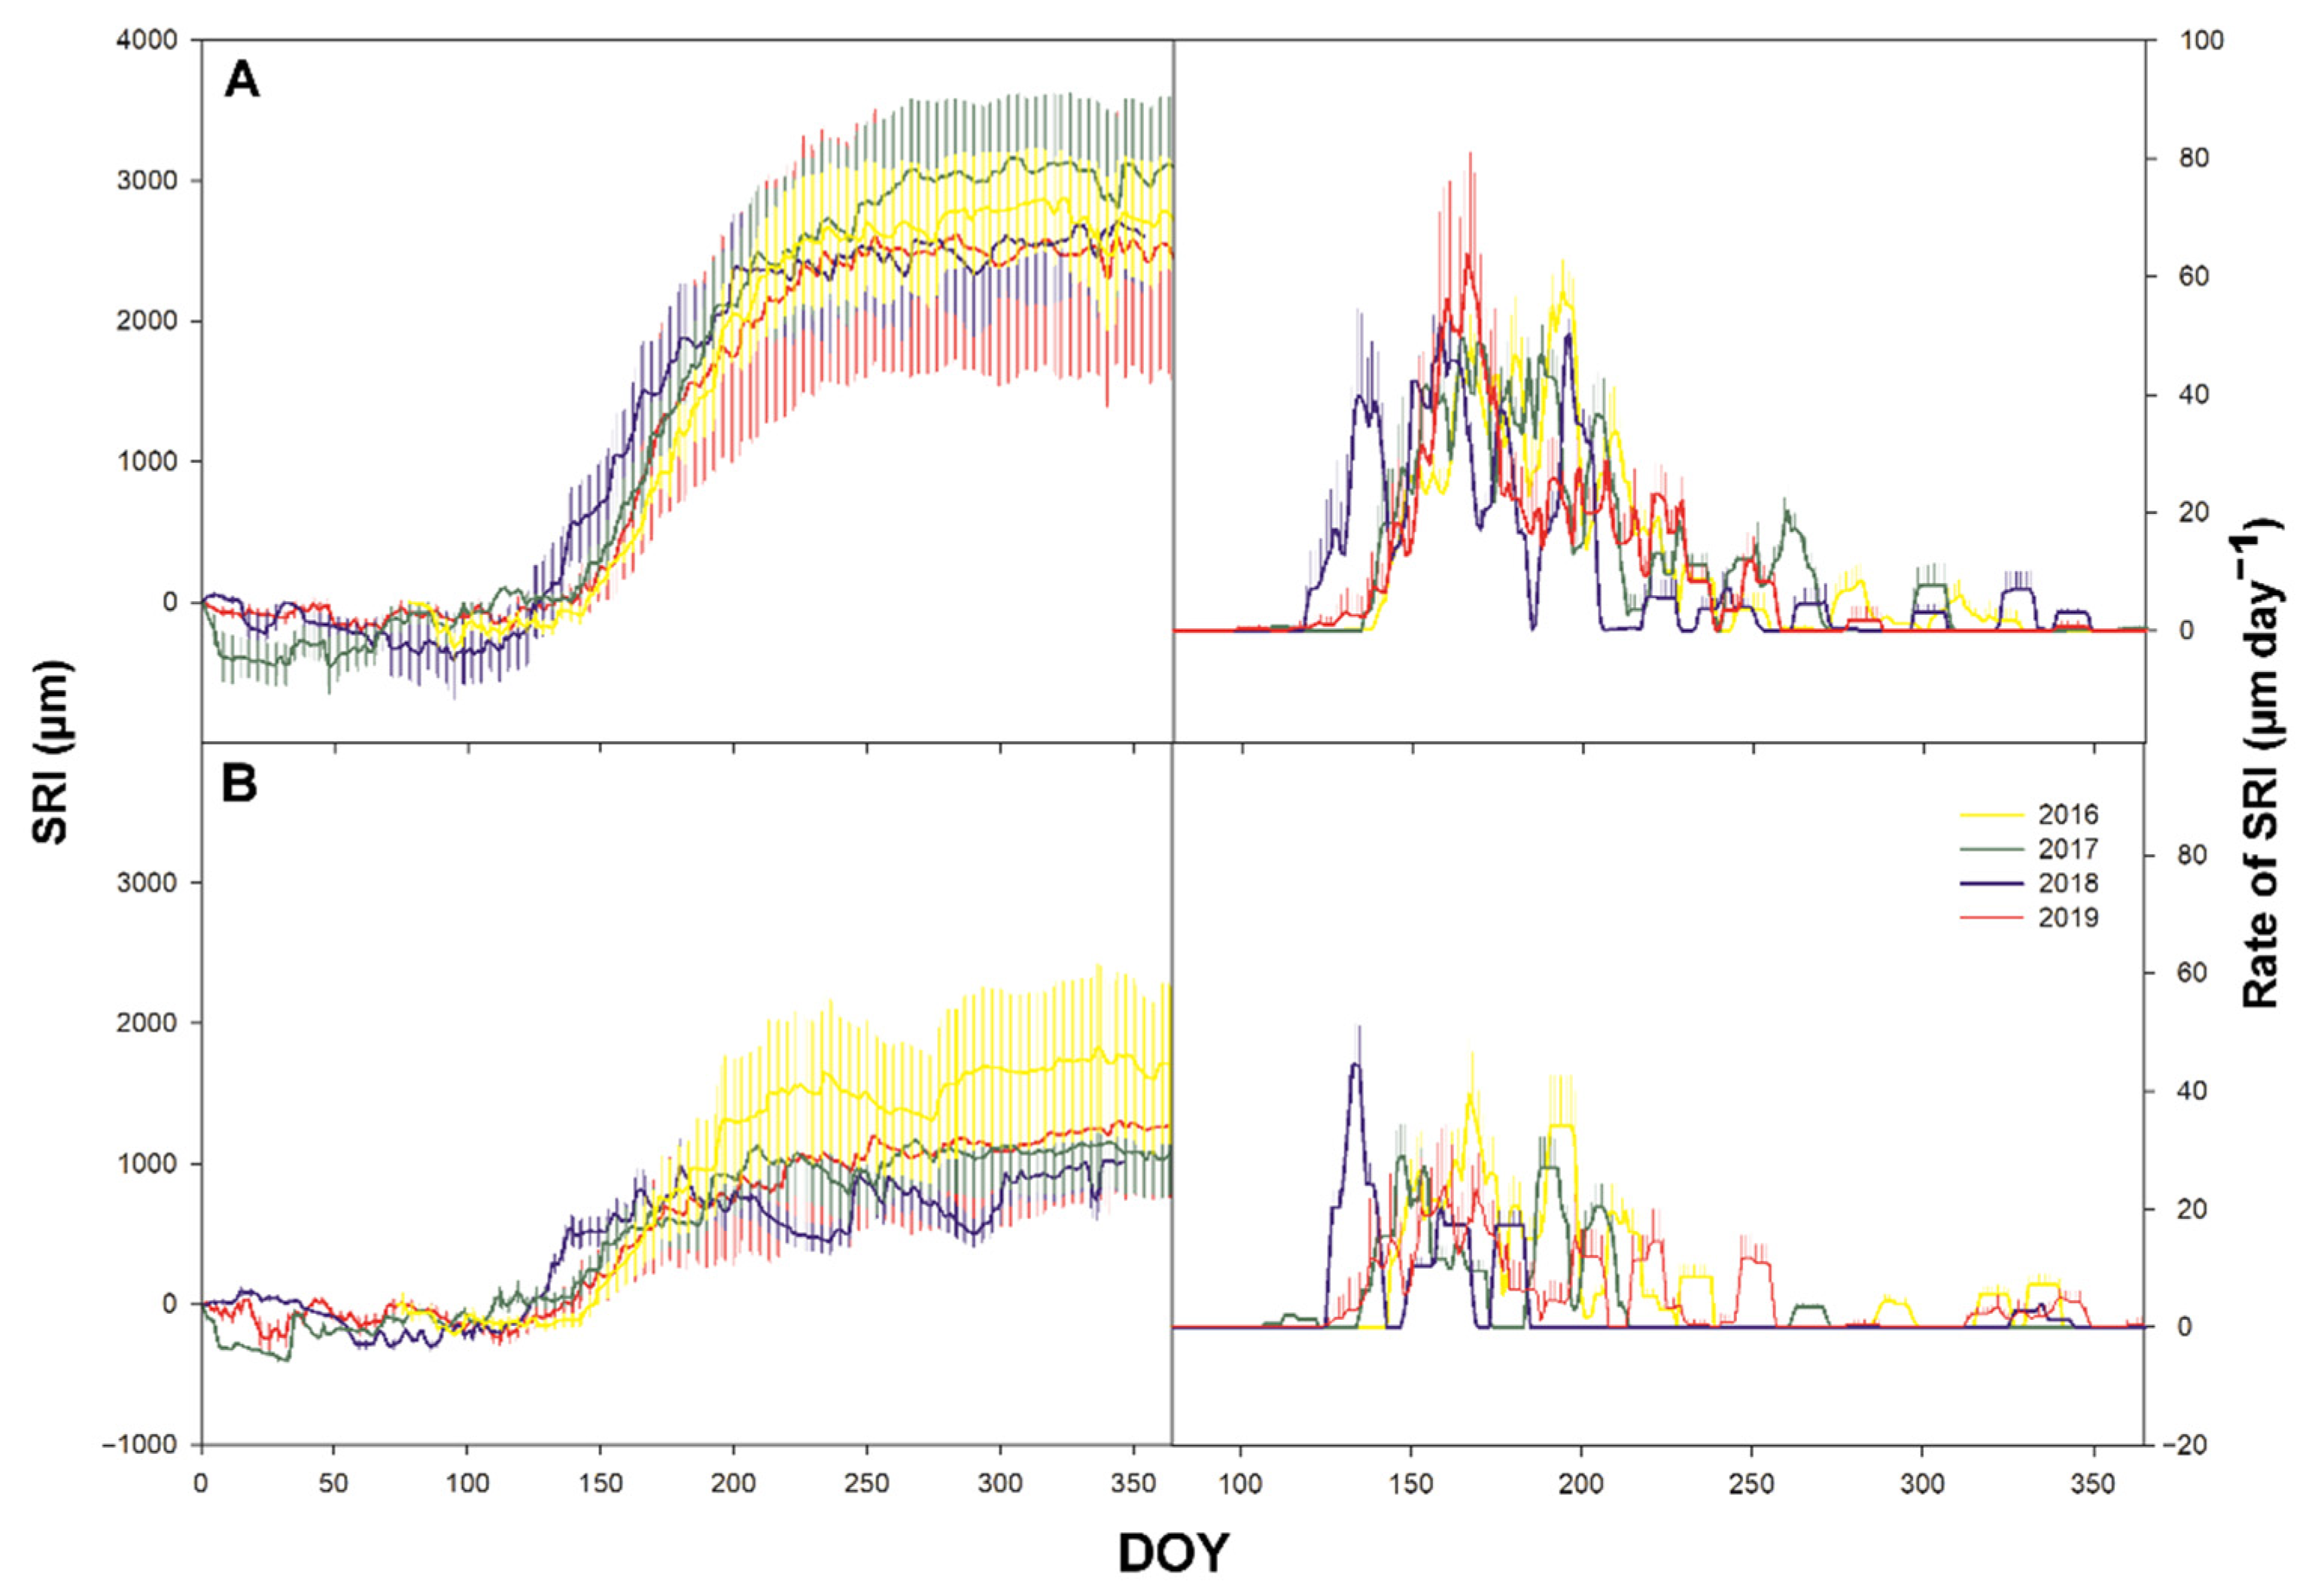
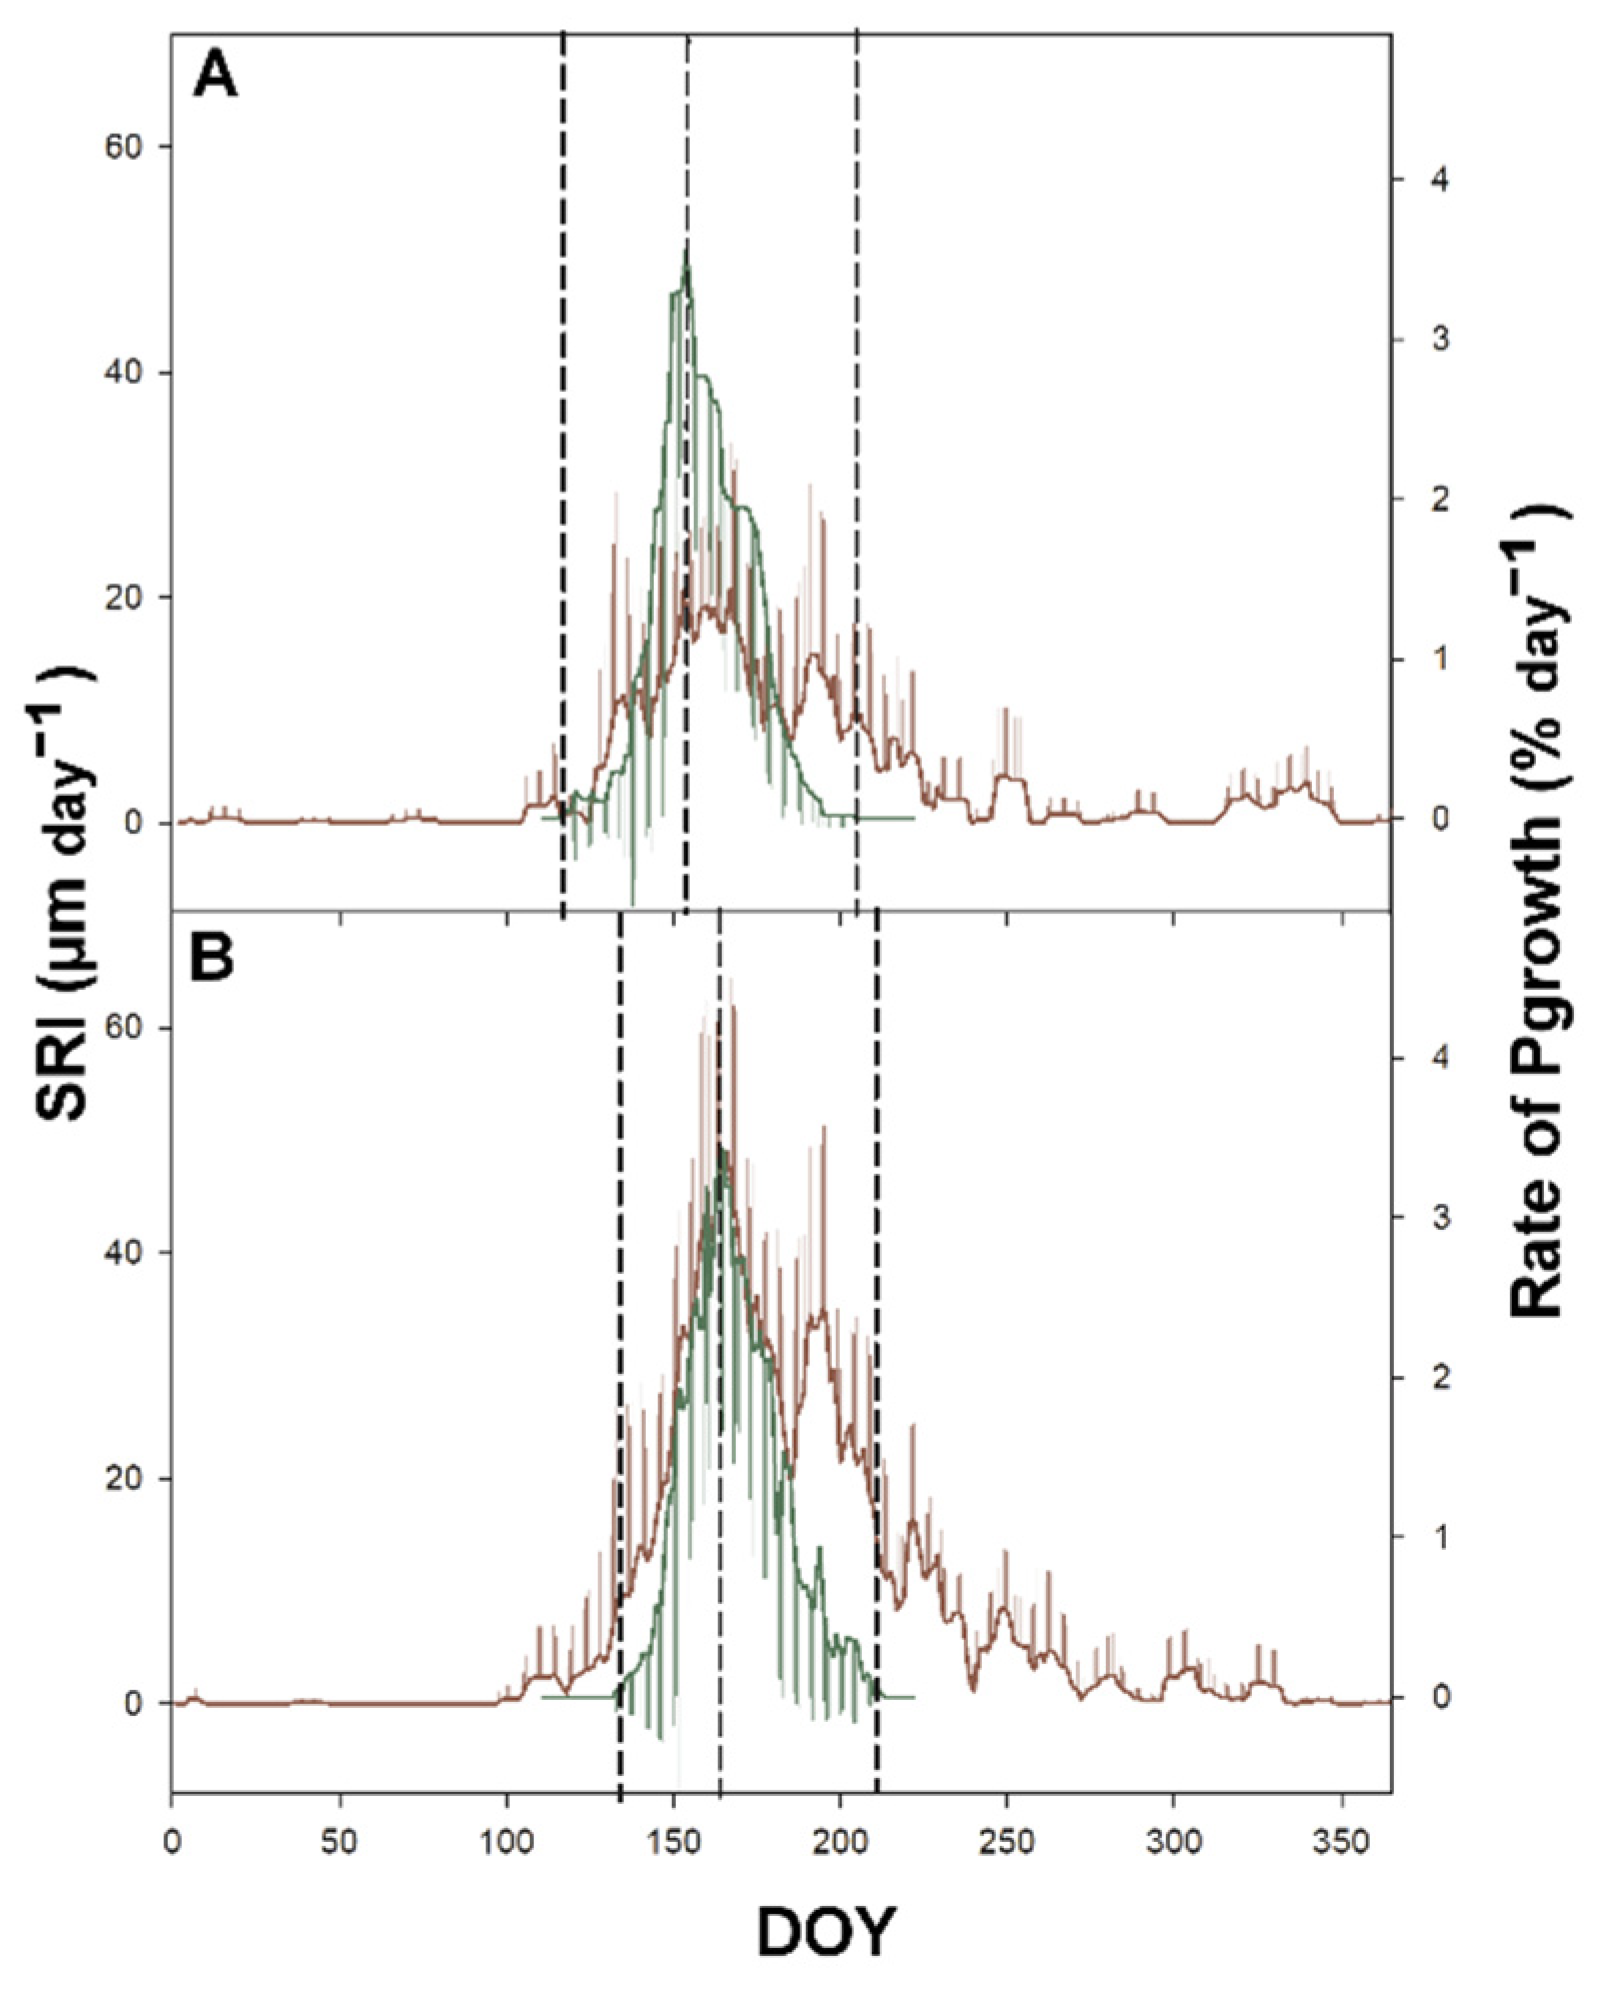
Sgrowth on the annual scale was significantly (p ≤ 0.001) higher in Bily Kriz compared with trees growing in Rajec (Figure 5). On average, the trees in Bily Kriz grew twice as much as those in Rajec. Markedly increased rates of SRI were also detected in Bily Kriz (Figure 5 and Figure 6). The timing of the highest rates of Pgrowth and Sgrowth occurred at the same part of the GS (Figure 7). While the growth curve pattern showed a smooth sigmoidal curve with only a small episode of stem shrinking in Bily Kriz, a completely different situation was observed in Rajec. There were long and intensive periods of stem shrinking. The most severe shrinking (>500 µm) was observed in the Rajec plot in 2018. The period of stem shrinking started at the end of August (DOY 180) and remained negative until the end of year. There was no growth detected after DOY 180.
There were no significant differences between individual years (p = 0.48), but a significant (p ≤ 0.001) difference between the onset of Sgrowth was observed between ESPs (Table 2). The onset of Sgrowth was significantly shifted to the earlier part of the GS in both ESPs in 2018. In general, there was a higher variability in the onset and especially in the termination of Sgrowth compared to Pgrowth. The difference between the earliest and the latest termination of Sgrowth was 163 days in Rajec, more than twice as long as observed in Bily Kriz. There were also no significant differences between the termination of Sgrowth in the two ESPs (Table 2), but there was a significant difference between individual years. The observed duration of the Sgrowth period was significantly different between the ESPs as well as between individual years (Table 2, Figure 7).
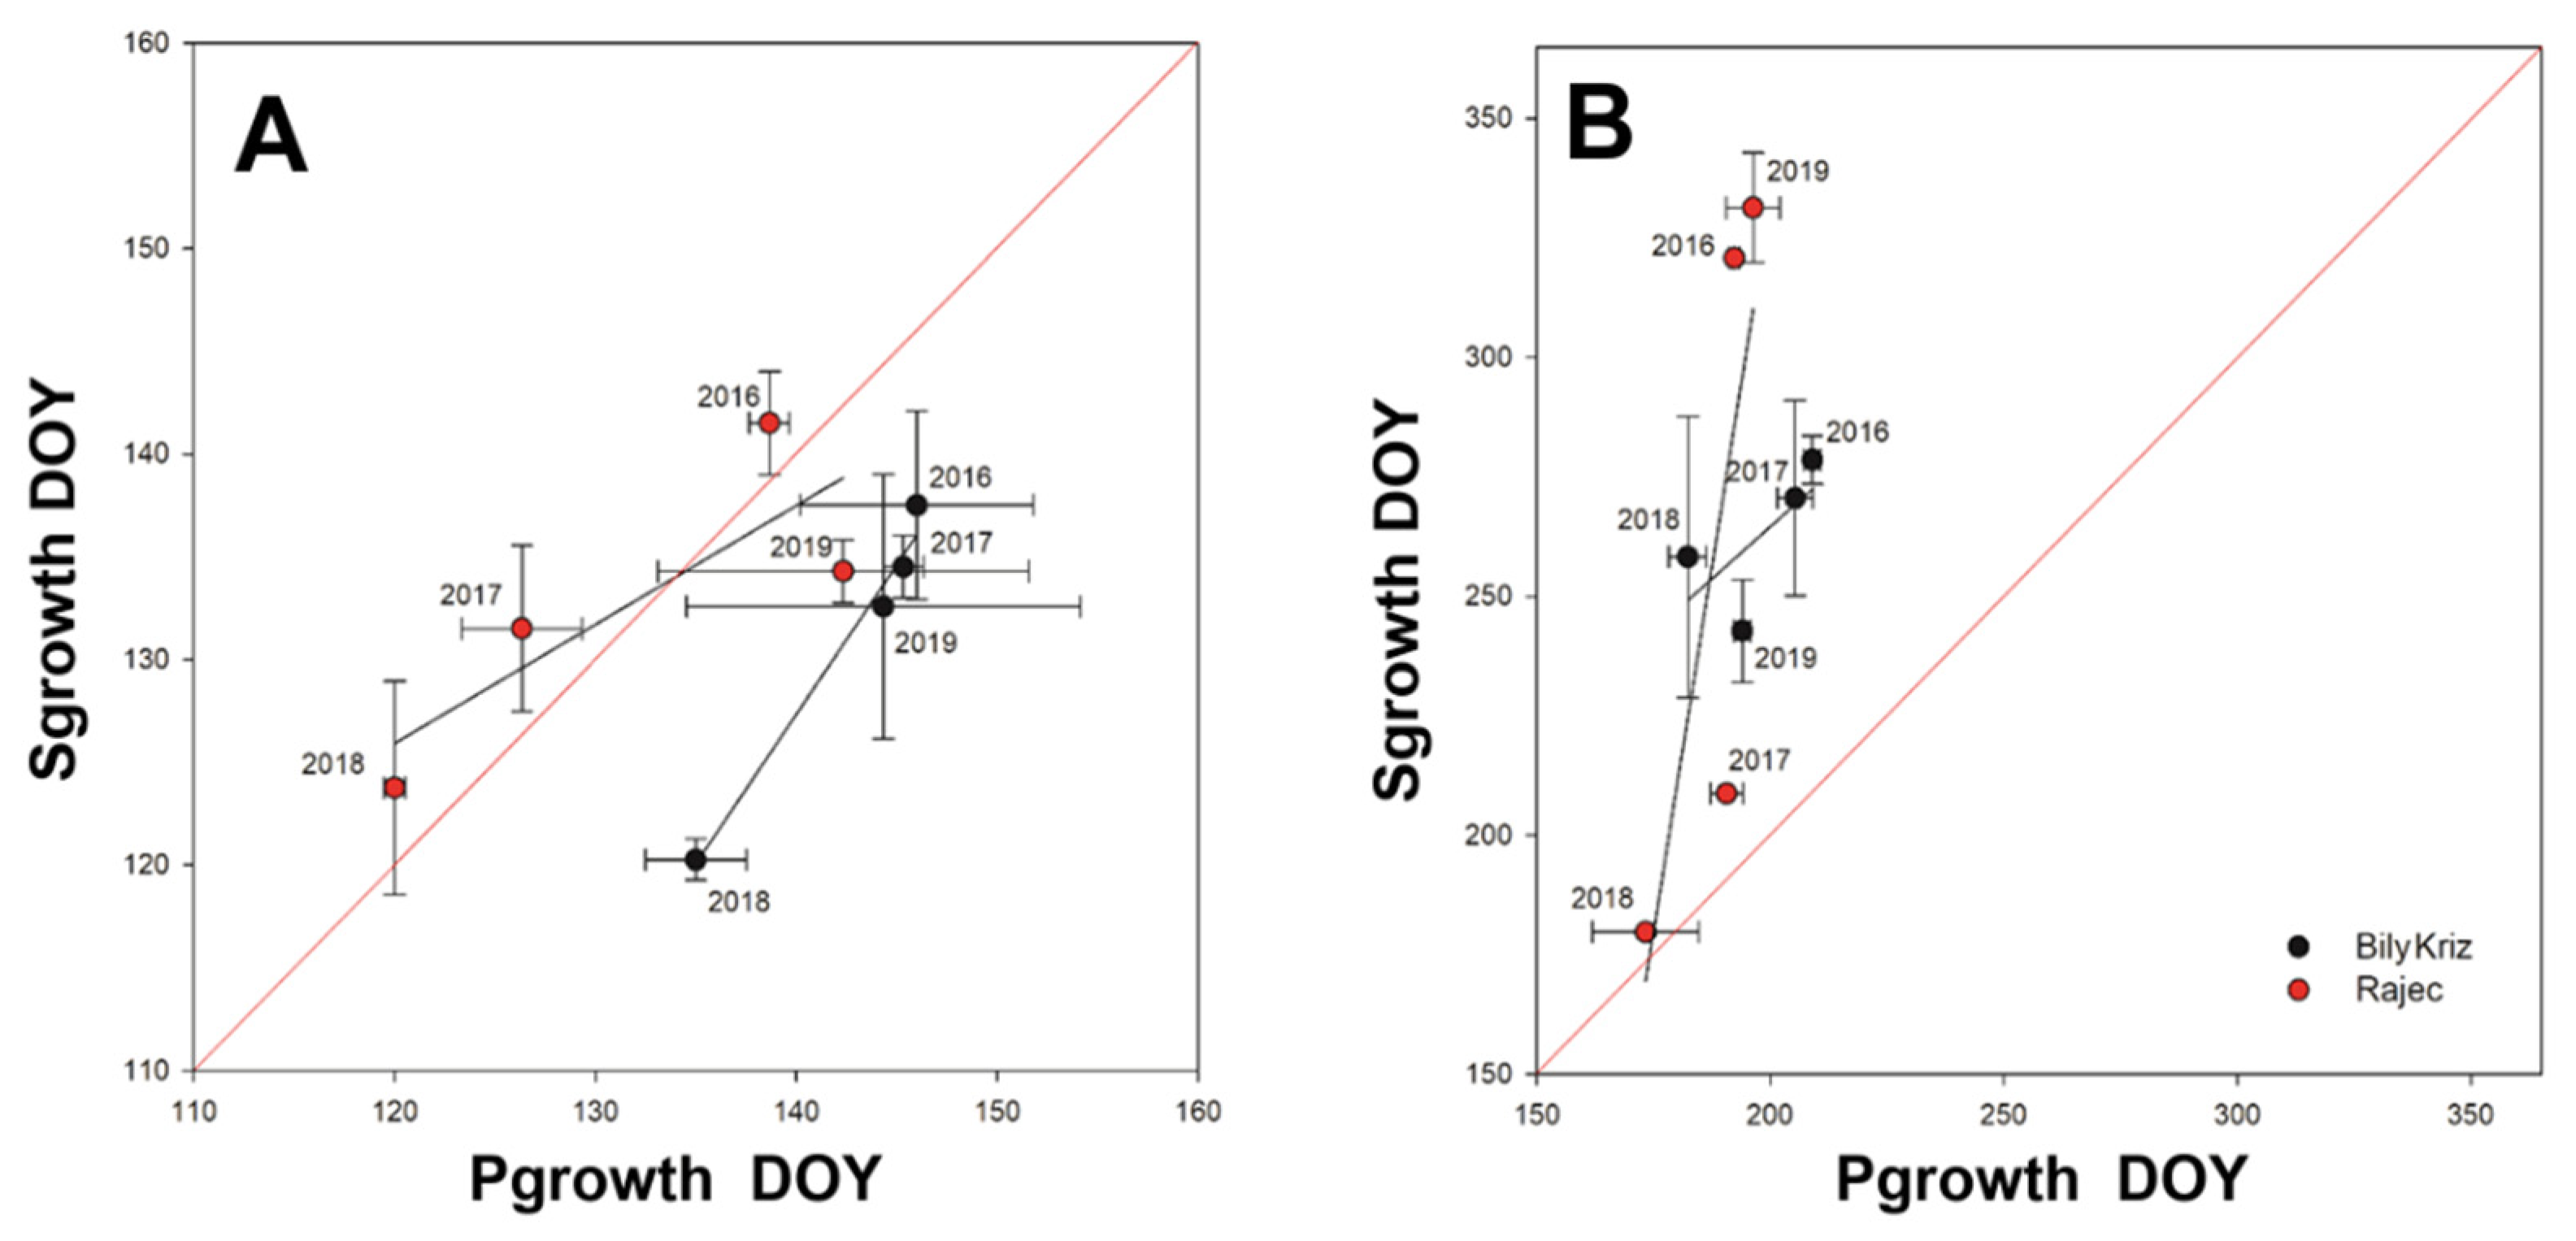
A positive relationship was found between the onset of Pgrowth and Sgrowth (R2 = 0.68 Rajec; R2 = 0.98 Bily Kriz) and also between the termination of Pgrowth and Sgrowth (R2 = 0.65 Rajec; R2 = 0.45 Bily Kriz). While on average the onset of Pgrowth and Sgrowth occurred at the same time in Rajec, the Sgrowth preceded Pgrowth by nine days in Bily Kriz. The end of Sgrowth always occurred later than the end of Pgrowth; the only exception was in 2018, when Sgrowth terminated at the same time as Pgrowth (Figure 7).
3.4. Time-Lag
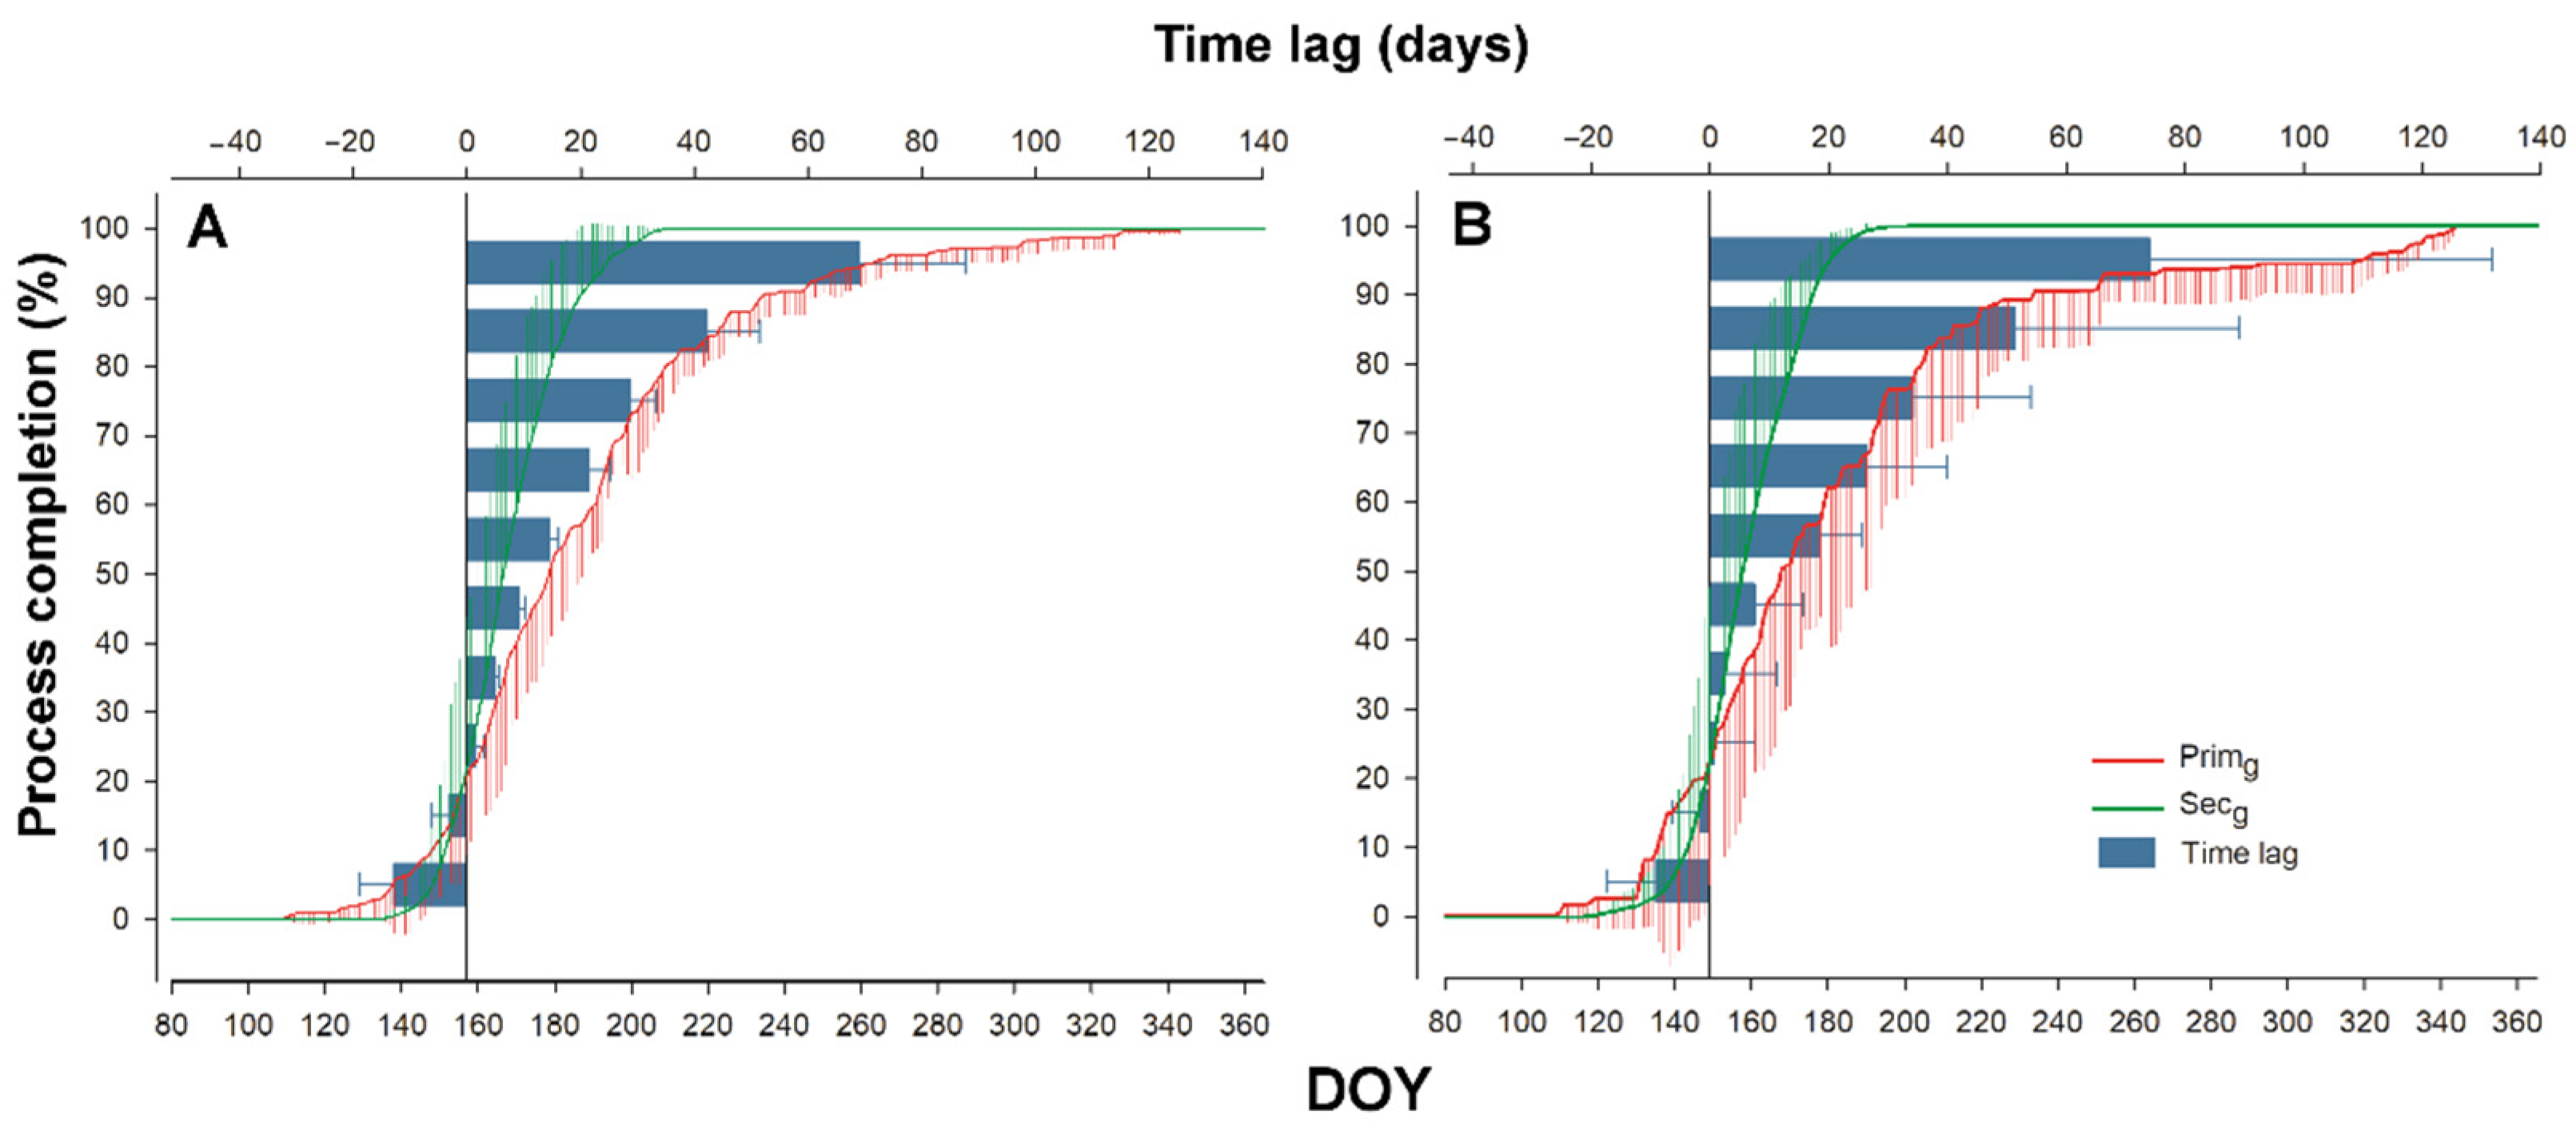
There was no difference in time shift of these growth processes between plots. On average, Sgrowth required 71 days more than Pgrowth to reach full process completion. We observed the asynchrony of Pgrowth and Sgrowth in both plots as well as a time lag between the process completion of Pgrowth and Sgrowth. The process of Sgrowth formation up to 20% completion preceded the same amount of Pgrowth completion. The border between earlier process completion and the time lag of Sgrowth and Pgrowth was observed in the interval from 20 to 30% of process completion on both sites. After this inflection point, the time lag between Sgrowth and Pgrowth gradually increased. In this sense, Pgrowth was completely formed at the time when only 71% (Bily Kriz) or 77% (Rajec) of the Sgrowth was created (Figure 8, Table 3).
4. Discussion
Our aim was to provide insight into the role climate factors play in controlling Pgrowth and Sgrowth of Norway spruce on two studied plots located at different altitudes. The results confirm our third alternative tree response, in that both processes are not constant over time and are strongly dependent on current climatic conditions, mainly during the GS. The onset, end and duration of Pgrowth differed between studied plots and years as well. On the contrary, Sgrowth showed only significant differences between years and growth duration. Sgrowth began earlier than Pgrowth, but there was no observable difference in the time-lag of Pgrowth and Sgrowth between the two plots located at differing elevations (Table 3, Figure 6 and Figure 7).
4.1. Variation of Climatic Conditions and GS Prolongation
Overall, the major driving factors for forest ecosystems and their productivity are the photoperiod and daylight cycles [36] in the Northern Hemisphere. It is generally known that the onset of wood formation is a function of photoperiod, temperature, moisture availability, spring forcing, and winter chilling; these external factors are critical for the closely linked processes of Pgrowth and Sgrowth [37]. The critical day length for Norway spruce provenances growth at around 55° of northern latitudes is 16 h [38]. In the case of the Czech Republic, the daily duration of light availability at the time of primary growth activity (budbreak) is around 14.3–15.1 h, with the maximum angle of the Sun above the canopy around 60°.
Therefore, many life-cycle events of plants that depend on a certain season respond to day length signals, while other environmental factors such as temperature and light quality continue to be important [36,39]. Temperature is also involved in the control of the growth cycle [40]. The growth pattern for Norway spruce is fixed, but an increase in temperature will potentially affect the phenology and dormancy of plants [40,41,42]. Trends for Central Europe in 2051–2080 have predicted a dangerous increase in summer temperatures in the range of +1.5–2.6 °C [43]. We observed annual air temperatures more than 1 °C above LTM between the years 2016 and 2019. In the case of the GS5°C, there was a shift of more than 1.7 °C for the lower elevation study plot (Rajec).
The importance of water availability for tree growth at low elevations is supported by previous studies, e.g., [44,45,46,47]. The range of annual precipitation in the lower plot (Rajec) showed that some years limited the growth of Norway spruce. Especially in the dry year of 2018, there was only 68% of the total sum of precipitation observed in the lower study plot (Rajec) and growth was markedly reduced during the GS. The total deficit of precipitation during the GS was 92 mm of precipitation according to Tolasz et al. [48]. On the other hand, the Bily Kriz plot, at a substantially higher elevation, only showed a precipitation deficit during GS 2018.
The length of the GS is affected by the increased air temperatures of a warming climate [12,49]. Our study confirmed this connection. The length of the GS was prolonged significantly, more so at the higher elevation study plot. At Bily Kriz, we observed a dramatic 50-day increase in the number of days with a temperature above 15 °C (vegetation summer) compared to LTM. Menzel and Fabian [12] reported that spring events such as budbreak have advanced by 5 days and the average annual GS has lengthened by 10.8 days since the 1960s. While climate warming reduces the occurrence of frost events, the warming-induced lengthening of the GS of plants in the Northern Hemisphere may actually induce more frequent frost days during the start of the GS [49].
4.2. Sgrowth Started Earlier Than Pgrowth
The onset of Sgrowth did not differ along the gradient of microclimatic parameters (Ta, P, VPD); however, the differences in climatic conditions between sites caused a shift in the onset of Pgrowth. It seems that the onset of Pgrowth and Sgrowth are regulated by different threshold values or trigger mechanisms so other variables need to be considered. The onset of Pgrowth is described as a function of photoperiod and only modulated by the temperature [36]. The study plots significantly differ in temperature and amount of precipitation. At higher elevation, there is a high probability of late frost, and spruce trees are sensitive to frost probability at early phenological stages [50].
There were no differences in the onset of Sgrowth between the sites. A similar finding has been reported for wider elevation gradients (400–1000 m.a.s.l.) of spruce plots [42]. Temperature was described as the main factor controlling the onset of Sgrowth. There were no differences in the timing of Sgrowth onset, but Sgrowth began earlier in higher temperatures. Sgrowth began at a daily average temperature (10 days before Sgrowth inhibition) of 8.7 °C in Bily Kriz and 10.0 °C in Rajec. We speculate that the onset of Sgrowth is a not linear function of the temperature, but that water balance also needs to be considered. It appears that there must be sufficient water available for the onset of Sgrowth. In certain instances, the products of photosynthesis could be used as a protection against drought-induced mortality [51] but could cause delays in the onset of Sgrowth.
Although the precise determination of cell division and cell enlargement from SDV is still being investigated by the scientists, numerous studies provided mechanistic models of how to separate irreversible growth and water related stem contraction [52,53]. One of these models was used in case of this study [26]. The zero-growth concept assumes that there is no growth under the period of stem shrinking. When the current value of SDV exceeded the previous maximum value, the period of increases is attributed to irreversible stem growth. Time overlaps between irreversible stem radial growth (automatic dendrometer) and wood formation (micro-coring) were evaluated in many studies [54,55,56,57]. Based on the methodology which we used, we assume that irreversible growth detected in SDV is directly associated with cell division and cell enlargement (i.e., Sgrowth).
4.3. Timing of Pgrowth and Sgrowth Regulated by Different Triggers
As mentioned above, the inter-annual variability in the timing of Pgrowth and Sgrowth is strongly affected by climatic conditions. These growth processes (bud development or cambial activity) are driven and synchronized differently by many environmental factors [58]. The timing of onset/end of both types of growth processes is strongly affected by actual climatic conditions. For example, a significant shift in the onset of Pgrowth and Sgrowth was observed in the spring of 2018 when both processes began earlier due to the extremely warm April, with temperatures of +5.5 °C in Rajec and +5.4 °C in Bily Kriz above the LTM (Figure 4 and Figure 5). The drought and heat wave (according to Blauhut et al. [59]) which were observed during GS5°C in 2018 disrupted Sgrowth mainly in the Rajec plot (Figure 5). Lisar and Agdam [60] confirmed that drought (water stress) is one of the most important environmental stressors and occurs for several reasons. These reasons include low rainfall, salinity, high or low temperatures, and high intensity of light, among others. On the other hand, a cold and rainy spring in 2019 caused a significant delay of Pgrowth (Figure 7). However, internal factors such as phytohormones and rate of photosynthesis (carbohydrates) need to be taken into consideration [61]. The onset of Sgrowth is frequently associated with the activity of the hormone auxin [61,62], which is formed in the buds and consequently distributed to the other parts of the plant. In our study, the onset of Sgrowth occurred before Pgrowth. This finding is in agreement with results of Gricar et al. [61], and further supports the suggestion that the auxin present in dormant cambium is sufficient for cambial reactivation. This could hypothetically remove the need of fixed time coincidence of primary and secondary growth.
Photosynthetic rate and consequent stem radial growth are ultimately reduced under a drought period or other stress conditions [61]. In particular, a wide variability in the termination of Sgrowth was observed. The timing of the Sgrowth period was observed from DOY 132 to DOY 265. This is the part of the year where dry periods occur the most frequently. Termination of Sgrowth affected by a drought period was also reported by others [42,63]. Pgrowth was not affected in the same level as Sgrowth. We assume that the lack of precipitation in the time of Pgrowth (first third of the GS) is compensated by the wet soil remaining after the winter period [64]. This would mean that Pgrowth occurred at times with a low risk of water scarcity.
5. Conclusions
We investigated the dynamics of primary and secondary growth using a novel methodological approach. The high temporal resolution of the data collected for primary growth (apical meristem phenology) measured by phenocameras and secondary growth (radial growth) measured by automatically dendrometers allows us to compare the timing and sensitivity of these growth processes. All measured climatic parameters showed significant shifts according to LTM (1961–2010). We observed a significant shift of the length of the GS (more than 50 days), which strongly affected the timing of primary and secondary growth. In the case of precipitation, the higher plot showed a lower deficit of total sum of precipitation. In the year 2018, there was detected a critical amount of annual precipitation, only 69% of LTM. The most extreme year according to weather conditions was 2018, with temperatures above LTM and dry periods that caused the earliest onset of both types of growths. On the other hand, these weather conditions were extremely unfavorable for secondary growth. Onset and end of primary growth significantly differed between locality and years, but the onset of secondary growth did not follow the gradient of microclimatic parameters. On average, secondary growth requires 71 days more than primary growth to reach full process completion. Despite an increasing number of meteorological extremes, continuously monitoring primary or secondary growth can help to predict the health status of forests in the near future.
Author Contributions
O.N. went through the entire mathematical process and prepared the majority of the manuscript with J.K., who prepared data analysis and the most of visualization. M.B. provided picture analysis captured from phenocameras and contributed to the results of primary growth. J.S. helped with choosing the appropriate methods, consultation of results and data curation. All authors substantially contributed to methods, discussions and revisions. All authors have read and agreed to the published version of the manuscript.
Funding
This research was funded by the Internal Grant Agency of Mendel University in Brno (IGA), grant number LDF_VP_2017048.
Institutional Review Board Statement
Not applicable.
Informed Consent Statement
Not applicable.
Data Availability Statement
The data presented in this study are available on request from the corresponding author.
Acknowledgments
Many thanks are given to Alisa Royer for performing a language revision of the presented paper.
Conflicts of Interest
The authors declare no conflict of interest. The funders had no role in the design of the study; in the collection, analyses, or interpretation of data; in the writing of the manuscript; or in the decision to publish the results.
References
- Bui, M.; Adjiman, C.; Bardow, A.; Boston, A.; Brown, S.; Fennell, P.; Fuss, S. Carbon capture and storage: The way forward. Energy Environ. Sci. 2018, 11, 1062–1176. [Google Scholar] [CrossRef] [Green Version]
- Ciais, P.; Schelhaas, M.; Zaehle, S.; Piao, S.L.; Cescatti, A.; Liski, J.; Luyssaert, S.; Le-Maire, G.; Schulze, E.D.; Bouriaud, O.; et al. Carbon accumulation in European forests. Nat. Geosci. 2008, 1, 425–429. [Google Scholar] [CrossRef]
- Caudullo, G.; Tinner, W.; Rigo, D. Picea Abies in Europe: Distribution, Habitat, Usage and Threats. European Atlas of Forest Tree Species, 1st ed.; Publication Office of the European Union: Luxembourg, 2016; pp. 114–116. [Google Scholar]
- Klimo, E.; Kulhavy, J. Norway spruce monocultures and their transformation to close-to-nature forests from the point of view of soil changes in the Czech Republic. Ekológia 2006, 25, 27–43. [Google Scholar]
- Lindner, M.; Gonzalo, J.G.; Kolström, M.; Green, T. Impacts of Climate Change on European Forests and Options for Adaptation; European Forestry Institute: Boku, Vienna, 2008; pp. 1–173. [Google Scholar]
- Pasqui, M.; Giuseppe, D.E. Climate change, future warming, and adaptation in Europe. Anim. Front. 2019, 9, 6–11. [Google Scholar] [CrossRef] [PubMed] [Green Version]
- Seidl, R.; Rammer, W.; Jäger, D.; Lexer, M.J. Impact of bark beetle (Ips typographus L.) disturbance on timber production and carbon sequestration in different management strategies under climate change. For. Ecol. Manag. 2008, 256, 209–220. [Google Scholar] [CrossRef]
- Piao, S.; Wang, X.; Ciais, P.; Zhu, B.; Wang, T.; Liu, J. Changes in satellite-derived vegetation growth trend in temperate and boreal Eurasia from 1982 to 2006. Glob. Chang. Biol. 2011, 17, 3228–3239. [Google Scholar] [CrossRef]
- Allen, C.; Macalady, A.; Chenchouni, H.; Bachelet, D.; McDowell, N.; Vennetier, M.; Kitzberger, T.; Rigling, A.; Breshears, D.; Hogg, E.; et al. A global overview of drought and heat-induced tree mortality reveals emerging climate change risks for forests. For. Ecol. Manag. 2010, 259, 660–684. [Google Scholar] [CrossRef] [Green Version]
- Reyer, C.P.; Leuzinger, S.; Rammig, A.; Wolf, A.; Bartholomeus, R.P.; Bonfante, A.; de Lorenzi, F.; Dury, M.; Gloning, P.; Abou Jaoudé, R.; et al. A plant’s perspective of extremes: Terrestrial plant responses to changing climatic variability. Glob. Chang. Biol. 2013, 19, 75–89. [Google Scholar] [CrossRef] [PubMed]
- Lindner, M.; Maroschek, M.; Netherer, S.; Kremer, A.; Barbati, A.; Garcia-Gonzalo, J.; Seidl, R.; Delzon, S.; Corona, P.; Kolström, M.; et al. Climate change impacts, adaptive capacity, and vulnerability of European forest ecosystems. For. Ecol. Manag. 2010, 259, 698–709. [Google Scholar] [CrossRef]
- Menzel, A.; Fabian, P. Growing season extended in Europe. Nature 1999, 397, 659. [Google Scholar] [CrossRef]
- Chmielewski, F.M.; Rötzer, T. Response of tree phenology to climate change across Europe. Agric. For. Meteorol. 2001, 108, 101–112. [Google Scholar] [CrossRef]
- Cuny, H.E.; Rathgeber, C.B.K.; Frank, D.; Fonti, P.; Mäkinen, H.; Prislan, P.; Rossi, S.; del Castillo, E.M.; Campelo, F.; Vavrčík, H. Woody biomass production lags stem-girth increase by over one month in coniferous forests. Nat. Plants 2015, 1, 1–6. [Google Scholar] [CrossRef] [PubMed]
- Fu, Y.S.H.; Zhao, H.F.; Piao, S.L.; Peaucelle, M.; Peng, S.S.; Zhou, G.Y.; Ciais, P.; Huang, M.T.; Menzel, A.; Uelas, J.P. Declining global warming effects on the phenology of spring leaf unfolding. Nature 2015, 526, 104–107. [Google Scholar] [CrossRef] [PubMed] [Green Version]
- Chuine, I.; Beaubien, E.G. Phenology is a major determinant of tree species range. Ecol. Lett. 2001, 4, 500–510. [Google Scholar] [CrossRef] [Green Version]
- Huang, J.G.; Bergeron, Y.; Zhai, L.H.; Denneler, B. Variation in intra-annual radial growth (xylem formation) of Picea mariana (pinaceae) along a latitudinal gradient in western Quebec, Canada. Am. J. Bot. 2011, 98, 792–800. [Google Scholar] [CrossRef] [PubMed] [Green Version]
- Ren, P.; Rossi, S.; Camarero, J.J.; Ellison, A.M.; Liang, E.; Penuelas, J. Critical temperature and precipitation thresholds for the onset of xylogenesis ofJuniperus przewalskiiin a semi-arid area of the north-eastern Tibetan. Plateau Ann. Bot. 2018, 121, 617–624. [Google Scholar] [CrossRef]
- Antonucci, S.; Rossi, S.; Deslauriers, A.; Lombardi, F.; Marchetti, M.; Tognetti, R. Synchronisms and correlations of spring phenology between apical and lateral meristems in two boreal conifers. Trees Struct. Funct. 2015, 35, 1086–1094. [Google Scholar] [CrossRef] [PubMed] [Green Version]
- Jiang, Y.; Zhang, Y.; Guo, Y.; Kang, M.; Wang, M.; Wang, B. Intra-annual xylem growth of Larixprincipis-rupprechtii at its upper and lower distribution limits on the Luyashan mountain in north-central China. Forests 2015, 6, 3809–3827. [Google Scholar] [CrossRef] [Green Version]
- Richardson, A.D.; Hollinger, D.Y. A method to estimate the additional uncertainty in gap-filled NEE resulting from long gaps in the CO2 flux record. Agric. For. Meteorol. 2007, 147, 199–208. [Google Scholar] [CrossRef]
- Soudani, K.G.; Hmimina, N.; Delpierre, J.; Pontailler, M.; Aubinet, D.; Bonal, B.; Caquet, A.; Grandcourt, B.; Burban, C.; Flechard, D.; et al. Ground-based Network of NDVI measurements for tracking temporal dynamics of canopy structure and vegetation phenology in different biomes. Remote Sens. Environ. 2012, 123, 234–245. [Google Scholar] [CrossRef]
- Sonnentag, O.; Hufkens, K.; Teshera-Sterne, C.; Young, A.M.; Friedl, M.; Braswell, B.H.; Milliman, T.; O’Keefe, J.; Richardson, A.D. Digital repeat photography for phenological research in forest ecosystems. Agric. For. Meteorol. 2012, 152, 159–177. [Google Scholar] [CrossRef]
- Brown, T.B.; Hultine, K.R.; Steltzer, H.; Denny, E.G.; Denslow, M.W.; Granados, J.; Henderson, S.; Richardson, A.D. Using phenocams to monitor our changing earth: Toward a global phenocam network. Front. Ecol. Environ. 2016, 14, 84–93. [Google Scholar] [CrossRef] [Green Version]
- Drew, D.M.; Downes, G. The use of precision dendrometers in research on daily stem size and wood property variation: A review. Dendrochronologia 2009, 27, 159–172. [Google Scholar] [CrossRef]
- Zweifel, R.; Haeni, M.; Buchmann, N.; Eugster, W. Are trees able to grow in periods of stem shrinkage? New Phytol. 2016, 211, 839–849. [Google Scholar] [CrossRef] [PubMed] [Green Version]
- Cocozza, C.; Palombo, C.; Tognetti, R.; Porta, N.; Anichini, M.; Giovannelli, A.; Emiliani, G. Monitoring intra-annual dynamics of wood formation with microcores and dendrometers in Picea abies at two different altitudes. Tree Physiol. 2016, 36, 832–846. [Google Scholar] [CrossRef] [PubMed] [Green Version]
- Dietrich, L.; Zweifel, R.; Kahmen, A. Daily stem diameter variations can predict the canopy water status of mature temperate trees. Tree Physiol. 2018, 38, 941–952. [Google Scholar] [CrossRef]
- Zhang, Y.; Jiang, Y.; Wen, Y.; Ding, X.; Wang, B.; Xu, J. Comparing Primary and Secondary Growth of Co-Occurring Deciduous and Evergreen Conifers in an Alpine Habitat. Forests 2019, 10, 574. [Google Scholar] [CrossRef] [Green Version]
- Quitt, E. Climatic Regions of Czechoslovakia, 1st ed.; Studia Geographica: Brno, Czech Republic, 1971; Volume 16, p. 73. [Google Scholar]
- Pokorný, R.; Rajsnerová, P.; Kubásek, J.; Marková, I.; Tomášková, I. Effect of early to late wood proportion on Norway spruce biomass. Acta Univ. Agric. Silvic. Mendel. Brun. 2012, 60, 287–292. [Google Scholar] [CrossRef] [Green Version]
- Nezval, O.; Krejza, J.; Světlík, J.; Šigut, L.; Horáček, P. Comparison of traditional ground-based observations and digital remote sensing of phenological transitions in a floodplain forest. Agric. For. Meteorol. 2020, 291, 108079. [Google Scholar] [CrossRef]
- Abramoff, M.D.; Magelhaes, P.J.; Ram, S.J. Image Processing with ImageJ. Biophotonics Int. 2004, 11, 36–42. [Google Scholar]
- Mini32 Software v. 10.2.11, EMS Brno, The Czech Republic. 2021. Available online: http://www.emsbrno.cz/p.axd/en/Software.html (accessed on 9 March 2021).
- SigmaPlot v. 11.0. Systat Software, San Jose, USA. 2021. Available online: http://www.sigmaplot.co.uk/products/sigmaplot/ (accessed on 9 March 2021).
- Körner, C.; Basler, D. Phenology under global warming. Science 2010, 327, 1461–1462. [Google Scholar] [CrossRef] [PubMed]
- Huang, J.G.; Ma, Q.; Rossi, S.; Biondi, F.; Deslauriers, A.; Fonti, P.; Ziaco, E. Photoperiod and temperature as dominant environmental drivers triggering secondary growth resumption in Northern Hemisphere conifers. Proc. Natl. Acad. Sci. USA 2020, 117, 20645–20652. [Google Scholar] [CrossRef] [PubMed]
- Thomas, B.; Vince-Prue, D. Photoperiodism in Plants, 2nd ed.; Academic Press: London, UK, 1996; pp. 1–428. [Google Scholar]
- Olsen, J.E. Light and temperature sensing and signaling in induction of bud dormancy in woody plants. Plant Mol. Biol. 2010, 73, 37–47. [Google Scholar] [CrossRef] [PubMed]
- Tanino, K.K.; Kalcsits, L.; Silim, S.; Kendall, E.; Gray, G.R. Temperature-driven plasticity in growth cessation and dormancy development in deciduous woody plants: A working hypothesis suggesting how molecular and cellular function is affected by temperature during dormancy induction. Plant Mol. Biol. 2010, 73, 49–65. [Google Scholar] [CrossRef] [PubMed]
- Olsen, J.E.; Jensen, J.B.; Molmann, J.A.; Ernstsen, A.; Junttila, O. Photoperiodic Regulation of Apical Growth Cessation in Northern Tree Species: The Role of Phytochrome and Gibberellin. J. Crop. Improv. 2004, 10, 77–112. [Google Scholar] [CrossRef]
- Krejza, J.; Cienciala, E.; Světlík, J.; Bellan, M.; Noyer, E.; Horáček, P.; Marek, M.V. Evidence of climate-induced stress of Norway spruce along elevation gradient preceding the current dieback in Central Europe. Trees 2020, 35, 103–119. [Google Scholar] [CrossRef]
- Chenkova, N.; Nikolova, N. Air temperature and precipitation variability in northeastern Bulgaria on the background of climate change. Therm. Sci. 2015, 19, 381–390. [Google Scholar] [CrossRef]
- Mäkinen, H.; Nöjd, P.; Kahle, H.P.; Neumann, U.; Tveite, B.; Mielikäinen, K.; Röhle, H.; Spiecker, H. Radial growth variation of Norway spruce (Picea abies (L.) Karst.) across latitudinal and altitudinal gradients in central and northern Europe. For. Ecol. Manag. 2002, 171, 243–259. [Google Scholar] [CrossRef]
- Neuwirth, B.; Esper, J.; Schweingruber, F.H.; Winiger, M. Site ecological differences to the climatic forcing of spruce pointer years from the Lötschental, Switzerland. Dendrochronologia 2004, 21, 69–78. [Google Scholar] [CrossRef]
- Büntgen, U.; Frank, D.C.; Kaczka, R.J.; Verstege, A.; Zwijacz, K.T.; Esper, J. Growth responses to climate in a multi-species tree-ring network in the Western Carpathian Tatra Mountains, Poland and Slovakia. Tree Physiol. 2007, 27, 689–702. [Google Scholar] [CrossRef] [Green Version]
- Affolter, P.; Büntgen, U.; Esper, J.; Rigling, A.; Weber, P.; Luterbacher, J.; Frank, D. Inner Alpine conifer response to 20th century drought swings. Eur. J. For. Res. 2010, 129, 289–298. [Google Scholar] [CrossRef] [Green Version]
- Tolasz, R.; Míková, T.; Voženílek, V. Climate Atlas of Czechia, 1st ed.; Czech Hydrometeorological Institute: Prague-Olomouc, Czech Republic, 2007; pp. 1–245. [Google Scholar]
- Liu, Q.; Piao, S.; Janssens, I.M.; Fu, Y.; Peng, S.; Lian, X.; Ciais, P.; Myneni, R.B.; Penuelas, J.; Wang, T. Extension of the growing season increases vegetation exposure to frost. Nat. Commun. 2018, 9, 426. [Google Scholar] [CrossRef] [Green Version]
- Lenz, A.; Hoch, G.; Körner, C.; Vitasse, Y. Convergence of leaf-out towards minimum risk of freezing damage in temperate trees. Funct. Ecol. 2016, 30, 1480–1490. [Google Scholar] [CrossRef]
- Klein, T.; Zeppel, M.J.B.; Anderegg, W.R.L.; Bloemen, J.; Kauwe, M.G.; Hudson, P.; Nardini, A. Xylem embolism refilling and resilience against drought-induced mortality in woody plants: Processes and trade-offs. Ecol. Res. 2018, 33, 839–855. [Google Scholar] [CrossRef]
- Mencuccini, M.; Salmon, Y.; Mitchell, P.; Hölttä, T.; Choat, B.; Meir, P.; Pfautsch, S. An empirical method that separates irreversible stem radial growth from bark water content changes in trees: Theory and case studies. Plant Cell Environ. 2017, 40, 290–303. [Google Scholar] [CrossRef] [PubMed] [Green Version]
- Zweifel, R.; Zimmermann, L.; Zeugin, F.; Newbery, D.M. Intra-annual radial growth and water relations of trees: Implications towards a growth mechanism. J. Exp. Bot. 2006, 57, 1445–1459. [Google Scholar] [CrossRef] [Green Version]
- Mäkinen, H.; Seo, J.-W.; Nöjd, P.; Schmitt, U.; Jalkanen, R. Seasonal dynamics of wood formation: A comparison between pinning, microcoring and dendrometer measurements. Eur. J. For. Res. 2008, 127, 235–245. [Google Scholar] [CrossRef]
- Cruz-García, R.; Balzano, A.; Čufar, K.; Scharnweber, T.; Smiljanić, M.; Wilmking, M. Combining Dendrometer Series and Xylogenesis Imagery—DevX, a Simple Visualization Tool to Explore Plant Secondary Growth Phenology. Front. For. Glob. Chang. 2019, 2, 60. [Google Scholar] [CrossRef]
- Stangler, D.F.; Kahle, H.-P.; Raden, M.; Larysch, E.; Seifert, T.; Spiecker, H. Effects of Intra-Seasonal Drought on Kinetics of Tracheid Differentiation and Seasonal Growth Dynamics of Norway Spruce along an Elevational Gradient. Forests 2021, 12, 274. [Google Scholar] [CrossRef]
- Zhang, S.; Butto, V.; Khare, S.; Deslauriers, A.; Morin, H.; Huang, J.G. Calibrating PhenoCam Data with Phenological Observations of a Black Spruce Stand. Can. J. Remote Sens. 2020, 46, 154–165. [Google Scholar] [CrossRef]
- Blauhut, V.; Stahl, K.; Stagge, J.H.; Tallaksen, L.M.; Stefano, L.; Vogt, J. Estimating drought risk across Europe from reported drought impacts, drought indices, and vulnerability factors. Hydrol. Earth Syst. Sci. 2016, 20, 2779–2800. [Google Scholar] [CrossRef] [Green Version]
- Lisar, Y.S.L.; Agdam, H.B. Drought Stress in Plants: Causes, Consequences, and Tolerance, 1st ed.; Springer: Berlin/Heidelberg, Germany, 2016; pp. 1–16. [Google Scholar]
- Gricar, J.; Zupancic, M.; Cufar, K.; Oven, P. Regular cambial activity and xylem and phloem formation in locally heated and cooled stem portions of Norway spruce. Wood Sci. Technol. 2007, 41, 463–475. [Google Scholar] [CrossRef]
- Fajstavr, M.; Giagli, K.; Vavrčík, H.; Gryc, V.; Urban, J. The effect of stem girdling on xylem and phloem formation in Scots pine. Silva Fenn. 2017, 51, 1–22. [Google Scholar] [CrossRef] [Green Version]
- Tariq, A.; Pan, K.; Olatunji, O.A.; Graciano, C.; Li, Z.; Sun, F.; Zhang, A. Phosphorous fertilization alleviates drought effects on Alnus cremastogyne by regulating its antioxidant and osmotic potential. Sci. Rep. 2018, 8, 5644. [Google Scholar] [CrossRef] [PubMed]
- Wolf, S.; Eugster, W.; Ammann, C.; Häni, M.; Zielis, S.; Hiller, R.; Buchmann, N. Contrasting response of grassland versus forest carbon and water fluxes to spring drought in Switzerland. Environ. Res. Lett. 2013, 8, 35007. [Google Scholar] [CrossRef] [Green Version]
- Körner, C. Paradigm shift in plant growth control. Curr. Opin. Plant Biol. 2015, 25, 107–114. [Google Scholar] [CrossRef]
Figure 1.
Geographical location of the two experimental study plots in the Czech Republic.

Figure 2.
The PhenoCam EMS 800 (EMS Brno, the Czech Republic) placed on the top of the meteorological tower (A) and the example of photos (B) at the ESP Rajec, which were used for evaluation of Pgrowth; tree rectangles represent views of different focal length (frames).
Figure 2.
The PhenoCam EMS 800 (EMS Brno, the Czech Republic) placed on the top of the meteorological tower (A) and the example of photos (B) at the ESP Rajec, which were used for evaluation of Pgrowth; tree rectangles represent views of different focal length (frames).

Figure 3.
The seasonal course of monthly mean air temperature Ta (°C), monthly sum of precipitation P (mm) and monthly mean of vapor pressure deficit VPD (kPa) at the ESP Bily Kriz and Rajec in the years 2016–2019. Red lines represent long-term measurements (1961–2010). Vertical bars represent standard deviation.

Figure 4.
Time series of cumulative daily primary growth (Pgrowth) in % (left) and time series of daily rate (right) in % day−1 at the ESP Bily Kriz (A) and Rajec (B) in 2016–2019. Vertical bars represent standard deviation.
Figure 4.
Time series of cumulative daily primary growth (Pgrowth) in % (left) and time series of daily rate (right) in % day−1 at the ESP Bily Kriz (A) and Rajec (B) in 2016–2019. Vertical bars represent standard deviation.

Figure 5.
Time series of cumulative daily secondary growth expressed by stem radial increment (SRI) in µm (left) and time series of daily rate of SRI in µm day−1 (at the studied plots Bily Kriz (A) and Rajec (B) in 2016–2019. Vertical bars represent standard deviation.
Figure 5.
Time series of cumulative daily secondary growth expressed by stem radial increment (SRI) in µm (left) and time series of daily rate of SRI in µm day−1 (at the studied plots Bily Kriz (A) and Rajec (B) in 2016–2019. Vertical bars represent standard deviation.

Figure 6.
Mean value of daily rate of Sgrowth (brown line; SRI) and Pgrowth (green line; Pgrowth) calculated for all study years (2016–2019) at the ESP Rajec (A) and Bily Kriz (B). Vertical bars represent standard deviation.
Figure 6.
Mean value of daily rate of Sgrowth (brown line; SRI) and Pgrowth (green line; Pgrowth) calculated for all study years (2016–2019) at the ESP Rajec (A) and Bily Kriz (B). Vertical bars represent standard deviation.

Figure 7.
Correlation between onset (A) of primary (Pgrowth) and secondary growth (Sgrowth) and end of Pgrowth and Sgrowth (B) at the ESP Bily Kriz (black circles) and Rajec (red circles) in 2016–2019. The 1:1 red line is drawn for reference. Vertical and horizontal bars represent standard deviation.

Figure 8.
Timing and time lag of primary (Pgrowth) and secondary growth (Sgrowth) at the ESP Bily Kriz (A) and Rajec (B) in 2016–2019. Time lag between seasonal dynamics of primary growth and secondary growth, both processes are expressed in relative values (percentage of completion).
Figure 8.
Timing and time lag of primary (Pgrowth) and secondary growth (Sgrowth) at the ESP Bily Kriz (A) and Rajec (B) in 2016–2019. Time lag between seasonal dynamics of primary growth and secondary growth, both processes are expressed in relative values (percentage of completion).


Table 1.
The annual average air temperature (Ta) and annual sums of precipitation (P) measured at the ESP Rajec and Bily Kriz in the years 2016–2019. The values below are deviations in °C resp. % according to LTM (1961–2010).
Table 1.
The annual average air temperature (Ta) and annual sums of precipitation (P) measured at the ESP Rajec and Bily Kriz in the years 2016–2019. The values below are deviations in °C resp. % according to LTM (1961–2010).
| Variables | Rajec | Bily Kriz | ||||||
|---|---|---|---|---|---|---|---|---|
| 2016 | 2017 | 2018 | 2019 | 2016 | 2017 | 2018 | 2019 | |
| Ta (°C) | 8.1 | 8.2 | 9.0 | 9.0 | 6.1 | 6.3 | 6.9 | 6.9 |
| Tadev. (°C) | 1.1 | 1.2 | 2.0 | 2.0 | 0.5 | 0.7 | 1.3 | 1.3 |
| P (mm) | 618.6 | 568.8 | 456.3 | 685.7 | 1298.6 | 1346.6 | 1045.2 | 1289.8 |
| Pdev. (%) | 93.3 | 85.8 | 68.8 | 103.4 | 106.7 | 110.6 | 85.9 | 105.9 |
Table 2.
The summary of general linear model for onset, end and duration of primary growth (Pgrowth) and secondary growth (Sgrowth) at ESP Rajec and Bily Kriz in different years (2016–2019). df—degrees of freedom, MS—mean squares, F—F value, p—p-value.
Table 2.
The summary of general linear model for onset, end and duration of primary growth (Pgrowth) and secondary growth (Sgrowth) at ESP Rajec and Bily Kriz in different years (2016–2019). df—degrees of freedom, MS—mean squares, F—F value, p—p-value.
| Parameter | Items | df | MS | F | p | |
|---|---|---|---|---|---|---|
| OnsetSGrowth | Locality | 1 | 21.63 | 0.52 | 0.48 | |
| Year | 3 | 428.30 | 10.36 | <0.001 | ||
| Residuals | 30 | 41.36 | ||||
| EndSGrowth | Locality | 1 | 44.64 | 0.25 | 0.62 | |
| Year | 3 | 12805.67 | 71.16 | <0.001 | ||
| Residuals | 30 | 179.95 | ||||
| DurationSGrowth | Locality | 1 | 608.52 | 5.54 | 0.03 | |
| Year | 3 | 8690.59 | 79.15 | <0.001 | ||
| Residuals | 30 | 109.81 | ||||
| OnsetPGrowth | Locality | 1 | 704.17 | 47.88 | <0.001 | |
| Year | 3 | 319.83 | 21.75 | <0.001 | ||
| Residuals | 16 | 14.71 | ||||
| EndPGrowth | Locality | 1 | 541.50 | 20.34 | <0.001 | |
| Year | 3 | 636.94 | 23.92 | <0.001 | ||
| Residuals | 16 | 26.63 | ||||
| DurationPGrowth | Locality | 1 | 10.67 | 0.22 | 0.64 | |
| Year | 3 | 185.00 | 3.84 | 0.03 | ||
| Residuals | 16 | 48.21 | ||||
Table 3.
Mean values and standard deviation (SD) of onset, end and duration of secondary growth (Sgrowth) and primary growth (Pgrowth) at the ESP Rajec and Bily Kriz in 2016–2019.
Table 3.
Mean values and standard deviation (SD) of onset, end and duration of secondary growth (Sgrowth) and primary growth (Pgrowth) at the ESP Rajec and Bily Kriz in 2016–2019.
| Onset | End | Duration | |||||
|---|---|---|---|---|---|---|---|
| Mean (DOY) | SD | Mean (DOY) | SD | Mean (DOY) | SD | ||
| Sgrowth | Bily Kriz | 131.21 | 8.80 | 259.37 | 21.75 | 115.11 | 21.59 |
| Rajec | 132.76 | 8.14 | 271.47 | 68.66 | 138.42 | 63.75 | |
| Pgrowth | Bily Kriz | 142.67 | 5.80 | 197.67 | 11.20 | 55.00 | 8.40 |
| Rajec | 131.83 | 9.93 | 188.17 | 10.80 | 56.33 | 8.42 | |
Publisher’s Note: MDPI stays neutral with regard to jurisdictional claims in published maps and institutional affiliations. |
© 2021 by the authors. Licensee MDPI, Basel, Switzerland. This article is an open access article distributed under the terms and conditions of the Creative Commons Attribution (CC BY) license (https://creativecommons.org/licenses/by/4.0/).
Share and Cite
MDPI and ACS Style
Nezval, O.; Krejza, J.; Bellan, M.; Světlík, J. Asynchrony and Time-Lag between Primary and Secondary Growth of Norway Spruce Growing in Different Elevations. Forests 2021, 12, 627. https://0-doi-org.brum.beds.ac.uk/10.3390/f12050627
AMA Style
Nezval O, Krejza J, Bellan M, Světlík J. Asynchrony and Time-Lag between Primary and Secondary Growth of Norway Spruce Growing in Different Elevations. Forests. 2021; 12(5):627. https://0-doi-org.brum.beds.ac.uk/10.3390/f12050627
Chicago/Turabian StyleNezval, Ondřej, Jan Krejza, Michal Bellan, and Jan Světlík. 2021. "Asynchrony and Time-Lag between Primary and Secondary Growth of Norway Spruce Growing in Different Elevations" Forests 12, no. 5: 627. https://0-doi-org.brum.beds.ac.uk/10.3390/f12050627
Note that from the first issue of 2016, this journal uses article numbers instead of page numbers. See further details here.