1. Introduction
In the last decade, the United Nations Statistics Division (UNSD) has been debating over the System of Environmental-Economic Accounting—Ecosystem Accounting (SEEA EA) as an internationally recognized statistical principles and recommendations for valuation of ecosystem services and environmental assets of the Nature-based economic activities [
1].
The standard System of National Accounts (SNA) limits the measurement of the market final products consumed at basic prices to the wood products (timber, cork, firewood) and non-wood forest products (resin, industrial wild fruits, hunting, livestock market products, and other minor products) harvested in the period along with own-account manufactured fixed investments in forestry improvement (e.g., plantation), construction and equipment in forest areas at national/sub-national scale [
2,
3,
4,
5]. The basic prices are obtained by adding the government compensations (operating subsidies net of taxes on products) to the estimated values at producer prices (market prices). It is accepted that the oak woodland
dehesa (henceforth
dehesa) and conifer forest (henceforth forest) farms provide the owners and society as a whole with non-commercial goods and services which are not registered in accordance with their real value (a value of zero for the net operating margins is assumed) or are completely omitted in the standard SNA. Although the territorial unit for the application of the SNA is national/sub-national, the economic concepts can also be applied at individual farm scale.
Our Agroforestry Accounting System (AAS) approach applied in this research extends the SNA to farm scale in order to tackle the challenge of incorporating the numbers of nature in the total sustainable income at social prices of the individual activities of the case study farms. We define the social prices as the unit values of the final products consumed paid in an observed market transaction or, in the absence of a market, the simulated exchange values (excluding consumer surpluses) of the final products consumed without market prices according to their marginal willingness to pay (MWTP) stated or revealed by the consumers. This AAS research develops recent advances in the valuation methods of simulated transaction prices for final products without market prices consumed [
6,
7].
Previous to this study, we have published results for case studies of farms in which the SNA and AAS methodologies are applied at silvopastoral farm scale in areas with a Mediterranean climate, namely, California, Spain, France, Portugal and Tunisia [
6,
7,
8,
9,
10,
11,
12,
13,
14,
15,
16,
17,
18]. We defined environmental income at environmental prices as the total nature contribution to total income accruing from farm activities net value added and capital gain. We define the environmental price as the unit resource rent. The letter is defined as the depletion (extractions of natural resource in the period) plus operating return of environmental fixed asset [
1].
In the case studies in this research we are interested in comparing the economic valuations under the AAS and our refined standard System of National Accounts (rSNA) in the large dehesa and forest farms with livestock and game species grazing, belonging to non-industrial owners. A non-industrial owner is characterized by the voluntary acceptance of commercial operating margins at basic prices opportunity cost for their manufactured investments below an assumed baseline competitive one in exchange for greater self-consumption of private amenity services (individual private owner) or donation to third parties of non-commercial intermediate products of services which favour the production of public products (private or public institutional owners). These non-business as usual behaviours are explained by the fact that the non-industrial land and livestock owners are assured, in exchange, greater self-consumption of private amenities. The literature reviewed shows that the owners of the large Spanish dehesa, Portuguese montado and Californian ranch farms with woodland of the Quercus genus, as well as those of Pinus forest farms in Corsica and Andalusia, accept market profitability rate from the commercial economic activities below that which would be obtained by selling their farms and investing the financial capital in other alternative non-agrarian assets.
In this study, the AAS and slightly refined SNA (henceforth rSNA) are applied in Andalusia, Spain, to a group of dehesa farms with a predominance of Quercus species, and forest farms where species of the Pinus genus predominate. It is assumed that the case-study farms in this research present the economic rationales and trends of the non-industrial private and public owners of large silvopastoral farms with a predominance of the Quercus and Pinus genera.
The data for the 2010 period in this study come from field work by the authors in the 41 large agrosilvopastoral
dehesa and forest farms under the REnta y CApital de los Montes de ANdalucía (RECAMAN) project and other sources of information provided by the governments of Andalusia and Spain. Furthermore, the
ad hoc surveys that we carried out as part of the RECAMAN project provide an additional source of data employed in the valuations at simulated transaction prices of the case-study farm products without market prices consumed [
19,
20,
21,
22].
The farmers manage 13 of the private activities: timber, cork, firewood, nuts, livestock grazing, conservation forestry, aromatic plants, hunting, commercial recreation, residential, livestock, agricultural crops and amenity. The government is the trustee of society for the 7 public activities: fire services, free access recreation, mushrooms, carbon, landscape, biodiversity and water.
The objective in this study focusses on comparing the dehesa and forest farms incomes, ecosystem service and profitability rates estimates under the AAS at social prices and the rSNA at basic prices for the individual activities, those corresponding to the farmer, the government and the aggregate for the case-study farm activities as a whole. This study compares the results obtained for the same variables under the AAS methodology when the products are valued at producer (market), basic or social prices.
The novelties of this research compared with that of [
16] are that we present the measurements of values added, ecosystem services and profitability rates valued at social prices with the incorporation of non-commercial intermediate products of amenity (ISSnca) and donation (ISSncd) services for the individual activities and the aggregate activities of the farmer, the government and those of the case-study farm as a whole. The incorporation of the ISSnca/d service means that their counterparts of ordinary own non-commercial intermediate consumptions of services (SSncooa/d) are registered at the same time. Other novelties in this research include, on the one hand, the comparisons of the groups of public
dehesa and private forest farms, and on the other, the comparison of the rSNA and AAS methodologies. These latter comparisons underline the sensitivity of
dehesa and forest farms incomes to ownership and prices types.
This research continues in
Section 2 with a brief summary of the biophysical and institutional characteristics of the case-study
dehesa and forest farms.
Section 3 describes the concepts and methods of the AAS and rSNA methodologies applied in the case study.
Section 4 presents the main economic results for income and capital and highlights the contributions of the numbers of nature to the environmental incomes and ecosystem services of the farms.
Section 5 discusses, on the one hand, the strengths and weaknesses of the results for the case-study farms and, on the other, highlights the implications for government policy of the SEEA EA recommendations for voluntary implementation of the measurement of ecosystem services and environmental assets by the offices for statistics and other government departments. Finally,
Section 6 sums up the main results and approach advances of this research.
2. Oak Woodland dehesa and Conifer Forest Farms Case Study in Andalusia
In this section we describe vegetation cover, environment, and institutions settings of dehesa and forest farms case study in Andalusia.
2.1. Dehesa and Forest Farms Vegetation Cover
In the region of Andalusia, species of the
Quercus and
Pinus genera occupy an area of 38.6% and 20.3%, respectively, of the total area of
montes (forests, woodlands, shrubland and permanent grassland) [
20] (
Table S1, p. 67). Among the species of the
Quercus genus, holm oaks (
Quercus ilex L.) and cork oaks (
Quercus suber L.) make up 32.1% and 5.7%, respectively, of the total area of Andalusian
montes. Of the
Pinus species, the most widespread in terms of area are
Pinus halepensis Mill.,
Pinus pinea L.,
Pinus pinaster Ait. and
Pinus nigra Arn., in that order.
Native tree species of the
Quercus genera predominate in the case-study
dehesa farms and
Pinus species predominate in the forest farms. The trees and bushes of the
dehesa farm has been thinned, favouring the areas occupied by
Quercus ilex and
Quercus suber with a tree canopy cover of less than 75% of the wooded area. Trees silvicultural treatments meanwhile, favour timber production given the predominance of
Pinus halepensis,
Pinus pinea,
Pinus pinaster and
Pinus nigra in the forest farms. Henceforth we will refer to the woodland farm with a predominance of areas occupied by
Quercus ilex or
Quercus suber as
dehesa farm and we will distinguish between private and public
dehesa farms. We refer forest farm as the one with a predominance of species of the
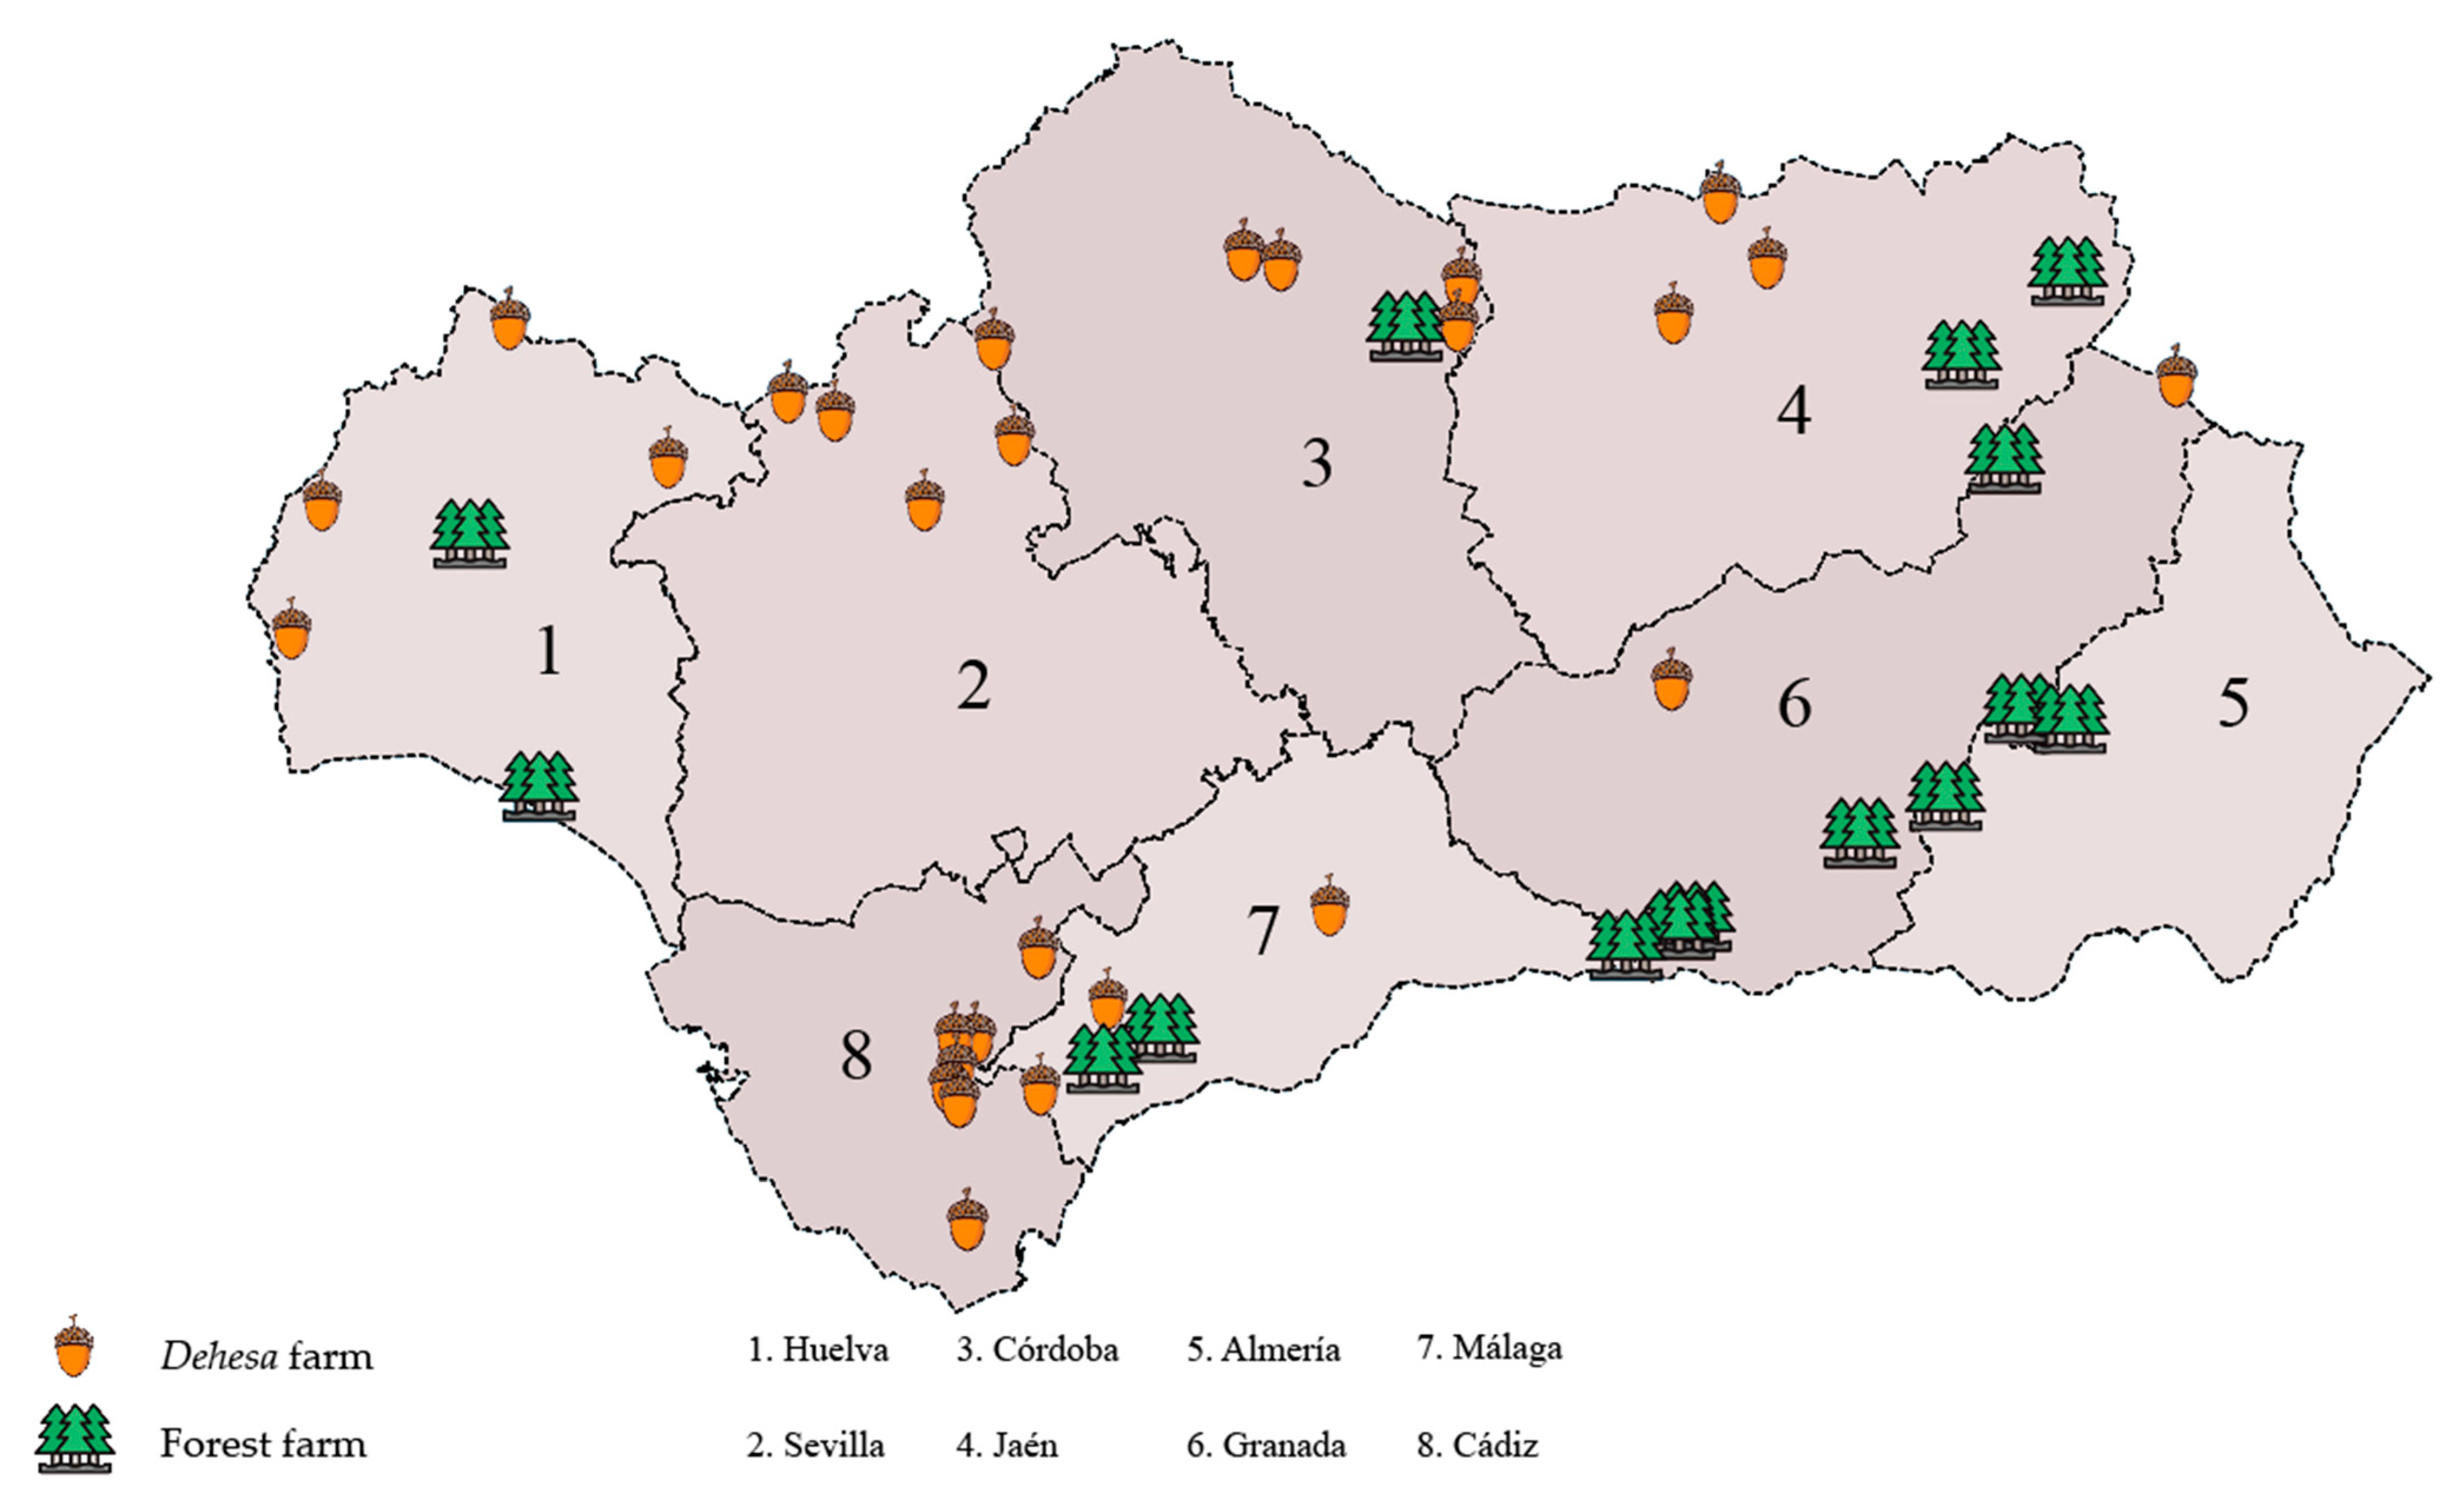
Pinus genus, which we will also separate into private and public forest farms (
Table 1,
Figure 1).
In the private
dehesa of the case study, species of the
Quercus and
Pinus genera cover 77% and 4%, respectively, of the total area (
Table 1). Among the species of the
Quercus genus, holm oaks and cork oaks make up 40% and 20%, respectively, of the total area. In the public
dehesa the area occupied by
Quercus drops to 54% and that occupied by
Pinus rises to 32%. As regards the drop in
Quercus species in the public
dehesa compared to the private
dehesa, the difference is greater in the case of holm oak, which falls to 22% while cork oak falls only slightly to 18% (
Table 1).
In the case-study public forest, species of the
Pinus and
Quercus genera occupy 59% and 5%, respectively of the total area (
Table 1). Of the
Pinus species in the public forests
Pinus pinaster and
Pinus halepensis make up 17% and 13%, respectively, of the total area. In the case of the private forest,
Pinus makes up 70% of the forested area and
Quercus accounts for 17% (
Table 1).
Pinus pinaster and
Pinus pinea make up 2% and 67%, respectively, of the total area of the private forest.
The case-study dehesa and forest farms in this research also have small areas of agriculture, although the most important differences among the farms are those relating to the percentage occupation Quercus and Pinus species. This difference in the percentage contribution of each species among the group of 41 case-study farms and those for the region of Andalusia is one of the reasons why it is not possible to derive any significance in terms of statistical representativeness from the absolute aggregate physical and economic indicators beyond that exclusively relating to the group of case-study farms. However, in the qualitative analysis of the results, the predominant economic trends are considered to be significant for the montes (dehesa and forest farms) of Andalusia and by extension, in general for the Mediterranean montes of Spain.
2.2. Dehesa and Forest Farms Environment and Institutions
While the economic management of forests in temperate climates of the centre and north of Europe is driven by increased growth of timber, in Mediterranean regions, the main drivers in the management of the large dehesa and forest farms are grazing, recreational big game hunting, private amenity services, public recreational services, cultural landscape conservation services and threatened wild biodiversity preservation services. This management is carried out by the farmers and the government in accordance with their respective, regulated responsibilities, as economic owners of the private and public products of the montes, respectively.
The non-industrial individual private owners are those who manage most of the
dehesa farm in which
Quercus species predominate. In contrast, the public municipal owners and the regional government of Andalusia manage most of the native
Pinus forest farm of the case-study in Andalusia. While the species of
Quercus originate from thinning and favouring of vegetation from natural regeneration (with the exception of the afforestation event in the 1990’s financed by the agricultural land set aside of cropland policy program of the European Union Common Agricultural Policy [
23]. At the time the field work was conducted for this research, the results of these one-off plantations of Mediterranean
Quercus, compensated by the government, had not yet been inventoried. The areas of native pines have expanded thanks to historical plantations undertaken by the government and subsequent assisted regeneration of natural vegetation. The
Quercus dehesa farm is usually located in areas of rolling plains whereas the
Pinus farm is generally located in mountain areas at the head of watersheds, with the exception of
Pinus pinea, which is also present on the Atlantic Ocean flat coast of the provinces of Huelva and Cádiz.
The predominance of Quercus in private farms is explained by the fact that, in the past, the provision of the raw materials of pasture, firewood from pruning and cork formed the basis of the open woodland economy. In contrast, public ownership of Pinus forests has historically been associated with plantation and other investment in long rotations, with management also aimed at the production of public interest goods and services, such as the supply of timber, mitigation of damage caused by flooding and protection against soil erosion. Although the public ownership of the pine forests has also been justified by the role of these forests in mitigating soil erosion, there is no scientific consensus on the comparative advantages of trees as opposed to shrub in the mitigation of natural erosion of soils.
The economic trends of the
dehesa and forest farms are notably different as regards the provision of raw materials. Thus, grazing and cork predominate in the
dehesa farm, timber and pine cones in the forest farm. However, both types of silvopastoral farms tend to coincide today with regard to the predominance among the products consumed of non-commercial services (private amenities, public recreation, landscape conservation and preservation of threatened wild biodiversity). These
dehesa and forest farms are also comparable as regards the acceptance, by both private and public owners, non-industrial rationalities of voluntary opportunity costs of their investments in activities which generate commercial products together with other non-commercial intermediate products of amenity (ISSnca) and donation (ISSncd) services. These mainly favour the final products consumed of the private amenity and landscape conservation activities, respectively. The non-industrial private owner (this type of ownership being the most frequent in the case of
dehesa farm), directs mixed economic management towards the rearing of controlled animals (livestock and game species), the extraction of cork and the self-consumption of private amenities. The non-industrial public owner aims management of the forest farm towards the technical and economic management of public recreational services, conservation/improvement of landscape and the preservation of threatened wild biodiversity. The public owner leases the grazing to local family-livestock keepers and hunters´ non-profit associations, thus avoiding cash losses resulting from rearing their own livestock and game using labour employees [
12,
13].
4. Results
We present the same economic indicators for the four groups into which we have classified the 41 case-study dehesa and forest farms. These groups comprise 21 private and five public Quercus open woodland dehesa farms, along with 13 public and two private Pinus forest farms. We prioritize the presentation of the results for the incomes, ecosystem services and profitability rates for the individual activities, those of the farmer, the government and the farms as a whole. The results for total incomes and environmental income include their respective net values added, capital gains and net environmental margins, respectively.
The case-study Quercus dehesa and Pinus forest farms illustrate the trends which they share with their respective genera and ownership types. Due to the small number of public dehesa and private forest farms in the case study, there is a greater degree of uncertainty as regards the robustness of the results in comparison to those for the private dehesa and public forest farms, of which there are a much larger number.
We do not present aggregate physical and economic indicator estimates for the 41 case-study dehesa and forest farms as a whole. We consider that the absolute aggregate results for these case-study farms may not be representative of the possible mean results, weighted by area, for the four groups of farms classified according to ownership types and genera of the trees. Hence, the percentage area per tree species and ownership types does not correspond to their respective percentages at the regional scale of Andalusia.
We first present a summary of grazing consumption, followed by the most noteworthy economic results for the four groups of silvopastoral farms under the AAS. We compare the AAS and rSNA results for the gross values added and ecosystem services in the two case-study farm groups of private dehesa and public forest farms. Finally, we compare the sensitivity of GVA and ES to prices types under the AAS.
4.1. Livestock Stocking Rate and Grazing Consumption of Forage Units
4.1.1. Livestock Stocking Rate
The vegetation in the private and public
dehesas mainly consists of trees of the
Quercus genus along with scrub, pasture and cultivated land, all of which is grazed by controlled livestock and game species during all or part of the accounting period (year) in the case study (
Table 1). The inventories of livestock that graze the
dehesa farms are: 44 LU/km
2 in the private
dehesa and 2.4 LU/km
2 in the public
dehesa (
Table S1).
In the predominantly public and private conifer forest farms, grazing of domestic and game animals mainly occurs in areas not covered by the
Pinus species. Therefore, in these predominantly conifer forest farms it is also the areas of
Quercus woodland, shrub, pasture and cultivated cropland where most of the grazing occurs. The inventories of livestock that graze the forest farms are: 5.9 LU/km
2 in the private farm and 2.0 LU/km
2 in the public farm (
Table S1).
4.1.2. Livestock and Game Species Grazing Forage Unit Consumption
In 2010, the case-study results reveal that consumption of grazing by livestock and game species accounted for 50.4% and 94.5%, respectively, of their total forage unit consumption. Grazing makes up 57.6% and 92.5%, respectively, of the food of inventoried domestic livestock and game species present in the private and public
dehesas (
Table 2,
Tables S2 and S3). Game species consume 49.0% of the grazing and acorns in the private
dehesa and 79.1% in the public
dehesa (
Table 2,
Tables S2 and S3). However, grazing consumption in the private
dehesa is 3.2 times that of the public
dehesa since the area of
Quercus is notably lower in the latter (
Table 2,
Tables S2 and S3). The private
dehesa of
Quercus (PR, OD) is agroforestry farm with considerable consumption of grazing fodder by livestock and a much lower intensity of consumption by game species.
In the public forest farm (PU, PF) there is scarce grazing consumption by controlled animals, with a predominance of game species grazing. Game species consume 51.0% of the total forage units grazed in the public forest farm and 91.0% in the private forest farm (
Table 2,
Tables S4 and S5). The grazed forage unit consumption (FUg) of livestock and game species in the private
dehesa farm (981.4 FUg
PR, OD/ha) is 9.1 times greater than the FUg of the public forest farm (107.9 FUg
PU, PF/ha) (
Table 2,
Tables S2 and S5). The livestock forage unit consumption per unit area (FUg) in the private
dehesa farm (675.1 FUgli
PR, OD/ha) is 10.7 times greater than that of the public forest farm (62.9 FUgli
PU, PF/ha) (
Table 2,
Tables S2 and S5). Game species consume 6.8 times more FUg in the private
dehesa farm (306.3 FUghu
PR, OD/ha) than in the public forest farm (45.1 FUghu
PU, PF/ha) (
Table 2,
Tables S2 and S5).
4.2. Net Values Added
The case study total products (TP) of the
dehesa and forest farms have intermediate products (IP) embedded in the final product consumed (FPc). This double counting does not affect the estimates of farm values added as the double counting of the intermediate product is neutralised by the recording of the ordinary own intermediate consumption (
Table 3). However, measurements of the individual activities intermediate products and ordinary own intermediate consumption are required to estimate their ordinary net operating margins assumed to be competitive as a lower bound. In addition, there are activities whose intermediate products constitute the main contribution of the activity to the total product (e.g., grazing, residential service, conservation forestry service, fire service).
Total product (TP) incorporates the sum of all the factors of production employed in its generation. The sequence of the process of the creation of total product starts with intermediate consumption (IC) which is manufactured through the contributions of the services of human labour (LC) and the user cost of fixed capital. The latter are composed of the consumption of fixed capital (CFC) and net operating margin (NOM). The change in the value of intermediate consumption constitutes the gross value added (GVA) embedded in total product (
Table 3). The operating income is represented by the net value added (NVA) which is estimated by subtracting the consumption of fixed capital from the GVA (
Table 3).
The production and generation of income account has among its factors of production of the total products of the farms the components of the resource rents provided free by nature (ecosystem services). These components of ecosystem services are represented in the case study of
dehesa and forest farms by the environmental works in progress used (WPeu) and the environmental net operating margins (NOMeo) (
Table 3).
Farms grouped by vegetation of oak woodlands
dehesa and conifer forest farms, and private and public landowner types offer contrastingly different results (
Table 3). However, the differences between the vegetation types are influenced by the locations of mostly oak woodland
dehesa farms in the sierra areas of eastern Andalusia (
Figure 1).
From the application of the production and income generation account of society represented by the AAS methodology, the perceptions of policy makers and academic experts represented in the quotes [
26,
29] are confirmed in the results derived from the application of the AAS methodology in the four groups of
dehesa and forest farms in the Andalusia case study (
Table 3). Thus, the predominance of environmental services among the final products consumed from the forests is indisputable. This is also true for the contributions of environmental net operating margins in all farm types (
Table 3). However, the results of this account of society is the result of the economic agents’ behaviour represented by the owners and governments independently taking the risks of manufactured capital investments in the productive management of the economic activities of the case study
dehesa and forest farms. It is from this perspective of the economic rationality of the institutional sectors of owners and governments that we are interested in describing the economic results of the case study of the Andalusian
dehesa and forest farms.
In all the case-study
dehesa and forest farms measured under the AAS, market final products consumed are minor products ranging from 6% lower bound to 29% upper bound of final product consumption in publicly-owned forest farms and privately-owned
dehesa farms, respectively (
Table 3). The net value added of wood products of the forest only contributes 1.2% lower bound to 8.6% upper bound to the net value added of the farm in the privately-owned forest farm and privately-owned
dehesa farm, respectively (
Table 4).
4.2.1. Dehesa Farm
In the large privately-owned
dehesa of the case-study, cork contributes 45.8 €/ha to the farmer net value added at social prices of 377.9 €/ha (
Table 4 and
Table S6). The net value added of the activities of grazing, livestock rearing and hunting is de 188.3 €/ha, which is only 1.6 times greater than the 119.1 €/ha corresponding to the private amenity activity (
Table 4 and
Table S6). The farmer net value added is 1.6 times that of the government activities (230.9 €/ha). The net value added corresponding to the government makes up 37.9% of the total net value added of 608.8 €/ha for the private
dehesa (
Table 4 and
Table S6). The net values added of the government activities, from largest to smallest contributions, are those of the water, landscape conservation, carbon, firefighting services and recreational activities. However, mushroom picking and the threatened wild biodiversity preservation services are also of importance in the private
dehesa (
Table 4 and
Table S6).
In the private
dehesa the net operating margin makes up 76.3% of the total net value added. Labour compensation account for 28.2%, 17.3% and 24.1% of the net values added of the farmer, government and private
dehesa farm as a whole, respectively (
Table 4 and
Table S6). Cork, livestock and hunting make up 15.1%, 42.5% and 13.6%, respectively, of the labour cost of the farmer. The farmer employs most of the labour, the compensation of which is 2.7 times greater than the government compensation for labour (
Table 4 and
Table S6). Employee labour compensation makes up 98.3% of the total labour compensation.
The net values added at social prices for the owners of large public
dehesa is only 20.3% of the average for those of private
dehesa (
Table 4,
Tables S6 and S7). This is due to the lower contribution of cork, the very low value for consumed grazing products as a result of the scarce livestock herds which graze in the public
dehesa, and particularly because of the absence of private amenity net valued added (
Table 4 and
Table S7). In contrast, the net values added for the public activities managed either directly by the government or through contracted companies are 1.8 times greater than the respective average net values added per hectare of the private
dehesa (
Table 4,
Tables S6 and S7). This latter result is due to environmental conditions of greater water production and consumption of landscape conservation, public recreation and carbon activities (
Table 4 and
Table S7). Despite the lower net values added of the farmer and the higher government net values added, the total net value added per hectare in the public
dehesa is 80.6% that of the private
dehesa (
Table 4,
Tables S6 and S7).
4.2.2. Forest Farm
In the case-study large publicly-owned forest farm the timber, hunting and conservation forestry activities generate similar net values added, making up 82.2% of the net values added of the farmer at social prices of 41.7 €/ha (
Table 4 and
Table S8). The net values added of the grazing consumed by livestock are almost non-existent. However, the ecosystem service of game species in the case-study forest farm may be similar to the value for grazing consumption by these species in the period. Thus, the “virtual” net value added of the grazing consumed by controlled animals (livestock and game) amounts to 6.8 €/ha (
Table S8). The net value added at social prices for government activities in the public forest is 6.6 times greater than that of the farmers. The government activities, with a net value added of 275.8 €/ha, account for 86.9% of the total net value added at social prices of 317.5 €/ha, on average, for the public forest (
Table 3 and
Table S8). The net values added for public activities from largest to smallest amounts are: public recreation services, landscape conservation services, water, carbon, firefighting services, threatened wild biodiversity preserservation services and mushrooms (
Table 4 and
Table S8).
In the public forest, the net operating margin accounts for 77.6% of the total net value added of the farm. Labour compensations of the farmer, government and farm as a whole make up 52.2%, 17.8% and 22.4%, respectively, of the net values added (
Table 4 and
Table S8). The conservation forestry, timber and hunting activities make up 53.8%, 19.1% and 15.0%, respectively, of the labour compensation of the farmer, which is 21.8 €/ha. The labour compensation of the government activities is 2.3 times that of the farmer activities (
Table 4 and
Table S8). Employee labour accounts for 97.0% of the total labour compensation of the public forest.
The case-study private forest farm generates net values added for the farmer which are 3.1 times those corresponding to the government (
Table 4 and
Table S9). This is due to the notably higher contributions to the net values added of livestock farming, hunting, grazing, pine cones and agricultural crops among the commercial products and particularly, due to the private amenity activity (
Table 4 and
Table S9). The environmental conditions in the private forest farm mean lower production of water, landscape conservation, public recreation and threatened wild biodiversity preservation activities (
Table 4 and
Table S9). The private forest farm generates a total net value added per hectare which is 1.3 times that of the public forest farm (
Table 4,
Tables S8 and S9).
4.3. Ecosystem Service
Ecosystem services (ES) of wood forest products contribute with only small 0.5 €/ha and 1.9 €/ha to the final product consumed from publicly and privately owned forest farms, respectively. While the ES of wood forest products contribute to 3.6% and 5.0% to the final products consumed from publicly and privately owned
dehesa farms, respectively (
Table 3 and
Table 5). In relative terms, the ecosystem services of wood forest products account for 10.6% and 5.0% of the ecosystem services of private and public
dehesa farms, respectively (
Table 5). In these farms, it is cork harvesting that explains the main contributions of ecosystem services of wood forest products to the final products consumed and ecosystem services of all activities on the
dehesa farms.
4.3.1. Dehesa Farm
In the privately-owned
dehesa, the contribution of the
ecosystem service (ES) to the final products consumed, from highest to lowest in absolute values per unit area, are: private amenity, stored natural water, carbon, landscape conservation, cork, hunting, recreation, mushrooms, grazing, threatened wild biodiversity preservation and firewood (
Table 5 and
Table S6).
In the private
dehesa the cultural ecosystem services are notably greater than the supply and regulation-maintenance services. The cultural services (hunting, private amenity and open-access recreation) account for 40.9% of the total ecosystem services of the private
dehesa, the provisioning services (cork, firewood, grazing, mushrooms and water) make up 32.8% and the regulation-maintenance services (landscape, biodiversity and carbon) account for 26.3% (
Table 5 and
Table S6). The contributions of the ecosystem services corresponding to the farmer and the government are similar. Cultural services predominate in the farmer activities and regulation-maintenance services in the case of the government.
In the case-study private
dehesa, grazing consumption by game species exceeds that of the livestock species and 81.5% of the forage units consumed by game species have been valued at a price of zero (
Table S2). Attributing the origin of the game species ecosystem service to the grazing is justified by its “free” consumption being a necessary condition of “wild” rearing. Thus, the controlled animals (game and livestock species) are the receivers of the ecosystem services of grazing embedded in the environmental lease prices estimated from the leasehold livestock grazing market and the game captures by recreational hunting operators. By considering both the lease prices and then subtracting the manufactured costs the resource rents (ecosystem services) are obtained which account for 19.9% of the ecosystem services of the farmer activities.
The public
dehesa regulation-maintenance services make up 41.7% of the ecosystem services, while the provisioning and cultural services only account for 35.0% and 23.3%, respectively (
Table S7). The contributions of the farmer and government to the ecosystem services of the farm are 8.4% and 91.6%, respectively (
Table 5 and
Table S7).
4.3.2. Forest Farm
In the public forest farm the contribution of the ecosystem services (ES) to the final products consumed, in order of magnitude, are: recreation service, carbon service, landscape conservation service, stored natural water, threatened wild biodiversity preservation service, hunting service, mushroom picking, timber, grazing, collection of aromatic plants and industrial edible fruit (pine nuts) (
Table 5 and
Table S8).
In the public forest the regulation-maintenance services make up 49.6% of the ecosystem services of the forest, while the cultural and provisioning services account for considerably less at 22.2% and 28.2%, respectively (
Table 5 and
Table S8). The ecosystem services corresponding to the farmer account for 3.6% and those of the government 96.4% of the forest ES. Provisioning services make up the main part of the farmer ES, whereas regulation-maintenance services predominate among the government ES.
In the public forest the consumption of grazing by livestock is slightly higher than that of game species. 98.9% of the forage units consumed by the game species has been valued at a price of zero (
Table S5). Thus, the ecosystem services of livestock grazing and game species captures, according to their opening inventory value, make up 73.1% of the farmer ecosystem services attributable to livestock grazing observed in the markets and of livestock species, assuming a substitutive value for the ES of the game captures (
Table 5 and
Table S8).
In the privately-owned forest farm, the cultural ecosystem services make up 70.6% of the ecosystem services while the provisioning and the regulation-maintenance services account for 12.3% and 17.1%, respectively (
Table 5 and
Table S9). The contribution of the farmer to these ecosystem services of the privately-owned forest is 73.9% and that of the government is 26.1%. Cultural ecosystem services are the main farmer services and regulation-maintenance services are the main ones corresponding to the government (
Table 5 and
Table S9).
4.4. Contribution of Environmental Income to the Total Income of Society
The total sustainable income of society from the case-study
dehesa and forest farms is the most important synthetic variable of all the economic indicators estimated. The total sustainable income incorporates the net value added and the gain/loss of capital (GC) at the closing of the period. Furthermore, the GC corrects the limitations of the net value added caused by the double counting of natural growth and carbon fixation. Therefore, the total income includes the income from capital, which represents the upper bound sustainable consumption of products obtained by the
dehesa and forest farms from the total immobilized capital investment measured under the rSNA and AAS, respectively (presented in detail in
Tables S10–S13 and S14–S17). The environmental asset gain (EAg) is the concept which reflects the profit from nature additional to the environmental net operating margin (NOMe) obtained by the owners due to the revaluations associated with the reduction by one period in the number of discount periods for the inventoried woody and game species environmental assets, unexpected changes of environmental prices at opening period, extraordinary destructions and instrumental adjustments.
No extraordinary destructions of capital have taken place with the exception of livestock head natural mortality, and the greater effect on the capital gain is due to the negative change of the land prices, which results in a negative value for the capital gain (loss of capital). This is not of particular importance as the investment rationale of the owners of large silvopastoral
dehesa and forest farms tends towards bequeathing the farms to their descendants in the case of the private owners and to society as a whole in the case of public owners. Over periods of several years the land prices of the case-study farms present moderately positive trends in real terms [
16].
The capital balance account (presented in detail in
Tables S18–S21) is where the instrumental adjustments are registered which avoid double counting due to depreciations of fixed capital (fixed capital consumption) considered in the estimates of net operating surpluses by rSNA and margins by AAS as well as implicitly in the closing fixed capital of the period. Additionally, the adjustments of the opening environmental values are registered for natural growth of woody products and carbon final product consumed (net fixation of destruction due to catastrophic fires anticipated in accordance with their historic rates).
4.4.1. Dehesa Farm
The environmental income (EI) of the private
dehesa makes up 60.6% of the total income of 426.8 €/ha (
Table 6,
Table 7, and
Table S6). Cork and hunting account for 90.8% of the environmental income of 196.1€/ha from the commercial products of the private
dehesa and exceed the negative environmental income of the farmer private amenity of −90.0 €/ha (
Table 6 and
Table S6). In the case of the government activities the negative value for the environmental asset of carbon reduces the environmental income to a value close to zero (
Table 7 and
Table S6). Water and landscape make up 72.2% of the government environmental income (
Table 6 and
Table S6). The environmental incomes of the farmer activities are 30.4% lower than those of the government activities in the private
dehesa. If we omit the effect of the variation in land prices, the contributions of the farmer activities would be greater than that of the government. The decrease in the price of land of −209.1 €/ha is the main reason for the negative value of −182.0 €/ha estimated for the capital gain (
Table 7 and
Table S6). The result at the end of the period is that the negative capital gain reduces the total income to 70.1% of the net value added at social prices in the private
dehesa (
Table 7 and
Table S6).
The environmental income of the public
dehesa makes up 68.6% of the total income of 312.2 €/ha (
Table 6 and
Table S7). In the publicly-owned
dehesa the absence of final product consumed of landowner private amenities does not prevent the existence of the environmental asset gain since the hypothesis has been assumed that the public owner has the option to sell the farm under competitive market conditions. The cork and hunting activities account for 87.6% of the environmental incomes of 137.1 €/ha, from the commercial products of the public
dehesa. The environmental income from the commercial products is less than the negative environmental income from the publicly-owned
dehesa private amenity, which is −239.2 €/ha (
Table 6 and
Table S7). The negative value of for the environmental asset gain of carbon reduces the environmental income of this activity to a slightly positive value of 16.6 €/ha (
Table 7 and
Table S7). Water, recreation service and landscape make up 84.4% of the environmental income of 316.4 €/ha for the government activities (
Table 6 and
Table S7).
In the public
dehesa, the negative environmental income for the aggregate individual activities of the farmer and the positive values for the government activities, explain the fact that the environmental income of 214.3 €/ha is 54.9% of the environmental net operating margin of 390.6 €/ha (
Table 6 and
Table S7).
If we omit the effect of the variation in land prices, the aggregate environmental income for the public
dehesa reaches an absolute value of 453.5 €/ha, which is more than double the estimated value assuming that the public
dehesa can be sold on the competitive land market. The decrease in the price of land is the main reason for the negative value of −178.6 €/ha estimated for the capital gain (
Table 7 and
Table S7). The result at the end of the period is that the negative capital gain reduces the total income to 63.6% of the net value added of the public
dehesa at social prices (
Table 7).
4.4.2. Forest Farm
As described in the case of the public
dehesa, the absence of the private amenity final product consumed of landowner does not prevent the existence of the environmental asset gain in the public forest farm since the hypothesis has been assumed that the public owner has the option to sell the farm under competitive market conditions. The environmental income of the publicly-owned forest farm makes up 52.9% of the total income of 158.4 €/ha (
Table 6 and
Table S8). Timber and hunting account for 92.7% of the environmental income of 47.7 €/ha for the commercial products of the public forest farm. The value of these commercial products is less than the negative environmental income of the farmer private amenities of −178.8 €/ha, which is why the environmental income of the farmer is negative, at −131.6 €/ha (
Table 6 and
Table S8). The recreation service, landscape and water make up 79.5% of the total environmental income of the government of 215.0 €/ha (
Table 6 and
Table S8). The negative environmental income for the aggregate individual activities of the farmer and the positive values for the government activities, explain the fact that the environmental income of 83.9 €/ha is 35.2% of the environmental net operating margin of 238.2 €/ha (
Table 6 and
Table S8). If we omit the effect of the variation in the prices of land, the aggregate environmental income for the public forest reaches an absolute value of 262.7 €/ha, which is 3.1 times greater than the estimated value assuming that the public
dehesa can be sold on the competitive land market. The drop in the price of land is the main reason for the negative value of −159.1 €/ha estimated for the capital gain (
Table 7 and
Table S8). The result at the end of the period is that the negative capital gain reduces the total income to 49.9% of the net value added of the public forest farm (
Table 7 and
Table S8).
The environmental income of the private forest accounts for 69.1% of the total income, which is 169.2 €/ha (
Table 6 and
Table S9). Timber and grazing make up 78.2% of the environmental income of the commercial products of the private forest, with a value of 21.5 €/ha. This environmental income is slightly lower than the environmental income of the farmer private amenity of 69.6 €/ha (
Table 6 and
Table S9). Water and mushrooms make up 98.2% of the environmental income of the government (
Table 6 and
Table S9). The value of the environmental income of landscape is zero and that of carbon is moderately negative (
Table 6 and
Table S9). The environmental income of the activities of the farmer is 3.5 times greater than that of the government. The fall in the price of land of −161.0 €/ha underlies the negative value of −258.3€/ha estimated for the capital gain (
Table 7 and
Table S9). The result at the end of the period is that the negative capital gain reduces the total income to 39.6% of the net value added of the privately-owned forest farm.
4.5. Profitability Rates under AAS and rSNA
4.5.1. Profitability Rates under AAS
The operating profitability rates (Po) of the wood products measured by the AAS vary between the lower bound of 0.9% and the upper bound of 1.8% in the public forest farm and the private
dehesa, respectively (
Table 8). The total profitability rates (P) of the wood forest products are significantly higher than those of the Po, with the lower bound of 4.4% and the upper bound of 8.7% in the private forest and private
dehesa, respectively (
Table 8).
As for the economic activities of the farms as a whole, the AAS measures operating profitability rates of 2% at the lower bound and 4.9% at the upper bound for the public and private forest farms, respectively (
Table 8). Total farm profitability rates vary between a lower bound of 0.7% and an upper bound of 2.2% for public forest and private
dehesa farms (
Table 8).
Dehesa Farm
In the private
dehesa the operating profitability rate (Po) of the farmer may approximately reflect a minimum of the long-term real total profitability rate (
Table 8). In 2010, the negative variations in the market prices of the construction, equipment and land led to negative capital gain profitability rates (Pg) for the economic activities, with the exception of activities with work in progress due to the effect of the revaluations and the limited employment of inanimate manufactured fixed capital (
Table 8). The profitability of the private
dehesa mainly comes from the private amenity and landscape activities. The private amenity activity demands as inputs, ordinary own non-commercial intermediate consumption of private amenity services (SSncooa) to a value of 178.9 €/ha (
Table S10). The landscape activity demands non-commercial intermediate products of compensation services (ISSncc) to a value of 37.9 €/ha (
Table S10).
The total profitability rate of the farmer is notably lower than the total for the private
dehesa as a whole. The total profitability rate for the government activities is greater than the total profitability rate for the private
dehesa. These results are mainly due to the lower influence of the estimated capital gains (
Table 8). The results for the farmer and government activities as a whole reveal that the observed prices in the market and simulated transactions give competitive operating profitability rates for the farmer and government. For all the activities as a whole, the aggregate operating and total (P) profitability rates are 3.7% and 2.2%, respectively (
Table 8).
The operating (Po) and total (P) profitability rates of the public
dehesa are lower than those of the private
dehesa. In this case it is due to the absence of the private amenity service final product consumed, and to the effect of lower profitability rates of negative capital gain (Pg) (
Table 8). Details for immobilized capital by activity on
dehesas with livestock presence by activity in Andalusia can be found in
Tables S22, S23 and S26.
Forest Farm
The profitability rate of the public forest farm mainly comes from the government activities (
Table 8). The aggregate profitability rate of the government activities is notably greater than that of the farmer. The result as regards the aggregate products of the government activities is a competitive operating profitability rate (Po), although the total profitability rate is not competitive (
Table 8).
In the case of the private forest, the profitability rate for the government activities is slightly higher than that for the farmer activities. The operating profitability rates (Po) for both the farmer and government are higher than assumed baseline competitive operating profitability at 4.8% and 5.5%, respectively. The total profitability rates (P) are not competitive (
Table 8).
Details for immobilized capital by activity on forest farms with livestock presence by activity in Andalusia can be found in
Tables S24–S26.
4.5.2. Comparing Profitability Rates under the rSNA and AAS
The operating profitability rates for the wood products of the privately-owned
dehesa farm estimated by the rSNA and AAS coincide, while in the case of the publicly-owned forest farm the AAS estimates are significantly higher (
Table 8). The total profitability rates for wood products of privately-owned
dehesa farms estimated by the rSNA and AAS coincide, while for the publicly-owned forest farm the AAS estimates are slightly higher (
Table 8).
For all the activities of the case-study farms, the operating profitability rates under the AAS for the privately-owned
dehesa significantly exceed those estimated by the rSNA (
Table 8). In contrast, the total profitability rates for activities measured by the AAS are significantly lower than those estimated by the rSNA (
Table 8).
The reason for the difference in the operating profitability rate measurements under the AAS and rSNA for privately-owned
dehesa farms is due to the incorporation of the environmental margin of the private amenity in the AAS. The total profitability rate for the publicly-owned forest farm estimated under the rSNA is different from that estimated by the AAS due to the inclusion of own ordinary non-commercial intermediate consumption of services in the AAS (
Table 8).
4.6. Comparing Incomes and Ecosystem Services under the rSNA and AAS
The gross values added (GVA) differences between the rSNA and AAS in this research are due exclusively to the estimation of the gross operating surplus (GOS) in the rSNA and the gross operating margin (GOM) in the AAS. The final products of services without market prices consumed, measured under the AAS account for 78.9% and 78.5% of the net values added of the case-study private dehesa and the public forest farms, respectively.
Livestock rearing in the private dehesa and public forest farms makes up 30.9% and 0.9% respectively, of the labour compensation for the farm activities as a whole measured by the rSNA and AAS.
The ecosystem services measured by the AAS for the private
dehesa and public forest are more than 4.6 and 2.7 times those measured by the rSNA, respectively (
Table 9).
The total incomes measured by the AAS for the private dehesa and public forest farms are more than 2.6 and 1.3 times the net values added estimated by the rSNA, respectively.
The environmental incomes measured by the AAS for the private dehesa and public forest farms make up 60.6% and 52.9% of their respective total incomes. The aggregate landscape and water activities incorporate 61.8% and 41.3% of the environmental incomes of the government in the dehesa and forest farms, respectively.
The rSNA and AAS results at basic and at social prices, respectively, are described below in the form of gross values added (GVA) and ecosystem services (ES). We omit the comparison of total incomes as these are not incorporated in the rSNA (
Table 9,
Tables S10–S13, S14–S17). However, it would be possible from the rSNA production and capital balance accounts to also simulate the measurement of total income of the ISIC commercial products of the farmer registered in the case-study
dehesa and forest farms.
4.6.1. Gross Values Added
The AAS methodology proves the consistency of the estimation of values added at social prices for the aggregate activities of the case-study
dehesa and forest farms. The gross values added obtained at social prices coincide with the observed and simulated market transaction values at producer and basic prices (
Table 9). Under the rSNA, the producer prices and basic prices also coincide. However, the values added of the individual activities of the farmer and the government can be affected by the type of price applied.
The comparisons of the estimates of gross values added under the AAS and rSNA reveal notable differences with changes in the type of price applied to the common activities and the incorporation of the carbon activity in the AAS. The main cause of these differences is the substitution of the cost prices in the rSNA for the simulated transaction prices applied in the AAS to the final products without market prices consumed.
Dehesa Farm
In the case of the private
dehesa, the AAS estimates of gross values added (GVA) of the livestock and hunting activities reveal that the application of social prices multiplies the results obtained at basic prices by 4.2 and 10.3, respectively (
Table 9). The GVA of the individual activities of the government at social and basic prices do not change (
Table 9). Neither does the results for the GVA corresponding to the farmer and to the farm as a whole estimated at social or basic prices.
The comparison of the GVA for livestock and hunting activities at social prices in the AAS and at basic prices in the rSNA reveals that the AAS estimates values of 92.3 €/ha and 53.5 €/ha, which contrast with the rSNA results of −24.4 €/ha and 5.1 €/ha, respectively (
Table S14). The GVA of the recreation and landscape conservation service activities estimated at the same prices by the AAS are 4.3 and 5.9 times, respectively, those estimated by the rSNA (
Table 9). There are notable differences in the GVA at social prices under the AAS and at basic prices under the rSNA for the aggregate activities of the farmer, the government and the private
dehesa farm as a whole, the AAS values being 4.3, 2.2 and 3.2 times greater, respectively (
Table 9).
Forest Farm
In the public forest, the AAS estimates of the GVA of livestock, hunting and aggregate activities of the farmer show than the results at social prices are 2.2, 2.5 and 1.4 times, respectively, the values at social prices (
Table 9). The GVA of the landscape conservation service activity is slightly lower at basic prices than at social prices as the latter incorporates own ordinary non-commercial intermediate consumption of public owner donations (SSncood) (
Table 9). However, the slight change in the landscape activity is insufficient to change the results for the GVA of the government and public forest farm as a whole estimated at social or basic prices (
Table 9).
The comparisons of the GVA estimates for the livestock and hunting activities at social prices in the AAS and basic prices in the rSNA show that the AAS estimates values 6.0 and 3.2 times greater, respectively, than those of the rSNA (
Table 9 and
Table S17). The GVA estimated at the same prices for the recreation and landscape conservation activities under the AAS are 7.7 and 5.4 times greater, respectively, than those estimated by the rSNA (
Table 9). There are notable differences in the GVA at social prices under the AAS and at basic prices in the rSNA for the aggregate activities of the farmer, the government and the public forest farm as a whole, the AAS values being 1.7, 3.0 and 2.7 times greater than those of the rSNA, respectively (
Table 9).
4.6.2. Ecosystem Services
Dehesa Farm
The value for the ecosystem service (ES) of the private amenity activity in the private
dehesa measured, the product consumed, at social prices under the AAS is 60% lower than its value at basic prices. The rSNA values the ES of activities without market prices at a price of zero, which is the case of the amenity, recreation, landscape and threatened biodiversity activities (
Table 9).
The ecosystem service values for the aggregate activities of the farmer, the government and the private
dehesa farm, as a whole, presents notable differences depending on whether the social prices of the AAS product consumed or the basic prices of the rSNA is applied. Under the AAS, the ES values for the farmer, the government and the private
dehesa as a whole are 2.4, 3.0 and 2.7 times greater, respectively, than those of the rSNA (
Table 9).
Forest Farm
In the case of the public forest, the AAS valuations at social and basic prices of products consumed, the ecosystem services valuations of the landscape conservation service and threatened wild biodiversity preservation service activities coincide (
Table 9). The rSNA valuation of the mushroom activity ecosystem service coincides with that of the AAS. The ES of water with market prices is 20% higher when estimated by the AAS then by the rSNA (
Table 9). The difference is due to the assumption in the rSNA that the water consumed by manufacturing industry, services and households only incorporates manufactured operating surplus.
Under the AAS at social prices valuations of products consumed, the ecosystem service values for the aggregate activities of the government and the public -forest as a whole are 5.3 and 4.6 times, respectively, those of the rSNA at basic prices valuations of products consumed, while the values for the ES of the farmer activities coincide under the two methodologies (
Table 9).
5. Discussion
The natural biological productivity associated with natural growth and grazing fodder in the dehesa and forest farms is strongly conditioned by the variability in the bio-physical characteristics of the environment, which have not been taken into account in this study. The discussion in this case focuses on comparing the economic results for the case-study dehesa and forest farms. The economic results provide valuable information on which to base not only the management of the farms by the owners but also the design and implementation of public policies. Among these policies, those which address landscape conservation service, and the preservation service of threatened wild natural variety are of particular relevance nowadays. Particular emphasis has been focused on the discussion of physical production of grazing, values added and the ecosystem services of the economic activities of the case-study dehesa and forest farms.
5.1. Trade-Off between Grazing and Natural Regeneration of Wood Forests Products
Extensive livestock grazing has scarce impact on the regeneration of trees of the Pinus genus, although it does affect plants of the Quercus genus and other herbaceous vegetation. In recent decades the impact of traditional grazing of livestock species has intensified along with the natural expansion and re-introduction of large game species in the case-study private dehesa, where the tree canopy covers 83% of the farm area, accentuating the lack of new recruitment from natural regeneration.
Government policies in Spain have generally been aimed at dissuading extensive livestock rearing in Mediterranean conifer forests in order to favour natural regeneration and protect young plantations. At the same time, the Spanish governments, in the past, had actively incentivized deforestation in species of the Quercus genus in order to “improve” natural productivity of grazing fodder in the dehesa. Even today, there is a continued absence of government policy to compensate concerted action to temporarily restrict grazing in the dehesa.
The application of agro-environmental measures in the private
dehesa under the Common Agricultural Policy (CAP), aimed at the conservation of trees of the
Quercus species and the mitigation of biodiversity loss is based in setting upper bound livestock stocking rate. In practice the lack of oak trees regeneration is not the livestock stocking rate intensity but rather the absence of temporary exclusion of livestock grazing in areas with programmed tree regeneration [
30]. In addition to livestock grazing, grazing of large game species in the
dehesas using wire-fenced enclosure can mean catastrophic degradation of the bushy vegetation of young trees and scrub.
5.2. Values Added Shortcomings Mitigation Challanges
In the description of results, the limitations of the measurements of the values added of the rSNA and AAS methodologies applied in the case study of dehesa and forest have been highlighted.
The limitation of the rSNA valuation of the gross operating surpluses at basic prices is due to the omission of the environmental work in progress used (WPeu) in the intermediate consumption and the natural growth (NG) at the close of the period in the gross capital formation (GCF) of wood forest products.
The AAS does not solve the problem of measuring environmental gross operating margins biases due to the incorporation of natural growth and the simulated final product consumed of carbon sequestration.
In the case-study dehesa and forest farms, an element that differentiates the respective values added to a large extent is the private amenity self-consumed only by the private owners. As the public owners of the dehesa and forest farms are legal (virtual) entities, they cannot self-consume private amenities. Another forestry conservation activity related aspect to be borne in mind is that forests re-naturalized through natural regeneration processes subsequent to the historical plantation, more recent planned public reforestations of stone pine and the mountain orography provide environmental services; these being production factors with a notable contribution to the net values added of the recreation and landscape conservation services of the forest farms. These net values added are notably higher than those of the private dehesa, which are located in lowland areas of rolling hills or plains.
In terms of the contribution of nature, the net value added is highly important because if we admit the technical f function in the total product equation (see Equation (1)), it shows (prior to introducing the price system in the f function) all the appropriate production factors for which a monetary numeraire equal to or greater than zero could be incorporated. If the environmental production factors of an individual total product consumed, j, have a price of zero, then the ecosystem service does not contribute to the economic value of the product. However, its environmental biological function informs us that the environmental production factors are the prior condition to the existence of the manufactured economic value of the product consumed. Thus, the labour compensation and manufactured investment cost which give rise to the economic value of the products consumed of the silvopastoral montes farms are fully reflected in the total product consumed and not by the economic ecosystem services. This is due to the fact that the existence of these ecosystem services, given consumer preferences, is related to the ownership institutions and other local institutional factors. A transaction value of zero rarely contributes much to the value of a product consumed, the existence of which may be due precisely to the fact that the market does not give an exchange value to environmental production factors.
5.3. Ecosystem Services
The ecosystem service values in the case-study dehesa and forest farms are registered for 14 activities. It is only in the case of agricultural crop products that the values do not reach the minimum exchange value of 0.1€/ha necessary to be registered. The residential service, recreation service, livestock, conservation forestry service and forest firefighting service activities do not register environmental production factors in this research.
The differences in the ecosystem service estimates of the AAS and rSNA are mainly due to the application of cost prices and social prices, respectively, in the estimation of final products without market prices consumed, and to the omission of the carbon activity by the rSNA.
The decisive factor underlying the difference in the absolute value of the ecosystem services per unit area of the large case-study dehesa and forest farms is the absence of self-consumption of private amenity services in the publicly-owned dehesa and forest farms. This absence of private amenity self-consumption in the public dehesa is partially counterbalanced by the greater production of open-access recreation and carbon services in comparison to the private dehesa.
5.4. Comparing Incomes and Ecosystem Services under the rSNA and AAS
As reported in the results for the case-study dehesa and forest farms, the rSNA estimates omit most of the income of both the farmer and government if compared to the AAS estimates. The differences in the results obtained in the applications of the rSNA and AAS methodologies to the case-study dehesa and forest farms evidence the fact that the values of the incomes and ecosystem services are poorly reflected in the rSNA measurements. In contrast, the subjective measurements of the AAS methodology in the application to the case-study dehesa and forest farms have been shown to be consistent with the concept of total sustainable income of society.
5.5. Policy Implications for Overcoming Refined Standard Economic Accounts of Society Shortocoming Applied to dehesa and Forest Farms
In the dehesa and forest farms there is substantial demand for self-consumption of private amenities, which is only taken advantage of in the privately-owned farm. Since the private amenity service is not applicable in the public dehesa and forest farms, the larger production of open-access recreation and carbon services may potentially compensate for the absence of private amenity production. Thus, from the perspective of cultural ecosystem service production, the possible change in the type of ownership of a farm could be positive or negative where, in practice, there is an exchange between private amenities and open-access recreation services.
The refined standard economic accounts of society (rSNA) presents the measurement of the value added of the International Standard Industries Classification (ISIC) economic activities at national level as equivalent to the total income. This is inconsistent with the theoretical concept of national income acknowledged in the official methodological guidelines for the economic accounts of agriculture and forestry, which estimate the income from products in the ISIC list (codes 01 and 02) of the European Union [
3]. The inconsistencies of the rSNA are due in part to the fact that it does not recognize the environmental assets as production factors when they lack manufactured production factors, as well as to the arbitrary assumption that the final products without market products consumed generate net operating surpluses with a value of zero. These politically based accounting criteria are usually justified by the uncertainty of simulating market transactions for products which, since their real transactions are not observable, must be obtained through procedures of stated marginal willingness to pay by real consumers or revealed behaviours in the consumption of commercial products, from transactions of flows or of assets [
31,
32].
However, the criteria in the rSNA methodology for excluding simulated consumer preference prices from the transaction prices system are not fulfilled in the rSNA. This is the case for the estimation of the values added of the farmer and government institutional sectors. In practice, the rSNA simulates that people value the products without market prices consumed according to their cost prices, and therefore generate labour compensation as the only component of the net value added. The inconsistency here of the rSNA is that it accepts the simulation of imputing a value of zero for the net operating surplus of consumption of products without market prices. While the rSNA rejects the valuation of these products consumed (the real value of which may be positive or negative) derived from peoples’ marginal willingness to pay, this valuation is applied in the AAS. Summing up, the application of cost prices in the rSNA in place of the market prices of products is both questionable and inconsistent with consumer exchange value theory. Although the AAS application of the transaction value for the consumption of products without market prices derived from the stated or simulated prices according to peoples’ stated marginal willingness to pay may also be questionable, it is not inconsistent with income theory.
The rSNA and AAS applications to the case-study dehesas and forest farms reveal the modest economic numbers of nature according to the rSNA results in comparison to the AAS measurements. The comparisons of the gross values added and ecosystem services under the rSNA and AAS methodologies evidence the disadvantages of applying the cost prices in the valuations of products without market prices in the dehesa and forest farms.
The lesson learned from the results of this case study is that the hidden numbers of nature in the standard System of National Accounts for environmental incomes and environmental assets implies an important lack of information for the design and implementation of public policies on woodland and forest landscapes.
The incorporation of the environmental asset of private amenity is recognised in Spain under land law, which in the case of government purchase of a
dehesa or forest farm allows the payment of a maximum value of twice the present discounted value (NPV) of the resource rents (economic rents) of the market products belonging to the landowner [
33,
34]. The problem with estimating a fair value for government purchase of rural land is that the government’s subjective choice of the coefficient that multiplies the NPV of commercial products resource rent is a source of potential bias in the offer price determined by the government. The government should make use of algorithms generated by economic science to determine through hedonic and/or landowner-stated methods the fair value of the private amenity environmental asset of the farms. In this research this bias has been overcome by estimating the environmental asset of private amenity through the contingent valuation method applied to private non-industrial land owners of
dehesa and forest farms in Andalusia [
35].
6. Conclusions
This research demonstrates the viability of measuring the many individual and aggregate incomes and ecosystem services of the case-study Mediterranean monte farms under the Agroforestry Accounting System (AAS), although these measurements are subject to a greater number of subjective criteria than those incurred under the slightly refined standard System of National Accounts (rSNA). The extensions of the AAS simulated social prices measurements show that the subjective criteria in the rSNA of simulating zero values for the operating surpluses of the final products without market prices consumed and the omission of activities which do not incur manufactured costs lead to inconsistent valuations of the income and ecosystem services of the case-study Mediterranean dehesa and forest farms.
The discrepancies between the AAS and rSNA methodologies applications are not due to differences in the concepts of income and capital (except in the case of products without manufactured costs) but rather to government statistical conventions for national/regional and farm scale income statistics. The AAS results show that it is possible to extend the criterion of simulated market transaction prices for intermediate and final products without market prices consumed. This extension is consistent with the same criterion of exchange value for commercial products registered by the rSNA. Hence, it is the circumstances of time, place and demand of the private owners and consumers of public products without market prices, which will explain the negative or positive variations in the cultural ecosystem services which can occur through changes in the type of ownership and price applied to the products. Although it should be considered with caution given the lack of statistical consistency among the private and public farms, the corollary of this conclusion from the case study is that the advantage of public ownership of the farms may be linked to the preservation of unique biological variety in danger of extinction, which is reasoned beyond the price system. The advantages of private ownership, however, may be reflected by greater intensity of manufactured investment, labour compensations and the offer of private amenity environmental margins.
The United Nations Statistics Division (UNSD), in its final draft version ([
1]:
https://seea.un.org/ecosystem-accounting (accessed on 11 March 2021)) of the System of Environmental-Economic Accounting—Ecosystem Accounting (SEEA EA), has adopted chapters 1–7 as an international statistical standard. In the same document, chapters 8–11 present internationally recognized statistical principles and recommendations for observed and simulated market valuation of ecosystem services and environmental assets. This research has demonstrated that the available scientific knowledge allows for consistent measurements of ecosystem services and changes in environmental assets. The SEEA EA methodology agrees with and recommends the principles of valuations based on observed and simulated exchange values of final products consumed with and without market prices. This research values, beyond the SEEA EA recommendations, environmental incomes which integrate ecosystem services and changes in environmental assets in a single variable in a way that is consistent with SEEA EA valuations. Future agreements on the standard monetary SEEA EA must overcome the challenge of incorporating an indicator of environmental income.
Dehesa and forest landscapes are among those which most require these improvements in information relating to the contribution of nature to the national income of society.


