
Short-Rotation Coppice Managed According to Ecological Guidelines—What Are the Benefits for Phytodiversity?


Institute of Environmental Planning, Leibniz Universität Hannover, Herrenhäuser Str. 2, 30419 Hannover, Germany
*
Author to whom correspondence should be addressed.
Forests 2021, 12(5), 646; https://0-doi-org.brum.beds.ac.uk/10.3390/f12050646
Submission received: 28 April 2021
/
Revised: 17 May 2021
/
Accepted: 18 May 2021
/
Published: 19 May 2021
(This article belongs to the Special Issue Fast-Growing Trees Species—Opportunities and Risks for Sustainable Agricultural and Forest Land Use Systems)
Abstract
:In recent years, the impact of short-rotation coppice (SRC) on biodiversity has been a regular subject of research and ecological guidelines have been developed to make biomass cultivation on SRC more compatible with biodiversity concerns. However, since these guidelines are only implemented voluntarily by farmers, there are barely any SRC that are managed according to ecological guidelines. Consequently, knowledge about their importance for farmland biodiversity and about the impact of different measures for increasing biodiversity remains scarce. Therefore, three experimental SRC, which are managed according to ecological guidelines and thus include stands of different tree species (varieties of poplar (Populus) and willow (Salix), rowan (Sorbus aucuparia), silver birch (Betula pendula)) and different growth-stages within the same site, were investigated with regard to their importance as habitat for vascular plants. Species numbers and species composition were compared with the following habitat types: afforestations (AFO), young (HE-Y) and old hedges (HE-O), field margins (FM) and arable land (AL). Furthermore, different stand types (i.e., stands with different tree species and growth-stages, headlands, clearings) within these SRC were surveyed and compared. Species numbers of SRC were similar to HE-Y, AFO and FM and significantly higher than in AL and HE-O. The composition of plant communities in SRC differed considerably from the other farmland habitats, especially from AL, HE-O and FM. Within the SRC, most stand types had similar species numbers. Only the non-harvested poplar stands were particularly species-poor. Harvesting led to increased species numbers. This increase was significant for the poplar stands but only moderate for the willow stands. With regard to their species composition, the different stand types differed considerably in many cases. We conclude that SRC, which are managed according to ecological guidelines, can be an additional measure to promote phytodiversity in agricultural landscapes as they contain relatively high species numbers (of mainly common and adaptable species) and support distinct plant communities that differ from other farmland habitats. Therefore, measures such as the cultivation of different tree species or sectional harvesting could be offered as agri-environmental schemes to further increase the ecological sustainability of biomass production on SRC.
1. Introduction
The decline of biodiversity is progressing rapidly. Thereby, this negative development is particularly evident in agricultural landscapes and even species that were formerly common and widespread are now affected [1,2,3,4,5,6]. A major reason for the decline in biodiversity is an increase in intensive agricultural use [7], for example, through the increasing cultivation of biomass crops [8,9,10,11,12,13,14]. However, biomass cultivation also offers opportunities to promote farmland biodiversity, since extensively managed perennial biomass crops, such as short-rotation coppice (SRC), can provide new habitats for wildlife and plants in agricultural landscapes [15,16,17,18]. SRC are biomass crops that consist of fast-growing trees (mostly cultivated varieties of poplar (Populus) or willow (Salix)), which are harvested in short cycles in order to use their wood for energy purposes [19].
In previous studies on the biodiversity of these woody crops, their importance as habitat for vascular plants was a frequent subject of investigation [20,21]. Thereby, SRC were found to be more species-rich than conventional arable crops [22,23] and clearly differed from arable land and forests with regard to their plant species composition [24,25,26]. Studies on the development of plant communities within SRC have shown dynamic changes with increasing age of the plantation and within rotation cycles [27,28,29,30] as well as differences in species numbers and species composition between plantations with different tree species or varieties [23,31,32].
From these results, it was concluded that SRC can contribute to the enhancement of biodiversity in intensively used landscapes with low habitat heterogeneity [33]. In addition, recommendations were developed to further improve the habitat function of SRC and to increase their contribution to farmland biodiversity, especially to plant species diversity (“phytodiversity”). The proposed measures aim to increase the structural diversity of these woody biomass crops. This includes the cultivation of different tree species in small-scale units, sectional harvesting of trees in order to establish a mosaic of different growth-stages side by side and the integration of accompanying structures such as headlands, clearings or rides to provide additional open habitat elements within SRC [cf. [15,27,34]]. Currently, these measures can only be implemented by farmers on a voluntary basis and there is no regular financial compensation (e.g., agri-environmental schemes) for the associated management effort or yield losses [cf. [35]]. Therefore, SRC managed according to ecological guidelines are quite rare. Consequently, there are no studies available that evaluate their importance as habitats for vascular plants and that examine and directly compare the effects of the different measures on one and the same plantation (i.e., on the same site with similar conditions with regard to plantation age, land use history or adjacent habitats, which are all factors that can have a strong influence on the composition of the recent vegetation of SRC [27,30,36]).
Therefore, in this study, we want to determine the importance of appropriately managed SRC as habitat for vascular plants on three experimental SRC, which are managed according to the ecological guidelines mentioned above. Our aim is to evaluate how these SRC perform in comparison to other farmland habitats with regard to their plant species diversity and whether they can provide an additional value for phytodiversity in an intensively used agricultural landscape. Furthermore, we want to evaluate the effects of the different measures implemented within the investigated SRC. For this purpose, we want to compare different stand types (i.e., stands with different tree species and growth-stages, headlands, clearings) within our SRC study sites with regard to their species numbers and species composition.
2. Materials and Methods
2.1. Study Area and Study Sites
Investigations were carried out in the municipality of Schapen (Emsland district, Lower Saxony) in north-western Germany. The landscape in this rural region is dominated by intensive agriculture (approx. 70%, predominantly arable land) and contains a relatively low (14%) proportion of woodland [37]. The study area is located 30–40 m above sea level. Mean annual precipitation accounts for 800 mm and mean annual temperature for 10 °C (long-term recordings from 1981–2010, Climate station Lingen, [38]). The region is dominated by sandy soils such as Podzols, Gleyic Podzols and, in areas closer to the groundwater, Gleysols, which developed from glacial sand deposits [39].
In addition to SRC managed according to ecological guidelines, five other farmland habitat types were selected for the study. In addition to arable land (previous land use), this includes a range of typical farmland habitats (afforestations, young and old hedges, field margins), which are regularly implemented as measures to increase biodiversity in agricultural landscapes (e.g., as agri-environmental schemes or greening measures in the context of the Common Agricultural Policy of the European Union). Therefore, the study focuses on the six following habitat types: short-rotation coppice (SRC), afforestations (AFO), young (HE-Y) and old hedges (HE-O), field margins (FM) and arable land (AL) (Table 1).
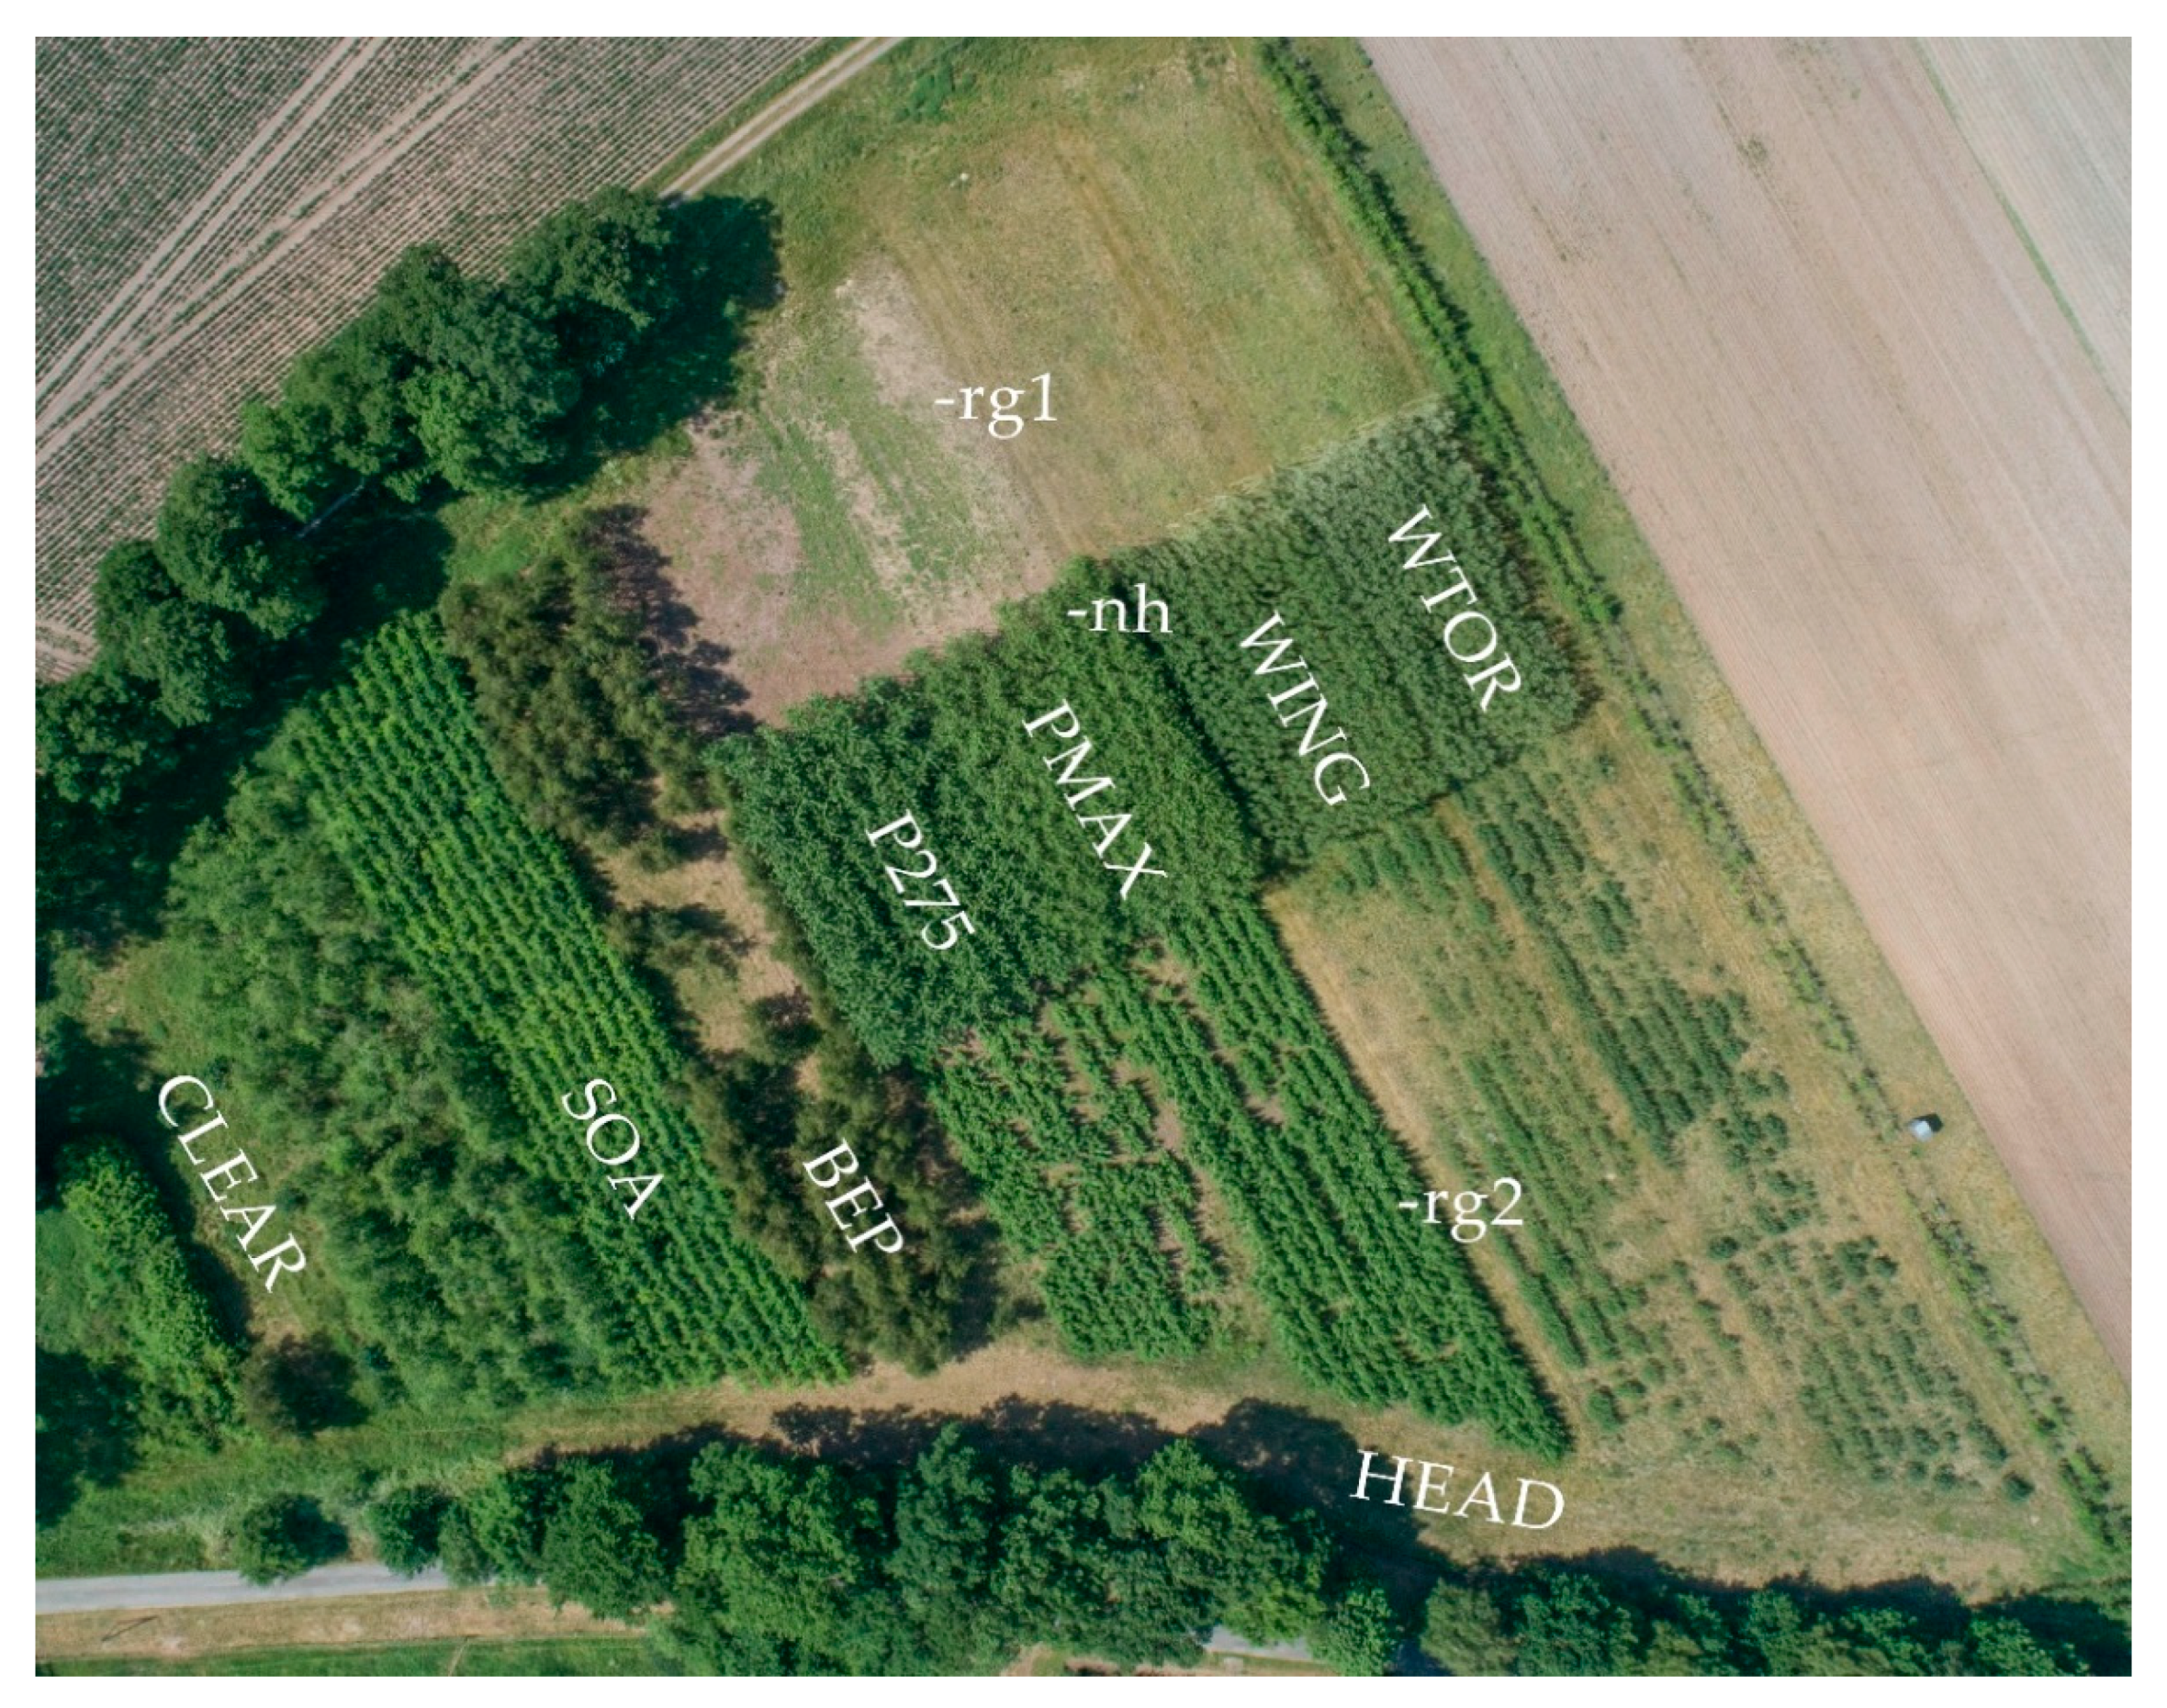
The three SRC sites, each about 2 ha in size, were established in spring 2011 and 2012, respectively, and were thus in their 8th or 9th growing season after establishment at the time of the study (June 2019). These small-scale and structurally diverse plantations are experimental sites which were established and are managed according to ecological guidelines [cf. [15,27,34]] in order to increase their contribution to farmland biodiversity. Therefore, different tree species and varieties were cultivated within the same site (see Figure 1) and are managed without any use of fertilisers or pesticides. In addition to varieties of poplar (Max 3, Hybride 275) and willow (Inger, Tordis), some native tree species (rowan (Sorbus aucuparia) and silver birch (Betula pendula)) were also planted. The trees were each planted in species-specific stands of 20 m width. Within the poplar and willow stands, harvesting was carried out in sections, so that three different growth-stages existed side by side at the time of the study: stands that were not harvested so far and stands that had been harvested in February 2018 or in February 2019, respectively, i.e., regrowth in the first or second growing season after harvesting (Table 2, Figure 1).
The three afforestations (AFO) were established at the end of 2012. At the time of the study, they were in their 7th growing season since establishment. Hence, they were similar in age to the SRC. Within the afforestations, the deciduous tree species Quercus robur, Q. petraea, Betula pendula, Fagus sylvatica, Carpinus betulus and Acer pseudoplatanus were planted in varying proportions per site. The habitat type young hedge (HE-Y) included three hedge plantings of about 8 m width, also planted at the end of 2012, which directly bordered on the three AFO. Old hedges (HE-O) were mature hedgerows that had already been established decades or centuries ago in order to separate different fields from each other. The old hedges studied were characterised by shrubs and trees that had last been coppiced at least 10 to max. 50 years ago. The width of the hedges ranged from 4 to 10 m. Due to the intensive agricultural use of the adjacent fields, the hedges did not have any fringes, but bordered directly on intensively used arable land. Field margins (FM) were 1–3 m wide strips of herbaceous vegetation between two adjacent arable fields or at the edge of a field between the field and a track. Arable land (AL) comprised arable fields cultivated with maize (Zea mays), since maize represents the most commonly cultivated crop in the region.
We selected three sites of each habitat type SRC, AFO and HE-Y for the study, as only few (AFO) or no (SRC, HE-Y) other sites were available in the region and a random selection was therefore not possible. For the habitat types AL, HE-O and FM, the six study sites per type were randomly selected. Therefore, one site each for AL, HE-O and FM was randomly selected within a radius of 500 m around each of the three SRC and around each of the three AFO sites.
In addition to the six different habitat types, various stand types within the SRC were investigated (Table 2, Figure 1). The SRC stand types included stands with different native tree species (BEP, SOA) and different tree varieties (PMAX, P275, WING, WTOR) typically grown on SRC in various growth-stages (-nh, -rg1, -rg2) as well as accompanying structures such as headlands (HEAD) and clearings (CLEAR, areas > 500 m2 where trees failed to establish). The average size of the individual stands within the SRC was 1510 ± 720 m2 (Range: 400–3850 m2). Each stand type was present once per site. Certain stand types were absent on individual SRC sites. Therefore, the number of replications per stand type was two or three (Table 2). Since the afforestations also contained different structures within the sites (besides tree stands there were also rides, clearings and margins), different stands were also investigated within the individual sites (Table 1).
The selection of the study sites resulted in six spatial clusters, each containing several sites (located within a radius of 500 m around each of the three SRC and AFO sites) or stands (located within each SRC and AFO site) that were spatially aggregated. For the statistical analysis, these clusters were considered as a fixed effect in the model (see data preparation and statistical analysis). Sites of SRC and AFO were located between 1 and 5.5 km apart.
2.2. Survey of the Flora
Surveys were carried out in June 2019. For each site (AL, HE-O, HE-Y and FM) and for each stand within the SRC and AFO sites, the flora was recorded using 15 randomly distributed quadratic sample plots (hereafter “plots”), each with a size of 1 m2 (1 × 1 m). In order to minimize edge effects, the edge-zones were excluded from the surveys as far as possible and the 15 plots were distributed within the sites/stands at a minimum distance of 2 m from the edge. For HE-O and FM, it was not possible to exclude the edge-zones from the surveys, since these linear habitats were too narrow. Since the sites of arable land (AL) were fairly large, a 20 m wide area (corresponding to the width of the individual tree stands on the SRC) on a randomly selected side of the field was demarcated for the surveys.
All vascular plant species growing within each sample plot (of 1 m2) were identified according to Jäger [40] and noted (presence/absence; no recording of the cover of individual species). The scientific nomenclature also followed Jäger [40]. Cultivated non-native plant species (e.g., varieties of poplar or willow, Zea mays) were excluded from sampling. Due to the high number of stands studied, especially on the SRC, but also on the AFO, there were major differences with regard to the total number of plots sampled per habitat type (Table 1).
2.3. Data Preparation and Statistical Analysis
The different habitat types as well as the different stand types within the SRC were compared with regard to their species numbers at (i) plot-level and at (ii) stand-level. Therefore, the species numbers were log-transformed before analysis (loge(y + 1), y = species number) to account for samples with no species detections. For the log-transformed data, a linear mixed effect model (LMM) was fitted to account for the unbalanced hierarchical sampling design. Spatial clusters (i.e., sites of different habitat types clustered within a 500 m radius around each SRC and AFO site, see section study area and study sites), habitat types and stand types were included as fixed effects. Two random effects were included: the variance between sites, and the variance between stands nested within sites. The residuals variance was thus the variance between plots nested within stands. For the number of species per site/stand (i.e., per 15 m2) a simplified mixed model was fitted with the spatial clusters (see above), habitat types and stand types as fixed effects, and variance between sites as random effect. Assessment of normality assumption of the residuals was performed using R package ‘hnp‘ [41]: the empirical distribution of residuals was symmetric, with no indication of skewedness or heterogeneity of variance and no indication of extreme values. Based on the fitted LMM, all pairwise comparisons of means between habitat types and between stand types were computed (analogously to the Tukey test). Significant differences at the 5%-level (p < 0.05) are shown in graphs by compact letter display. The statistical analysis was performed in R [42], using packages ‘lme4’ [43] for fitting mixed models, package ‘lmerTest’ [44] for ANOVA tables of the fixed effects, package ‘emmeans’ [45] for pairwise comparisons and compact letter display and ‘ggplot’ [46] for graphs.
To compare species numbers of SRC and AFO at site-level, despite different numbers of stands and plots sampled per site (Table 1), the species numbers for 15 and 45 plots were estimated for each of the three sites of these two habitat types by a sample-based rarefaction [cf. [47]] using the software BioDiversity Pro [48]. Therefore, samples of the dataset of each site (from plots of all stand types occurring there) were pooled in random order and the number of random sorts to perform on each pass was set to 50. For the three SRC sites, this estimation was also performed for 135 plots, since this was the minimum number of sampled plots per site (see Table 1).
Species composition of the habitat types and stand types was compared with regard to the habitat preferences of the occurring plant species. Therefore, the detected species were assigned to one of the following categories according to Oberdorfer [49]: (a) species of arable land or short-lived ruderal habitats, (r) species of persistent ruderal habitats, (g) grassland species, (h) species of heathland or nutrient-poor/dry grasslands, (w) species of woodlands incl. herbaceous vegetation of woodland margins, shrubs or hedges and (x) indifferent, not stated or species of other habitats. For the comparison of habitat types and stand types, all sites, stands and plots of the respective type were combined. For the comparison of the stand types, different varieties of the same genus (poplar or willow) were combined. For all comparisons, each species was weighted with its frequency, i.e., the number of plots in which the species was detected in the respective habitat type or stand type.
To compare the species composition of the different habitat types a detrended correspondence analysis (DCA) was applied using R package ‘vegan’ [50] for analysis and ‘gplots’ [51] for graphs. All stands of the different habitat types, respectively, stand types were included in this analysis. The species within the individual stands/sites were weighted with their frequency (i.e., occurrence in n/15 plots per stand/site). The default options were used, including detrending by 26 segments, non-linear re-scaling of axes with 4 iterations and no downweighting of rare species.
3. Results
3.1. Comparison of Habitat Types
3.1.1. Species Numbers
A total of 182 species were found across all surveyed habitat types. The majority of these species are widespread and common, no species classified as threatened in Germany were detected [52]. At the regional level (Lower Saxony), two of the species found are classified as threatened [53]: Malus sylvestris and Ulmus minor, the former was recorded on the AFO and the latter on some HE-O sites.
The highest number of species was recorded on SRC, with a total of 123 and the lowest on AL, with a total of 18. AFO ranked between SRC and AL, with a total of 108 species. HE-Y and FM both had 68 and HE-O had 41 species (Table 3). However, these species numbers are not directly comparable due to the different numbers of sites and stands surveyed per habitat type and thus different numbers of sampled plots (Table 1). Therefore, species numbers per stand (=15 m2) and species numbers per plot (=1 m2) were used for comparisons.
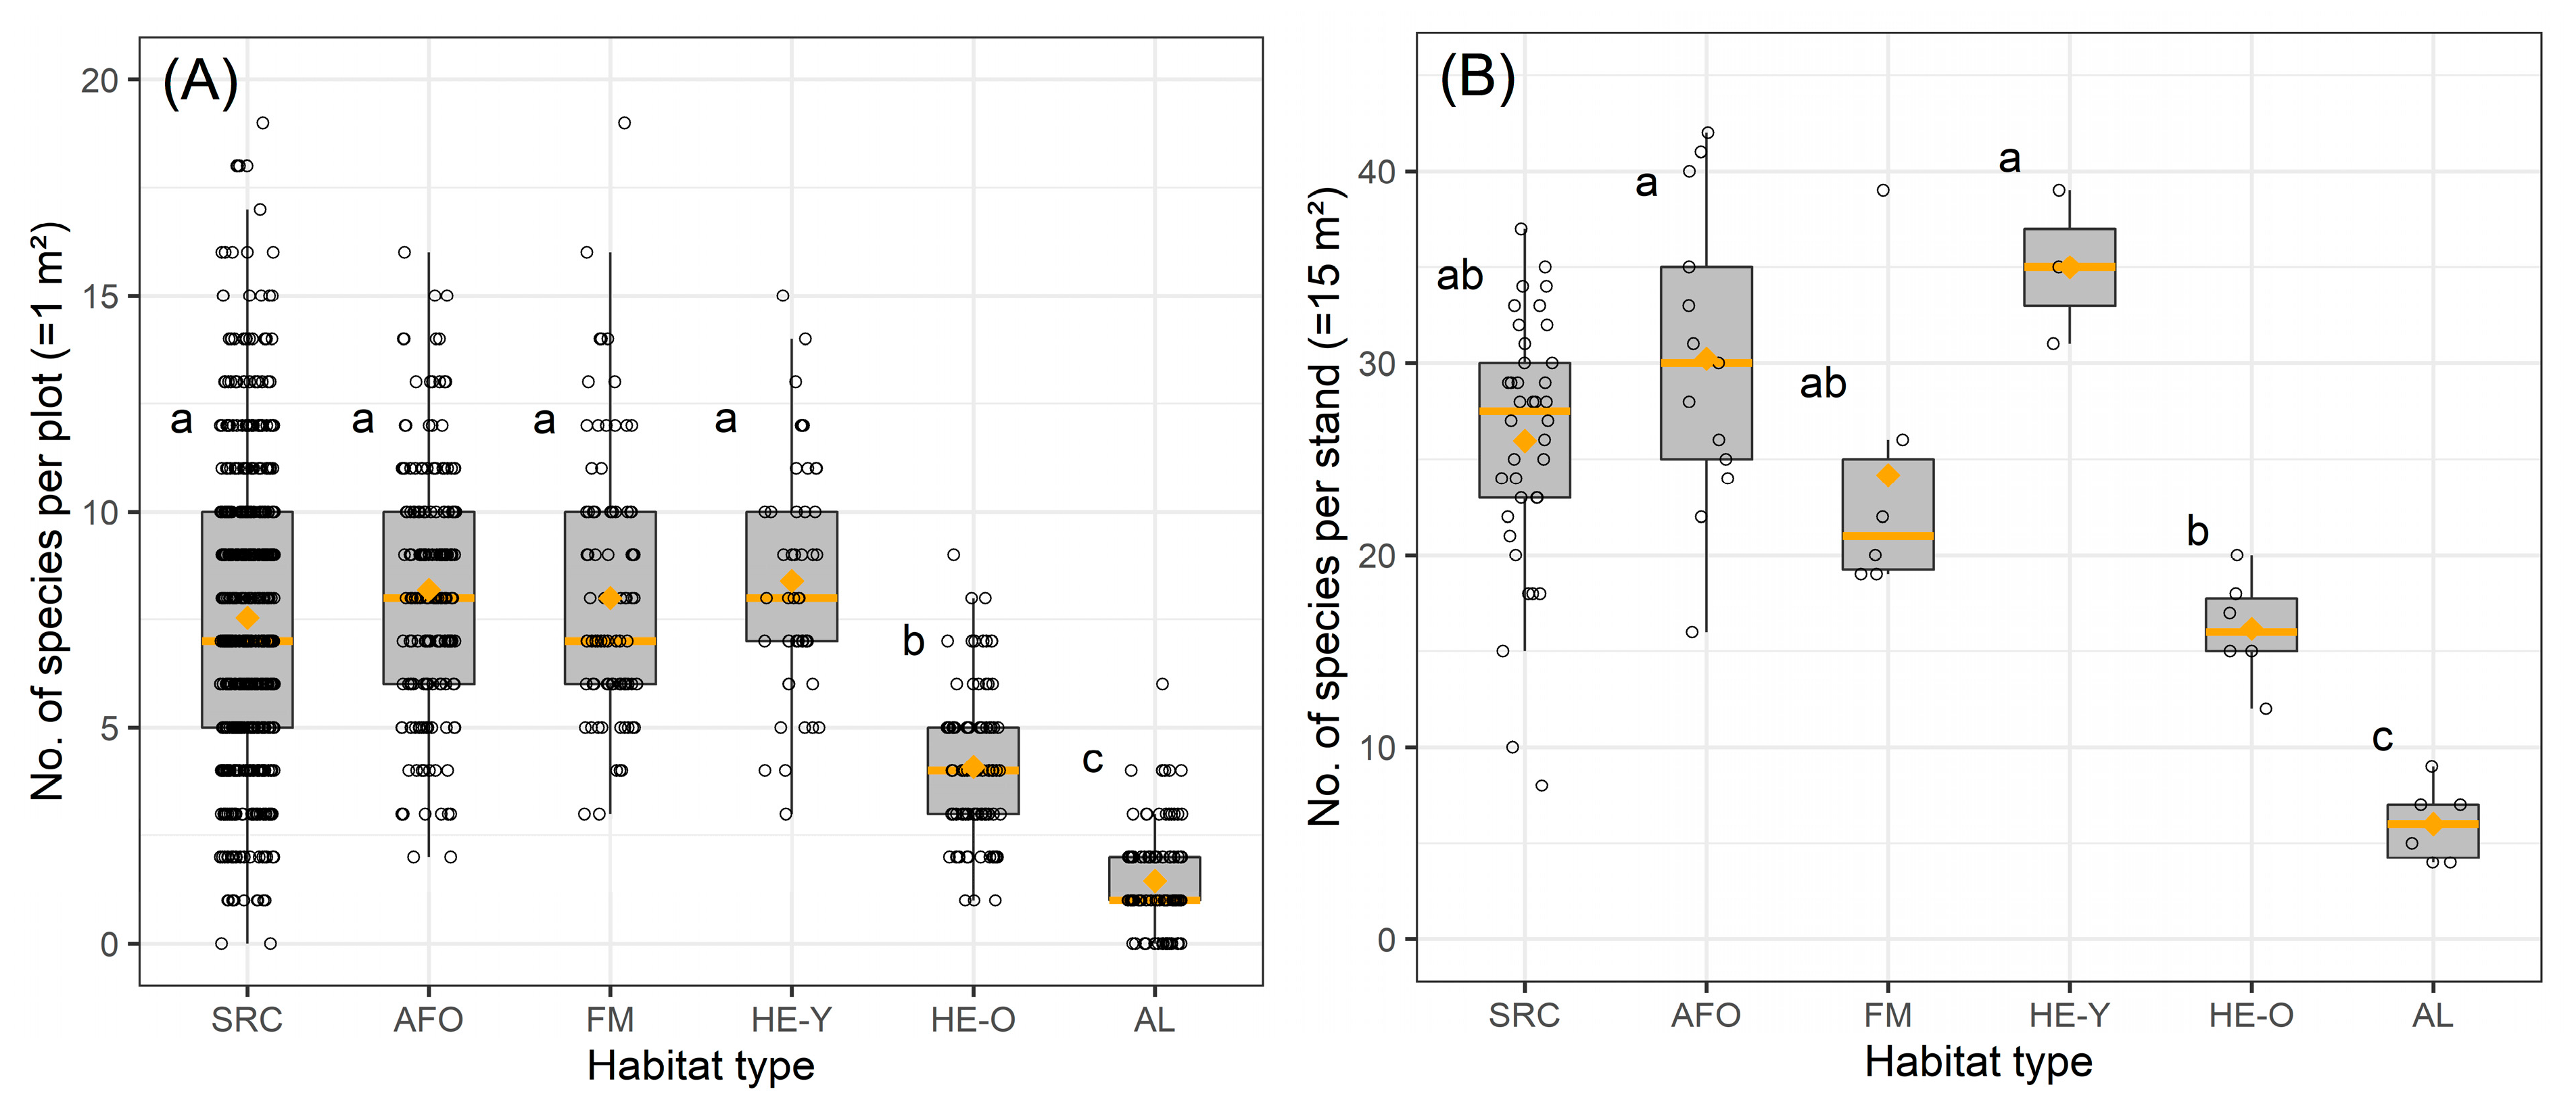
HE-Y was the most species-rich habitat type in terms of the number of species recorded per plot and per stand, followed by AFO, SRC and FM (Figure 2, Table 3). There were no differences between these four habitat types in terms of species numbers at either plot- or stand-level. AL had the lowest number of species at both levels and differed significantly from all other habitat types. HE-O took an intermediate position between the four species-rich habitat types and AL and differed significantly from them in terms of species number per plot. With regard to the species numbers per stand, HE-O differed significantly from AFO, HE-Y and AL. Like AFO and HE-Y, SRC and FM also had higher species numbers per stand than HE-O, but the differences were not significant.
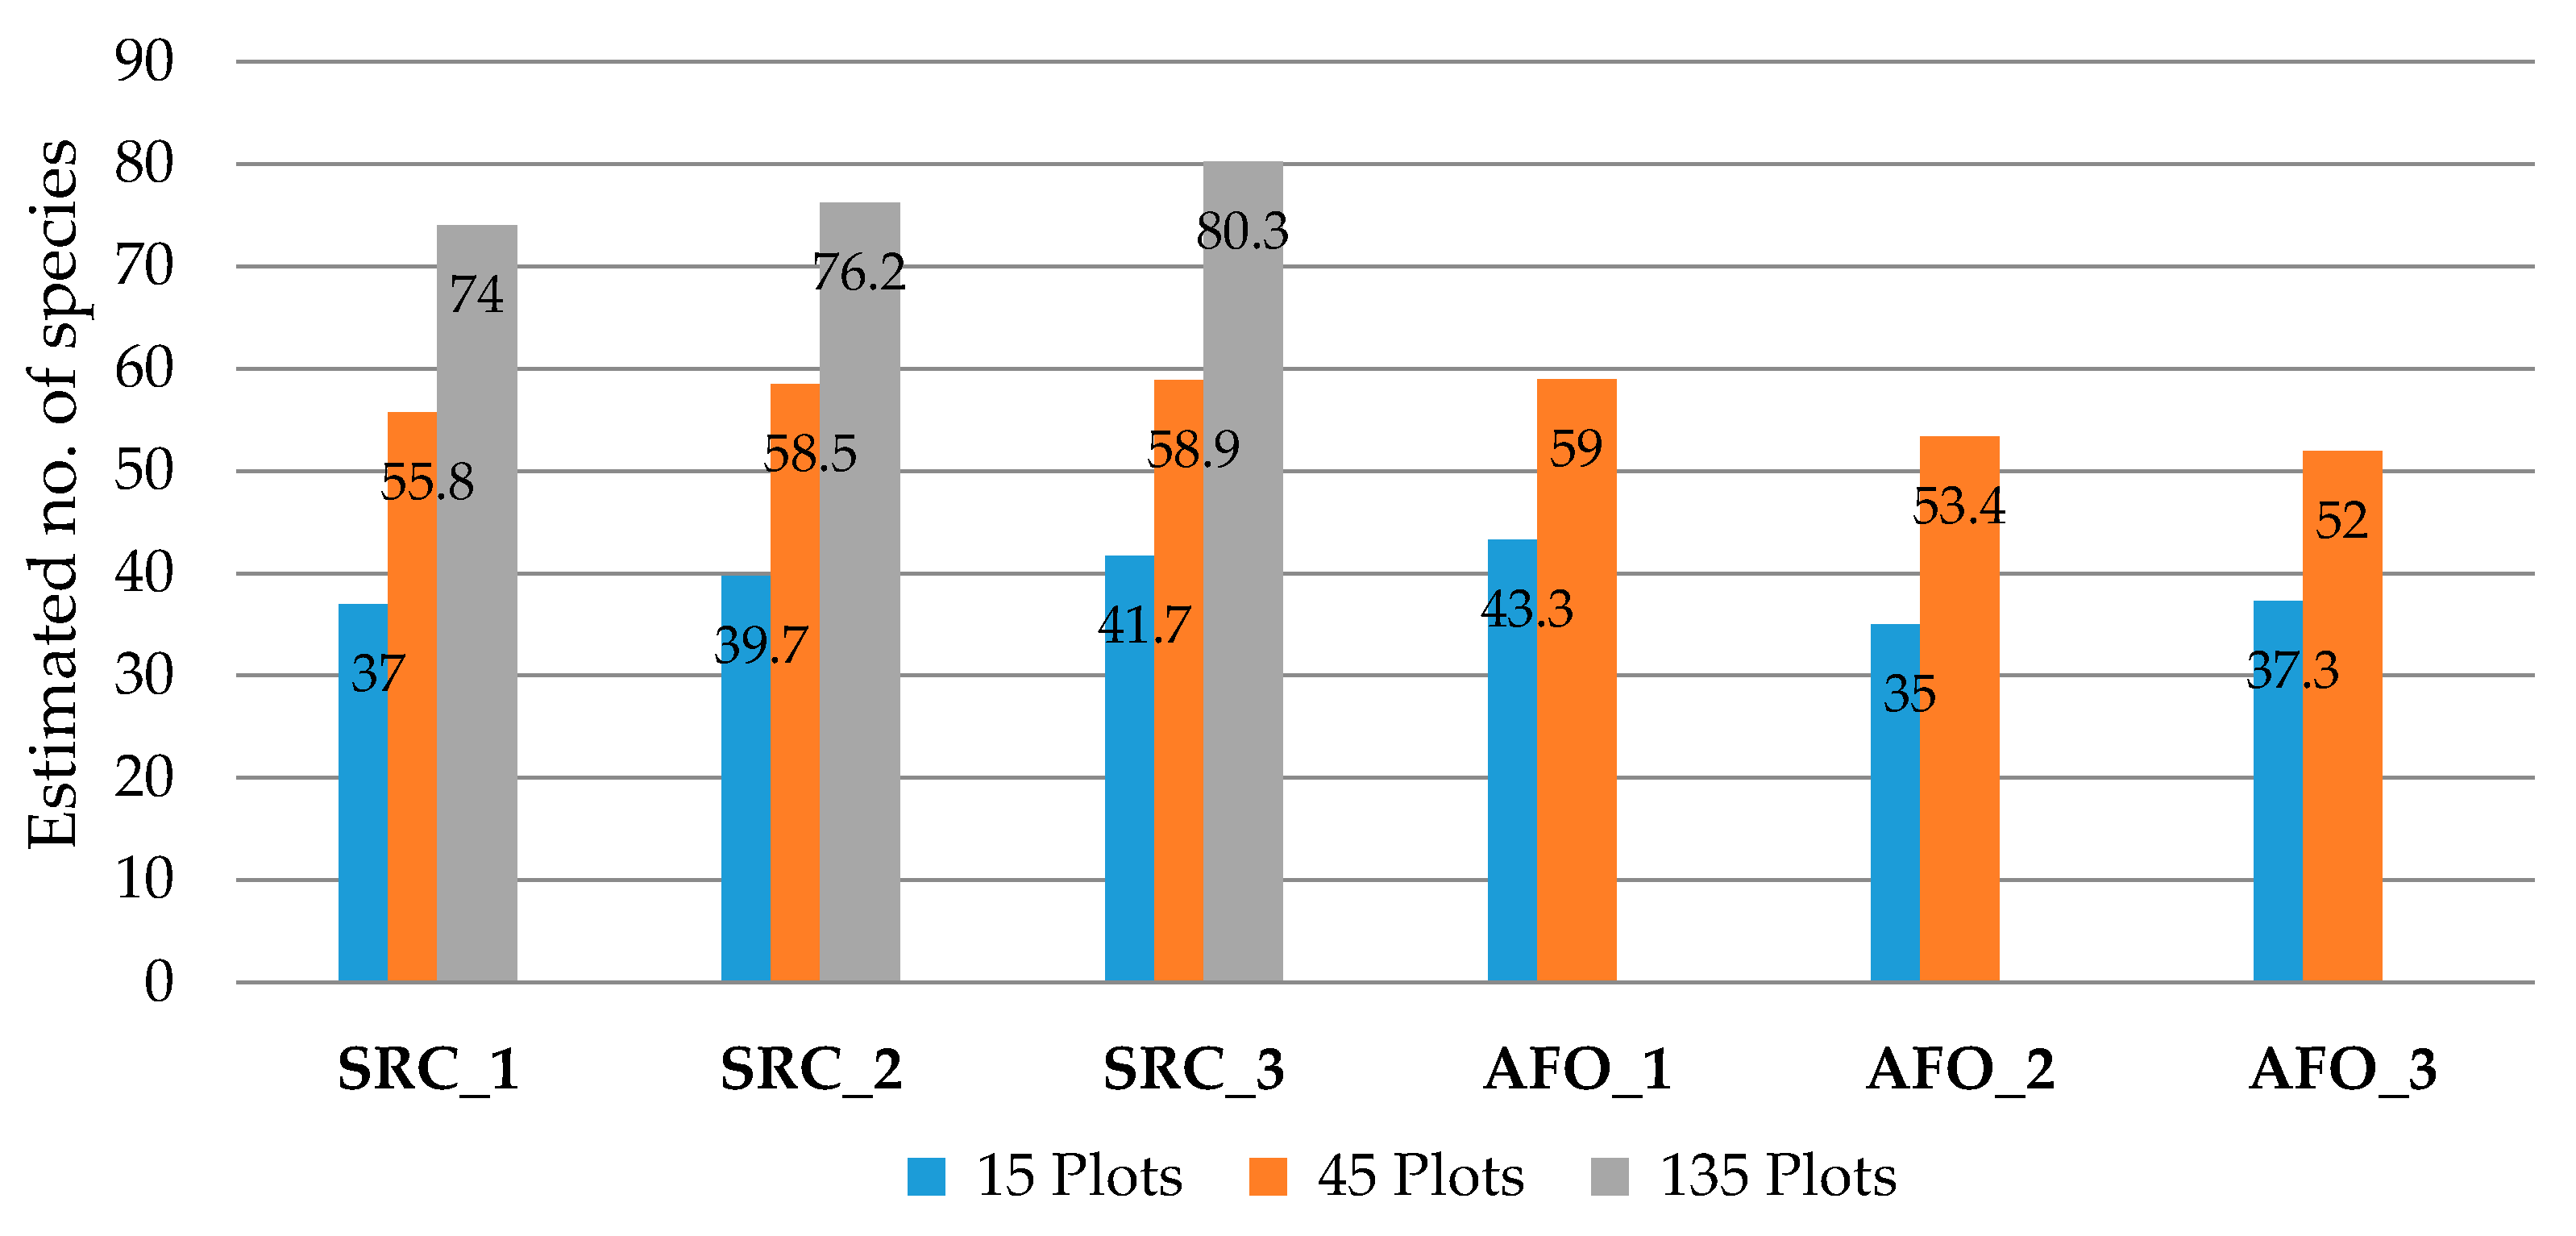
Since several stands per site were investigated for SRC and AFO, a comparison of species numbers for a larger number of plots was possible. Therefore, a sample-based rarefaction was used to estimate the species number per site for a given number of sampled plots. Estimated species numbers for the sites of both habitat types were consistent, ranging from 35–43 species for 15 plots and 52–59 species for 45 plots (Figure 3). The SRC sites also had similar estimated species numbers (74–80 species) per site for 135 plots.
3.1.2. Species Composition and Species Numbers with Regard to Habitat Preferences
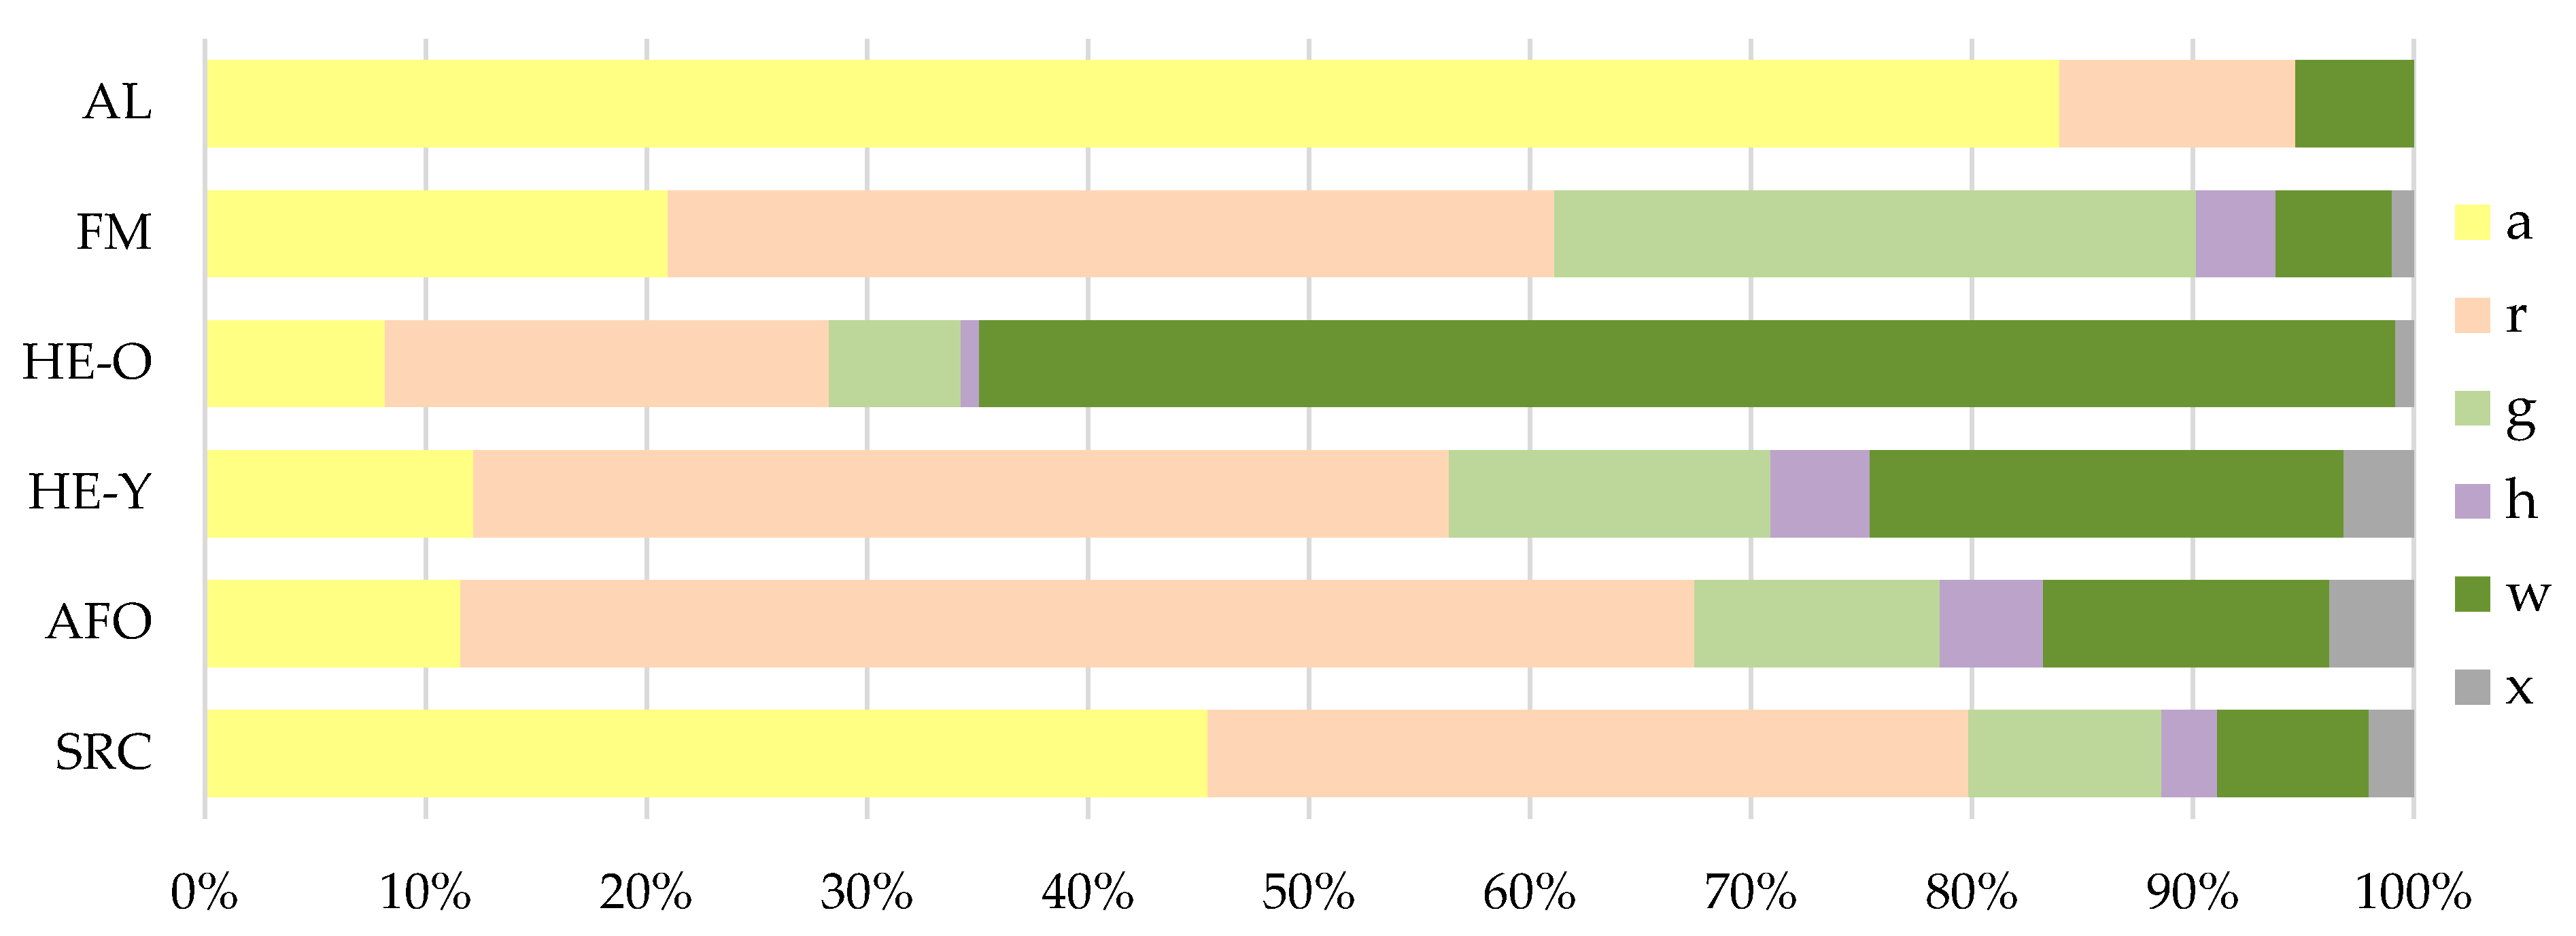
Figure 4 shows the species composition within the habitat types with regard to the habitat preferences of the detected species weighted with their frequencies. AL was dominated by species of arable land or short-lived ruderal habitats, while HE-O was dominated by species of woody habitats. The highest proportion of grassland species (almost 30%) was found in FM. SRC had high proportions of species from arable land or short-lived ruderal habitats (45%) and from persistent ruderal habitats (35%). With regard to the arable species, although the frequency proportion was lower for SRC than for AL, considerably more arable species were detected on the SRC than on AL due to the significantly higher total species number (Table 3). Compared to FM, HE-Y and AFO, the proportion of arable species in SRC was higher but the proportion of species from persistent ruderal habitats was lower.
In addition to Figure 4, Table 3 shows the mean numbers of species of different habitat preferences at site/stand-level and at plot-level. In comparison to the other habitat types, SRC had the highest number of species of arable land and short-lived ruderal habitats, both at site/stand-level and at plot-level. The number of species of persistent ruderal habitats was particularly high in AFO and HE-Y. In SRC, the number of species of this category was slightly lower, but the differences with AFO and HE-Y were not significant. In contrast, HE-O and AL had significantly lower numbers of species of persistent ruderal habitats than SRC, AFO, FM and HE-Y. The number of grassland species was highest in FM at both site- and plot-level. Their number was significantly higher there than in SRC. Species of woodland, shrubs or hedges were particularly frequent in HE-O and HE-Y. Both hedge types differed significantly from SRC with regard to the number of species of this category.
3.1.3. Similarity of Plant Communities
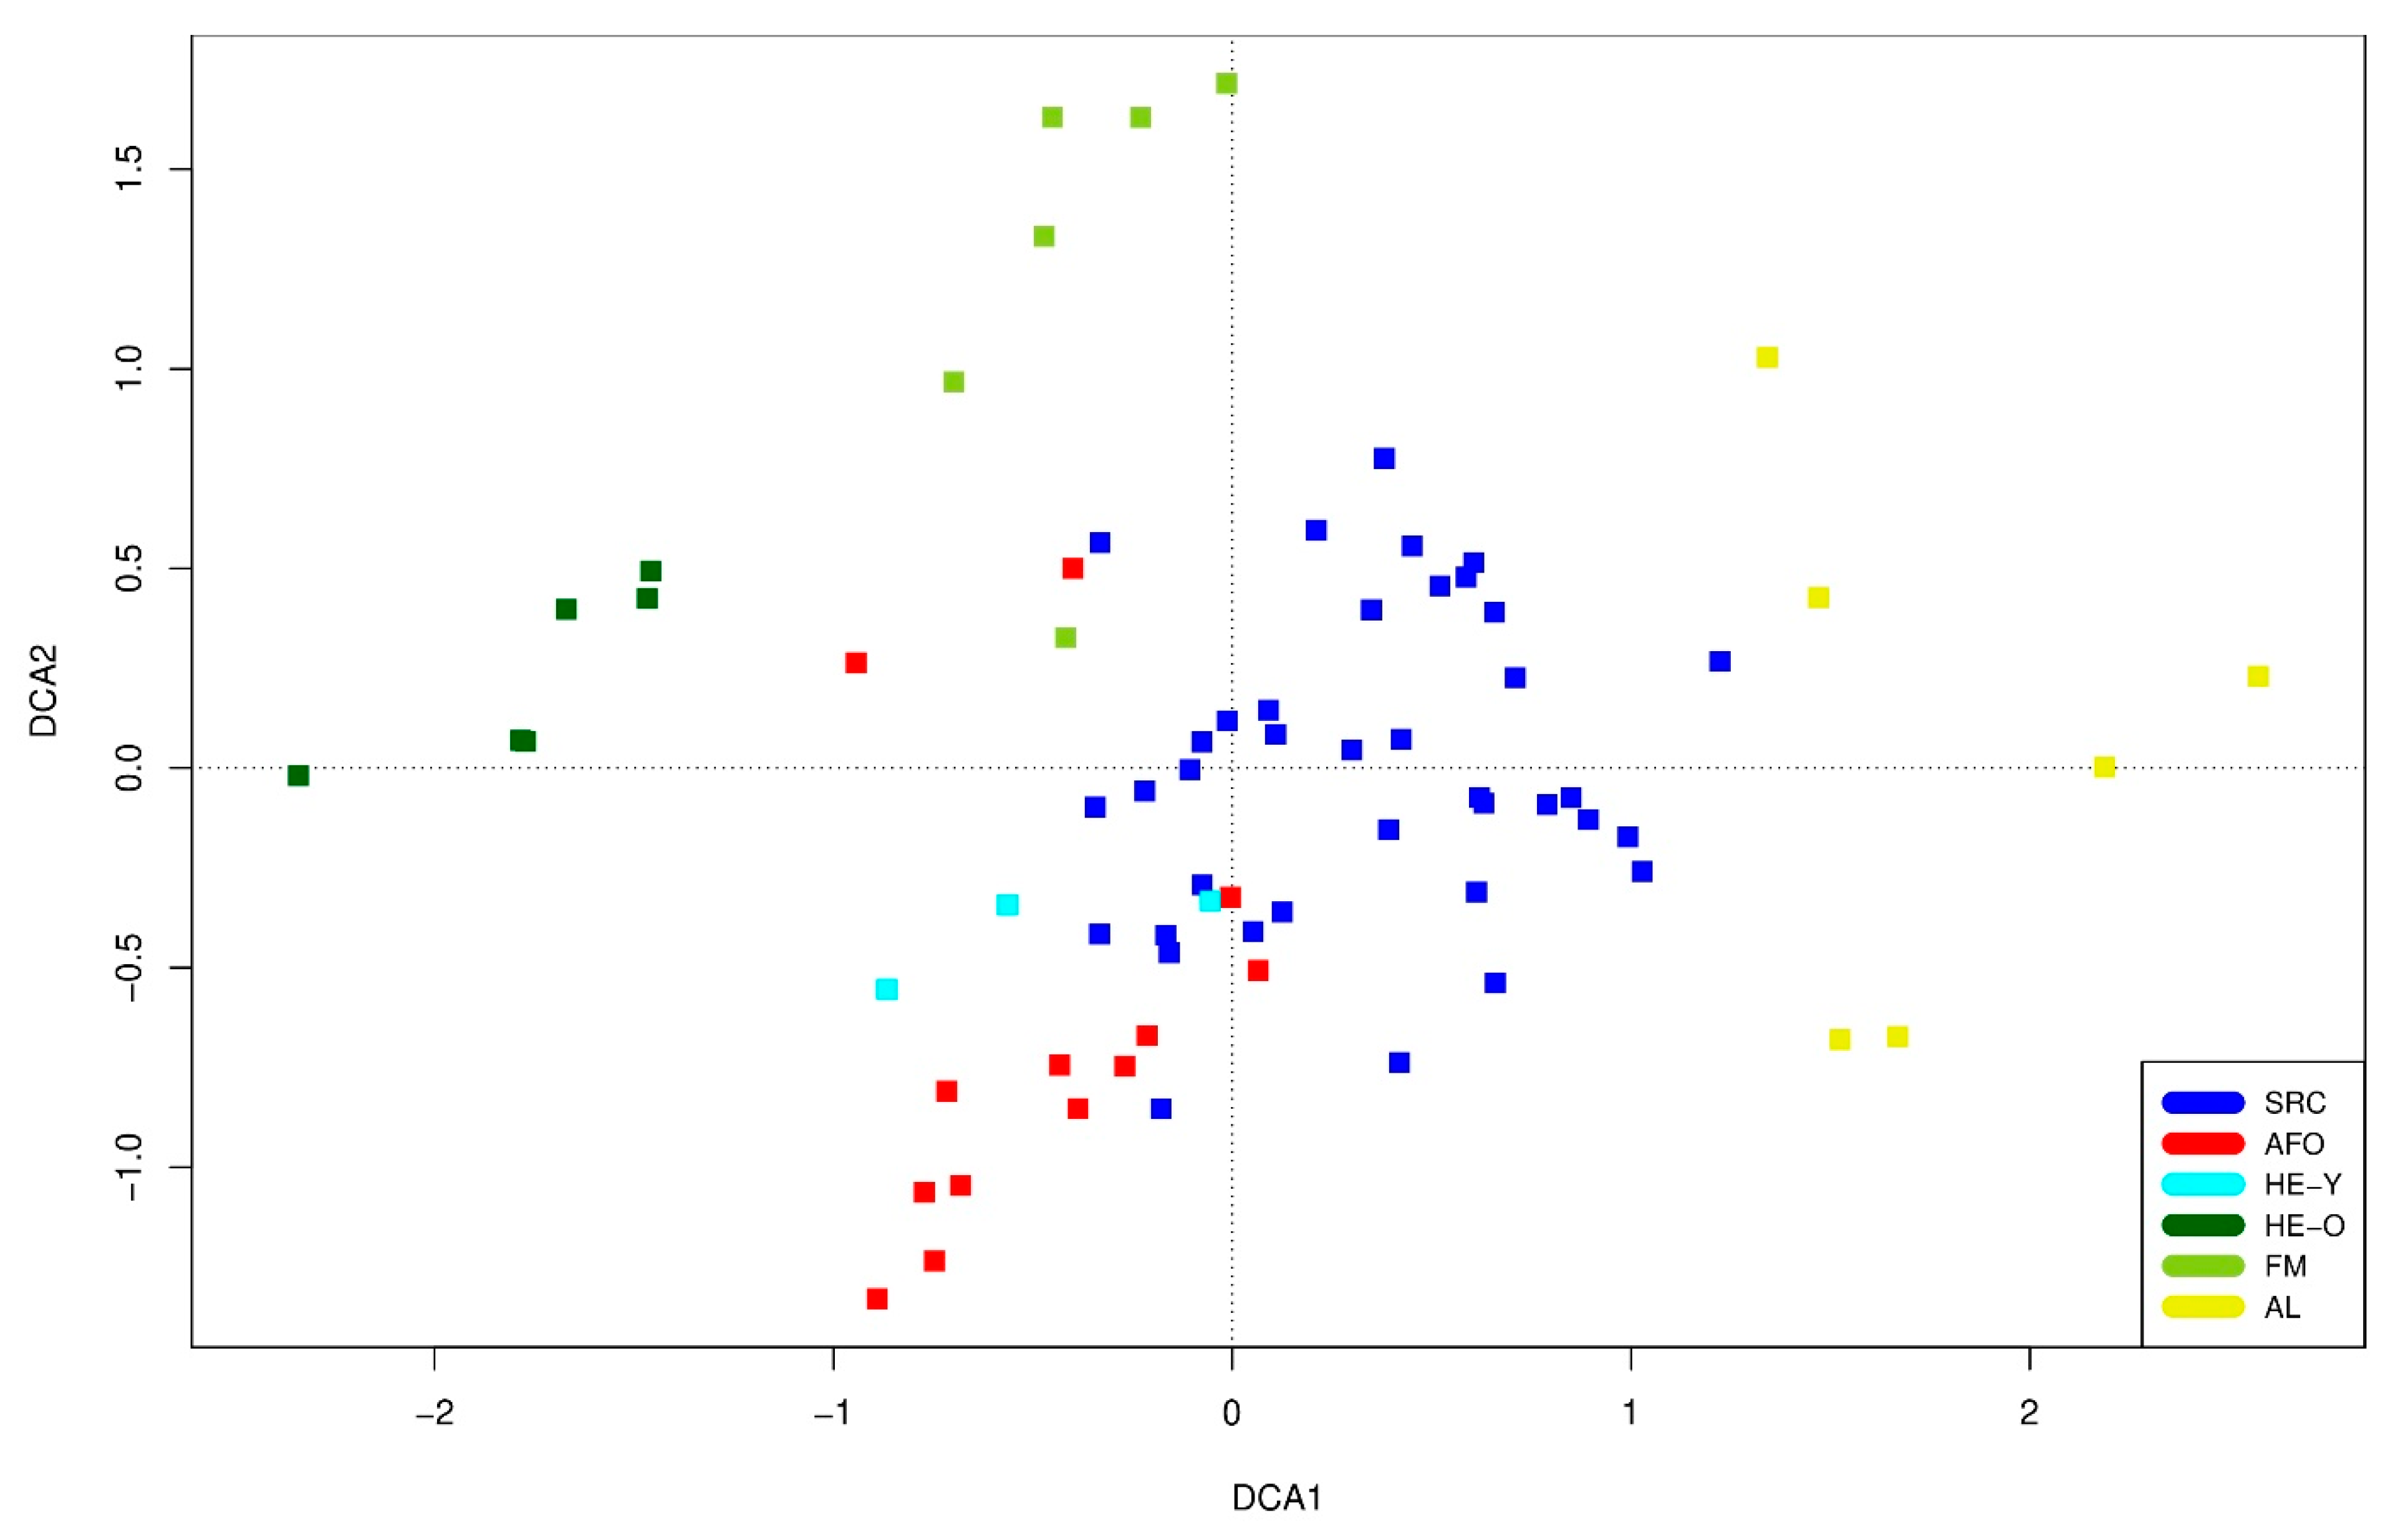
On the DCA graph, the stands are separated into four different groups (Figure 5), which are, however, very heterogeneous and widely scattered. AL, HE-O and FM are each separated from a large group consisting of SRC, AFO and HE-Y. Within the latter group, a certain separation into two groups, SRC and AFO/HE-Y, is visible, but there are also smooth overlaps between both groups, respectively, the three habitat types. In addition, one FM site and single AFO and SRC stands were fairly similar. These stands were a margin on a AFO site and a clearing on a SRC site.
The considerable dispersion within all groups illustrates that the individual sites or stands of the respective habitat types did not show homogeneous plant communities and sometimes differed significantly with regard to their qualitative (occurring species) and quantitative (frequency of the species) species composition. For SRC and AFO/HE-Y, there were somewhat higher similarities between individual stands, but also considerable differences between others (in detail see Section 3.2.3).
3.2. Comparison of SRC Stand Types
3.2.1. Species Numbers
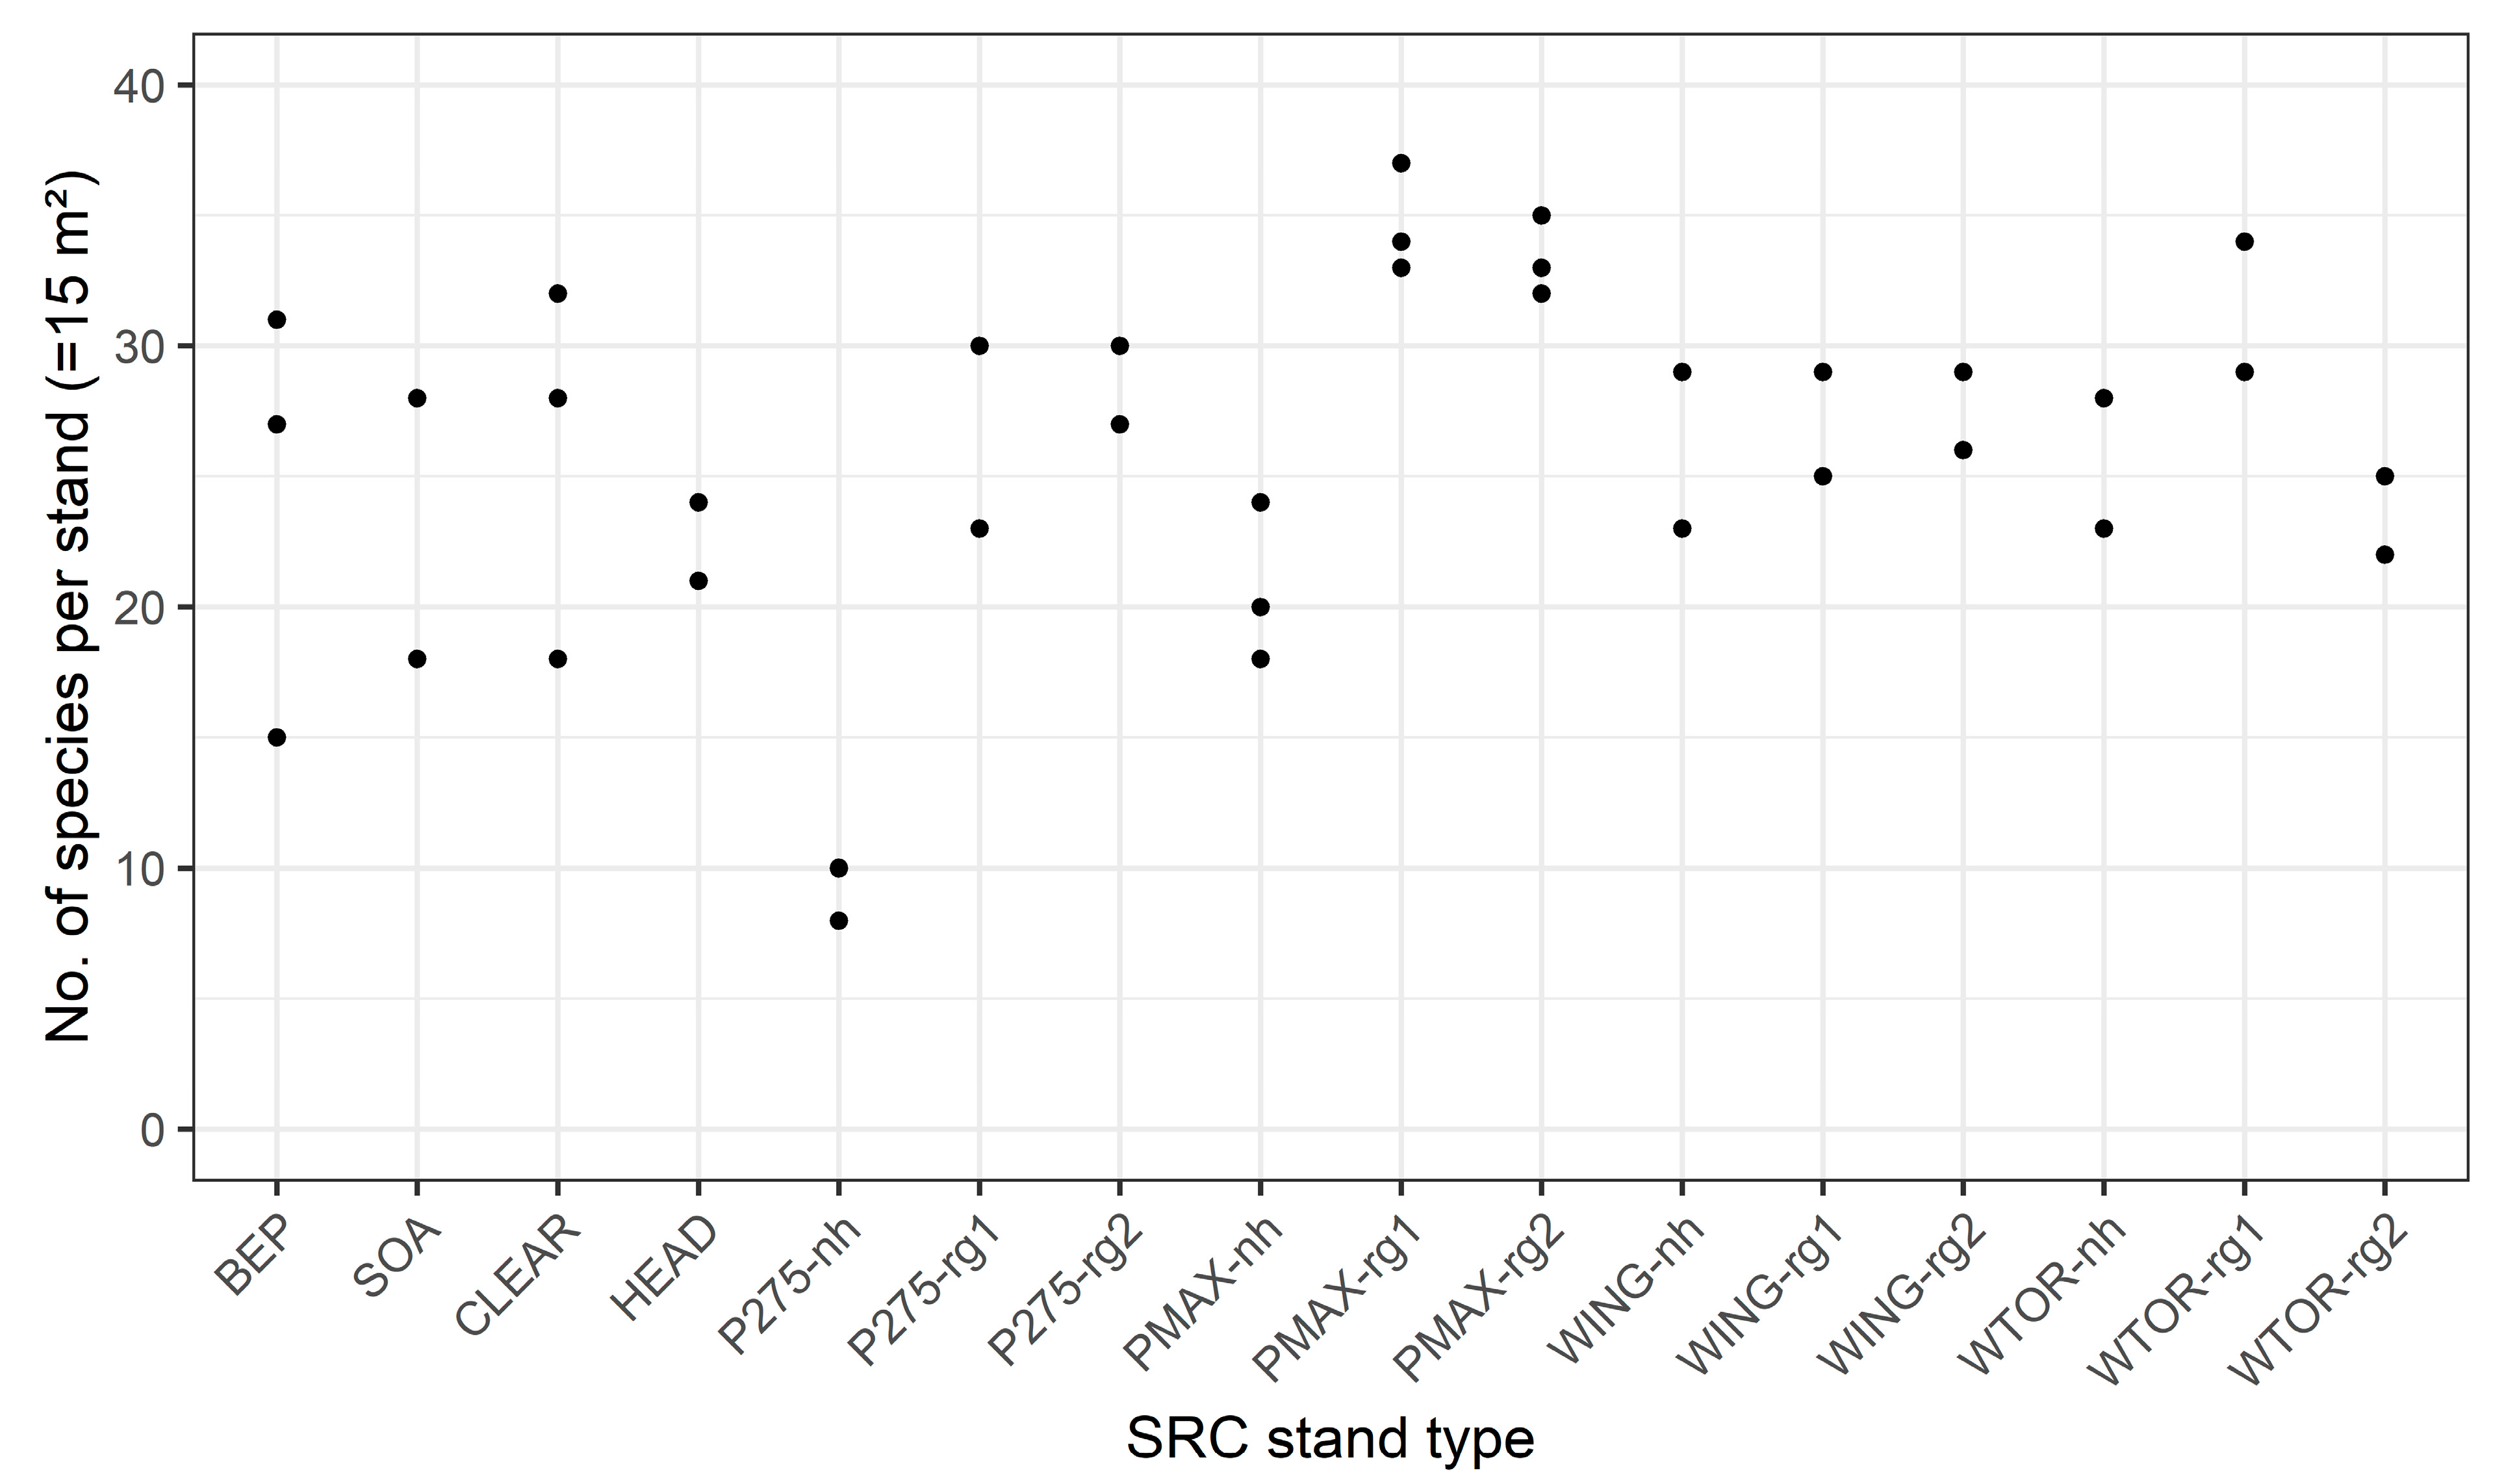
When comparing the different stand types within the SRC, the number of species at plot-level did not differ significantly in most cases (Figure 6). The lowest species numbers were found in the non-harvested poplar stands. Stands with the poplar variety Hybride 275 (P275-nh) were particularly species-poor and differed significantly from all other stand types. For all poplar and willow stands, an increase in species numbers was observed after harvesting. This was particularly evident for the poplar stands. Here, non-harvested stands (nh) mostly differed significantly from stands in the first and second growing season after harvesting (rg-1, rg-2). Notably, PMAX-rg1 showed the highest number of species of all investigated stand types. For the willows, however, differences between the harvested and the non-harvested stands were less pronounced and not significant. Stand types with native tree species (SOA, BEP) as well as accompanying structures (HEAD, CLEAR) showed average species numbers. Species numbers at stand-level (Figure A1 in Appendix A) followed the trend of species numbers at plot-level. Since only two or three individual stands were surveyed per stand type, a statistical comparison at this level was not applicable.
3.2.2. Species Composition and Species Numbers with Regard to Habitat Preferences
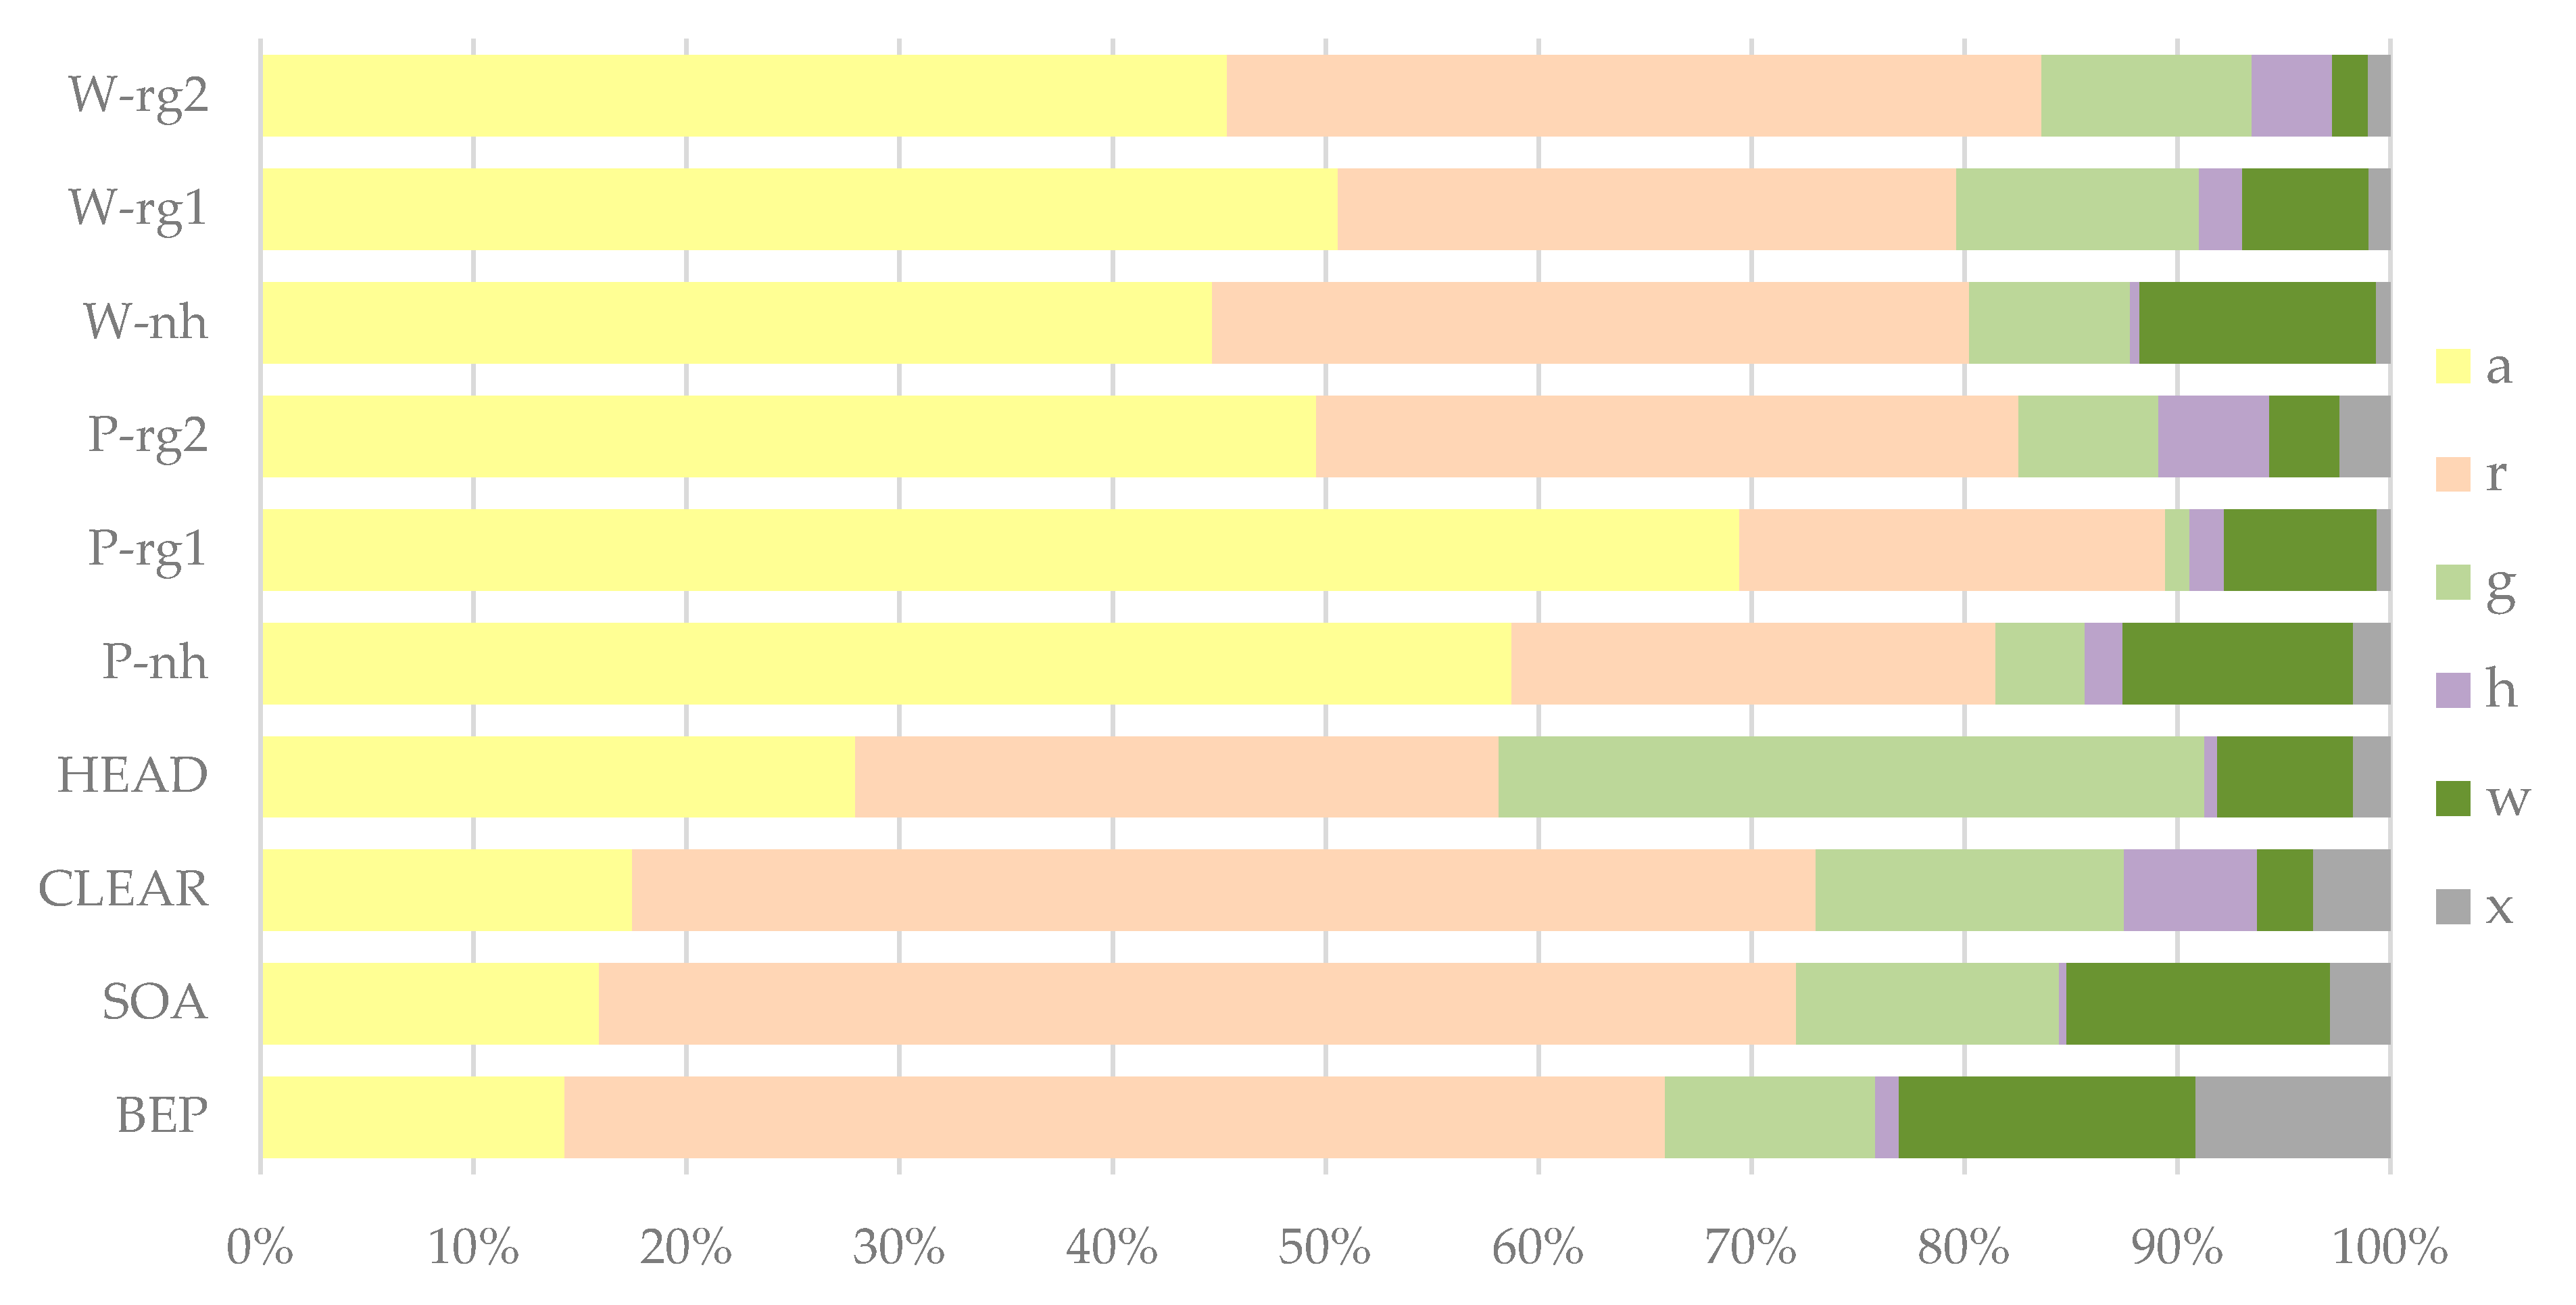
Figure 7 shows the species composition within the different SRC stand types with regard to the habitat preferences of the detected species weighted with their frequencies. Willow and poplar stands (varieties of the same genus were combined for this analysis) had particularly high proportions (45–70%) of species from arable land or short-lived ruderal habitats, both when harvested (-rg1, -rg2) and when not harvested (-nh). The highest proportions (almost 70%) were found in the poplar stands in the first growing season after harvest (P-rg1). Species of persistent ruderal habitats had particularly high proportions (50–60%) in SOA, BEP and CLEAR, while grassland species (almost 35%) were most frequently in HEAD. Species of woody habitats had low proportions overall, but were slightly more frequent in stands that had not been harvested since the establishment of the SRC (SOA, BEP, W-nh, P-nh).
In addition to Figure 7, Table A1 shows the mean numbers of species of different habitat preferences within the different SRC stand types at plot-level. Particularly high numbers of arable species were found within the different willow (WING, WTOR) and poplar (P275, PMAX) stands in the first (-rg1) and second (-rg2) growing season after harvesting. In contrast, BEP, SOA and CLEAR had particularly low numbers of arable species. Species of persistent ruderal habitats were found with similar numbers per plot in most of the surveyed stand types. Only the non-harvested poplar stands (P275-nh, PMAX-nh) had comparatively low numbers of species belonging to this category. Grassland species were also recorded with similar numbers per plot in most of the stand types. HEAD had the highest number of grassland species per plot while P275-nh and PMAX-nh had the lowest. The number of woodland species was generally low in all stand types and there were no significant differences between the different types.
3.2.3. Similarity of Plant Communities
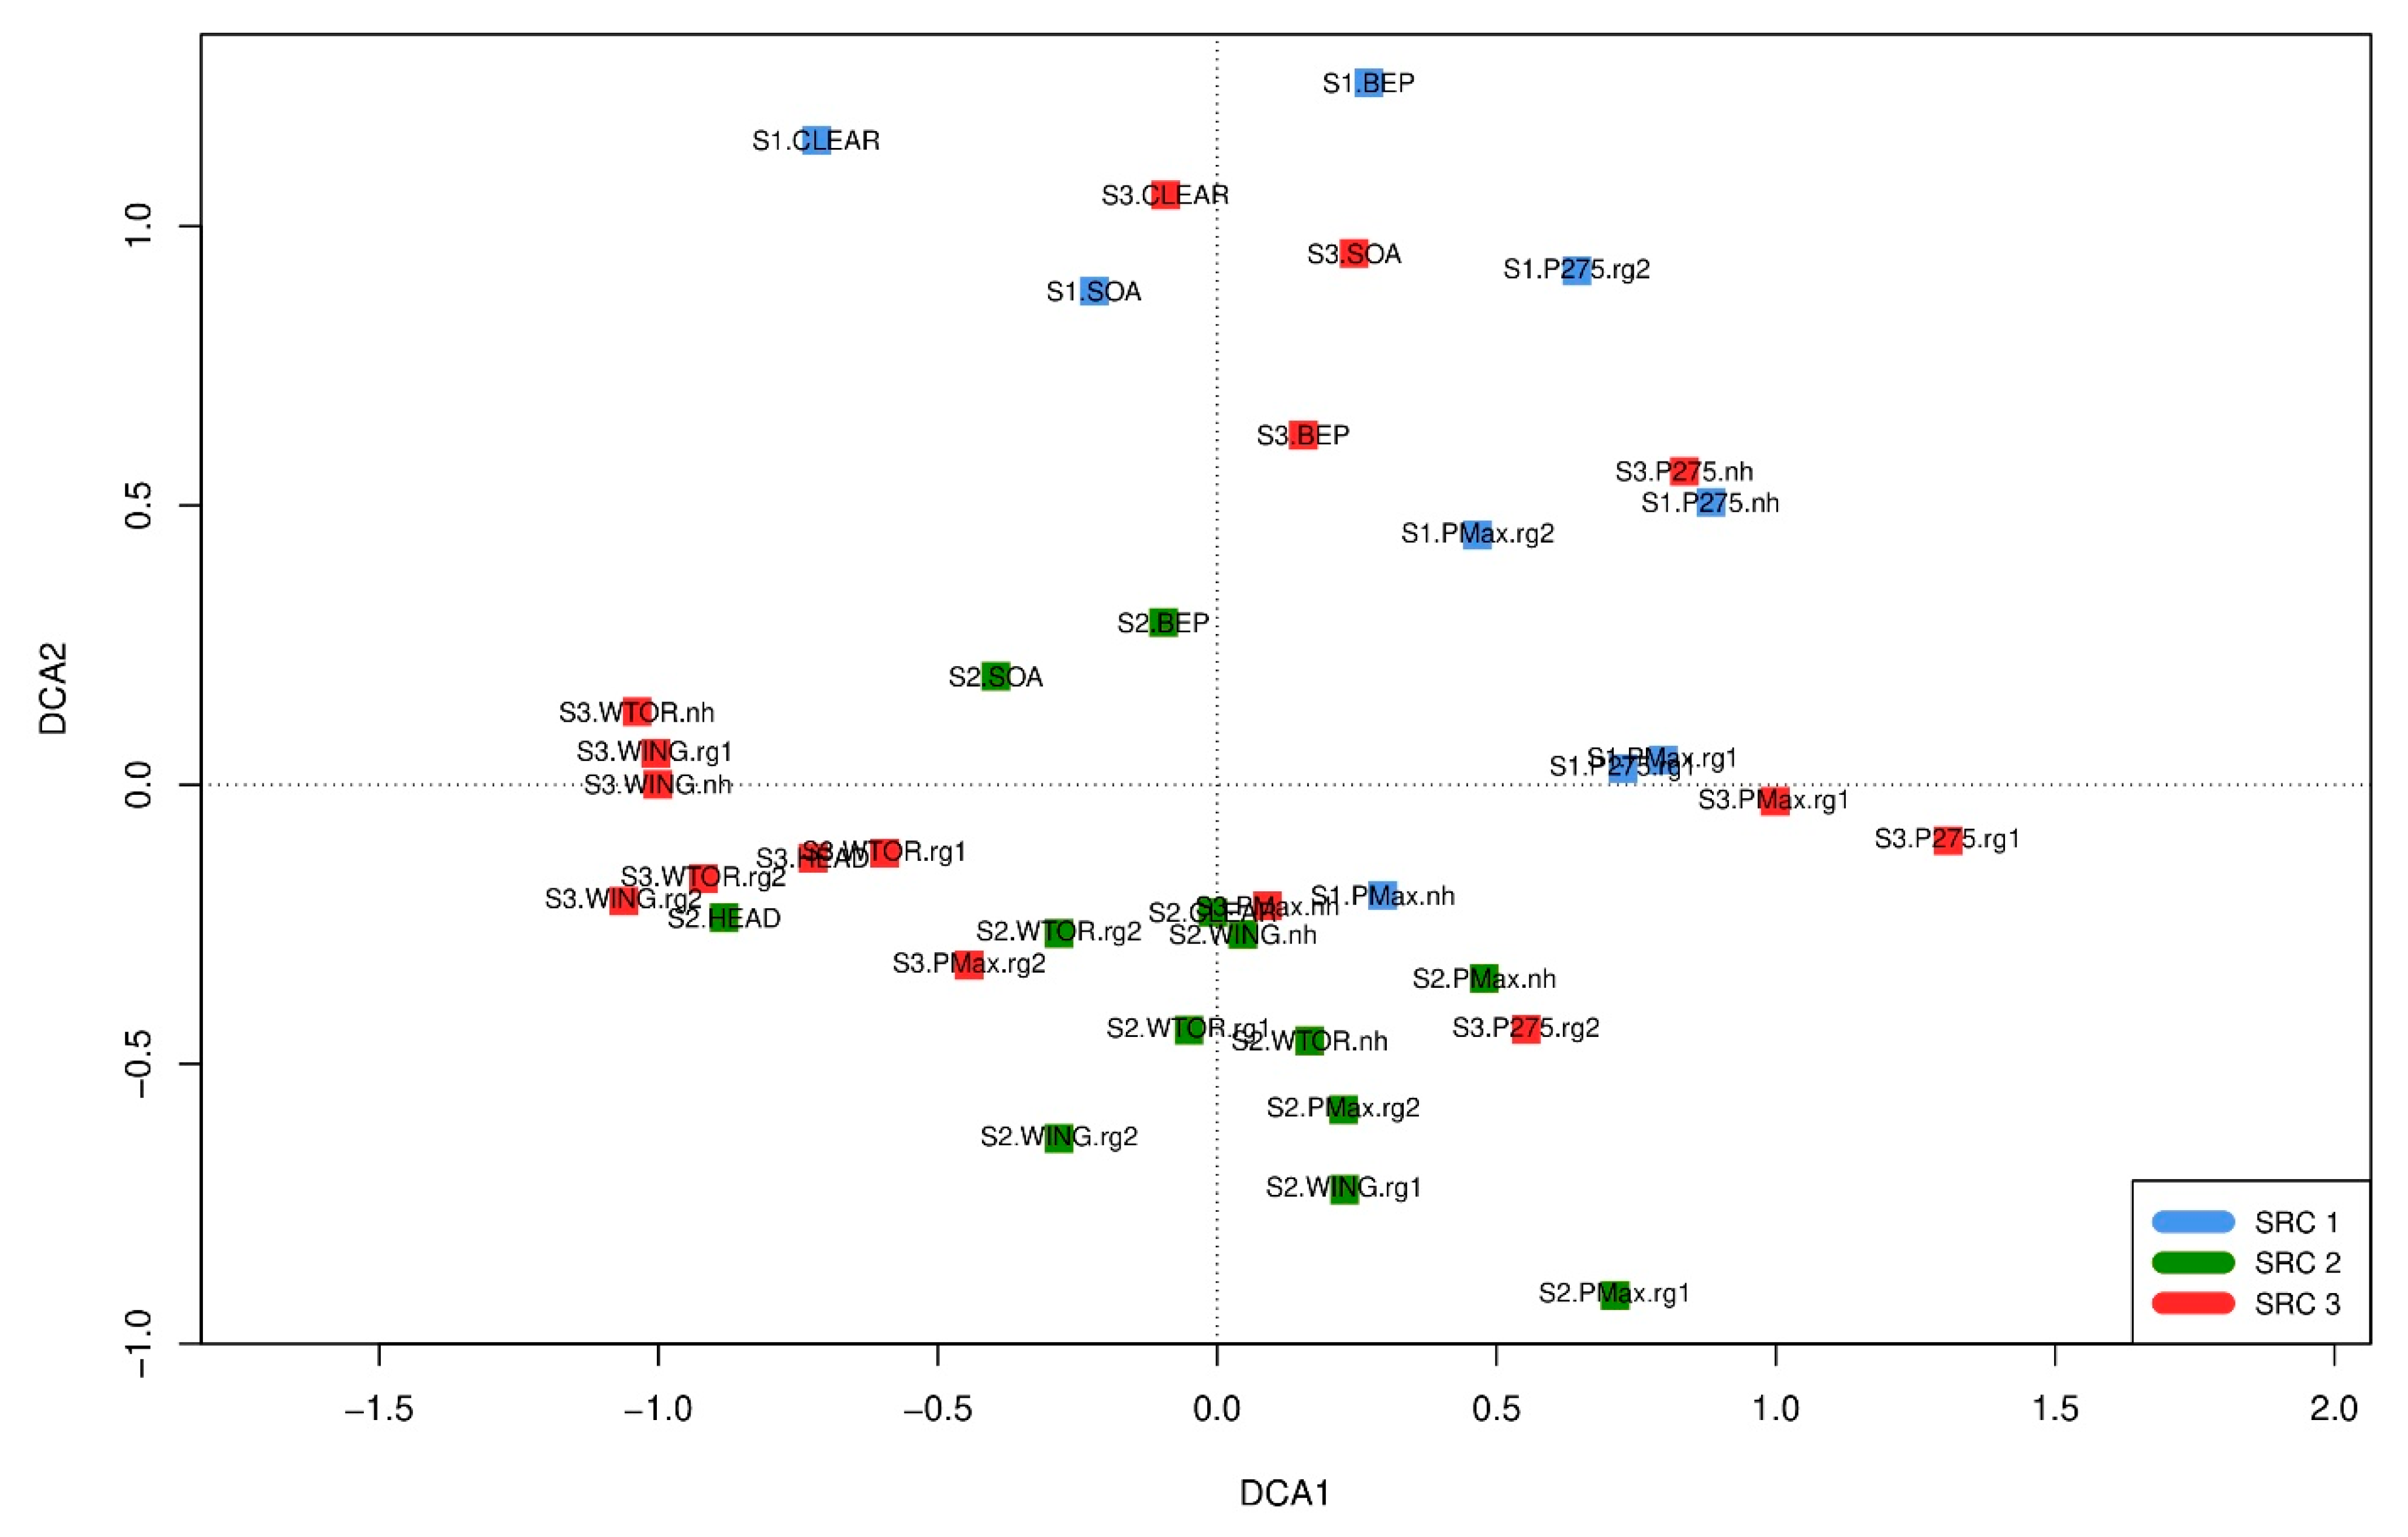
The DCA graph (Figure 8) shows a wide dispersion of the different SRC stands both within and between the sites. Stands within the same site were therefore not clearly separated into distinct groups, instead there were overlaps between the three sites and their individual stands. These overlaps indicate some similarities with regard to the development of the flora and the species composition on the three surveyed SRC sites (as complexes consisting of different stand types).
In terms of qualitative (occurring species) and quantitative (frequency of the species) species composition there were, in some cases, somewhat greater similarities between stands from different sites, but in other cases there were also clear differences. Overall, the graph of the DCA shows a heterogeneous result in which no clear patterns of similarity between certain stands or stand types are discernable. On the one hand, it is not clearly discernible that stands of the same stand type (on different sites) were regularly very similar. At the same time, stands (of different stand types) within the same sites were not necessarily very similar. Some stands differed considerably from other stands within the same site with regard to their species composition. This was most evident for SOA and BEP on all three sites. In other cases, however, there were also greater similarities between different stands within the same site. This was particularly noticeable at sites 2 and 3. For example, on site 3 there was a fairly high similarity between the willow stands of different varieties and growth-stages.
4. Discussion
In accordance with previous studies on phytodiversity of SRC [22,23,26,31], we also found significantly higher species numbers compared to conventional arable fields with annual crops. Species of arable land and short-lived ruderal habitats still had high proportions on the surveyed SRC in the 8th and 9th year after establishment and were particularly frequent in comparison to species of other habitat preferences. A reason for this is the landscape context (high proportion of arable land) and the previous agricultural use of the SRC sites. Both factors can influence the species composition of SRC for a long time after its establishment [27,30,36]. On the other hand, the high proportion of arable species can also be explained by the sectional harvesting, since it repeatedly creates suitable conditions for these light-demanding species in certain areas of the plantations [cf. [31,34]]. Especially within the harvested stands, high numbers and frequency proportions of arable species (such as Aphanes australis, Myosotis arvensis, Spergula arvensis or Veronica arvensis) were found. Many of these species were absent or less frequent in the surveyed arable fields with maize cultivation. Therefore, recently harvested (as well as recently established) SRC can provide a substitute habitat for common arable species that do not find suitable conditions on intensively used conventional arable fields anymore. However, SRC are not expected to have any potential to promote rare or threatened arable species, since the shading from trees and competition with the accompanying perennial herbaceous vegetation does not provide favorable conditions for highly specialized and low-competitive arable species [23,31,54,55]. In order to promote rare and threatened arable species, specific measures within arable fields are required [56,57], and SRC do not offer an alternative to these.
In comparison to AFO, HE-Y and FM, the surveyed SRC had similar species numbers. In comparison to HE-O, the species numbers of SRC were even higher. At the same time, species composition of SRC was quite different from the other habitat types, in particular from HE-O, FM and AL. Even though many species found on the SRC also occurred in the other habitat types, the combination of these species on the SRC was different from the other habitat types in qualitative (species inventory) and quantitative (species frequencies) terms. Furthermore, the SRC also contained some species that were not found in the other surveyed habitats. Therefore, the SRC formed distinct plant communities that differed from the other farmland habitat types (cf. similar findings of Baum et al. [26]). Similarity of the surveyed SRC with AFO and HE-Y was highest in comparison to the other habitat types. This is not a surprising result, as these habitats had a similar age and vegetation structure as the SRC and were also established on arable land. However, during succession, the similarity of AFO and HE-Y with SRC will further decrease. This is already indicated by the higher numbers and proportions of perennial species and the lower numbers and proportions of short-lived species in AFO and HE-Y (Table 3, Figure 4). Despite their similar species numbers, SRC are not an immediate substitute for other habitats of agricultural landscapes, since they have their own distinct plant communities. Instead, SRC are novel habitats that can increase the habitat diversity of a landscape [24,26,33] and complement the range of existing agricultural crops and the range of regularly implemented measures to promote farmland biodiversity such as afforestations, hedges or field margins. Thus, SRC can contribute to phytodiversity at the landscape-level, especially in intensively used agricultural landscapes with low habitat heterogeneity [cf. [25,33]].
A major result of our surveys of different stands within the SRC is that different stand types, either with different tree species or in different growth-stages, can significantly increase plant species diversity within a plantation. This confirms recommendations [cf. [15,27,34]] for implementing appropriate measures to promote phytodiversity on SRC. The positive effect of such a mosaic is shown by the fact that the species composition of different stand types within the same site differed considerably in several cases. Different stand types create heterogeneous conditions (e.g., light availability, intensity of disturbance), providing habitats for species with different habitat requirements within the same site [34,58]. Regular disturbance by harvesting was particularly beneficial for phytodiversity at stand-level. This was particularly evident for the poplar stands, where species numbers strongly increased after harvesting. For the willow stands, species numbers also increased after harvesting, but more moderately. In contrast, stands with native tree species (SOA, BEP) as well as headlands (HEAD) and clearings (CLEAR) contained fairly average species numbers. SOA and BEP had not been disturbed by harvesting so far. In addition, these stand types were either characterized by numerous tree failures (BEP) or tree growth was significantly lower (SOA) than for the poplar and willow clones. Due to the high light availability and the lack of any disturbance, these stand types, as well as HEAD and CLEAR, were often dominated by highly competitive species (e.g., Elymus repens, Festuca rubra) of persistent ruderal habitats or grasslands (similar observations were made by Glaser and Schmidt [23] within gaps of SRC, where trees failed to grow), while species of arable land or short-lived ruderal habitats had lower numbers and proportions (Figure 7, Table A1). However, despite their more average species numbers, these stand types were also important for the phytodiversity of the entire plantation, as they differed considerably from the poplar and willow stands in terms of their species composition (see Figure 7 and Figure 8). In addition, stands with native tree species and/or accompanying structures are important components of SRC for other species groups such as ground beetles [59], large and medium-sized mammals [60], breeding birds [61,62] or birds in the winter season [63] and are therefore important features of SRC with regard to overall biodiversity. Furthermore, plant species richness in non-wooded accompanying structures of SRC such as headlands, clearings/gaps and rides can be further increased by additional measures, e.g., by establishing species-rich fringe vegetation by seeding of native seed mixtures (see Kiehl et al. [64] for general recommendations).
In addition to the partly considerable differences between harvested and non-harvested stands within the SRC (especially within the poplar stands), the non-harvested poplar and willow stands also differed considerably with regard to their species numbers and species composition. These differences can essentially be explained by the specific local conditions that exist in SRC stands with different tree species. Specific characteristics (e.g., leaf shape and size) of different tree species and varieties can influence the environmental conditions within the stands; large-leafed poplar clones lead to much greater shading than narrow-leafed willow clones at similar planting densities [31]. The resulting low species numbers in the non-harvested poplar stands, however, lead to a significant increase in species numbers directly after harvesting, as many plant species are able to establish spontaneously in these almost vegetation-free stands [cf. [31,54]]. In the willow stands, on the other hand, the increase in species numbers after harvest was much more moderate. This was due to the fact, that there still existed a comparatively species-rich and dense herb layer before harvest which meant that there was less space for additional species to establish spontaneously. Based on these findings, it can be concluded that stand types that differ significantly in terms of their structural characteristics (e.g., poplar and willow stands) are particularly beneficial for the phytodiversity of the entire plantation (as a mosaic of different stands) [cf. 34]. In contrast, if only different clones of the same tree genus are cultivated within a SRC, the increase in phytodiversity is likely to be less pronounced since the habitat conditions in stands of the same genera are more similar [cf. [31]].
A finding that seems unusual at first sight is the high frequency of species from arable land and short-lived ruderal habitats within the non-harvested willow and poplar stands (Figure 7). However, it must be taken into account that these were, especially in the case of the poplar stands, only a few frequently occurring species (in P-nh especially Chenopodium album and Stellaria media), which colonized the stands at the beginning of the vegetation period (April–June), but which had already disappeared in summer when the canopy closed. Similar findings of seasonal changes on flora are reported by Gustafsson [28] for SRC in Sweden and by Heilmann et al. [31] for SRC in Germany.
In addition to the positive contribution of a mosaic of different stand types to the phytodiversity of the SRC at the site-level, the small size of the individual stands is likely to have had a beneficial effect on phytodiversity at stand-level, since edge-zones of SRC are usually more species-rich than central areas [22,25,32,54,65]. To promote phytodiversity, SRC should either be small-scale and established in an elongated and rectangular rather than a square shape, or larger plantations should be managed in a small-scale manner (like on the investigated SRC sites) in order to increase the proportion of edge-zones and improve immigration opportunities for plants [34].
Basically, the plant communities of the surveyed SRC and all other investigated habitat types were dominated by widespread, common and non-threatened plant species. In our study region, the presence of species of conservation concern was not expected, since the establishment potential for these species is limited due to many decades of intensive agricultural use [66,67,68]. However, in many other studies on SRC in different regions of Germany and in other European countries [22,23,24,25,26,29,33,54,55,69], these woody crops did not prove to be a habitat of major importance for rare or threatened plant species. Instead, they supported adaptable, mostly competitive, widespread and common plant species. The few threatened or rare species found on SRC so far were mostly light-demanding pioneer species that were present in the first few years after establishment and disappeared as the SRC matured [34,70]. Therefore, SRC cannot be expected to be a suitable measure to promote rare, threatened or specialized plant species, even when managed according to ecological guidelines.
5. Conclusions
Small-scale and structurally diverse SRC which are managed according to ecological guidelines provide suitable habitats for a variety of different plant species due to their diverse habitat conditions within the same site. They have similar species numbers as hedges and afforestations of the same age or narrow field margins. Due to their specific habitat characteristics, they form distinct plant communities that differ considerable from other farmland habitats. Therefore, they can increase habitat diversity in intensively used agricultural landscapes and thus be an additional tool to promote farmland phytodiversity [cf. [33]]. However, the species that benefit from their establishment are mostly adaptable, widespread and common species of no conservation concern [cf. [34]]. On the investigated SRC, it was confirmed that measures such as harvesting in sections or cultivation of different tree species in small-scale units within the same plantation, are particularly effective in promoting phytodiversity of these woody biomass crops. Therefore, these measures could be offered as agri-environmental schemes in order to compensate for the associated effort or yield reduction and to further increase the ecological sustainability of biomass production on SRC [cf. [71,72]].
Author Contributions
Conceptualization, F.Z.; methodology, F.Z. and M.R.; formal analysis, F.Z.; investigation, F.Z.; data curation, F.Z.; writing original draft preparation, F.Z.; writing review and editing, F.Z. and M.R.; visualization, F.Z.; supervision, M.R.; project administration, M.R.; funding acquisition, M.R. All authors have read and agreed to the published version of the manuscript.
Funding
This research was funded by the Lower Saxony Ministry of Food, Agriculture and Consumer Protection [Niedersächsisches Ministerium für Ernährung, Landwirtschaft und Verbraucherschutz], grant number 105.2-3234/1-13-4. The publication of this article was funded by the Open Access Fund of Leibniz University Hannover.
Institutional Review Board Statement
Not applicable.
Informed Consent Statement
Not applicable.
Data Availability Statement
The raw-datasets generated during and/or analysed during the current study are available from the corresponding author on reasonable request.
Acknowledgments
We are grateful to the Lower Saxony Ministry of Food, Agriculture and Consumer Protection for the funding of our research. Furthermore, we thank K. Grobe, C. Meiser, J. Nöhren and G. Wienrich for their assistance in field work and L. von Falkenhayn for proofreading the English manuscript. We are also grateful to S. Budig, F. Schaarschmidt and A. Grobe for advice on the statistical analysis and for their help with some statistical analyses using the programme R. The publication of this article was funded by the Open Access Fund of Leibniz University Hannover.
Conflicts of Interest
The authors declare no conflict of interest. The funding organisation had no role in the design, execution, interpretation or writing of the study.
Appendix A
Figure A1.
Species numbers of the different stand types at stand-level. Filled circles show the data of the single stands sampled per stand type (with n = 2 or 3 replications per type). See Table 2 for abbreviations of stand types.
Figure A1.
Species numbers of the different stand types at stand-level. Filled circles show the data of the single stands sampled per stand type (with n = 2 or 3 replications per type). See Table 2 for abbreviations of stand types.


Table A1.
Number of species (overall and separated by species of different habitat preferences) of the different SRC stand types at plot-level. Values with no consistent letter indicate significant differences (p < 0.05). For abbreviations of stand types see Table 2.
Table A1.
Number of species (overall and separated by species of different habitat preferences) of the different SRC stand types at plot-level. Values with no consistent letter indicate significant differences (p < 0.05). For abbreviations of stand types see Table 2.
| No. of Species 1 | BEP | SOA | CLEAR | HEAD | P275 | PMAX | WING | WTOR | ||||||||
|---|---|---|---|---|---|---|---|---|---|---|---|---|---|---|---|---|
| -nh | -rg1 | -rg2 | -nh | -rg1 | -rg2 | -nh | -rg1 | -rg2 | -nh | -rg1 | -rg2 | |||||
| overall | 6.1 ± 3.1 ab | 6.3 ± 1.6 abc | 6.8 ± 2.4 abc | 5.7 ± 1.7 abc | 2 ± 1.1 d | 7.6 ± 3.3 abc | 7.7 ± 2.4 abc | 5 ± 2 a | 12.6 ± 3.1 c | 9.8 ± 2.2 abc | 7.8 ± 2.3 abc | 8.6 ± 2.3 abc | 9.1 ± 1.9 abc | 7.2 ± 2.5 abc | 11 ± 3.6 bc | 6.8 ± 2.9 abc |
| a | 0.9 ± 1 a | 1 ± 0.9 ab | 1.2 ± 1.4 ab | 1.6 ± 1 abcd | 1 ± 0.9 abc | 5.4 ± 2 de | 3.4 ± 1.7 abcde | 3.1 ± 1.5 abcde | 8.6 ± 2.4 e | 5.1 ± 2 de | 3.6 ± 1.9 abcde | 4.3 ± 2.2 bcde | 4.5 ± 1.4 cde | 3.1 ± 1.9 abcde | 5.6 ± 2.5 de | 2.7 ± 1.7 abcd |
| r | 3.1 ± 1.7 a | 3.5 ± 1.3 a | 3.8 ± 1.9 a | 1.7 ± 0.9 abc | 0.7 ± 0.7 b | 1.6 ± 1.5 abc | 2.8 ± 1.9 abc | 1 ± 0.8 bc | 2.5 ± 1.3 abc | 3 ± 1.7 a | 2.8 ± 1.2 ac | 2.4 ± 0.7 ac | 3.1 ± 0.8 a | 2.5 ± 1.2 ac | 3.3 ± 0.9 a | 3 ± 0.9 a |
| g | 0.6 ± 0.7 ab | 0.8 ± 0.8 ab | 1 ± 1 ab | 1.9 ± 0.6 a | 0 ± 0 b | 0.1 ± 0.3 b | 0.6 ± 0.6 ab | 0.3 ± 0.5 b | 0.2 ± 0.4 b | 0.6 ± 0.8 ab | 0.5 ± 0.5 ab | 1.2 ± 1.1 ab | 0.8 ± 0.9 ab | 0.6 ± 0.8 ab | 1.1 ± 0.9 ab | 0.8 ± 0.8 ab |
| w | 0.8 ± 0.9 | 0.8 ± 0.6 | 0.2 ± 0.4 | 0.4 ± 0.7 | 0.2 ± 0.5 | 0.4 ± 0.7 | 0.3 ± 0.6 | 0.6 ± 0.8 | 1 ± 0.9 | 0.3 ± 0.5 | 0.8 ± 1 | 0.3 ± 0.6 | 0.2 ± 0.4 | 0.8 ± 1 | 0.8 ± 1.5 | 0.1 ± 0.3 |
1 Abbreviations for habitat preferences: a = species of arable land or short-lived ruderal habitats, r = species of persistent ruderal habitats, g = grassland species, w = species of woodland, shrubs or hedges (incl. vegetation of woodland margins).
References
- Donald, P.F.; Sanderson, F.J.; Burfield, I.J.; van Bommel, F.P.J. Further evidence of continent-wide impacts of agricultural intensification on European farmland birds, 1990–2000. Agric. Ecosyst. Environ. 2006, 116, 189–196. [Google Scholar] [CrossRef]
- Eichenberg, D.; Bowler, D.E.; Bonn, A.; Bruelheide, H.; Grescho, V.; Harter, D.; Jandt, U.; May, R.; Winter, M.; Jansen, F. Widespread decline in Central European plant diversity across six decades. Glob. Chang. Biol. 2020, 1–14. [Google Scholar] [CrossRef]
- Cardoso, P.; Barton, P.S.; Birkhofer, K.; Chichorro, F.; Deacon, C.; Fartmann, T.; Fukushima, C.S.; Gaigher, R.; Habel, J.C.; Hallmann, C.A. Scientists’ warning to humanity on insect extinctions. Biol. Conserv. 2020, 242, 108426. [Google Scholar] [CrossRef]
- Hallmann, C.A.; Ssymank, A.; Sorg, M.; de Kroon, H.; Jongejans, E. Insect biomass decline scaled to species diversity: General patterns derived from a hoverfly community. Proc. Natl. Acad. Sci. USA 2021, 118, e2002554117. [Google Scholar] [CrossRef] [PubMed]
- Kamp, J.; Frank, C.; Trautmann, S.; Busch, M.; Dröschmeister, R.; Flade, M.; Gerlach, B.; Karthäuser, J.; Kunz, F.; Mitschke, A. Population trends of common breeding birds in Germany 1990–2018. J. Ornithol. 2021, 162, 1–15. [Google Scholar] [CrossRef]
- Warren, M.S.; Maes, D.; van Swaay, C.; Goffart, P.; van Dyck, H.; Bourn, N.A.D.; Wynhoff, I.; Hoare, D.; Ellis, S. The decline of butterflies in Europe: Problems, significance, and possible solutions. Proc. Natl. Acad. Sci. USA 2021, 118, e2002551117. [Google Scholar] [CrossRef]
- Stoate, C.; Boatman, N.D.; Borralho, R.J.; Carvalho, C.R.; de Snoo, G.R.; Eden, P. Ecological impacts of arable intensification in Europe. J. Environ. Manag. 2001, 63, 337–365. [Google Scholar] [CrossRef]
- Huston, M.A.; Marland, G. Carbon management and biodiversity. J. Environ. Manag. 2003, 67, 77–86. [Google Scholar] [CrossRef]
- Robertson, G.P.; Dale, V.H.; Doering, O.C.; Hamburg, S.P.; Melillo, J.M.; Wander, M.M.; Parton, W.J.; Adler, P.R.; Barney, J.N.; Cruse, R.M.; et al. Sustainable Biofuels Redux. Science 2008, 322, 49–50. [Google Scholar] [CrossRef]
- Eggers, J.; Tröltzscht, K.; Falcucci, A.; Maiorano, L.; Verburg, P.H.; Framstad, E.; Louette, G.; Maes, D.; Nagy, S.; Ozinga, W.I.M. Is biofuel policy harming biodiversity in Europe? Glob. Chang. Biol. Bioenergy 2009, 1, 18–34. [Google Scholar] [CrossRef] [Green Version]
- Fletcher, R.J.; Robertson, B.A.; Evans, J.; Doran, P.J.; Alavalapati, J.R.R.; Schemske, D.W. Biodiversity conservation in the era of biofuels: Risks and opportunities. Front. Ecol. Environ. 2011, 9, 161–168. [Google Scholar] [CrossRef] [Green Version]
- Everaars, J.; Frank, K.; Huth, A. Species ecology and the impacts of bioenergy crops: An assessment approach with four example farmland bird species. Glob. Chang. Biol. Bioenergy 2014, 6, 252–264. [Google Scholar] [CrossRef] [Green Version]
- Immerzeel, D.J.; Verweij, P.A.; van der Hilst, F.; Faaij, A.P.C. Biodiversity impacts of bioenergy crop production: A state-of-the-art review. Glob. Chang. Biol. Bioenergy 2014, 6, 183–209. [Google Scholar] [CrossRef] [Green Version]
- Sauerbrei, R.; Ekschmitt, K.; Wolters, V.; Gottschalk, T.K. Increased energy maize production reduces farmland bird diversity. Glob. Chang. Biol. Bioenergy 2014, 6, 265–274. [Google Scholar] [CrossRef]
- Sage, R.B. Short rotation coppice for energy: Towards ecological guidelines. Biomass Bioenergy 1998, 15, 39–47. [Google Scholar] [CrossRef]
- Dauber, J.; Jones, M.B.; Stout, J.C. The impact of biomass crop cultivation on temperate biodiversity. Glob. Chang. Biol. Bioenergy 2010, 2, 289–309. [Google Scholar] [CrossRef]
- Englund, O.; Dimitriou, I.; Dale, V.H.; Kline, K.L.; Mola-Yudego, B.; Murphy, F.; English, B.; McGrath, J.; Busch, G.; Negri, M.C.; et al. Multifunctional perennial production systems for bioenergy: Performance and progress. WIREs Energy Environ. 2020. [Google Scholar] [CrossRef]
- Pedroli, B.; Elbersen, B.; Frederiksen, P.; Grandin, U.; Heikkilä, R.; Krogh, P.H.; Izakovičová, Z.; Johansen, A.; Meiresonne, L.; Spijker, J. Is energy cropping in Europe compatible with biodiversity?—Opportunities and threats to biodiversity from land-based production of biomass for bioenergy purposes. Biomass Bioenergy 2013, 55, 73–86. [Google Scholar] [CrossRef]
- Dimitriou, I.; Rutz, D. (Eds.) Sustainable Short Rotation Coppice: A Handbook; WIP Renewable Energies: München, Germany, 2015. [Google Scholar]
- Vanbeveren, S.P.P.; Ceulemans, R. Biodiversity in short-rotation coppice. Renew. Sustain. Energy Rev. 2019, 111, 34–43. [Google Scholar] [CrossRef]
- Rowe, R.L.; Street, N.R.; Taylor, G. Identifying potential environmental impacts of large-scale deployment of dedicated bioenergy crops in the UK. Renew. Sustain. Energy Rev. 2009, 13, 271–290. [Google Scholar] [CrossRef]
- Cunningham, M.D.; Bishop, J.D.; McKay, H.V.; Sage, R.B. ARBRE Monitoring—Ecology of Short Rotation Coppice: Four Year Study Involving Wildlife Monitoring of Commercial SRC Plantations Planted on Arable Land and Arable Control Plots; Department of Trade and Industry: London, UK, 2004. [Google Scholar]
- Glaser, T.; Schmidt, P.A. Auswirkungen von Kurzumtriebsplantagen auf die Phytodiversität. In AGROWOOD: Kurzumtriebsplantagen in Deutschland und Europäische Perspektiven; Bemmann, A., Knust, C., Eds.; Weißensee-Verlag: Berlin, Germany, 2010; pp. 153–161. [Google Scholar]
- Britt, C.P.; Fowbert, J.; McMillan, S.D. The ground flora and invertebrate fauna of hybrid poplar plantations: Results of ecological monitoring in the PAMUCEAF project. Asp. Appl. Biol. 2007, 82, 83–90. [Google Scholar]
- Weih, M.; Karacic, A.; Munkert, H.; Verwijst, T.; Diekmann, M. Influence of young poplar stands on floristic diversity in agricultural landscapes (Sweden). Basic Appl. Ecol. 2003, 4, 149–156. [Google Scholar] [CrossRef]
- Baum, S.; Bolte, A.; Weih, M. High value of short rotation coppice plantations for phytodiversity in rural landscapes. GCB Bioenergy 2012, 4, 728–738. [Google Scholar] [CrossRef]
- Gustafsson, L. Plant conservation aspects of energy forestry-a new type of land use in Sweden. For. Ecol. Manag. 1987, 21, 141–161. [Google Scholar] [CrossRef]
- Gustafsson, L. Vegetation dynamics during the establishment phase of an energy forest on a riverside in south-western Sweden. Studia For. Suec. 1988, 178, 1–16. [Google Scholar]
- Baum, S.; Weih, M.; Bolte, A. Stand age characteristics and soil properties affect species composition of vascular plants in short rotation coppice plantations. BioRisk 2012, 7, 51–71. [Google Scholar] [CrossRef] [Green Version]
- Sage, R.B. Factors affecting wild plant communities occupying short rotation coppice crops on farmland in the UK and Eire. In Brighton Crop Protection Conference: Weeds. Proceedings of an International Conference, Brighton, UK, 20–23 November 1995; British Crop Protection Council: Farnham, UK, 1995; pp. 985–990. [Google Scholar]
- Heilmann, B.; Makeschin, F.; Rehfuess, K.E. Vegetationskundliche Untersuchungen auf einer Schnellwuchsplantage mit Pappeln und Weiden nach Ackernutzung. Forstwiss. Cent. 1995, 114, 16–29. [Google Scholar] [CrossRef]
- Birmele, J.; Kopp, G.; Brodbeck, F.; Konold, W.; Sauter, U.H. Successional changes of phytodiversity on a short rotation coppice plantation in Oberschwaben, Germany. Front. Plant Sci. 2015, 6, 1–8. [Google Scholar] [CrossRef] [PubMed]
- Baum, S.; Bolte, A.; Weih, M. Short rotation coppice (SRC) plantations provide additional habitats for vascular plant species in agricultural mosaic landscapes. BioEnergy Res. 2012, 5, 573–583. [Google Scholar] [CrossRef] [Green Version]
- Baum, S.; Weih, M.; Busch, G.; Kroiher, F.; Bolte, A. The impact of short rotation coppice plantations on phytodiversity. Appl. Agric. Forestry Res. 2009, 59, 163–170. [Google Scholar]
- Hennemann-Kreikenbohm, I.; Jennemann, L.; Peters, W.; Wilhelm, E.-G. Nature Conservation Requirements of Short Rotation Coppice Management. In Bioenergy from Dendromass for the Sustainable Development of Rural Areas; Butler Manning, D., Bemmann, A., Bredemeier, M., Lamersdorf, N., Ammer, C., Eds.; Wiley: Weinheim, Germany, 2015; pp. 97–104. ISBN 3527337644. [Google Scholar]
- Soo, T.; Tullus, A.; Tullus, H.; Roosaluste, E. Floristic diversity responses in young hybrid aspen plantations to land-use history and site preparation treatments. For. Ecol. Manag. 2009, 257, 858–867. [Google Scholar] [CrossRef]
- Landkreis Emsland. Die Gemeinden im Landkreis Emsland: Strukturdaten im Vergleich 2016, Meppen. 2016. Available online: https://www.emsland.de/das-emsland/zahlen-und-daten/strukturdaten/strukturdaten.html (accessed on 4 February 2021).
- DWD. Deutscher Wetterdienst (Ed.): Temperatur und Niederschlag, vieljährige Mittelwerte 1981–2010. Available online: https://www.dwd.de/DE/leistungen/klimadatendeutschland/vielj_mittelwerte.html (accessed on 4 February 2021).
- LBEG. Bodenkundliche Übersichtskarte von Niedersachsen und Bremen 1:500 000; Landesamt für Bergbau, Energie und Geologie: Hannover, Germany, 1999. [Google Scholar]
- Rothmaler—Exkursionsflora von Deutschland. Gefäßpflanzen: Grundband; Jäger, E.J., Ed.; 21 Durchgesehene Auflage; Springer: Berlin/Heidelberg, Germany, 2017; ISBN 978-3-662-49707-4. [Google Scholar]
- Moral, R.d.A.; Hinde, J.; Demetrio, C. R Package ’hnp’; R Foundation for Statistical Computing: Vienna, Austria, 2018. [Google Scholar]
- R Core Team. R Version 4.0.4; R Core Team: Vienna, Austria, 2021. [Google Scholar]
- Bates, D.; Maechler, M.; Bolker, B.; Walker, S.; Christensen, R.H.B.; Singmann, H.; Dai, B.; Scheipl, F.; Grothendieck, G.; Green, P.; et al. R Package ’lme4’; R Core Team: Vienna, Austria, 2019. [Google Scholar]
- Kuznetsova, A.; Brockhoff, P.B.; Christensen, R.H.B.; Jensen, S.P. R Package ’lmerTest’; R Foundation for Statistical Computing: Vienna, Austria, 2020. [Google Scholar]
- Lenth, R.; Singmann, H.; Love, J.; Buerkner, P.; Herve, M. R Package ’emmeans’; R Foundation for Statistical Computing: Vienna, Austria, 2019. [Google Scholar]
- Wickham, H.; Chang, W.; Henry, L.; Pedersen, T.L.; Takahashi, K.; Wilke, C.; Woo, K.; Yutani, H. R Package ’ggplot2’; R Foundation for Statistical Computing: Vienna, Austria, 2019. [Google Scholar]
- Gotelli, N.J.; Colwell, R.K. Quantifying biodiversity: Procedures and pitfalls in the measurement and comparison of species richness. Ecol Lett 2001, 4, 379–391. [Google Scholar] [CrossRef] [Green Version]
- McAleece, N.; Gage, J.D.G.; Lambshead, P.J.D.; Paterson, G.L.J. BioDiversity Professional Statistics Analysis Software; Scottish Association for Marine Science: Oban, UK, 1997. [Google Scholar]
- Oberdorfer, E. Pflanzensoziologische Exkursionsflora, 8th ed.; Verlag Eugen Ulmer: Stuttgart, Germany, 2001. [Google Scholar]
- Oksanen, J.; Blanchet, F.G.; Kindt, R.; Legendre, P.; McGlinn, D.; Minchin, P.R.; O’hara, R.B.; Simpson, G.L.; Solymos, P.; Stevens, M.H.H.; et al. R Package ‘vegan’; R Foundation for Statistical Computing: Vienna, Austria, 2020. [Google Scholar]
- Warnes, G.R.; Bolker, B.; Bonebakker, L.; Gentleman, R.; Huber, W.; Liaw, A.; Lumley, T.; Maechler, M.; Magnussen, A.; Moeller, S.; et al. R Package ‘gplots’; R Foundation for Statistical Computing: Vienna, Austria, 2020. [Google Scholar]
- Metzing, D.; Garve, E.; Matzke-Hajek, G.; Adler, J.; Bleeker, W.; Breunig, T.; Caspari, S.; Dunkel, F.G.; Fritsch, R.; Gottschlich, G.; et al. Rote Liste und Gesamtartenliste der Farn- und Blütenpflanzen (Trachaeophyta) Deutschlands. Nat. Biol. Vielfalt 2018, 70, 13–358. [Google Scholar]
- Garve, E. Rote Liste und Florenliste der Farn- und Blütenpflanzen in Niedersachsen und Bremen. 5. Fassung, Stand 1.3.2004. Inform. Nat. Niedersachs. 2004, 24, 1–76. [Google Scholar]
- Seifert, C.; Leuschner, C.; Culmsee, H. Short rotation coppice as habitat for vascular plants. In Bioenergy from Dendromass for the Sustainable Development of Rural Areas; Butler Manning, D., Bemmann, A., Bredemeier, M., Lamersdorf, N., Ammer, C., Eds.; Wiley: Weinheim, Germany, 2015; pp. 63–78. ISBN 3527337644. [Google Scholar]
- Pöltl, M.; Berg, C. Vegetationskundliche Untersuchung von Kurzumtriebsplantagen (KUP) bestockt mit Populus × canadensis im südoststeirischen Alpenvorland. Mitt. Nat. Ver. Steiermark 2016, 146, 5–18. [Google Scholar]
- Meyer, S.; Wesche, K.; Krause, B.; Leuschner, C. Dramatic losses of specialist arable plants in Central Germany since the 1950s/60s–a cross-regional analysis. Divers. Distrib. 2013, 19, 1175–1187. [Google Scholar] [CrossRef]
- Lang, M.; Kollmann, J.; Prestele, J.; Wiesinger, K.; Albrecht, H. Reintroduction of rare arable plants in extensively managed fields: Effects of crop type, sowing density and soil tillage. Agric. Ecosyst. Environ. 2021, 306, 107187. [Google Scholar] [CrossRef]
- Baum, S.; Weih, M.; Bolte, A. Floristic diversity in Short Rotation Coppice (SRC) plantations: Comparison between soil seed bank and recent vegetation. Landbauforsch. Appl. Agric. For. Res. 2013, 63, 221–228. [Google Scholar]
- Kriegel, P.; Fritze, M.-A.; Thorn, S. Surface temperature and shrub cover drive ground beetle (Coleoptera: Carabidae) assemblages in short-rotation coppices. Agric. For. Entomol. 2021. [Google Scholar] [CrossRef]
- Zitzmann, F.; Reich, M.; Schaarschmidt, F. Potential of small-scale and structurally diverse short-rotation coppice as habitat for large and medium-sized mammals. Biologia 2021. [Google Scholar] [CrossRef]
- Gruß, H.; Schulz, U. Brutvogelfauna auf Kurzumtriebsplantagen: Besiedlung und Habitateignung verschiedener Strukturtypen. Nat. Landsch. 2011, 43, 197–204. [Google Scholar]
- Hanowski, J.M.; Niemi, G.J.; Christian, D.C. Influence of Within-Plantation Heterogeneity and Surrounding Landscape Composition on Avian Communities in Hybrid Poplar Plantations. Conserv. Biol. 1997, 11, 936–944. [Google Scholar] [CrossRef]
- Zitzmann, F.; Reich, M. Bedeutung von Kurzumtriebsbeständen mit unterschiedlichen Gehölzarten als Lebensraum für Vögel im Winterhalbjahr. Vogelwelt 2019, 139, 261–272. [Google Scholar]
- Kiehl, K.; Kirmer, A.; Jeschke, D.; Tischew, S. Restoration of speciesrich field margins and fringe communities by seeding of native seed mixtures. In Guidelines for Native Seed Production and Grassland Restoration; Kiehl, K., Kirmer, A., Shaw, N., Tischew, S., Eds.; Cambridge Scholars Publishing: Newcastle upon Tyne, UK, 2014; pp. 244–273. [Google Scholar]
- Rowe, R.L.; Hanley, M.E.; Goulson, D.; Clarke, D.J.; Doncaster, C.P.; Taylor, G. Potential benefits of commercial willow Short Rotation Coppice (SRC) for farm-scale plant and invertebrate communities in the agri-environment. Biomass Bioenergy 2011, 35, 325–336. [Google Scholar] [CrossRef]
- Meyer, S.; Bergmeier, E.; Becker, T.; Wesche, K.; Krause, B.; Leuschner, C. Detecting long-term losses at the plant community level–arable fields in Germany revisited. Appl. Veg. Sci. 2015, 18, 432–442. [Google Scholar] [CrossRef]
- Wietzke, A.; van Waveren, C.-S.; Bergmeier, E.; Meyer, S.; Leuschner, C. Current State and Drivers of Arable Plant Diversity in Conventionally Managed Farmland in Northwest Germany. Diversity 2020, 12, 469. [Google Scholar] [CrossRef]
- Wietzke, A.; Albert, K.; Bergmeier, E.; Sutcliffe, L.M.E.; van Waveren, C.-S.; Leuschner, C. Flower strips, conservation field margins and fallows promote the arable flora in intensively farmed landscapes: Results of a 4-year study. Agric. Ecosyst. Environ. 2020. [Google Scholar] [CrossRef]
- Cunningham, M.D.; Bishop, J.D.; Watola, G.; McKay, H.V.; Sage, R.B. The Effects on Flora and Fauna of Converting Grassland to Short Rotation Coppice: Four Year Study Involving Wildlife Monitoring of Commercial SRC Plantations Planted on Grassland and Grassland Control Plots; The Game Conservancy Trust: Fordingbridge, UK, 2006. [Google Scholar]
- Delarze, R.; Ciardo, F. Rote Liste Arten in Pappelplantagen. Inf. Forsch. Wald 2002, 9, 3–4. [Google Scholar]
- Sage, R.; Cunningham, M.; Boatman, N. Birds in willow short-rotation coppice compared to other arable crops in central England and a review of bird census data from energy crops in the UK. IBIS 2006, 148, 184–197. [Google Scholar] [CrossRef]
- Fry, D.A.; Slater, F.M. Early rotation short rotation willow coppice as a winter food resource for birds. Biomass Bioenergy 2011, 35, 2545–2553. [Google Scholar] [CrossRef]
Figure 1.
Aerial view on one of the three surveyed experimental SRC sites (site no. 3). The stands with different varieties of poplar and willow (in different growth-stages) and with different native tree species as well as the accompanying structures headland and clearing are clearly visible (Recording date: June 2019). See Table 2 for abbreviations of the SRC stand types.

Figure 2.
Species numbers of the different habitat types at plot-level (A) and at stand-level (B). Types with no consistent letter indicate significant differences (p < 0.05). Median values are presented as horizontal orange lines, mean values as orange diamonds. Unfilled circles show the data of the single plots or stands sampled per type. In each boxplot, the boundaries of the box are the 25th and 75th percentiles and the whiskers represent the lowest and largest values no further than 1.5 times away from the 25th and 75th percentiles.

Figure 3.
Estimated number of species for the different short-rotation coppice (SRC) and afforestation (AFO) sites for a given number of sampled plots (based on sample-based rarefaction, see data preparation and statistical analysis).
Figure 3.
Estimated number of species for the different short-rotation coppice (SRC) and afforestation (AFO) sites for a given number of sampled plots (based on sample-based rarefaction, see data preparation and statistical analysis).

Figure 4.
Proportions of plant species of different habitat preferences in the different habitat types (see Table 1 for abbreviations) weighted with their frequencies. Data of all sites, stands and plots included per type. Abbreviations for habitat preferences: a = species of arable land or short-lived ruderal habitats, r = species of persistent ruderal habitats, g = grassland species, h = species of heathland or nutrient-poor/dry grasslands, w = species of woodland, shrubs or hedges (incl. vegetation of woodland margins), x = indifferent, not stated or other habitat.

Figure 5.
DCA ordination of the individual stands/sites of the different habitat types (see Table 1 for abbreviations). Eigenvalue axis 1: 0.4266, axis 2: 0.3283, length of axis 1: 4.9152, axis 2: 3.0447.
Figure 5.
DCA ordination of the individual stands/sites of the different habitat types (see Table 1 for abbreviations). Eigenvalue axis 1: 0.4266, axis 2: 0.3283, length of axis 1: 4.9152, axis 2: 3.0447.

Figure 6.
Species numbers of the different SRC stand types at plot-level. Types with no consistent letter indicate significant differences (p < 0.05). Median values are presented as horizontal lines, mean values as orange diamonds. Unfilled circles show the data of the single plots sampled per type. In each boxplot, the boundaries of the box are the 25th and 75th percentiles and the whiskers represent the lowest and largest values no further than 1.5 times away from the 25th and 75th percentiles. See Table 2 for abbreviations of stand types.

Figure 7.
Proportions of plant species of different habitat preferences within the SRC stand types weighted with their frequencies (see Table 2 for abbreviations of stand types; different poplar (P) and willow (W) varieties are combined). Abbreviations for habitat preferences: a = species of arable land or short-lived ruderal habitats, r = species of persistent ruderal habitats, g = grassland species, h = species of heathland or nutrient-poor/dry grasslands, w = species of woodland, shrubs or hedges (incl. vegetation of woodland margins), x = indifferent, not stated or other habitat.

Figure 8.
DCA ordination of the individual stands of the different SRC stand types. See Table 2 for abbreviations of SRC stand types. Eigenvalue axis 1: 0.3243, axis 2: 0.2540, length of axis 1: 2.3706, axis 2: 2.1698.
Figure 8.
DCA ordination of the individual stands of the different SRC stand types. See Table 2 for abbreviations of SRC stand types. Eigenvalue axis 1: 0.3243, axis 2: 0.2540, length of axis 1: 2.3706, axis 2: 2.1698.

Table 1.
Surveyed habitat types and number of surveyed sites, stands and plots per type.
| Habitat Type | Area (ha) or Length (m) | No. of Sites (No. of Stands) | No. of Plots Per Site | No. of Plots Per Habitat Type |
|---|---|---|---|---|
| Short-rotation coppice (SRC) | 2.0–2.2 ha | 3 (38) | 135, 195, 240 | 570 |
| Afforestation (AFO) | 0.9–3.4 ha | 3 (13) | 45, 105, 45 | 195 |
| Hedge ‘young’ (HE-Y) | 180–430 m | 3 | 15 | 45 |
| Hedge ‘old’ (HE-O) | 110–230 m | 6 | 15 | 90 |
| Field margin (FM) | 70–200 m | 6 | 15 | 90 |
| Arable land (maize) (AL) | 1.6–6.0 ha | 6 | 15 | 90 |
Table 2.
Characteristics of the surveyed SRC stand types.
| SRC Stand Type | Abbrev. | No. of Stands | Planting Scheme (stools/ha) | Stools/ha (Incl. Failures) | Tree Height (m) | |
|---|---|---|---|---|---|---|
| Poplar ‘Max 3’ | non-harvested | PMAX-nh | 3 | 2 × 0.5 (10,000) | 12–15 | |
| 2nd-year regrowth | PMAX-rg2 | 3 | 6000–7500 | 3–5 | ||
| 1st-year regrowth | PMAX-rg1 | 3 | <0.5 | |||
| Poplar ‘Hybride 275′ | non-harvested | P275-nh | 2 | 2 × 0.5 (10,000) | 12–15 | |
| 2nd-year regrowth | P275-rg2 | 2 | 5000–7500 | 2–3 | ||
| 1st-year regrowth | P275-rg1 | 2 | <0.5 | |||
| Willow ‘Inger‘ | non-harvested | WING-nh | 2 | 2 × 0.75 × 0.6 (12,000) | 8–10 | |
| 2nd-year regrowth | WING-rg2 | 2 | 8000–10,000 | 2–3 | ||
| 1st-year regrowth | WING-rg1 | 2 | <0.5 | |||
| Willow ‘Tordis‘ | non-harvested | WTOR-nh | 2 | 2 × 0.75 × 0.6 (12,000) | 8–10 | |
| 2nd-year regrowth | WTOR-rg2 | 2 | 8000–10,000 | 2–3 | ||
| 1st-year regrowth | WTOR-rg1 | 2 | <0.5 | |||
| Sorbus aucuparia | non-harvested | SOA | 3 | 2 × 0.5 (10,000) | 8000–9000 | 2–5 |
| Betula pendula | non-harvested | BEP | 3 | 2 × 1 (5000) | 1000–3000 | 8–12 |
| Clearings | CLEAR | 3 | – | – | – | |
| Headlands | HEAD | 2 | – | – | – | |
Table 3.
Number of species (overall and separated by species of different habitat preferences) per habitat type (total number and mean ± SD per site/stand and per plot). Values with no consistent letter indicate significant differences (p < 0.05).
Table 3.
Number of species (overall and separated by species of different habitat preferences) per habitat type (total number and mean ± SD per site/stand and per plot). Values with no consistent letter indicate significant differences (p < 0.05).
| SRC | AFO | FM | HE-Y | HE-O | AL | ||
|---|---|---|---|---|---|---|---|
| Total no. of species (all sites included per type) | 123 | 108 | 68 | 68 | 41 | 18 | |
| Mean no. of species 1 per site/stand (=15 m2) | overall | 25.9 ± 6.6 ab | 30.2 ± 7.9 a | 24.2 ± 7.7 ab | 35 ± 4 a | 16.2 ± 2.8 b | 6 ± 2 c |
| a | 10.7 ± 4.9 a | 5.9 ± 4.5 ab | 6.8 ± 3.4 a | 4.3 ± 4.5 ab | 1.5 ± 1.6 b | 4.2 ± 1.9 ab | |
| r | 8 ± 2.9 ab | 11.7 ± 2.1 a | 7 ± 2.5 b | 11.3 ± 1.5 ab | 3.8 ± 1.3 c | 1 ± 0 d | |
| g | 2.8 ± 1.9 a | 4.5 ± 2.5 ab | 7 ± 2.7 b | 6 ± 1 ab | 1.8 ± 0.8 a | 0 ± 0 c | |
| w | 2.8 ± 2 ab | 5 ± 1.7 ac | 1.5 ± 1.1 b | 10.7 ± 2.1 c | 8.5 ± 1.6 c | 0.8 ± 0.8 b | |
| Mean no. of species 1 per plot (=1 m2) | overall | 7.5 ± 3.5 a | 8.2 ± 2.7 a | 8 ± 3 a | 8.4 ± 2.7 a | 4.1 ± 1.7 b | 1.5 ± 1.3 c |
| a | 3.4 ± 2.8 a | 1 ± 1.3 ab | 1.7 ± 1.3 a | 1 ± 1.4 ab | 0.3 ± 0.6 b | 1.2 ± 1.3 ab | |
| r | 2.6 ± 1.6 a | 4.6 ± 1.6 a | 3.2 ± 1.1 a | 3.7 ± 1.4 a | 0.8 ± 1 b | 0.2 ± 0.4 b | |
| g | 0.7 ± 0.8 a | 0.9 ± 1.1 ab | 2.3 ± 1.5 c | 1.2 ± 1 ac | 0.2 ± 0.6 ab | 0 ± 0 b | |
| w | 0.5 ± 0.8 ab | 1.1 ± 0.9 ac | 0.4 ± 0.6 ab | 1.8 ± 1 cd | 2.6 ± 1.2 d | 0.1 ± 0.3 b | |
1 Abbreviations for habitat preferences: a = species of arable land or short-lived ruderal habitats, r = species of persistent ruderal habitats, g = grassland species, w = species of woodland, shrubs or hedges (incl. vegetation of woodland margins).
Publisher’s Note: MDPI stays neutral with regard to jurisdictional claims in published maps and institutional affiliations. |
© 2021 by the authors. Licensee MDPI, Basel, Switzerland. This article is an open access article distributed under the terms and conditions of the Creative Commons Attribution (CC BY) license (https://creativecommons.org/licenses/by/4.0/).
Share and Cite
MDPI and ACS Style
Zitzmann, F.; Rode, M. Short-Rotation Coppice Managed According to Ecological Guidelines—What Are the Benefits for Phytodiversity? Forests 2021, 12, 646. https://0-doi-org.brum.beds.ac.uk/10.3390/f12050646
AMA Style
Zitzmann F, Rode M. Short-Rotation Coppice Managed According to Ecological Guidelines—What Are the Benefits for Phytodiversity? Forests. 2021; 12(5):646. https://0-doi-org.brum.beds.ac.uk/10.3390/f12050646
Chicago/Turabian StyleZitzmann, Felix, and Michael Rode. 2021. "Short-Rotation Coppice Managed According to Ecological Guidelines—What Are the Benefits for Phytodiversity?" Forests 12, no. 5: 646. https://0-doi-org.brum.beds.ac.uk/10.3390/f12050646
Note that from the first issue of 2016, this journal uses article numbers instead of page numbers. See further details here.