Article

Classification of Tree Functional Types in a Megadiverse Tropical Mountain Forest from Leaf Optical Metrics and Functional Traits for Two Related Ecosystem Functions

1
Laboratory for Climatology and Remote Sensing (LCRS), Department of Geography, University of Marburg, Deutschhausstraße 12, 35037 Marburg, Germany
2
Plant Ecology and Ecosystems Research, Albrecht von Haller Institute for Plant Sciences, University of Göttingen, Untere Karspüle 2, 37073 Göttingen, Germany
3
Conservation Ecology, Department of Biology, University of Marburg, Karl-von-Frisch-Straße 8, 35043 Marburg, Germany
4
Institute for Environmental Sciences, Brandenburg University of Technology (BTU) Cottbus-Senftenberg, 03046 Cottbus, Germany
5
Grupo de Investigación Hidrología y Climatología, San Cayetano Alto, Universidad Técnica Particular de Loja, Ecuador Calle París, Loja 110107, Ecuador
6
Department of Geology and Mine and Civil Engineering (DGMIC), Universidad Técnica Particular de Loja, San Cayetano Alto s/n, Loja 1101608, Ecuador
*
Author to whom correspondence should be addressed.
Submission received: 19 March 2021 / Revised: 14 May 2021 / Accepted: 18 May 2021 / Published: 20 May 2021
(This article belongs to the Section Forest Inventory, Modeling and Remote Sensing)

Abstract

:
Few plant functional types (PFTs) with fixed average traits are used in land surface models (LSMs) to consider feedback between vegetation and the changing atmosphere. It is uncertain if highly diverse vegetation requires more local PFTs. Here, we analyzed how 52 tree species of a megadiverse mountain rain forest separate into local tree functional types (TFTs) for two functions: biomass production and solar radiation partitioning. We derived optical trait indicators (OTIs) by relating leaf optical metrics and functional traits through factor analysis. We distinguished four OTIs explaining 38%, 21%, 15%, and 12% of the variance, of which two were considered important for biomass production and four for solar radiation partitioning. The clustering of species-specific OTI values resulted in seven and eight TFTs for the two functions, respectively. The first TFT ensemble (P-TFTs) represented a transition from low to high productive types. The P-TFT were separated with a fair average silhouette width of 0.41 and differed markedly in their main trait related to productivity, Specific Leaf Area (SLA), in a range between 43.6 to 128.2 (cm2/g). The second delineates low and high reflective types (E-TFTs), were subdivided by different levels of visible (VIS) and near-infrared (NIR) albedo. The E-TFTs were separated with an average silhouette width of 0.28 and primarily defined by their VIS/NIR albedo. The eight TFT revealed an especially pronounced range in NIR reflectance of 5.9% (VIS 2.8%), which is important for ecosystem radiation partitioning. Both TFT sets were grouped along elevation, modified by local edaphic gradients and species-specific traits. The VIS and NIR albedo were related to altitude and structural leaf traits (SLA), with NIR albedo showing more complex associations with biochemical traits and leaf water. The TFTs will support LSM simulations used to analyze the functioning of mountain rainforests under climate change.

1. Introduction

Plant functional types (PFTs) are frequently used in climate change modeling to parameterize the vegetation in land surface models (LSMs) [1]. They have been primarily designed to group the high complexity of vegetation into discrete classes that represent different feedback types between the ecosystem and atmosphere. LSMs and PFTs contribute to the ongoing debate on carbon sequestration through biomass production of natural tropical forests [2,3]. They are also applied to answer the question regarding how climate change interacts with alterations in forest composition, radiation, energy fluxes, and precipitation recycling [4]. Doughty et al. [5] stressed that global warming will change forests’ spectral signatures toward a darkening in near-infrared, mediated by changes in the functional trait specific leaf area (SLA). This underpins the close link between tree radiative fluxes and productivity (see [6]) via the functional traits of different tree groups. Productivity depends on net carbon gain through the photosynthetic capacity of leaves, which is functionally related to several structural leaf traits such as SLA [7], leaf tissue density, and leaf thickness [8]. Most relevant for productivity via the leaf economics spectrum [9] are the leaf biochemical traits such as leaf nitrogen. All functional traits important for productivity are simultaneously related to leaf optics [10]. Radiation fluxes between leaves and the atmosphere are particularly determined by spectral leaf albedo/absorbance in the visible (VIS) and near-infrared (NIR) ranges. The solar radiation absorbed by leaves is transformed into chemical energy by photosynthesis or thermal energy. The VIS leaf reflectance spectrum is dominated by the concentration of leaf pigments such as chlorophyll, carotenoids, anthocyanins, and brown pigments, whereas in the NIR, leaf water and the contents of sugar, starch, cellulose, lignin, and proteins are of main importance [11,12]. The effects of leaf chemicals on the leaf spectral response depend mainly on the absorption features of leaf elements (Table 1). Chlorophyll absorption features are located in the blue (400–500 nm) and red (650–700 nm) regions of the VIS spectrum. Carotenoids and anthocyanins absorb light at similar wavelengths [13] and thus might disturb the optical retrieval of the chlorophyll content with VIS-NIR optical metrics such as vegetation indices (VIs). However, some VIs were shown to be insensitive to the anthocyanin contents of tropical tree species and thus are capable of accurately representing chlorophyll contents of leaves [14]. In addition to the carbohydrate-based leaf constituents and leaf water, important biochemical leaf traits such as nitrogen exhibit distinct absorption features [12] in the NIR spectrum. As a consequence, the close relationship between leaf optical metrics and the absorption bands of structural and biochemical leaf traits has been successfully used to retrieve functional leaf traits for tropical and extra-tropical forests using different models based on sensed optical data [15,16].
Because functional traits differ between PFTs, this is expected to hold for optical metrics related to these traits. This should allow the discrimination of tree functional types using optical metrics. The spectral classification of tree species using VIS and NIR wavelengths has been successfully conducted for selected species from the mid-latitudes to the Amazon lowlands [17,18]. Longwave infrared data were also successfully used for tree species classification [19]. Based on Fourier transform near-infrared (FT-NIR) spectrometry on dried leaves, Durgante et al. [20] accurately distinguished 10 Amazonian tree species. FT-NIR spectrometry (1000–2500 nm) was successfully used in another study to discriminate 13 Amazonian species [21]. Species not being properly detected were attributed to changes in biochemical leaf traits during the leaf life cycle, such as polysaccharides, proteins, and phenolic compounds; however, they were not measured simultaneously in the study [21]. Castro-Esau et al. [22] distinguished Mesoamerican trees using hyperspectral leaf spectra, where the most discriminating functional traits were leaf thickness and chlorophyll content. However, the analysis based on only a few functional traits experienced difficulties for classifications between different sites. Clark and Roberts [23] successfully used optical metrics derived from hyperspectral data that respond to structural and biochemical leaf traits to classify seven tropical tree species of a tropical wet forest in Costa Rica with a random forest classification and an overall accuracy of 86.8%. Because no tissue chemical assays were available in this study, determining a direct link between the discriminating optical metrics and the functional traits behind it was not possible. Despite the success of tree species classification using optical metrics at the leaf level in these discussed studies, some inherent restrictions of these approaches in classifying functional tree types remain. The studies used only a few selected tree species from a larger species pool, and relationships to functional traits or even ecosystem functions were not part of the investigations, mostly due to lacking data on simultaneously collected functional leaf traits.
To use optical data for the classification of PFTs, Ustin and Gamon [24] proposed a new method to derive optically distinguishable functional types from remotely sensed data by considering structural, biochemical, and phenological traits. A comprehensive study on N-Californian vegetation (18/11 total/tree species) using PCA and clustering resulted in 12 optical leaf functional types that may be related to leaf functions but did not group into the conventionally used PFTs [25]. In a study on three different temperate, semi-natural grasslands, Feilhauer et al. [26] compared eight simulated functional traits with measured spectral data and successfully classified the functional plant composition observed in the field. The authors suggested further testing with commonly used spectral metrics and field-derived functional trait data. Functional trait measurements were reported by Kattenborn et al. [27] for the same system, and the grouping was investigated with regard to three different PFT schemes and eight measured functional traits, showing that different functional traits were relevant to reproducing the specific PFT groups, which showed that a species pool might be grouped into different functional types depending on the ecosystem function of interest.
The aim of this study was to test if commonly used optical metrics allow the separation of the tree species of a megadiverse tropical mountain forest in Southern Ecuador into tree functional groups for two ecosystem functions: biomass production and solar radiation partitioning by leaves. This included determining the functional importance of optical metrics. As suggested by Feilhauer et al. [26], we applied commonly used leaf optical metrics, which are, to a large extent, also applicable to multispectral data. In contrast with the many previous studies, our analysis relied on a unique, comprehensive data set of simultaneously measured leaf hyperspectral (4030) and field-derived functional traits (20) of 52 tree species in one ecosystem.

2. Materials and Methods
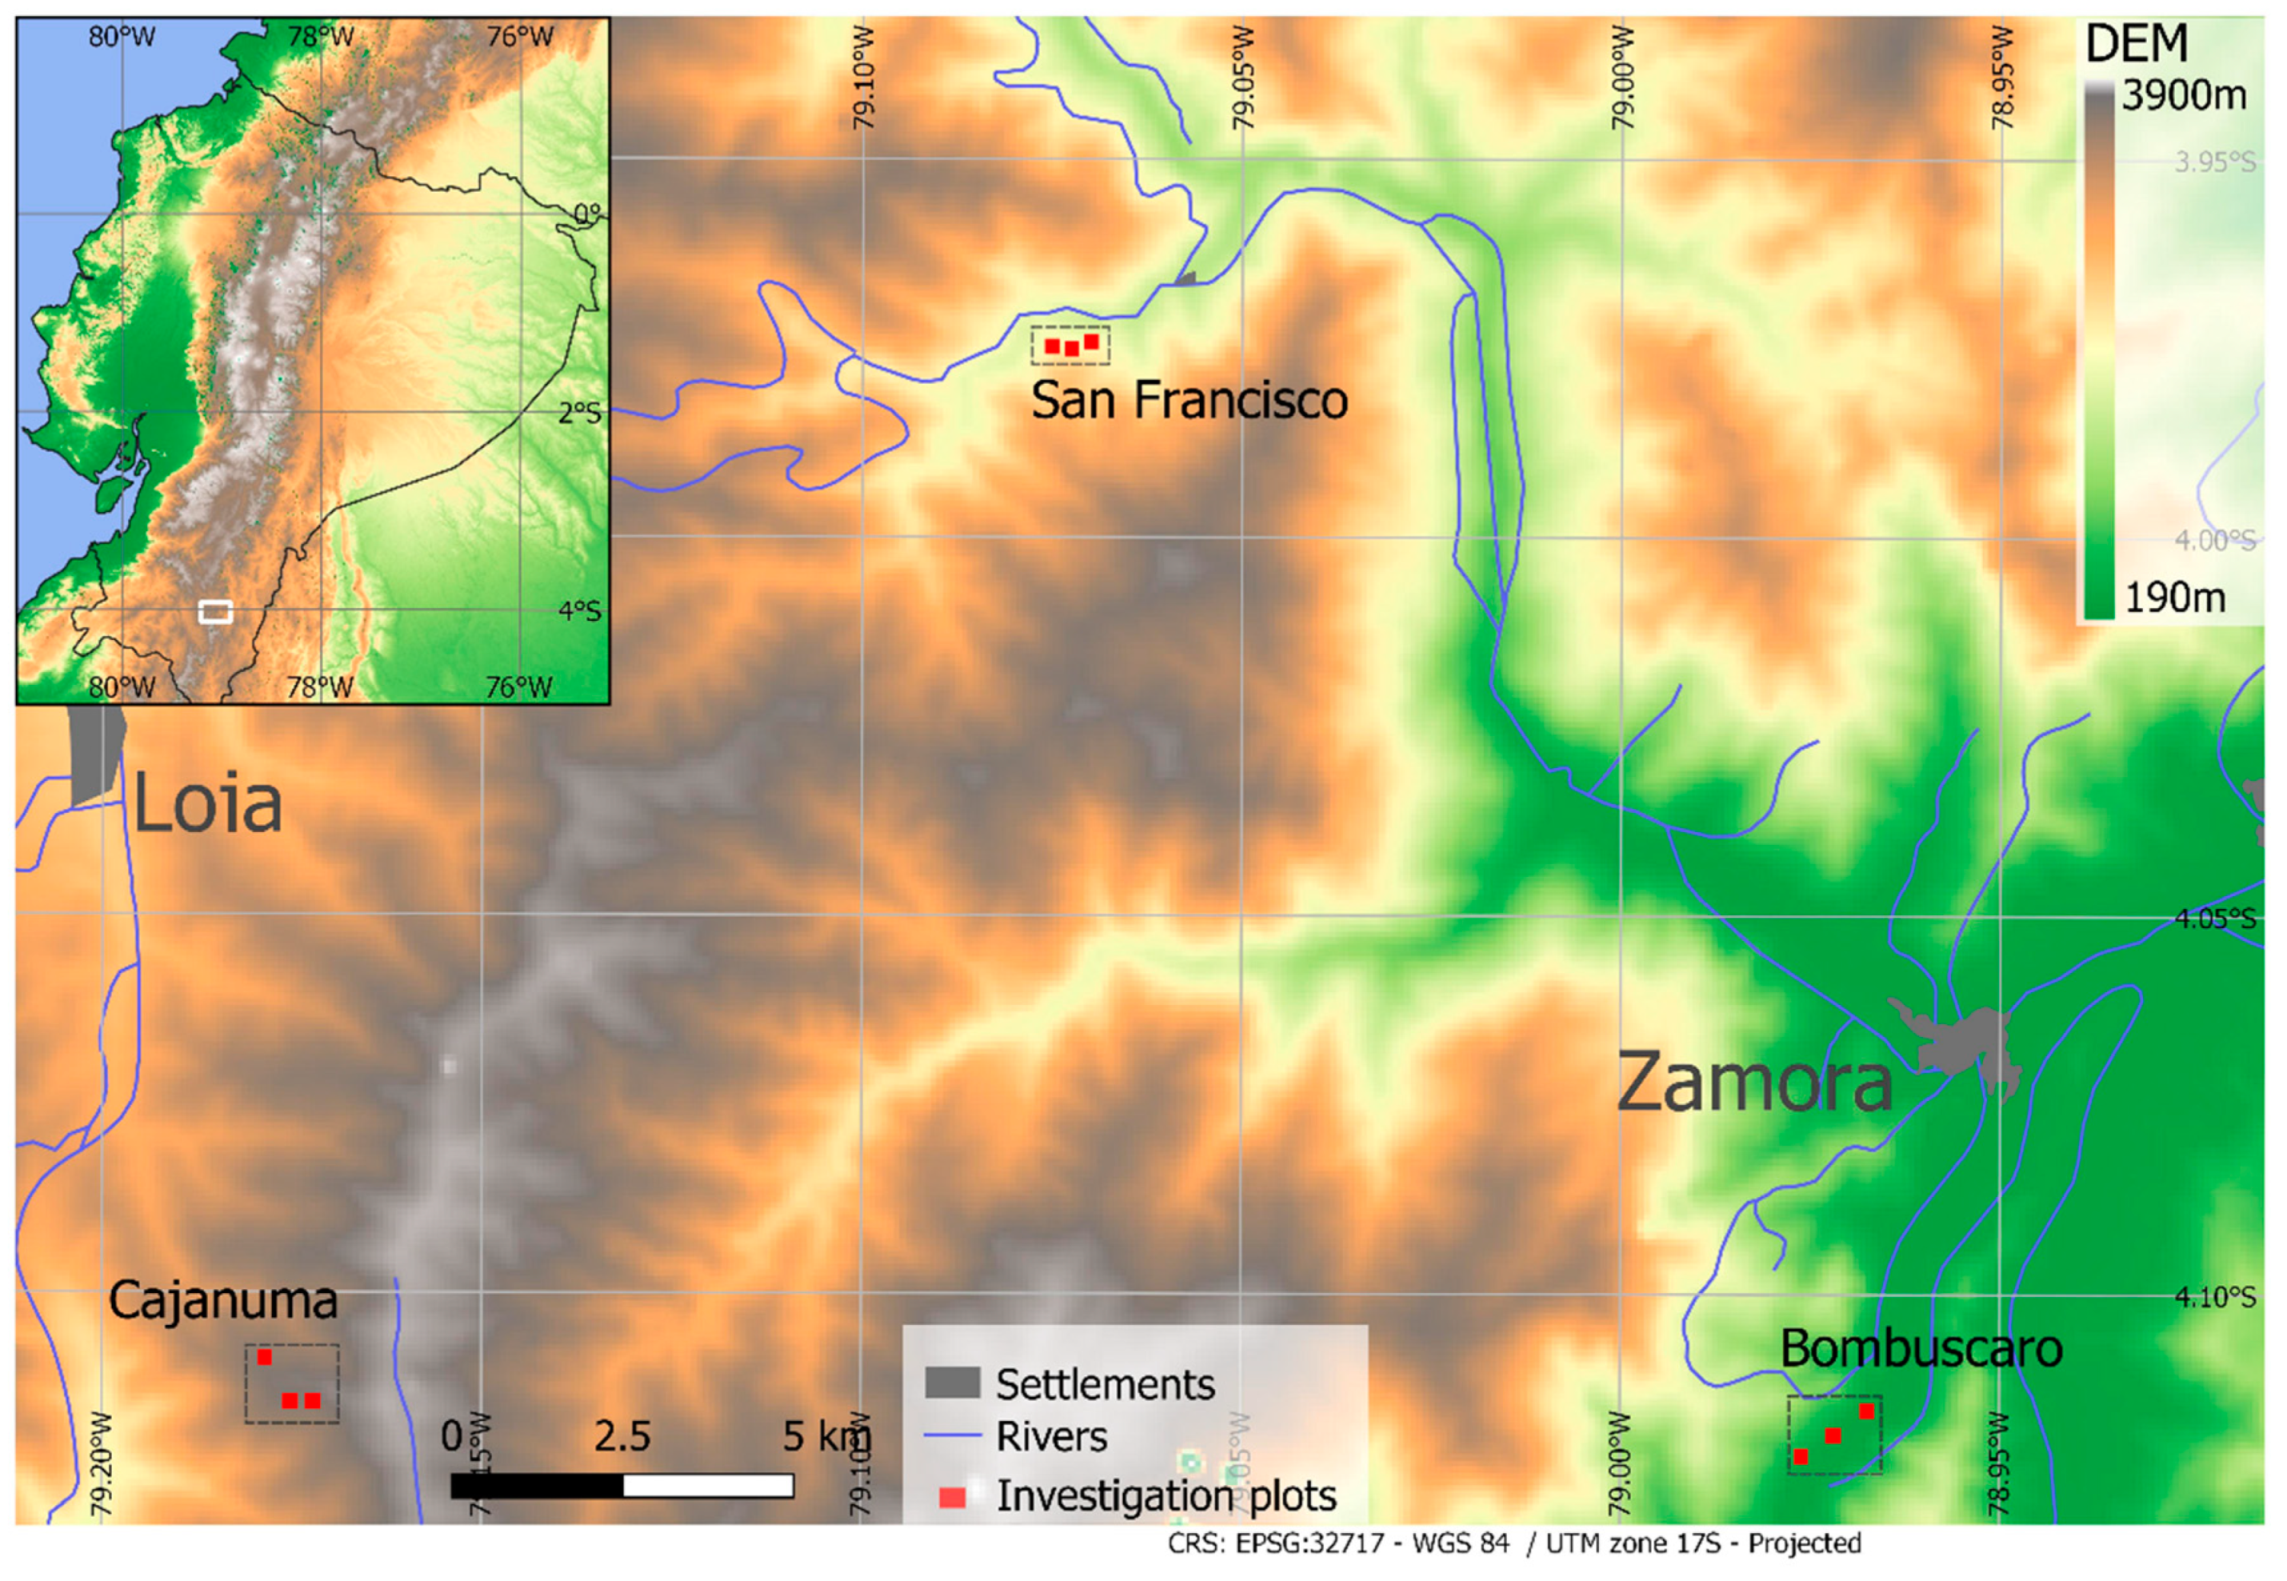
2.1. Study Area

The study area is located at the eastern cordillera of the South Ecuadorian Andes. The region belongs to the Tropical Andes biodiversity hotspot and is an important area for nature protection and ecosystem services [28,29,30]. The region is characterized by a humid tropical climate throughout the year (Table S1), with an exceptionally wet period between March and July (peak months vary between sites) and a comparatively drier period from September to December [31,32]. The area is affected by climate change because significant warminghas been observed during the last decades [29]. Biomass burning in the Amazon has led to the long-range transport of aerosols and, thus, to the atmospheric depositions of plant nutrients (e.g., N) into the area, which increase with altitude [33,34]. The forest structure and tree species composition change with elevation, not only due to strong topographical differences (ravines and ridges) [35] but also due to pronounced climatic differences in the study area (Table S1). Nine one-hectare forest plots at three elevation levels were selected in the mountain rain forest of the SE Ecuadorian Andes (Figure 1 [28]): (i) the Cajanuma site (upper montane forest), which is close to the forest line at 3000 m above sea level; (ii) the San Francisco site (lower montane forest) at 2000 m above sea level, located in the Rio San Francisco valley next to the ECSF research station (Estación Científica de San Francisco, 3°58′18″ S, 79°04′45″ W, 1860 m above sea level) [36]; and (iii) the Bombuscaro site (premontane forest) at 1000 m above sea level, located in the transition zone to the Amazon lowland forest.

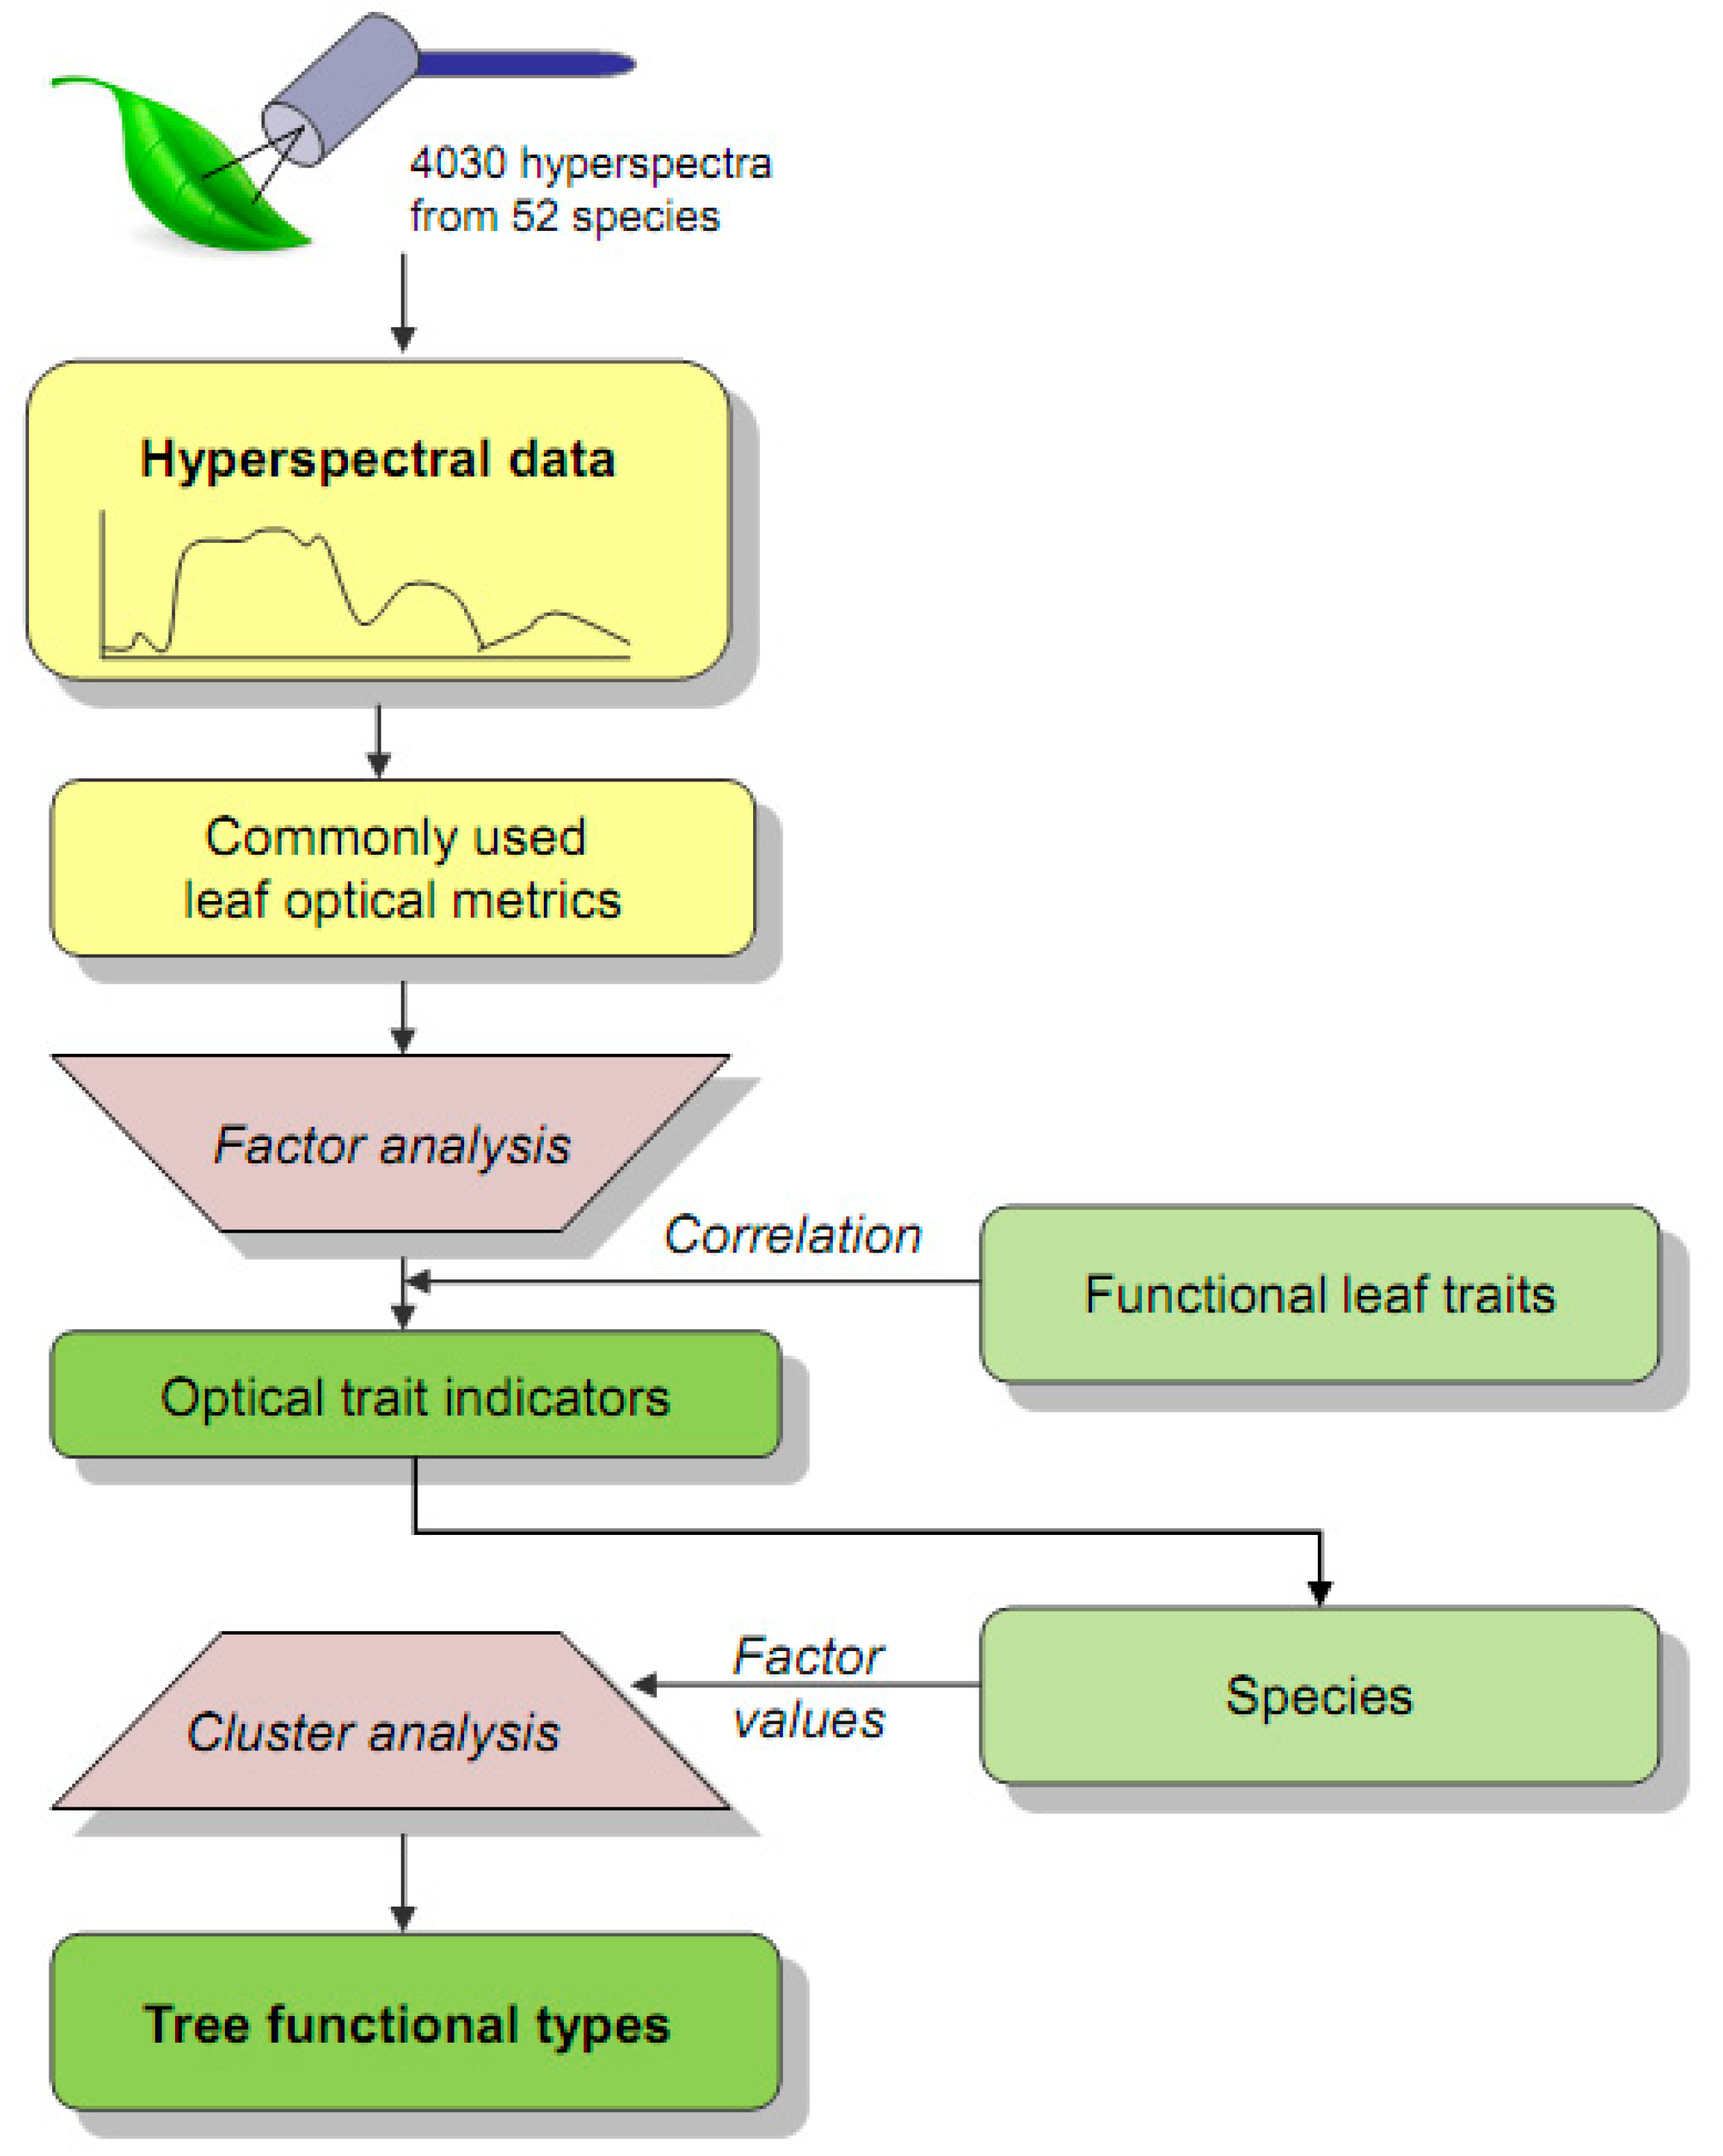
2.2. Workflow and Data

A general overview of the workflow is shown in Figure 2. For sampling purposes, tree species were selected a priori to represent the tree communities of the three study sites. From previous studies, we used available data on SLA and wood-specific gravity (WSG) to select trees that covered the known range of the functional traits space of the study area [37]. Whereas SLA is linked to leaf-scale productivity via the leaf economics spectrum [9], WSG is related to plant mortality as specified by the wood economics spectrum [38]. The selected 52 tree species included pioneer-stage as well as early-, mid-, and late-successional types (Table S2). An eight-fold repetition of the sampling was performed for most species. For all the individuals of the selected species, leaf samples were acquired during February and March 2019 by harvesting canopy branches. The branches were transported in plastic bags to the spectrometer laboratory of the ECSF research station to prevent water loss and stored overnight with moist gauze. Ten mature leaves were used for measurements of hyperspectral leaf reflectance for each tree.

2.2.1. Leaf Spectroscopy

The hyperspectral measurements were recorded with an OceanOptics spectrometer HDX, which offers an average spectral resolution of 0.28 nm for VIS (345.76–931.92 nm), and NirQuest, with an average resolution of 1.5 nm (897.98–1716.64 nm) for NIR, yielding a number of 2580 narrow hyperspectral bands. The measurement head was equipped with an integrating sphere and a 20 W stabilized illumination source. The spectra of five consecutive measurements on each leaf were averaged to increase the signal-to-noise ratio and stabilize fluctuations in the data. To receive optical metrics for each species, pre-processing of the raw hyperspectra was required. First, the reflectance spectra were calculated from raw counts by dividing the measurements of the samples by a reference measurement with a 25% grey standard (Spectralon), corrected by the dark current signal. The grey standard was chosen because it resembles leaf reflectance more closely so that changes in the gain settings at higher differences of leaf reflectance are not required [37]. The replicated leaf reflectance measurements were then aggregated to the mean species reflectance. HDX data were binned to a spectral resolution of 1 nm, whereas the NirQuest data were used with their original resolution. A Savitzky–Golay filter was applied to remove noise from the spectrum. The data range was trimmed to 475–1695 nm, and the spectra were merged using the overlapping spectral area from the HDX to NirQuest sensors because NirQuest provides relatively high photosensitivity at 900 nm wavelength, whereas the HDX declines to near zero in the overlapping region. The integrated albedo for VIS wavebands was defined as <700 nm, whereas NIR was defined as ≥700 nm as usually applied in land surface models, e.g., in [39].
The commonly used optical metrics were selected based on a literature survey to quantitatively respond to structural and biochemical leaf elements, which are considered important indicators for leaf productivity (e.g., SLA, N, and P) and further relate to quantities impacting leaf reflectance properties (e.g., leaf carotenoids and water content). Our preference was for commonly used Vis, which has been successfully applied in the tropics. Optical metrics and functional traits were all aggregated by species (Table 1).

2.2.2. Leaf Trait Measurements

Leaf functional traits related to leaf morphology (leaf area, SLA, and leaf water content) and foliar nutrients (C, N, P, Al, Fe, S, Ca, Mg, Mn, and K) were measured on 20 leaves of the same branches used for the hyperspectral measurements. Another three leaves were used to determine leaf thickness and toughness. For compound leaves, the morphology of the individual leaf elements was measured. The number of leaves analyzed per tree was reduced for species with particularly large leaves (e.g., Cecropia, Graffenrieda, and Pourouma) due to time constraints during leaf size determination. Leaf area was measured by scanning fresh leaves, including petioles in color (Canon LIDE 100, 150 dpi), and leaf silhouettes were retrieved using WinFOLIA 2014a software (Régent Instruments, Québec, QC, Canada). The fresh leaves were weighed and then dried at 60 °C for a minimum of three days for dry weight and leaf water content determination. SLA was calculated as the quotient of total leaf area by total leaf dry weight. A digital micrometer (Mitutoyo M293-240-70, Mitutoyo Germany Ltd., Neuss, Germany) was used to measure leaf thickness at each side of the main leaf vein between secondary veins. Leaf toughness (kN m−2) was determined using a digital penetrometer (flat-ended 2.0 mm diameter steel punch, DS-50N, Imada Inc., Japan). Both leaf thickness and toughness measurements were averaged. The C and N contents of dry leaf mass were analyzed using a CN elemental analyzer (vario EL III, Hanau, Germany). Ground leaf material was digested using HNO3 in preparation for ICO analysis (Thermo Scientific iCAP 7000 ICP-OES, Thermo Fisher Scientific, Dreieich, Germany) to determine leaf Al, Ca, Fe, K, Mg, Mn, P, and S contents. Leaf-scale susceptibility for herbivory was estimated by dividing the mean area of herbivory on damaged leaves by the mean area of the complete leaves.

2.3. Data Analysis

2.3.1. Determination of Optical Trait Indicators (OTI) by Factor Analysis

In a first step, we analyzed the suitability of the data set using Bartlett’s test of sphericity and the Kaiser–Meyer–Olkin measure of sampling adequacy [52] and conducted a cross-correlation analysis among the selected optical metrics to unveil their potential interrelations.
A factor analysis was then conducted to reduce the selected optical metrics (Figure 2, Table 1) and group them into distinguishable optical trait indicators (OTI). The number of meaningful factors was determined based on the eigenvalues extracted from the correlation matrix of the optical metrics. The factor solution was determined by minimizing the residuals and applying an oblique rotation. The contributions of the optical metrics to each factor were described by the strength and mathematical sign (direction) through factor loadings (−1 to 1). The analysis also provided scores for each species and factor (factor scores) that described the quantitative contribution (strength and direction) of the individual factor for each species. The factor scores were calculated using Bartlett’s method, which provided standardized factor scores with zero representing the average score over all species. The analysis was conducted in R version 3.6.3 [53] using the psych package [52].
To convert the optical factors to optical trait indicators, the factors must be related to leaf functional traits. This was realized by correlating the factor scores with the leaf functional traits of the species for each factor using Pearson’s product-moment correlation coefficient. The significance of the correlation coefficients was tested with t-statistics. The interpretation of the correlation coefficients finally allowed us to assign dominant functional traits to each optical factor, thus leading to the optical trait indicators.

2.3.2. Classification of tree Functional Types (TFT) by Cluster Analysis

The final task was to test if the 52 species belonged to distinguishable tree types that are related to the ecosystem functions of productivity and solar radiation partitioning. For this task, we used the affinity propagation cluster algorithm (APA), in which the number of clusters is determined by the algorithm, and the procedure is insensitive to outliers [54]. The cluster analysis was conducted with the species factor scores of the selected, functionally relevant factors. As a result, the species were assigned to functional tree types related to the two ecosystem functions. The grouping in APA was based on similarities between the species factor scores. As proposed by Frey and Dueck [55], the squared negative distance matrix was taken as a measure for similarities between species, as represented by their factor scores. The algorithm starts with each species forming its own cluster, then iteratively reduces the number of clusters by identifying species for which the combination of factor scores is similar to their neighboring species within the distance matrix. A general, more detailed description of the algorithm can be found in Frey and Dueck [55]. The method was used as implemented in the R-package apcluster [56].
To assess the strength of the clustering, the average distance of the species within and between the tree functional type clusters was calculated together with the silhouette width, which is a measure of the similarity of species within their own cluster with respect to other clusters. The silhouette width ranges between −1 and +1, with negative values indicating random grouping, whereas increasing positive values indicate a growing discriminability. Values >0.25–0.5 indicate a weak, >0.5–0.7 a moderate, and >0.7 a strong structuring of the data set, which means well-separated and compact clusters [57,58]. Longer distances between the clusters indicate a good separation, whereas shorter distances within a cluster indicate similar trait characteristics of the species within tree clusters and, thus, good compactness.

3. Results

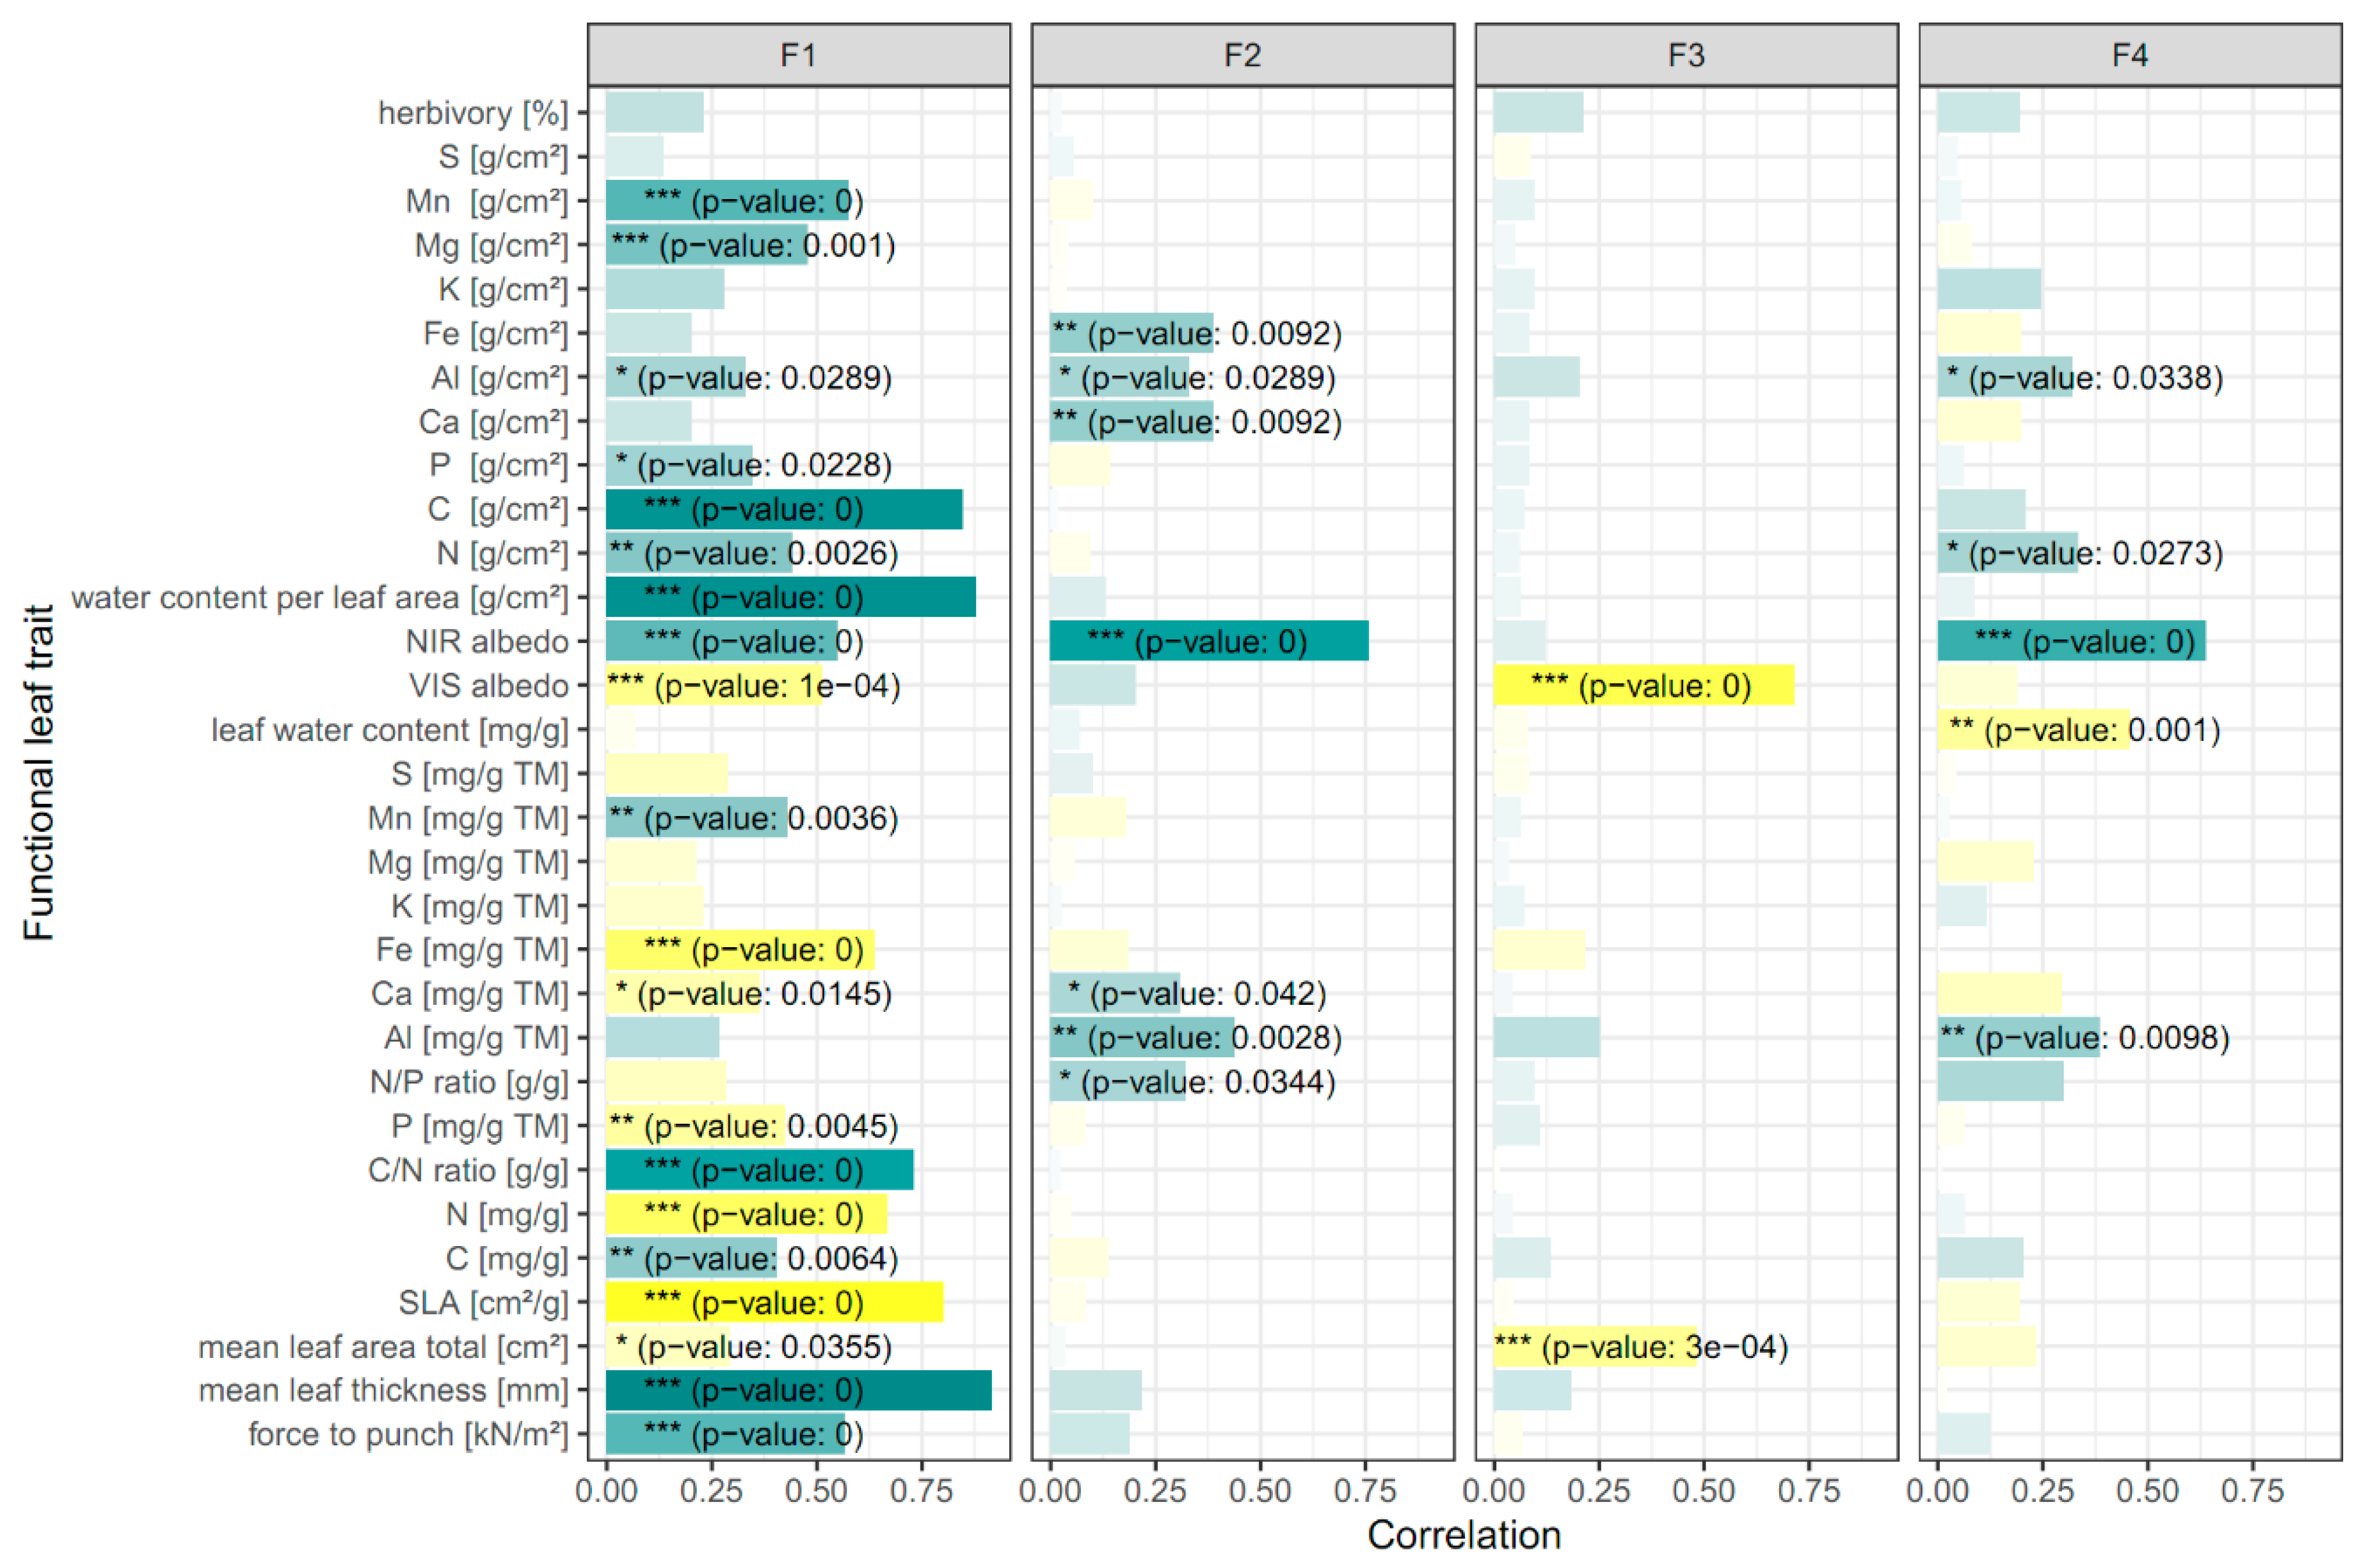
3.1. Relating Optical Metrics to Functional Traits

As expected, high correlations between the leaf optical metrics representing similar absorption features were found (Figure S1). Clear relations were detected between the metrics covering the chlorophyll absorption bands (NDVI to SR798), the absorption bands for leaf pigments (ARI to GitelsonCar2), and the absorption bands related to carbohydrates and proteins (D1040 to WBI). As a consequence, the factor analysis reduced the optical metrics space to four factors (F1–F4) with a total variance explanation of 87%. The four individual factors explained 38%, 21%, 16%, and 12% of the variance, respectively. As shown in Table 2, the first factor explained leaf traits that related to leaf carbon (sugar and starch), leaf structure (lignin and cellulose), and leaf proteins and nitrogen (Table 1). The second factor included leaf optical metrics relevant for photosynthesis and biomass production (e.g., leaf chlorophyll and water), whereas the third factor loaded on optical metrics related to leaf pigments (carotenoids and anthocyanins). The fourth factor mainly encompassed leaf optical metrics related to the amount of leaf water but also to specific leaf constituents such as heavy metals and phenolic compounds, which are known to be important for leaf defense against herbivory.
The correlation of the species factor scores with their functional leaf traits converted the factors to optical trait indicators (Figure 3). We found that F1 is mainly related to structural leaf traits (SLA, mean leaf area and thickness, and force to punch), the leaf area density of biochemical traits (C, N, P, Mg, Mn, and Al), and leaf water, the mass fraction of biochemical traits (C, N, P, Ca, Fe, and Mn), and the C/N ratio, the latter regulating photosynthesis [59]. F2 particularly described a positive relation of the factor to the area density and/or the mass fraction of some essential trace leaf traits (Fe, Al, and Ca) and the N/P ratio, the latter of which is important for describing N and P limitations on plant growth with a usual negative correlation to biomass production [60]. Anthocyanin- and carotenoid-associated optical metrics represented by F3 (Table 2) revealed significant negative correlations with mean total leaf area. The fourth factor (F4), which included optical metrics associated with heavy metals and leaf water content (Table 2), was related to Al, N, and the leaf water mass fraction (Figure 3). No significant associations of the four factors could be found for the area density and the mass fraction of some biochemical traits (S and K) and herbivory.
The result of the factor analysis revealed that the first two factors were optical trait indicators for the ecosystem function biomass production. The first factor included all structural traits, carbohydrates, and important leaf nutrients related to the biomass stock. The second factor comprised metrics related to leaf chlorophyll, a functional trait that was not explicitly sampled during the field work. However, the N/P ratio relates to biomass production [60,61], and leaf Ca, Al, and Fe were considerably important for the chlorophyll content of leaves and/or photosynthesis, particularly in different crops (e.g., as shown in [62,63,64]).
With regard to solar radiation partitioning between leaves and the atmosphere, VIS and NIR albedos were significantly correlated to all four factors, so are thus relevant as optical trait indicators. In F1, the VIS albedo showed a significant negative correlation compared with the positive of leaf thickness and C, which means the greater the biomass, the greater the absorption of VIS light. The NIR albedo revealed the contrary: the more the structural components, the higher the reflectance. In F2, NIR albedo was positively correlated to chlorophyll, pointing to an impact of the well-known red edge reflection enhancement through chlorophyll in the NIR [65]. F3 showed a negative correlation of VIS albedo in the absorption bands of leaf pigments. In F4, a positive correlation of NIR albedo was mainly related to a negative correlation with the mass fraction of leaf water. A high leaf water content thus reduced NIR albedo due to the NIR water absorption bands mainly around 1400 nm (D1400 metrics) represented by F4.

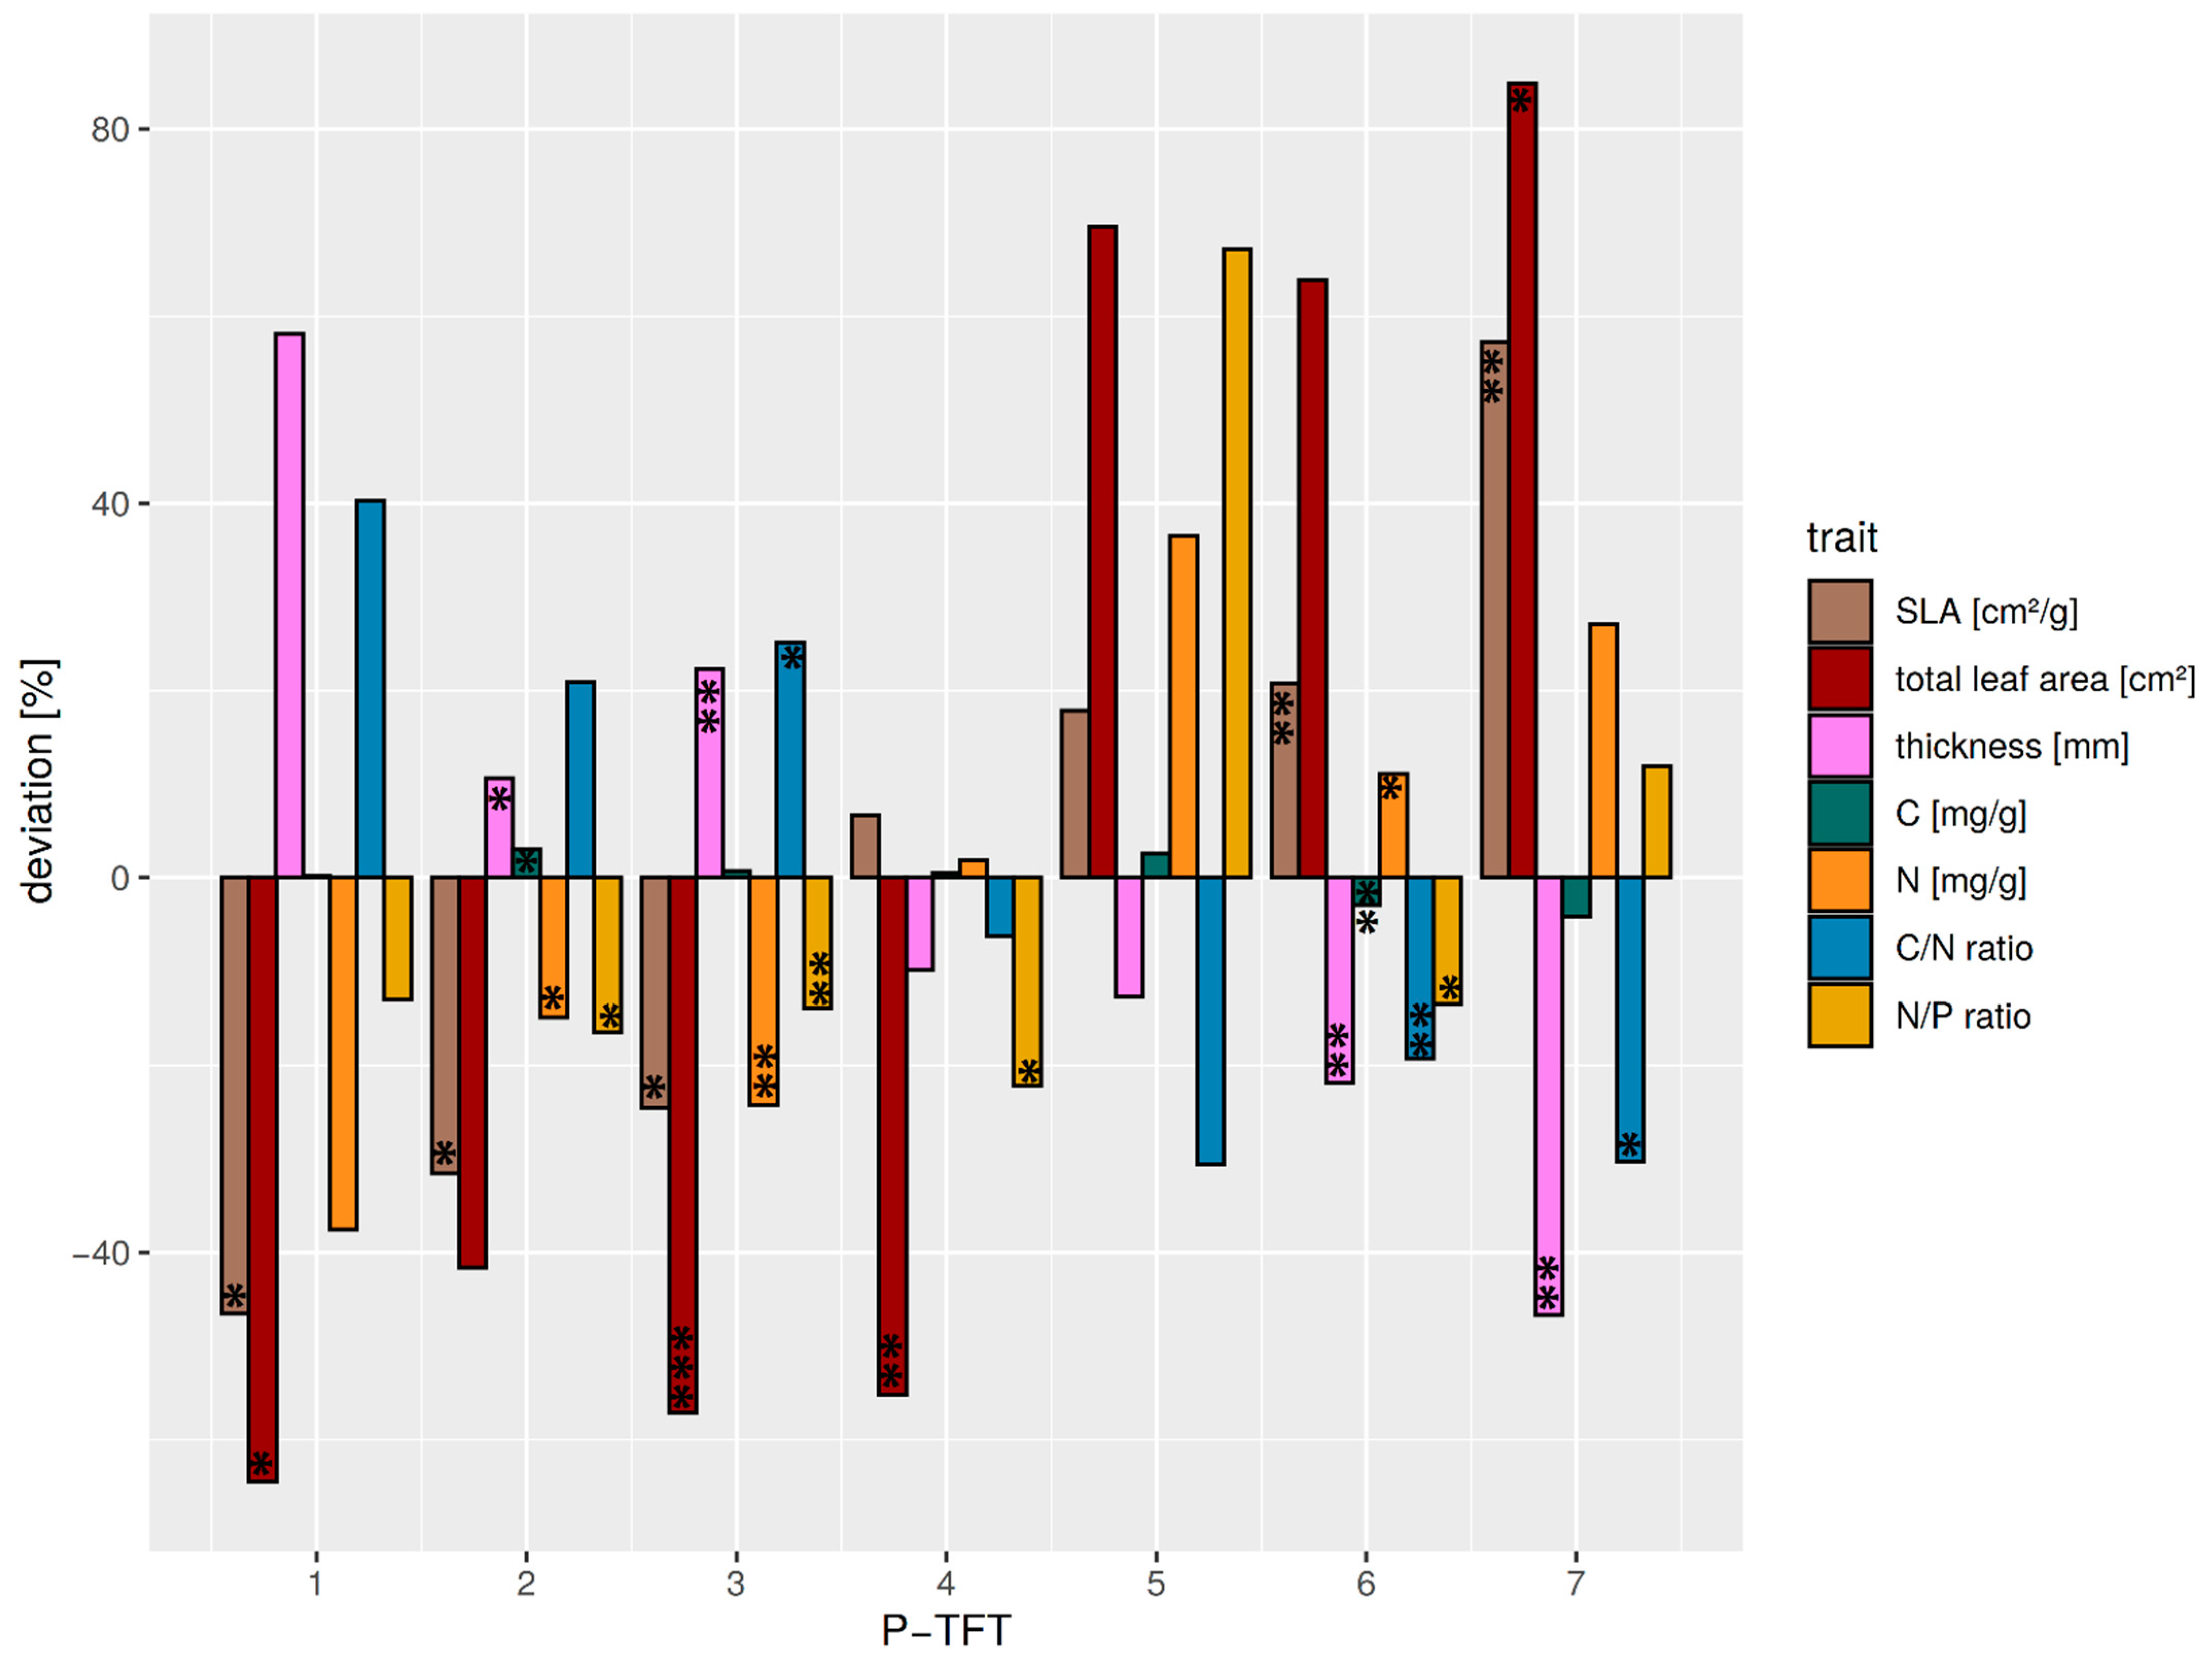
3.2. Classification of Leaf Optical Trait Indicators to Tree Functional Types (TFTs)

Because the factor analysis revealed different optical trait indicators explaining biomass production (F1–F2) and VIS-NIR albedo-mediated partitioning of solar radiation (F1–F4), two separate cluster analyses were conducted. The resulting tree functional types are hereinafter referred to as P-TFT (function productivity) and R-TFT (function radiation partitioning).
Clustering in the bivariate trait space based on species factor scores for F1 and F2 resulted in seven P-TFTs (Table 3). The delineation of the TFTs was described by an average silhouette width of 0.41, which indicated a weak to moderate clustering of the data, with higher compactness and separability of clusters P-TFTs 2 and 5 (Figure S2).
The individual P-TFTs revealed different expressions of the dominant functional traits related to productivity (Figure 4). In general, TFTs P2-P4 showed a lower variation in the functional traits around the median compared with the remaining TFTs P1 and P5–P7. Thus, a stronger deviation from mean ecosystem productivity was expected from species within these clusters.
The P1-TFT was characterized by thin leaves and low SLA. Furthermore, its C/N ratio was higher due to high C and low N contents. The small decrease in the N/P ratio suggested a minor limitation of productivity by P availability. The TFT included Clusia elliptica, a species whose habitat extends into the sub-paramo [35], where tough leaves are required due to a high amount of shearing stress related to high wind speeds [66]. It is thus considered to exhibit very low productivity.
P2 showed a decreased SLA, although to a lesser degree than P1-TFT, as it comprised species with thinner leaves and higher leaf area. This TFT showed the highest increase in leaf C, while exhibiting lowered N content. An increased C/N was combined with a minor decrease in the N/P ratio, which showed fewer restrictions due to nutrient availability. Due to its leaf morphology, it was still considered a low-productivity TFT.
The P3-TFT had thicker, smaller leaves than P2; however, its SLA was higher. Whereas the leaf N content was decreased, its C content showed only a slight increase. However, the C/N ratio was elevated, whereas its decrease in N/P ratio showed minor limitations due to P availability. P2 combined high-elevation species with mid-elevation species like Alzatea verticillata and Podocarpus oleifolius, which favor nutrient conservation over productivity and, as such, are slow-growing. Thus, it was considered a P-limited low productivity TFT.
P4 similarly had small leaves but with a below-average thickness. Its SLA was slightly increased. Its nutrient traits showed nearly no deviation from average, except a decreased N/P ratio, which suggested it may be more N-limited. It was hence considered an intermediate productivity TFT.
The low-elevation species Miconia aff punctata was assigned into a separate P5-TFT. Although it had only slightly thinner leaves than P4, it exhibited much larger leaves and a higher SLA. Leaf carbon was slightly increased. Although a strong increase in N content leading to a low C/N ratio was observed, its N/P ratio suggested a high limitation by P availability. Thus, it was considered a P-limited, high-productivity TFT.
The P6-TFT showed an increased SLA and leaf area, while leaf thickness was strongly decreased. The leaf biochemical composition of P6 was characterized by a slight decrease in carbon content and an increased N content. The C/N and N/P ratios were lower than the average, which suggested a minor P limitation. Therefore, the P2-TFT was interpreted as a high-productivity TFT.
P7 was characterized by the highest SLA and total leaf area in combination with low leaf thickness. It showed strong derivations in biochemical leaf traits, especially for the C/N ratio, nitrogen, and N/P ratio (Figure 4). Although the increased N/P ratio showed P limitations for productivity, the generally high N content in combination with large, thin leaves could be interpreted as increased productivity. This is further corroborated by a lowered C/N ratio, which argues for increased photosynthesis per unit leaf area. This agrees with the fast-growing pioneers (Heliocarpus americanus or Tapirira guianensis) species comprising P1-TFT (Table S3). It could thus be described as a TFT with very high productivity.
The P-TFTs exhibited a distinct difference in productivity between high- and low-elevation species (Figure S4), whereas mid-elevation species were assigned to P-TFTs ranging from low to very high productivity. It is likely that the higher N content of P2 compared with P3 originated from the higher number of mid-elevation species (Figure 4). Altogether, P-TFTs showed a transition from low (P1, P2, P3, and P4) to high and very high productivity (P5, P6, and P7) types.
With regard to solar radiation partitioning between leaves and the atmosphere, the relevant traits, VIS and NIR leaf albedo, were found to be related to all four optical trait indicators in the factor analysis (Figure 3). Thus, clustering was conducted based on the species factor scores for F1 to F4, resulting in eight TFTs for solar radiation partitioning (R-TFTs, Table 4, Figure S3). The separation quality of the clusters was described by an average silhouette width of 0.28, indicating a generally weak structuring of the data space, also compared with the function productivity. Only two R-TFTs (R2 and R8) showed better separability and compactness.
In general, the VIS albedo of the R-TFT space (median = 7.4%) was lower than the NIR albedo (median = 21.9%) due to the strong absorption features in the visible spectrum. As a consequence, the deviations in the NIR albedo from the average of all R-TFTs were also higher compared with the VIS region (Figure 5). Two TFTs (R4 and R8) revealed a negative deviation in both VIS and NIR albedo, whereas, for the other types, the mathematical sign of the VIS/NIR deviations was inverted, which was expected from the negative correlation between VIS and NIR albedo (Figure S5). Positive VIS at negative NIR deviations occurred for R5, R6, and R7, whereas the contrary held for R1, R2, and R3. R4 laid close to the ecosystem average median albedo in the NIR and R1 and R6 in the VIS. The strongest positive deviation for NIR albedo was found in R1 (represented by one species only), and an exceptionally pronounced positive VIS albedo deviation was found for TFT R5. The absolute range of ecosystem albedo variations in the R-TFT space was 2.8% for VIS albedo and 5.9% for NIR albedo.
The different optical properties of the TFTs could be explained by the optically effective functional leaf traits (Figure 6, Table S4). Although the differentiation of VIS albedo deviations was less clear between the R-TFTs, a continuous decrease in NIR albedo from R-TFT 1–8 was visible. R1 showed an average behavior in VIS albedo but the strongest positive deviation in NIR albedo. This was not expected because the pioneer species Miconia aff punctata forming this TFT cluster is characterized by thinner and larger leaves at average leaf water. However, the positive NIR albedo deviation might be related to the exceptionally positive deviation of the leaf N/P ratio (33.7, deviation +73.8%). The positive leaf N causing this ratio (Figure 6) supports an increased leaf chlorophyll content and, thus, a higher NIR reflectance in the transition from red to NIR wavelength (red edge effect). R2 was characterized by thicker and small leaves (Figure S6) with reduced leaf water (Figure 6). The combination of lower water absorption and a thicker leaf with a higher cross-section of structural leaf components explains the enhanced NIR albedo. The thickness of the leaves promotes the absorption of VIS radiation, reducing VIS albedo. The TFT group R3 revealed the highest leaf thickness at the lowest leaf area (Figure 6 and Figure S7). The cluster only consisted of the high-elevation sclerophyllous tree species Clusia elliptica. The high leaf structural components and the positive leaf water deviation led to positive/negative deviations in NIR/VIS albedo. R4 was the biggest R-TFT group, consisting of 15 mid- to high-elevation species with relatively thick but small leaves (Figure 6, Figure S7). The strong negative correlation with leaf thickness (Figure S5) was the reason for the negative deviation of the VIS albedo in this R-TFT group. The weaker positive relation of structural elements with NIR albedo in combination with negative deviations of N most likely reduced the red-edge effect through lower leaf chlorophyll content, finally leading to a close-to-average NIR albedo. R-TFT 5 included four mid- to high-elevation species, characterized by the biggest and thinnest leaves (Figure S6), with minor positive deviations in leaf water (Figure 6) and the highest positive leaf Ca deviation (+48%). The latter is known to support high leaf water throughput [67]. The lacking reflective cross-section of leaf structural elements and the increased leaf water absorption were the reason for the negative deviation in NIR albedo (Figure 5). Exceptionally high was the increase in VIS albedo. This could be explained by weak absorption. The leaf nutrient contents of N (Figure 6) and, particularly, P (high positive deviation of 24.5%), as well as an exceptionally high positive deviation in leaf Fe (+48.3%) supported increased leaf chlorophyll concentration. Leaf Fe positively influences the chlorophyll leaf content, where a considerable increase in leaf reflectance, particularly around 550 nm, with leaf Fe level was reported [68]. R6 comprised 12 mostly lowland species with smaller and thin leaves. Consequently, the cluster showed a reduced NIR reflectance mainly due to thin leaves. The VIS albedo was slightly positive. Obviously, the high leaf N (Figure 6) and P contents, the latter having the highest positive deviation of 39.5%, supported the leaf chlorophyll level so that VIS albedo could be slightly enhanced, particularly in the green band. R-TFT 7 encompassed nine low- to mid-elevation, large-leaved species with below-average leaf thickness (Figure 6, Figure S7). VIS albedo showed a positive deviation at average leaf N. The highest positive leaf water content at below-average thickness increased NIR absorption so that the NIR albedo was clearly reduced. Leaf water could support photosynthesis and chlorophyll content, enhancing green albedo. R8, consisting of five mid- to high-elevations species with small leaves of intermediate thickness, showed relatively moderate deviations in both the functional leaf traits and VIS albedo (slight negative deviation), but the strongest negative deviation in NIR albedo. The slight negative deviation of the VIS albedo is mainly explained by the intermediate leaf thickness, but also by the strongest negative deviation in leaf Ca (−36.9%), which revealed a strong positive relation with VIS albedo (Figure S5). The strongest negative deviation of NIR albedo was hard to explain with the average behavior of the majority of the functional traits. However, NIR albedo was negatively correlated with leaf P and Mg (Figure S5). Leaf P showed a higher positive deviation for cluster 8 (+17.9%), and Mg particularly revealed an exceptionally high positive deviation of all clusters (+39.9%), so that the latter explained the strong negative deviation of the NIR albedo.
Figure S7 shows that that the individual R-TFT clusters were organized along the altitudinal gradient. No cluster included species belonging to all three elevational levels. The 1000 and 3000 m plots were included in four clusters each, while the transition level at 2000 m belonged to six clusters. By including elevation into the cross-correlation of the R-TFT optical (albedo) and functional traits (Figure S5), we found a clear increase in VIS albedo with altitude. This mainly occurred due to the increase and decrease in the absorbing structural traits leaf thickness and SLA, respectively, of the R-TFT species. Conversely, there was no pronounced correlation of NIR albedo with altitude. NIR albedo seems to be related to a complex balance between structural (e.g., leaf thickness, SLA) and biochemical traits, where some of the correlating traits are also height-related. However, when excluding the single-species cluster 1, a superordinated relation between NIR albedo, SLA, and elevation became obvious (Table S5).
Even if the cluster separation only shows a weak structuring, the eight R-TFTs would have different impacts on solar radiation partitioning between leaves and the atmosphere. Because absorbed VIS radiation is more converted into chemical energy, whereas absorbed NIR is converted into heat, it was important to differentiate the groups accordingly (Table 4). The first three R-TFTs (R1: very high NIR albedo, intermediate VIS albedo; R2: high NIR, low VIS; R3: high NIR, very low VIS) primarily absorb VIS but, to a greater extent, reflect NIR radiation, which means that more VIS energy was used for photosynthesis than NIR for heating. More balanced is R4 (intermediate NIR, low VIS), whereas R5 (Low NIR, very high VIS) reflected the highest portion of incoming VIS radiation. Types with higher NIR absorption with different behavior of VIS albedo were R6–R8 (R6: very low NIR, intermediate VIS; R7: very low NIR, high VIS; R8: very low NIR, low VIS).

4. Discussion

Here, we delineated functional tree types for two different ecosystem functions, productivity, and solar radiation partitioning, by clustering species factor scores of a few optical trait indicators (OTIs), which were derived from commonly used optical metrics and leaf functional traits.
The indicator function of the OTIs (F1–F4) for the two ecosystem functions was in accordance with other studies. The correlation of F1 with several traits of the leaf economics spectrum describes leaf-scale productivity ranging from conservative resource use and lowered productivity to fast nutrient acquisition and increased productivity [9,43]. The chlorophyll-related optical metrics contributing to F2 positively influence leaf-scale productivity because chlorophyll is increased to optimize pigment concentrations for photosynthesis [69]. Chlorophyll contents have been found to enhance photosynthetic capacity [69,70,71] and light-use efficiency [72]. As a consequence, leaf carbon gain increases with increasing chlorophyll content [73,74]. With regard to radiation partitioning, the correlation of F1 with functional traits represents the prevalent influence of non-pigmental leaf constituents and leaf structural properties on leaf reflectance [11]. The influence of leaf pigments on reflectance was divided into two separate OTIs related to chlorophyll (F2) and photo-protective pigments (F3). This originates from different impacts on leaf reflectance, as anthocyanins and carotenoids absorb strongly in the green region and weakly in the blue and red regions (various sources in [11,75,76]). F4 indicates the impact of leaf water content on NIR albedo [77]. Altogether, we found that the two selected ecosystem functions of the mountain rainforest in SE Ecuador could be represented by different OTI combinations, which coincides with other studies that also used different trait sets to explain ecosystem functions [78,79].
Based on the different OTIs used for the two ecosystem functions, the clustering approach also resulted in two TFT sets with a differing assignment of the 52 tree species. The productivity-related P-TFTs in the mountain rainforest showed a separation in high- to mid-elevation and mid- to low-elevation TFTs, primarily due to a trend from low (P1–P4) to high acquisitive functional leaf traits (P5–P7), which indicates higher productivity at lower elevations. This corresponds to a study in the Peruvian Andes, which found a decrease in productivity with increasing elevation [80]. The difference between productivity at high and low elevation was also confirmed by a stand-level study in the same region, showing a sharp decrease in net primary production (NPP) from 1000 to 3000 m [81]. This was also supported by general elevation trends in productivity-related leaf traits, namely SLA and N, which decrease from the mid- to low-elevation TFT P7 to the high-elevation TFT P1. Wallis et al. [81] found a comparable decrease in SLA from high to low elevation. They also found that foliar N was reduced at high elevation but that similar levels occurred at 1000 and 2000 m elevation. Our new, more comprehensive trait data set revealed an average decrease in foliar N also between 1000 and 2000 m, thus supporting the superordinated grouping of P-TFTs for productivity along the elevation gradient. In addition to this elevational trend, further cluster separation may result from the local environmental conditions, such as soil nutrient pools, that influence productivity. The high number of mid-elevation species assigned to the low-productivity TFTs P2 and P3 corresponds to the differences in foliar N, which were also found by Moser et al. [82] at the same elevation level. Thus, P-TFTs characterizing less acquisitive slow-growing and high acquisitive fast-growing species could generally occur on the same elevation level where the cluster separability is related to differences in soil nutrient availability [83,84,85,86]. In extreme cases, the superordinated elevation P-TFT grouping might be masked by strong local nutrient gradients observed in related leaf traits such as leaf N [87]. This might explain why other studies in Andean mountain rainforests found no clear altitudinal trend in productivity [88]. Our P-TFT grouping revealed that no complete masking of the elevation (climate) effects along the elevation gradient occur for the mountain rainforest in SE Ecuador, but that local nutrient gradients lead to a functional subgrouping of tree species at the same elevation level. This combined influence of elevation (through climate) on productivity was recently investigated for two Ecuadorian mountain forests by Homeier et al. [89], including our study site.
The second set of TFTs was delineated to describe impacts on solar radiation turnover at the leaf level for both VIS and NIR wavelengths. The R-TFTs showed a decrease in VIS albedo with increasing elevation, whereas NIR showed a less distinct direct differentiation with elevation. The R-TFTs were separated based on all OTIs relating to leaf structure and nutrient status (F1), pigment concentrations (F2 and F3), and interactions between NIR albedo and leaf water status (F4). The clusters revealed a clear decrease in VIS albedo with increasing elevation, whereas NIR initially showed a less clear differentiation with elevation. However, alterations in NIR albedo were attributed to elevational changes in SLA by Doughty et al. [5]. Particularly when the single-species cluster of the pioneer tree Miconia aff punctata was excluded from cross-correlation (Table S5), the relation of the RTF clusters’ NIR albedo with elevation, SLA, and leaf water became much more dominant and showed the same direction as in [5]. Further variations are due to biochemical traits and leaf water. This showed that traits of individual species could mask the general altitudinal orientation of the optical cluster. The VIS albedo of the R-TFTs revealed a clear relation to elevation, mediated mainly by leaf structural traits and individually modified by biochemical traits, such as leaf N for R8. This finding contrasts those of Doughty et al. [5], who did not find a clear elevational dependence of VIS albedo for another tropical mountain forest. Poorter et al. [90] showed that SLA correlated positively and chlorophyll negatively with the availability of light. Because the high-elevation clusters R2, R3, and R8 were located in an area of very high cloud coverage of around 80% [91], light is scarce. The expected light adaptation is visible in the reduced VIS albedo (increased absorbance for photosynthesis) of these clusters, but only in R8 for NIR albedo. Altogether, the R-TFT groups showed a superordinated orientation of both VIS and NIR albedo to altitude and structural traits, modified by specific species with diverging biochemical properties. Mid-elevation species were present in nearly all R-TFTs, which argues for a high diversity of leaf spectral responses at this altitudinal level. Göttlicher et al. [92] clustered leaf reflectance and transmittance of species in a montane rainforest at 2000 m into seven groups, also supporting our cluster results.
Despite the functional reasonableness of our TFT grouping for both functions, it is debatable if the groups are separated enough to justify distinct TFTs in LSMs. The clustering of OTIs into TFTs showed only a weak structuring of the TFTs. This underpins the generally high variation within functional groups but distinct differences between average traits, as also found by Reich et al. [16]. The main reason is the near-continuous distribution of optical functional indicator values, which can similarly be observed for the functional traits of species in the study area [28]. A reason for this is most likely the high number of tree species in the megadiverse mountain forest. High data continuity was also confirmed for other studies using a large number of tropical species [93,94]. Furthermore, trait responses to climate variables as described for SLA [5] may also be continuous; thus, vegetation representation in LSMs may be improved by the integration of full trait diversity rather than using a fixed average of PFT parameters [28]. It was shown that the precision of model predictions for vegetation productivity could be improved by supplying a range of values for PFT parameterization; however, fixed-parameter values for key plants have been, to date, largely thought sufficient for the calculation of surface fluxes (e.g., evapotranspiration and net shortwave radiation) [95]. Doughty et al. [5] and the considerable range in NIR optical traits found in our study, however, underpin the need for better model parameterization, especially for the function of radiation partitioning. The TFT sets in this study provide the possibility of using regionally applicable groups for vegetation parameterization, which may improve LSMs such as the community land model (CLM) [96]. A better optical parameterization may especially improve simulations of energy and water fluxes, as Göttlicher et al. [92] found strong deviations between default and fixed VIS and NIR albedo parameters from the general PFT “evergreen tropical broadleaved trees” deployed by the CLM and the real levels in the mountain rain forest.

5. Conclusions

We found that OTIs could be used to categorize species of a megadiverse tropical mountain forest into ecologically meaningful groups for the two functions of productivity and radiation partitioning, which can be explained by environmental drivers. P-TFTs represent leaf-scale productivity in reasonable groups, reflecting acquisitive traits that adequately represent stand-scale patterns of forest productivity. The R-TFT set was considered to be well-suited to functionally differentiating tree species with regard to radiation partitioning, as optical metrics directly relate to VIS and NIR albedo. Elevation-dependent differences in VIS and NIR albedo are especially expected to enable the simulation of changes in radiation fluxes, which were shown to affect heat fluxes between the atmosphere and vegetation, potentially leading to strong additional warming feedback under climate change [5].

Supplementary Materials

The following are available online at https://0-www-mdpi-com.brum.beds.ac.uk/article/10.3390/f12050649/s1. Table S1: Means and standard deviations of climate variables for the study sites by elevation; Table S2. Overview of sampled species and mean functional traits; Table S3. Species affiliation to TFTs for productivity (P); Table S4. Species affiliation to TFTs for radiation fluxes (R); Figure S1. Correlation matrix of optical traits; Figure S2. Clustering in the bivariate factor space for the productivity ecosystem function; Figure S3. Clustering of the complete factor space; Figure S4. Altitudinal distribution of P-TFTs along the elevation gradient Figure S5; Cross-correlation matrix (Spearman’s rho) of the R-TFT VIS and NIR and albedo with the median values of the functional traits; Figure S6. Leaf geometry of the R-TFT clusters; Figure S7. Altitudinal distribution of R-TFTs along the elevation gradient.

Author Contributions

Conceptualization, O.L. and J.B.; methodology, O.L.; validation, O.L.; formal analysis, O.L.; investigation, O.L., J.H. and N.F.; resources, University of Marburg; data curation, O.L.; writing—original draft preparation, O.L. and J.B.; writing—review and editing, O.L., J.H., F.P.-C., A.F., C.L., N.F., K.T. and J.B.; visualization, O.L. and J.B.; supervision, J.B.; project administration, J.B. and N.F.; funding acquisition, J.B., K.T., N.F., C.L. and J.H. All authors have read and agreed to the published version of the manuscript.

Funding

This research was funded by the German Research Foundation (DFG) as part of the Research Unit FOR2730 (RESPECT: Environmental changes in biodiversity hotspot ecosystems of South Ecuador: RESPonse and feedback effECTs). The work was conducted within the subprojects A1, B1, and B4 (BE1780/51-1, TR1201/3-1, HO3296/6-1, and LE762/17-1) “Atmospheric fluxes and optical trait diversity under climate and land-use changes—observations and LSM modelling”.

Data Availability Statement

The data presented in this study are available on request from the corresponding author.

Acknowledgments

We thank the Ministerio del Ambiente y Agua (MAAE)and the Instituto Nacional de Biodiversidad de Ecuador (INABIO) for granting research permits and the foundation Nature and Culture International (NCI) for providing research facilities.

Conflicts of Interest

The funders had no role in the design of the study; in the collection, analyses, or interpretation of data; in the writing of the manuscript; or in the decision to publish the results.

References

  1. Lavorel, S.; Díaz, S.; Cornelissen, J.H.C.; Garnier, E.; Harrison, S.P.; McIntyre, S.; Pausas, J.G.; Pérez-Harguindeguy, N.; Roumet, C.; Urcelay, C. Plant Functional Types: Are We Getting Any Closer to the Holy Grail? In Terrestrial Ecosystems in a Changing World; Springer: Berlin/Heidelberg, Germany, 2007; pp. 149–164. [Google Scholar]
  2. Lewis, S.L.; Lopez-Gonzalez, G.; Sonké, B.; Affum-Baffoe, K.; Baker, T.R.; Ojo, L.O.; Phillips, O.L.; Reitsma, J.M.; White, L.; Wöll, H.; et al. Increasing carbon storage in intact African tropical forests. Nature 2009, 457, 1003–1006. [Google Scholar] [CrossRef] [PubMed]
  3. Mitchard, E.T. The tropical forest carbon cycle and climate change. Nature 2018, 559, 527–534. [Google Scholar] [CrossRef] [PubMed]
  4. Levine, N.M.; Zhang, K.; Longo, M.; Baccini, A.; Phillips, O.L.; Lewis, S.L.; Alvarez-Dávila, E.; Brienen, R.J.W.; Erwin, T.L.; Moorcroft, P.R.; et al. Ecosystem heterogeneity determines the ecological resilience of the Amazon to climate change. Proc. Natl. Acad. Sci. USA 2016, 113, 793–797. [Google Scholar] [CrossRef] [PubMed] [Green Version]
  5. Doughty, C.E.; Santos-Andrade, P.E.; Shenkin, A.; Goldsmith, G.R.; Bentley, L.P.; Blonder, B.; Díaz, S.; Salinas, N.; Enquist, B.J.; Martin, R.E.; et al. Tropical forest leaves may darken in response to climate change. Nat. Ecol. Evol. 2018, 2, 1918–1924. [Google Scholar] [CrossRef]
  6. Aguilos, M.; Hérault, B.; Burban, B.; Wagner, F.; Bonal, D. What drives long-term variations in carbon flux and balance in a tropical rainforest in French Guiana? Agric. Meteorol. 2018, 253, 114–123. [Google Scholar] [CrossRef]
  7. Cunningham, S.A.; Summerhayes, B.; Westoby, M. Evolutionary divergences in leaf structure and chemistry, comparing rainfall and soil nutrient gradients. Ecol. Monogr. 1999, 69, 569–588. [Google Scholar] [CrossRef]
  8. Feng, Y.-L.; Fu, G.-L.; Zheng, Y.-L. Specific leaf area relates to the differences in leaf construction cost, photosynthesis, nitrogen allocation, and use efficiencies between invasive and noninvasive alien congeners. Planta 2008, 228, 383–390. [Google Scholar] [CrossRef] [PubMed]
  9. Wright, I.J.; Reich, P.B.; Westoby, M.; Ackerly, D.D.; Baruch, Z.; Bongers, F.; Cavender-Bares, J.; Chapin, T.; Cornelissen, J.H.; Diemer, M.; et al. The worldwide leaf economics spectrum. Nature 2004, 428, 821–827. [Google Scholar] [CrossRef]
  10. Reich, P.B.; Walters, M.B.; Ellsworth, D.S. From tropics to tundra: Global convergence in plant functioning. Proc. Natl. Acad. Sci. USA 1997, 94, 13730–13734. [Google Scholar] [CrossRef] [Green Version]
  11. Jacquemoud, S.; Ustin, S. Leaf Otpical Properties; Cambridge University Press: Cambridge, UK, 2019; 555p. [Google Scholar]
  12. Curran, P.J. Remote sensing of foliar chemistry. Remote Sens. Environ. 1989, 30, 271–278. [Google Scholar] [CrossRef]
  13. Ollinger, S. Sources of variability in canopy reflectance and the convergent properties of plants. New Phytol. 2011, 189, 375–394. [Google Scholar] [CrossRef]
  14. Mielke, M.; Schaffer, B.; Schilling, A. Evaluation of reflectance spectroscopy indices for estimation of chlorophyll content in leaves of a tropical tree species. Photosynthetica 2012, 50, 343–352. [Google Scholar] [CrossRef]
  15. Asner, G.P.; Martin, R.E.; Knapp, D.E.; Tupayachi, R.; Anderson, C.; Carranza, L.; Martinez, P.; Houcheime, M.; Sinca, F.; Weiss, P. Spectroscopy of canopy chemicals in humid tropical forests. Remote Sens. Environ. 2011, 115, 3587–3598. [Google Scholar] [CrossRef]
  16. Wang, Z.; Chlus, A.; Geygan, R.; Ye, Z.; Zheng, T.; Singh, A.; Couture, J.J.; Cavender-Bares, J.; Kruger, E.L.; Townsend, P.A. Foliar functional traits from imaging spectroscopy across biomes in eastern North America. New Phytol. 2020, 228, 494–511. [Google Scholar] [CrossRef] [PubMed]
  17. Ribeiro da Luz, B. Attenuated total reflectance spectroscopy of plant leaves: A tool for ecological and botanical studies. New Phytol. 2006, 172, 305–318. [Google Scholar] [CrossRef]
  18. Arai, E.; Pereira, G.; Coura, S.M.; Cardozo, F.S.; Silva, F.B.; Shimabukuro, Y.E.; Espirito-Santo, F.D. Spectral Signature of Leaves of Amazon Rainforest Tree Species. In Proceedings of the 2010 IEEE International Geoscience and Remote Sensing Symposium, Honolulu, HI, USA, 25–30 July 2010; IEEE: Piscataway, NJ, USA, 2010; pp. 4788–4791. [Google Scholar]
  19. Harrison, D.; Rivard, B.; Sanchez-Azofeifa, A. Classification of tree species based on longwave hyperspectral data from leaves, a case study for a tropical dry forest. Int. J. Appl. Earth Obs. Geoinf. 2018, 66, 93–105. [Google Scholar] [CrossRef]
  20. Durgante, F.M.; Higuchi, N.; Almeida, A.; Vicentini, A. Species spectral signature: Discriminating closely related plant species in the Amazon with near-infrared leaf-spectroscopy. For. Ecol. Manag. 2013, 291, 240–248. [Google Scholar] [CrossRef]
  21. Lang, C.; Costa, F.R.C.; Camargo, J.L.C.; Durgante, F.M.; Vicentini, A. Near infrared spectroscopy facilitates rapid identification of both young and mature Amazonian tree species. PLoS ONE 2015, 10, e0134521. [Google Scholar] [CrossRef]
  22. Castro-Esau, K.L.; Sánchez-Azofeifa, G.A.; Rivard, B.; Wright, S.J.; Quesada, M. Variability in leaf optical properties of Mesoamerican trees and the potential for species classification. Am. J. Bot. 2006, 93, 517–530. [Google Scholar] [CrossRef]
  23. Clark, M.L.; Roberts, D.A. Species-level differences in hyperspectral metrics among tropical rainforest trees as determined by a tree-based classifier. Remote Sens. 2012, 4, 1820–1855. [Google Scholar] [CrossRef] [Green Version]
  24. Ustin, S.L.; Gamon, J.A. Remote sensing of plant functional types. New Phytol. 2010, 186, 795–816. [Google Scholar] [CrossRef]
  25. Roth, K.L.; Casas, A.; Huesca, M.; Ustin, S.L.; Alsina, M.M.; Mathews, S.A.; Whiting, M.L. Leaf spectral clusters as potential optical leaf functional types within California ecosystems. Remote Sens. Environ. 2016, 184, 229–246. [Google Scholar] [CrossRef] [Green Version]
  26. Feilhauer, H.; Somers, B.; van der Linden, S. Optical trait indicators for remote sensing of plant species composition: Predictive power and seasonal variability. Ecol. Indic. 2017, 73, 825–833. [Google Scholar] [CrossRef]
  27. Kattenborn, T.; Fassnacht, F.E.; Schmidtlein, S. Differentiating plant functional types using reflectance: Which traits make the difference? Remote Sens. Ecol. Conserv. 2019, 5, 5–19. [Google Scholar] [CrossRef] [Green Version]
  28. Bendix, J.; Aguirre, N.; Beck, E.; Bräuning, A.; Brandl, R.; Breuer, L.; Boehning-Gaese, K.; Dantas De Paula, M.; Hickler, T.; Homeier, J.; et al. A research framework for projecting ecosystem change in highly diverse tropical mountain ecosystems. Oecologia 2021, 195, 589–600. [Google Scholar] [CrossRef]
  29. Bendix, J.; Beck, E.; Bräuning, A.; Makeschin, F.; Mosandl, R.; Scheu, S.; Wilcke, W. Ecosystem Services, Biodiversity and Environmental Change in a Tropical Mountain Ecosystem of South Ecuador; Springer Science & Business Media: Berlin, Germany, 2013; Volume 221. [Google Scholar]
  30. Beck, E.; Bendix, J.; Kottke, I.; Makeschin, F.; Mosandl, R. Gradients in a Tropical Mountain Ecosystem of Ecuador; Springer Science & Business Media: Berlin, Germany, 2008; Volume 198. [Google Scholar]
  31. Rollenbeck, R.; Bendix, J. Rainfall distribution in the Andes of southern Ecuador derived from blending weather radar data and meteorological field observations. Atmos. Res. 2011, 99, 277–289. [Google Scholar] [CrossRef]
  32. Fries, A.; Rollenbeck, R.; Bayer, F.; Gonzalez, V.; Onate-Valivieso, F.; Peters, T.; Bendix, J. Catchment precipitation processes in the San Francisco valley in southern Ecuador: Combined approach using high-resolution radar images and in situ observations. Meteorol. Atmos. Phys. 2014, 126, 13–29. [Google Scholar] [CrossRef]
  33. Giannoni, S.M.; Rollenbeck, R.; Fabian, P.; Bendix, J. Complex topography influences atmospheric nitrate deposition in a neotropical mountain rainforest. Atmos. Environ. 2013, 79, 385–394. [Google Scholar] [CrossRef]
  34. Makowski Giannoni, S.; Rollenbeck, R.; Trachte, K.; Bendix, J. Natural or anthropogenic? On the origin of atmospheric sulfate deposition in the Andes of southeastern Ecuador. Atmos. Chem. Phys. 2014, 11297–11312. [Google Scholar] [CrossRef] [Green Version]
  35. Werner, E.; Paladines, F.A.; Homeier, J. Is tropical montane forest heterogeneity promoted by a resource-driven feedback cycle? Evidence from nutrient relations, herbivory and litter decomposition along a topographical gradient. Funct. Ecol. 2015, 29, 430–440. [Google Scholar] [CrossRef]
  36. Beck, E.; Paladines, P.; Paladines, R.; Matt, F.; Farwig, N.; Bendix, J. Alexander von Humboldt would have loved it: Estación Científica San Francisco: Estación Científica San Franscisco (ECSF). ECOTROPICA 2019, 21, 201909. [Google Scholar]
  37. Philipson, W.R.; Gordon, D.K.; Philpot, W.D.; Duggin, M.J. Technical note Field reflectance calibration with grey standard reflectors. Int. J. Remote Sens. 1989, 10, 1035–1039. [Google Scholar] [CrossRef]
  38. Chave, J.; Coomes, D.; Jansen, S.; Lewis, S.L.; Swenson, N.G.; Zanne, A.E. Towards a worldwide wood economics spectrum. Ecol. Lett. 2009, 12, 351–366. [Google Scholar] [CrossRef]
  39. Oleson, K.W.; Lawrence, D.M.; Bonan, G.B.; Flanner, M.G.; Kluzek, E.; Lawrence, P.J.; Levis, S.; Swenson, S.C.; Thornton, P.E.; Dai, A. Technical Description of Version 4.5 of the Community Land Model (CLM); NCAR Technical Notes (NCAR/TN-478+ STR); National Center for Atmospheric Research (NCAR): Boulder, CO, USA, 2010. [Google Scholar] [CrossRef]
  40. Lehmann, J.; Große-Stoltenberg, A.; Römer, M.; Oldeland, J. Field spectroscopy in the VNIR-SWIR region to discriminate between Mediterranean native plants and exotic-invasive shrubs based on leaf tannin content. Remote Sens. 2015, 7, 1225–1241. [Google Scholar] [CrossRef] [Green Version]
  41. Tucker, C. Red and photographic infrared linear combinations for monitoring vegetation. Remote Sens. Environ. 1979, 8, 127–150. [Google Scholar] [CrossRef] [Green Version]
  42. Clark, M.L.; Roberts, D.A.; Ewel, J.J.; Clark, D.B. Estimation of tropical rain forest aboveground biomass with small-footprint lidar and hyperspectral sensors. Remote Sens. Environ. 2011, 115, 2931–2942. [Google Scholar] [CrossRef]
  43. Jordan, C.F. Derivation of leaf-area index from quality of light on the forest floor. Ecology 1969, 50, 663–666. [Google Scholar] [CrossRef]
  44. Sims, D.A.; Gamon, J.A. Relationships between leaf pigment content and spectral reflectance across a wide range of species, leaf structures and developmental stages. Remote Sens. Environ. 2002, 81, 337–354. [Google Scholar] [CrossRef]
  45. Wu, C.; Niu, Z.; Tang, Q.; Huang, W. Estimating chlorophyll content from hyperspectral vegetation indices: Modeling and validation. Agric. For. Meteorol. 2008, 148, 1230–1241. [Google Scholar] [CrossRef]
  46. Gitelson, A.A.; Keydan, G.P.; Merzlyak, M.N. Three-band model for noninvasive estimation of chlorophyll, carotenoids, and anthocyanin contents in higher plant leaves. Geophys. Res. Lett. 2006, 33, L11402. [Google Scholar] [CrossRef] [Green Version]
  47. Blackburn, G.A. Quantifying chlorophylls and caroteniods at leaf and canopy scales: An evaluation of some hyperspectral approaches. Remote Sens. Environ. 1998, 66, 273–285. [Google Scholar] [CrossRef]
  48. Serrano, L.; Penuelas, J.; Ustin, S.L. Remote sensing of nitrogen and lignin in Mediterranean vegetation from AVIRIS data: Decomposing biochemical from structural signals. Remote Sens. Environ. 2002, 81, 355–364. [Google Scholar] [CrossRef]
  49. Galvao, L.S.; Formaggio, A.R.; Tisot, D.A. Discrimination of sugarcane varieties in Southeastern Brazil with EO-1 Hyperion data. Remote Sens. Environ. 2005, 94, 523–534. [Google Scholar] [CrossRef]
  50. Peñuelas, J.; Filella, I.; Biel, C.; Serrano, L.; Save, R. The reflectance at the 950–970 nm region as an indicator of plant water status. Int. J. Remote Sens. 1993, 14, 1887–1905. [Google Scholar] [CrossRef]
  51. Rosso, P.H.; Pushnik, J.C.; Lay, M.; Ustin, S.L. Reflectance properties and physiological responses of Salicornia virginica to heavy metal and petroleum contamination. Environ. Pollut. 2005, 137, 241–252. [Google Scholar] [CrossRef]
  52. Revelle, W. Psych: Procedures for Psychological, Psychometric, and Personality Research; Northwestern University: Evanston, IL, USA, 2019. [Google Scholar]
  53. R Core Team. R: A Language and Environment for Statistical Computing; R Foundation for Statistical Computing: Vienna, Austria, 2020. [Google Scholar]
  54. Xu, D.; Tian, Y. A comprehensive survey of clustering algorithms. Ann. Data Sci. 2015, 2, 165–193. [Google Scholar] [CrossRef] [Green Version]
  55. Frey, B.J.; Dueck, D. Clustering by passing messages between data points. Science 2007, 315, 972–976. [Google Scholar] [CrossRef] [Green Version]
  56. Bodenhofer, U.; Kothmeier, A.; Hochreiter, S. APCluster: An R package for affinity propagation clustering. Bioinformatics 2011, 27, 2463–2464. [Google Scholar] [CrossRef]
  57. Ester, M.; Sander, J. Knowledge Discovery in Databases; Springer: Berlin, Germany, 2000; p. 275. [Google Scholar]
  58. Rousseeuw, P.J. Silhouettes: A graphical aid to the interpretation and validation of cluster analysis. J. Comput. Appl. Math. 1987, 20, 53–65. [Google Scholar] [CrossRef] [Green Version]
  59. Paul, M.J.; Foyer, C.H. Sink regulation of photosynthesis. J. Exp. Bot. 2001, 52, 1383–1400. [Google Scholar] [CrossRef]
  60. Güsewell, S. N:P ratios in terrestrial plants: Variation and functional significance: Tansley review. New Phytol. 2004, 164, 243–266. [Google Scholar] [CrossRef]
  61. Cernusak, L.A.; Winter, K.; Turner, B.L. Leaf nitrogen to phosphorus ratios of tropical trees: Experimental assessment of physiological and environmental controls. New Phytol. 2010, 185, 770–779. [Google Scholar] [CrossRef]
  62. Abadía, J.; Morales, F.; Abadía, A. Photosystem II efficiency in low chlorophyll, iron-deficient leaves. Plant Soil 1999, 183–192. [Google Scholar] [CrossRef] [Green Version]
  63. Wang, Q.; Yang, S.; Wan, S.; Li, X. The significance of calcium in photosynthesis. Int. J. Mol. Sci. 2019, 20, 1353. [Google Scholar] [CrossRef] [Green Version]
  64. Jiang, H.X.; Chen, L.S.; Zheng, J.G.; Han, S.; Tang, N.; Smith, B.R. Aluminum-induced effects on Photosystem II photochemistry in Citrus leaves assessed by the chlorophyll a fluorescence transient. Tree Physiol. 2008, 215, 1863–1871. [Google Scholar] [CrossRef]
  65. Horler, D.N.H.; Dockray, M.; Barber, J. The red edge of plant leaf reflectance. Int. J. Remote Sens. 1983, 4, 273–288. [Google Scholar] [CrossRef]
  66. Wagemann, J.; Thies, B.; Rollenbeck, R.; Peters, T.; Bendix, J. Regionalization of wind-speed data to analyse tree-line wind conditions in the eastern Andes of southern Ecuador. Erdkunde 2015, 64, 3–19. [Google Scholar] [CrossRef]
  67. Gilliham, M.; Dayod, M.; Hocking, B.J.; Xu, B.; Conn, S.J.; Kaiser, B.N.; Leigh, R.A.; Tyerman, S.D. Calcium delivery and storage in plant leaves: Exploring the link with water flow. J. Exp. Bot. 2011, 62, 2233–2250. [Google Scholar] [CrossRef]
  68. Basayigit, L.; Albayrak, S.; Senol, H. Analysis of VNIR reflectance for prediction of macro and micro nutrient and chlorophyll contents in apple trees (Malus communis). Asian J. Chem. 2009, 21, 1302–1308. [Google Scholar]
  69. Kattenborn, T.; Schmidtlein, S. Radiative transfer modelling reveals why canopy reflectance follows function. Sci. Rep. 2019, 9, 6541. [Google Scholar] [CrossRef] [PubMed] [Green Version]
  70. Croft, H.; Chen, J.M.; Luo, X.; Bartlett, P.; Chen, B.; Staebler, R.M. Leaf chlorophyll content as a proxy for leaf photosynthetic capacity. Glob. Chang. Biol. 2017, 23, 3513–3524. [Google Scholar] [CrossRef]
  71. Houborg, R.; Cescatti, A.; Migliavacca, M.; Kustas, W. Satellite retrievals of leaf chlorophyll and photosynthetic capacity for improved modeling of GPP. Agric. For. Meteorol. 2013, 177, 10–23. [Google Scholar] [CrossRef]
  72. Schull, M.; Anderson, M.; Houborg, R.; Gitelson, A.A.; Kustas, W. Thermal-based modeling of coupled carbon, water, and energy fluxes using nominal light use efficiencies constrained by leaf chlorophyll observations. Biogeosciences 2015, 12, 1511–1523. [Google Scholar] [CrossRef] [Green Version]
  73. Li, Y.; Liu, C.; Zhang, J.; Yang, H.; Xu, L.; Wang, Q.; Sack, L.; Wu, X.; Hou, J.; He, N. Variation in leaf chlorophyll concentration from tropical to cold-temperate forests: Association with gross primary productivity. Ecol. Indic. 2018, 85, 383–389. [Google Scholar] [CrossRef]
  74. Gitelson, A.A.; Peng, Y.; Arkebauer, T.J.; Schepers, J. Relationships between gross primary production, green LAI, and canopy chlorophyll content in maize: Implications for remote sensing of primary production. Remote Sens. Environ. 2014, 144, 65–72. [Google Scholar] [CrossRef]
  75. Landi, M.; Tattini, M.; Gould, K.S. Multiple functional roles of anthocyanins in plant-environment interactions. Environ. Exp. Bot. 2015, 119, 4–17. [Google Scholar] [CrossRef]
  76. Steyn, W.; Wand, S.; Holcroft, D.; Jacobs, G. Anthocyanins in vegetative tissues: A proposed unified function in photoprotection. New Phytol. 2002, 155, 349–361. [Google Scholar] [CrossRef]
  77. Zygielbaum, A.I.; Gitelson, A.A.; Arkebauer, T.J.; Rundquist, D.C. Non-destructive detection of water stress and estimation of relative water content in maize. Geophys. Res. Lett. 2009, 36, 1–4. [Google Scholar] [CrossRef] [Green Version]
  78. Pillar, V.D.; Sosinski, E.E., Jr. An improved method for searching plant functional types by numerical analysis. J. Veg. Sci. 2003, 14, 323–332. [Google Scholar] [CrossRef]
  79. Gitay, H.; Noble, I.; Connell, J. Deriving functional types for rain-forest trees. J. Veg. Sci. 1999, 10, 641–650. [Google Scholar] [CrossRef]
  80. Girardin, C.A.J.; Malhi, Y.; Aragao, L.E.O.C.; Mamani, M.; Huaraca Huasco, W.; Durand, L.; Feeley, K.J.; Rapp, J.; Silva-Espejo, J.E.; Whittaker, R.J.; et al. Net primary productivity allocation and cycling of carbon along a tropical forest elevational transect in the Peruvian Andes. Glob. Chang. Biol. 2010, 16, 3176–3192. [Google Scholar] [CrossRef] [Green Version]
  81. Wallis, C.I.; Homeier, J.; Peña, J.; Brandl, R.; Farwig, N.; Bendix, J. Modeling tropical montane forest biomass, productivity and canopy traits with multispectral remote sensing data. Remote Sens. Environ. 2019, 225, 77–92. [Google Scholar] [CrossRef]
  82. Moser, G.; Leuschner, C.; Hertel, D.; Graefe, S.; Soethe, N.; Iost, S. Elevation effects on the carbon budget of tropical mountain forests (S Ecuador): The role of the belowground compartment. Glob. Chang. Biol. 2011, 17, 2211–2226. [Google Scholar] [CrossRef] [Green Version]
  83. Shen, Y.; Gilbert, G.S.; Li, W.; Fang, M.; Lu, H.; Yu, S. Linking aboveground traits to root traits and local environment: Implications of the plant economics spectrum. Front. Plant Sci. 2019, 10, 1412. [Google Scholar] [CrossRef]
  84. Laughlin, D.C.; Richardson, S.J.; Wright, E.F.; Bellingham, P.J. Environmental filtering and positive plant litter feedback simultaneously explain correlations between leaf traits and soil fertility. Ecosystems 2015, 18, 1269–1280. [Google Scholar] [CrossRef]
  85. Reich, P.B. The world-wide ‘fast–slow’plant economics spectrum: A traits manifesto. J. Ecol. 2014, 102, 275–301. [Google Scholar] [CrossRef]
  86. Pérez-Ramos, I.M.; Roumet, C.; Cruz, P.; Blanchard, A.; Autran, P.; Garnier, E. Evidence for a ‘plant community economics spectrum’driven by nutrient and water limitations in a Mediterranean rangeland of southern France. J. Ecol. 2012, 100, 1315–1327. [Google Scholar] [CrossRef] [Green Version]
  87. Fyllas, N.M.; Bentley, L.P.; Shenkin, A.; Asner, G.P.; Atkin, O.K.; Díaz, S.; Enquist, B.J.; Farfan-Rios, W.; Gloor, E.; Malhi, Y.; et al. Solar radiation and functional traits explain the decline of forest primary productivity along a tropical elevation gradient. Ecol. Lett. 2017, 20, 730–740. [Google Scholar] [CrossRef]
  88. Malhi, Y.; Girardin, C.A.; Goldsmith, G.R.; Doughty, C.E.; Salinas, N.; Metcalfe, D.B.; Huaraca Huasco, W.; Silva-Espejo, J.E.; Amézquita, F.F.; Silman, M. The variation of productivity and its allocation along a tropical elevation gradient: A whole carbon budget perspective. New Phytol. 2017, 214, 1019–1032. [Google Scholar] [CrossRef]
  89. Homeier, J.; Leuschner, C. Factors controlling the productivity of tropical Andean forests: Climate and soil are more important than tree diversity. Biogeosciences 2021, 18, 1525–1541. [Google Scholar] [CrossRef]
  90. Poorter, L.; Oberbauer, S.F.; Clark, D.B. Leaf optical properties along a vertical gradient in a tropical rain forest canopy in Costa Rica. Am. J. Bot. 1995, 82, 1257–1263. [Google Scholar] [CrossRef]
  91. Bendix, J.; Rollenbeck, R.; Göttlicher, D.; Cermak, J. Cloud occurence and cloud properties in Ecuador. Clim. Res. 2006, 30, 133–147. [Google Scholar] [CrossRef] [Green Version]
  92. Göttlicher, D.; Albert, J.; Nauss, T.; Bendix, J. Optical properties of selected plants from a tropical mountain ecosystem—Traits for plant functional types to parametrize a land surface model. Ecol. Model. 2011, 222, 493–502. [Google Scholar] [CrossRef]
  93. Wright, S.J.; Kitajima, K.; Kraft, N.J.; Reich, P.B.; Wright, I.J.; Bunker, D.E.; Condit, R.; Dalling, J.W.; Davies, S.J.; Zanne, A.E.; et al. Functional traits and the growth–mortality trade-off in tropical trees. Ecology 2010, 91, 3664–3674. [Google Scholar] [CrossRef] [PubMed]
  94. Reich, P.B.; Wright, I.J.; Cavender-Bares, J.; Craine, J.M.; Oleksyn, J.; Westoby, M.; Walters, M.B. The evolution of plant functional variation: Traits, spectra, and strategies. Int. J. Plant. Sci. 2003, 164, S143–S164. [Google Scholar] [CrossRef]
  95. Alton, P.B. How useful are plant functional types in global simulations of the carbon, water, and energy cycles? J. Geophys. Res. Biogeosc. 2011, 116, G01030. [Google Scholar] [CrossRef] [Green Version]
  96. Lawrence, D.; Fisher, R.; Koven, C.; Oleson, K.; Swenson, S.; Vertenstein, M.; Andre, B.; Bonan, G.; Ghimire, B.; van Kampenhout, L.; et al. Technical Description of Version 5.0 of the Community Land Model (CLM); NCAR Technical Note NCAR/TN-478+ STR.; National Center for Atmospheric Research (NCAR): Boulder, CO, USA, 2018; p. 257. [Google Scholar]
Figure 1. Plot locations at Bombuscaro (1000 m above sea level), San Francisco (2000 m above sea level.), and Cajanuma (3000 m above sea level). The DEM is based on SRTM data (USGS, 2006). The inlay shows the position of the research area in southern Ecuador.
Forests 12 00649 g001
Figure 2. Study workflow. The hyperspectral leaf data were pre-processed and converted to commonly used leaf optical metrics (Table 1). A factor analysis was conducted to aggregate the optical metrics to optical traits indicators (OTIs), where the indication for the functional traits was documented by their correlation with species factor scores. A subsequent cluster analysis was used to assign the species to tree functional types (TFTs).
Forests 12 00649 g002
Figure 3. Correlations of species factor scores with functional leaf traits for the four factors. The color gradient indicates positive (green) to negative correlations (yellow). Weak correlations are depicted in lighter colors. Significant correlations are marked corresponding to the p-value: * < 0.05; ** < 0.01; *** < 0.001. Based on the correlation of the factor scores with leaf functional traits, F1 can be interpreted as the OTI (optical trait indicators) for resource acquisition and usage, F2 in terms of photosynthetic capacity and light use efficiency, F3 as photoprotection, and F4 in terms of leaf water effect on NIR albedo.
Forests 12 00649 g003
Figure 4. Relative deviation from the average median of dominating functional traits (relation > 0.5 with the OFIs F1 and F2) relevant to productivity for all P-TFTs. Average median values over all P-TFTs are: SLA = 81.5 cm2/g, leaf thickness = 0.32 mm, C = 478.9 mg/g, N = 17.3 mg/g, N/C = 29.7, and N/P = 20.2. Significant differences between the TFT traits and the average TFT median trait are marked corresponding to the p-value < 0.05: *; p-value < 0.01: **; p-value < 0.001: ***. The P-TFT 5 was not tested, as it was only comprised of a single species.
Forests 12 00649 g004
Figure 5. Deviations from average median VIS (blue, <700 nm) and NIR (red, >700 nm) albedos for the R-TFTs 1–8 related to different effects on solar radiation partitioning. Average median values over all R-TFTs were: VIS albedo = 7.4%, NIR albedo = 21.9%. Significant differences between the TFT albedos and the average TFT median albedo are marked corresponding to the p-value < 0.05: *; p-value < 0.01: **; p-value < 0.001: ***. The TFTs R1 and R3 were not tested, as they were only comprised of a single species.
Forests 12 00649 g005
Figure 6. Relative deviations from the average median of selected structural and biochemical functional traits (correlation > 0.5 with OFIs F1–4) relevant for solar radiation partitioning over all R-TFTs 1–8. Average median values over all R-TFTs were: SLA = 83.0 cm2/g, leaf thickness = 0.32 mm, N = 17.3 mg/g, and leaf water content (LWC) = 642.8 mg/g. Significant differences between the TFT traits and the average TFT median trait are marked corresponding to the p-value < 0.05: *; p-value < 0.01: **; p-value < 0.001: ***. The TFTs R1 and R3 were not tested, as they were only comprised of a single species.
Forests 12 00649 g006
Table 1. Selected commonly used leaf optical metrics for the study. R: reflectance at wavelength (nm); D: first derivate of reflectance at wavelength (nm); AGB: aboveground biomass. (+) and (−) indicate the mathematical direction of the relationship between leaf optical metrics and functional traits. Selected references describing the expected relationship between optical metrics and functional traits are provided in the last column. Absorption bands affecting the metrics were taken from Jacquemoud and Ustin [11], except for tannin absorption, which was taken from Lehmann et al. [40].
Optical MetricFormulaAbsorption BandsFunctional Trait RelationSource
NDVI(R800 − R680)/(R800 + R680)ChlorophyllAGB (+)Tucker (1979) [41]
Clark et al. (2011) [42]
SR680R800/R680ChlorophyllChlorophyll (+)Jordan (1969) [43]
Mielke et al. (2012) [14]
SR705R750/R705ChlorophyllChlorophyll (+)Sims and Gamon (2002) [44]
Mielke et al. (2012) [14]
mCARI((R750 − R705) − 0.2 × (R750 − 550)) × (R750/705)ChlorophyllChlorophyll (+)Wu et al. (2008) [45]
Mielke et al. (2012) [14]
SR798R798/R679ChlorophyllAGB (+)Clark et al. (2011) [42]
ARI(1/R550) − (1/R700)AnthocyaninsAnthocyanin (+)Gitelson et al. (2006) [46]
Mielke et al. (2012) [14]
BlackburnCar2(R804 − R484)/(R804 + R484)CarotenoidsCarotenoids (+)Blackburn (1998) [47]
GitelsonCar1(R484−1 − R571−1) × R746CarotenoidsCarotenoids (+)Gitelson et al. (2006) [46]
GitelsonCar2(R484−1 − R689−1) × R746Carotenoids ChlorophyllCarotenoids (+)Gitelson et al. (2006) [46]
D1040D1040Lignin
Proteins
Structural carbohydrates (+)Curran (1987) [12]
D1690D1690Lignin, sugars, starch, proteins, NStructural carbohydrates (+)Curran (1987) [12]
D1420D1420LigninStructural carbohydrates (+)Curran (1987) [12]
D1490D1490CelluloseStructural carbohydrates (+)Curran (1987) [12]
D1460D1460Sugar, starch,
tannins
lignin
Phenolic compounds (+)Lehmann et al. (2015) [40]
NDNI(log(1/R1510) − log(1/R1680))/(log(1/R1510) + log(1/R1680))NNitrogen (−)Serrano et al. (2002) [48]
D1510D1510NNitrogen (−)Curran (1987) [29]
D1020D1020ProteinsNitrogen (−)Curran (1987) [29]
LWVI_1(R1094-R983)/(R1094 + R983)Sugar, starch, protein, waterWater content per leaf area (+)Galvao et al. (2005) [49]
LWVI_2(R1094-R1205)/(R1094 + R1205)Cellulose, lignin, starch, sugarWater content per leaf area (+)Galvao et al. (2005) [49]
WBIR902/R973Sugar, starchWater content per leaf area (+)Peñuelas et al. (1993) [50]
D970D970waterWater content per leaf area (−)Curran (1987) [12]
D1200D1200CelluloseWater content per leaf area (−)Curran (1987) [12]
D1400D1400waterLeaf water content (+)Curran (1987) [12]
D1240D1240--Heavy metals (+)Rosso et al. (2005) [51]
Table 2. Factor loadings. Strong loadings on a factor are printed in bold, indicating the strength and direction of the impact of the optical metric on the respective factor Factors F1 to F4 explained 38%, 21%, 16%, and 12% of the variance, respectively. The loadings of F1 were strong for optical metrics related to carbohydrates, nitrogen, and water, whereas F2 loadings were strong for optical metrics related to photosynthetic pigment concentration and productivity. Optical metrics related to photo-protective pigments showed especially strong loadings on the F3 factor, whereas the F4 factor was mostly determined by optical metrics related to leaf water, phenolic compounds, and heavy metal concentrations.
F1F2F3F4
NDVI0.100.860.190.12
SR6800.090.830.210.14
SR7050.230.640.170.14
mCARI−0.270.94−0.320.06
SR7980.090.830.220.14
ARI0.22−0.420.780.07
BlackburnCar20.230.140.850.05
GitelsonCar1−0.220.130.930.01
GitelsonCar2−0.190.080.980.00
D10400.920.02−0.020.21
D16900.82−0.07−0.030.37
D14200.700.01−0.050.08
D14900.570.290.080.38
D14600.230.340.120.65
NDNI1.000.03−0.02−0.15
D15100.880.240.06−0.15
D10200.890.150.000.17
LWVI_10.96−0.07−0.050.00
LWVI_20.990.15−0.01−0.14
WBI0.97−0.290.02−0.11
D970−0.30−0.83−0.060.24
D1200−0.72−0.02−0.06−0.26
D14000.040.04−0.03−0.97
D12400.06−0.12−0.05−0.67
Table 3. Cluster properties and quality metrics of TFTs for the ecosystem function productivity. TFTs are described by their average species factor scores for F1 and F2. TFT size is the number of species assigned to the respective TFT. Bold values of silhouette width represent moderately well-separated and compact clusters. The average within cluster distance could not be calculated for P5, since it only contains one species.
TFT No.No. SpeciesF1F2Avg. within Cluster DistanceAvg. between Cluster DistanceAvg. Silhouette WidthProductivity
P131.951.510.782.450.49very low
P280.56−0.480.331.750.65low
P3111.040.220.601.810.35low, P-limited
P450.28−1.700.532.440.62intermediate
P51−0.063.38NA3.170.00high, P-limited
P615−0.780.320.711.880.41high
P79−1.22−0.640.752.240.36very high
Table 4. Cluster properties and quality metrics of TFTs influencing radiation partitioning between leaves and atmosphere (R-TFT). The TFTs were described according to average species factor scores for F1–F4. R-TFT size is the number of species assigned to the respective TFT. Bold values of silhouette width represent moderately well-separated and compact clusters. The average within cluster distance could not be calculated for R1 and R3, as they only consist of one species.
R-TFT No.No. of SpeciesF1F2F3F4Avg. within Cluster DistanceAvg. between Cluster DistanceAvg. Silhouette WidthAlbedo Difference
R11−0.063.381.332.40NA4.170.00very high NIR
intermediate VIS
R250.800.820.681.611.052.870.49high NIR
low VIS
R312.172.040.47−0.80NA3.400.00high NIR
very low VIS
R4150.80−0.330.300.101.282.560.27intermediate NIR
low VIS
R54−1.000.33−2.30−0.662.223.670.21low NIR
very high VIS
R612−0.930.200.770.021.502.820.33very low NIR
intermediate VIS
R79−0.680.10−0.47−1.361.672.990.26very low NIR
high VIS
Publisher’s Note: MDPI stays neutral with regard to jurisdictional claims in published maps and institutional affiliations.

