Article

Use of Optimization Modeling to Assess the Effect of Timber and Carbon Pricing on Harvest Scheduling, Carbon Sequestration, and Net Present Value of Eucalyptus Plantations

by
Andrés Hirigoyen
1,*,
Mauricio Acuna
2,
Cecilia Rachid-Casnati
1,
Jorge Franco
3 and
Rafael Navarro-Cerrillo
4
1
Instituto Nacional de Investigación Agopecuaria (INIA) Tacuarembó, Ruta 5 km 386, Tacuarembó 60000, Uruguay
2
Forest Research Institute, University of the Sunshine Coast, Locked Bag 4, Maroochydore, QLD 4558, Australia
3
Faculty of Agronomy, University of the Republic, Paysandú 60000, Uruguay
4
Laboratory of Silviculture, Department of Forestry Engineering, Dendrochronology and Climate Change, DendrodatLab-ERSAF, University of Cordoba, Campus de Rabanales, Crta. IV, km 396, E-14071 Córdoba, Spain
*
Author to whom correspondence should be addressed.
Submission received: 21 March 2021 / Revised: 10 May 2021 / Accepted: 12 May 2021 / Published: 21 May 2021

Abstract

:
Quantifying the impact of carbon (C) and timber prices on harvest scheduling and economic returns is essential to define strategies for the sustainable management of short-rotation plantations so that they can provide timber products and contribute to C sequestration. In this paper, we present a mixed-integer linear programming model that optimizes harvest scheduling at the forest level, C sequestration, and Net Present Value (NPV) over a planning period of up to 15 years. The model included revenue from the sale of timber (pulplogs) and credits from the net C sequestered during the life of the stands. In addition, plantation establishment, management, harvesting, and transportation costs were included in the analysis. The study area comprised 88 Eucalyptus grandis W. Hill and Eucalyptus dunnii Maiden stands located in Uruguay, totaling a forest area of nearly 1882 ha. The study investigated the impact of C and timber prices on NPV, harvest schedules, stands’ harvest age, timber flows to customers, and C sequestered per period. The maximum NPV among all the scenarios evaluated (USD 7.53 M) was calculated for a C price of 30 USD t−1, an interest rate of 6%, and a timber price of 75 USD m−3. This was USD 2.14 M higher than the scenario with the same parameters but that included only revenue from timber. C prices also impacted stands’ harvest age, C sequestration, and timber flows delivered to end customers. On average, in scenarios that included C prices, timber flows and C sequestration increased by 15.4 and 12.1%, respectively, when C price increased from 5 to 30 USD t−1. These results demonstrate that harvest scheduling, harvest age, and NPV are very sensitive to C and timber, and that the best economic returns are obtained when the stands are managed to maximize timber production and C sequestration.

1. Introduction

Forest ecosystems constitute the largest terrestrial carbon (C) pool in the global carbon cycle and represent one of the most significant sources to mitigate climate change effects [1]. The concentration of atmospheric carbon dioxide (CO2) has significant effects on tree growth and carbon accumulation in forest ecosystems [2]. Whether forest ecosystems sequestrate more carbon into ecosystems (carbon sinks) or release more carbon from ecosystems (carbon sources) depends on the net ecosystem carbon exchange. Forests have a significant impact on the concentration of CO2 in the atmosphere. As terrestrial ecosystems, forests act as C sinks, positively affecting the atmospheric CO2 balance [2]. Carbon storage in forest ecosystems includes numerous components but particularly biomass and soil [3]. Forest ecosystems cover about 4.1 billion hectares globally, with forest vegetation and soils containing about 1.240 Pg of C [4]. This accounts for 80% of aboveground terrestrial C and 70% of all organic soil [5,6], presenting a positive net C balance [3]. The ability of forest products to store C is temporary and depends on their service life. The shelf life of products can range from weeks for biofuels to centuries for structural wood. These account for about 5% (140 M ha) of the global forest area and help mitigate the effects of climate change by sequestering C [7].
Significant C stocks are also stored in forest plantations. Optimizing harvest schedules in short-rotation plantations can increase C sequestration, which can result in increased economic returns and better adaptation of trees to climate change. Thus, C pricing can play an essential role in generating an additional revenue source and promoting adaptive silviculture [8]. C pricing in planning models may modify harvesting activities over vast geographical areas and within a very long planning horizon [9]. Harvest levels vary in response to C pricing, resulting in higher carbon sequestration than those obtained from harvest levels obtained with classic planning models that do not include C stocks as a revenue source. Considering forest C in planning models leads to increased optimal rotations and makes harvest planning more challenging, which calls for quantitative solutions to optimize harvesting decisions [9].
Forest management involves complex decision-making with short- and long-term consequences. Forest planning at the strategical, tactical, and operational levels involves ecological, productive, and economic systems and their interaction [10,11]. This hierarchical planning approach seeks to increase the efficiency of the use, conservation, and protection of the forest resource, and ensure the sustainable and continuous supply of forest products and benefits, maintaining the economic and environmental potential of forests and their ecological functions [2]. Planning problems related to yield and distribution of timber from plantations to mills are complex to solve and are impacted by factors such as species, stand location, characteristics of the forest coupes and distances to mills, age structure, growth and yields curves, environmental conditions, and road network, among others [12,13]. This planning strategy is primarily concerned with medium-term decisions (typically 3 to 7 years in short-rotation plantations) at the tactical level (TL). Optimal resource allocation and volume of wood to harvest and deliver per period to end customers are usually determined using optimization-based commercial management systems [14]. In addition, spatial considerations such as maximum opening areas (the maximum area to be intervened during harvesting, e.g., in a clear-felling operation) and green-up constraints are also included in tactical planning models, aiming at generating feasible and sustainable solutions that cause minimum impacts on the environment [15].
Commercial forest plantations in Uruguay comprise over one million hectares; in 2018, 74,834 hectares of new Eucalyptus plantations were established, which accounted for 99% of the total planted area in that year [16]. Behind beef production, roundwood destined to kraft pulp production is the second-largest export product of Uruguay [17]. In 2018, it totaled a gross value of 2.2 billion USD, out of which forest cellulose pulp exports amounted to 1.7 billion USD [16]. In the last decade, timber production has increased substantially in Uruguay, with projections indicating that these levels will continue growing in the next decades. Dieste (2012) [18] estimated a high demand for pulpwood in the next 15 years, with an average production of about 10 million m3 per year. In Uruguay, commercial plantations include primarily Eucalyptus globulus Labill Authority, Eucalyptus dunnii Maiden, and Eucalyptus grandis W. Hill ex Maiden, with effective planted areas of 149,329, 191,035, and 235,620 ha, respectively [16]. These species have different mean annual increments (MAI), which is a consequence of the favorable site conditions and silvicultural management schemes applied to these plantations. In a previous study, Resquin et al. (2005) [19] recorded MAIs for E. grandis ranging between 32.8 to 55.8 m3 ha-y−1, while for E. globulus and E. dunnii, MAI reached 18.2 and 19.6 m3 ha-y−1, respectively. The roundwood harvested in E. grandis and E. dunnii stands is delivered to either pulp mills or sawmills (high-value logs), while the roundwood harvested in E. globulus stands supplies pulp mills only; in the latter case, average rotations in intensive silviculture stands occur at the age of eight years. Additionally, land price has been increasingly growing in Uruguay in the last decades, which has led forest growers to explore strategies to increase forest productivity and efficiency along the value chain (including harvesting and transport operations), and in this way, improve the competitiveness of the forest sector [20]. As part of the tactical plan and based on forest inventory data, forest companies usually prescribe short forest rotations, no longer than eight years, as a way to maximize yield per ha [12]. Traditionally, methods to determine optimal rotation or harvest ages have not been frequently employed in Eucalyptus plantations that are managed to produce roundwood for the pulp industry under operational-constrained scenarios [21]. However, this has been changing ultimately. Most forest growers are now considering determining optimal rotations for their stands to maximize economic returns and meet the growing demand for wood in the coming years.
The forest planning problem at the stand and forest level, based on both timber production and C sequestration, has been addressed previously by several authors [21,22,23]. C pricing can result in changes to the optimal stand rotation or harvest age, and consequently, to C stocks. This is because forest stands with longer rotation or harvest ages build up a larger volume of biomass and soil organic C than forests managed on shorter harvest cycles [24]. In Eucalyptus plantations in Australia, Enzinger and Jeffs (2000) [25] showed that the addition of C payments resulted in longer optimal rotation ages than scenarios where stands were managed for timber production only. As indicated by Asante et al. (2011) [24], the maximization of NPV for a single harvest cycle is a standard criterion for determining the optimal stand rotation and harvest age. NPV is maximized when the capital value of standing timber (the percentage by which the value of the forest is growing) is equal to the interest rate (IR), assuming flows of revenues and costs in just one harvest cycle and not accounting for these flows in subsequent cycles [26]. From an economic point of view, the optimal rotation age (optimization at the stand level) and harvest age (optimization at the forest level) of single stands at the tactical level is the one that maximizes NPV for a flow of revenues and costs throughout the planning period, subject to supply and operational constraints. This is opposed to the biological optimal rotation that is obtained when MAI is maximized, which excludes the flow of revenues and costs involved in growing the forest stands [27].
We hypothesize that C and timber prices have an impact on harvest scheduling, C sequestration, and economic returns (NPV) in industrial Eucalyptus plantations located in Uruguay. The objectives of the study were as follows: (i) formulate a mathematical model able to optimize the harvest of stands in Eucalyptus plantations, including timber (pulplogs) and C stocks as a source of revenue, (ii) assess the impact of C and timber prices on harvest age at the forest level and NPV, and (iii) assess the impact of C and timber prices on spatial solutions and flow of timber from stands to pulp mills. We expect that the results from this study will help forest growers in Uruguay get a better understanding of the impact of C and timber prices on harvest scheduling, orienting the management of Eucalyptus plantations in the context of a growing global demand for timber and C sequestration.

2. Materials and Methods

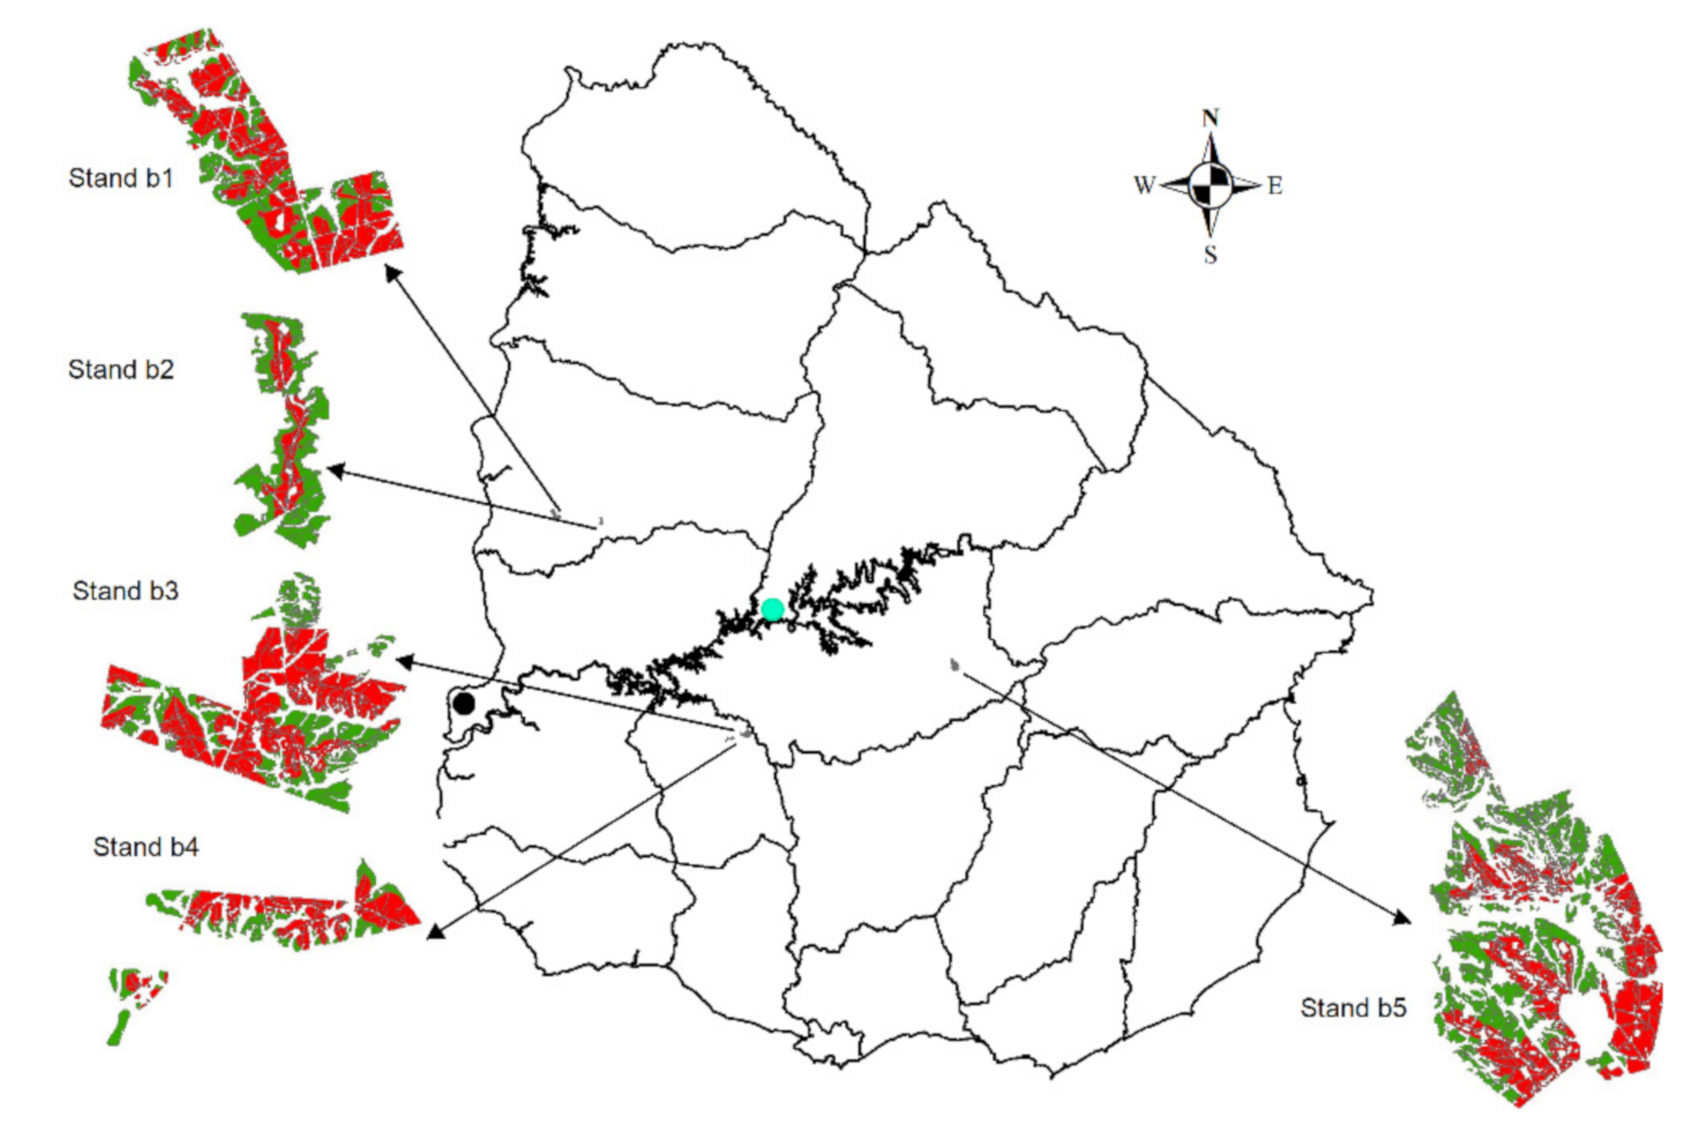
2.1. Study Location and Characteristics

The study area comprised about 1882 ha of Eucalyptus grandis and Eucalyptus dunnii plantations owned by Forestal Oriental SA in Uruguay. Figure 1 shows the five sites included in the study: sites b1 and b2 with 861 ha (43° 13′ 97″ S–64° 24′ 78″ W, hereafter Guichon); sites b3 and b4 with 870 ha (63° 07′ 44″ S–52° 22′ 64″ W, hereafter Trinidad), and site b5 with 717 ha (63° 44′ 33.05″ S–63° 95′58″ W, hereafter Sarandí del Yi). Climate is subtropical, with a mean annual temperature of 18 °C (12 °C in the coldest month, 24 °C in the warmest month) and a mean annual rainfall between 1300 and 1400 mm [28]. According to the National Commission for Agroeconomic Studies of the Land classification (CONEAT), the predominant soil in Guichon is planosols with a horizon A of 40–50 cm depth, characterized by low fertility, weak structure, low level of organic matter, slopes of 1–3%, sandy texture, medium to low risk of drought, imperfect drainage, moderately-slow to slow permeability, and good rooting ability. Soils in Trinidad are vertisols with a horizon A of 50–60 cm, and characterized by medium fertility, weak structure, medium level of organic matter, slopes of 2–5%, loam franc structure, low risk of drought, moderate drainage, moderately permeability, and good rooting ability. Soils in Sarandí del Yi correspond to vertisols, rupticos, and brunosols, with a horizon A of 50–60 cm depth and characterized by sandy-loam, loam franc texture, low fertility, low risk of erosion, moderate slopes (1–3%), weak structure, low organic matter, imperfect drainage, and good rooting capacity.

2.2. Stands Information

A forest inventory including a single 10-m fixed radius (314.16 m2) plot per ha was established in the study area. In each plot, measurements included diameter at breast height (1.3 m above ground level –DBH- cm, measured with a calliper Haglöf Mantax, Långsele, Sweden), stand density (N, trees ha−1), and basal area (G, m2 ha−1) of all trees with DBH ≥ 7 cm. Total height (H, m) was measured in the two central rows of the plots using a Vertex III hypsometer (Haglöf, Sweden); the height of the remaining trees was estimated using a logarithmic classic model (Table 1). As shown in the table, the stands were inventoried in real life when their ages ranged between 4.5 and 9.5. This information was used to project their growth from year 0 (plantation establishment) to year 10. For example, if a stand was inventoried in year 5, the data were used to project the state variables backward (from year 0 to year 5) and forward (from year 5 to year 10) through differential equations [29,30]. State variables projected included number of trees per hectare (N), basal area per hectare (G), quadratic mean diameter (dg), and mean arithmetic heights (Hm).

2.3. Carbon Sequestration and Release Assumptions

The process of photosynthesis permits green plants to uptake CO2 from the atmosphere and convert it into organic carbon as they grow, and in turn, organic carbon is converted back to CO2 when it is eaten or decomposed, which is known as the process of respiration [31]. In our study, the total C sequestered annually and stored in trees as organic C was computed following the procedure presented by Díaz and Rodríguez (2006) [21], and Toochi (2018) [31]. For this purpose, a basic density of 0.5 t m−3 was considered for both E. grandis and E. dunnii., as well as a C content coefficient of 0.5 (C content equal to 50% of the tree’s total volume). Thus, to calculate the C content of the species, a 0.25 conversion factor (wood density x proportion of C in the tree) was used. Only above ground carbon (AGC) was considered, assuming that in short-rotation plantations of Eucalyptus, the soil organic C does not have significant variations [30]. The aboveground biomass (AGB) required to calculate AGC was obtained using a compatible system of equations developed by Hirigoyen et al. (2020) [32] as functions of dg and Ho (Table 1). The rates of change in total AGB stocks were estimated by calculating the expected annual growth of the stand. Two cases were assessed considering the proportion of C released at harvest time and during the periods after the harvest. In the first case, it was assumed that 100% of the C stored is released at harvest time. In the second case, it was assumed that 50% of the C stored is released at harvest time, while the other 50% is stored after harvest as residues and paper products, and released linearly over the next 5 years after the final harvest [21].

2.4. Optimization Model

2.4.1. Model Description and Mathematical Formulation

To optimize harvest scheduling and stand harvest age, a mixed-integer linear programming model was developed to maximize the discounted net revenue (NPV) over a planning period of up to 15 years. Eucalyptus stands in Uruguay are usually managed for periods of up to 10 years, with a minimum harvest age of 7 years (periods); this was taken into consideration in our study by adding a constraint to the optimization model. The objective function included revenue from timber (pulp logs) and C sequestered in the stand each year until the harvest age. It also included costs associated with plantation establishment, weed control, fertilization, and pest control, as well as timber harvest and transport to two alternative pulp mills: Paso de Los Toros (hereafter P. Toros) and Fray Bentos (hereafter F. Bentos). In each period t, the revenue generated from timber sales as well as plantation, harvest (clearfelling), and transport costs were discounted at an interest rate IR. A discount factor per period was calculated assuming the flow of revenues and costs occurred at the midpoint (t-0.5) of the period. The yearly C sequestered by each stand, from establishment through harvest age, was accounted as a revenue source. Additionally, using similar approaches presented in previous studies [21,33], we calculated the value of the C released back to the atmosphere at harvest time and during the years after the harvest using the same C price as that used to quantify the revenue from C sequestration. Both C sequestered and released were discounted in the same way as the other revenues and costs
Sets, parameters, and variables of the optimization model are presented in Table 2. All costs, prices, and revenues in the manuscript are expressed in US dollars. The optimization, mixed-integer programming model can be expressed mathematically as follows:

Objective Function

The objective function maximizes the NPV over the planning period (Equation (1)):
M a x   N P V = R e v e n u e C o s t s
where,
R evenue =   RevenuePulpLogs + ValueCarbonSequestered
C o s t s = E s t a b l i s h m e n t C o s t + H a r v e s t i n g T r a n s p o r t C o s t s + V a l u e C a r b o n R e l e a s e d
To compute the discounted revenues and costs by period, a discount factor δt (Equation (4)) was used:
δ t = 1 ( 1 + IR ) t 1 / 2 t T
Revenue and cost equations
Equations (5) and (6) were used to compute the discounted revenue from the sale of pulplogs in the stands.
R e v e n u e P u l p L o g s = i R e v e n u e P L S t a n d i
R e v e n u e P L S t a n d i = j h P L D i j h * D P L * δ h i I
Equations (7)–(9) were used to compute the discounted revenue from the carbon sequestered in the stands.
V a l u e C S i h t = X i h * S e q C i t * C P * δ t i I ,   h H , t T |   t h
V a l u e C S S t a n d i = h t h V a l u e C S i h t i I  
V a l u e C a r b o n S e q u e s t e r e d = i V a l u e C S S t a n d i  
Equations (10) and (11) were used to compute the discounted costs associated with plantation establishment in the stands.
E C o s t S t a n d i = S P P C i + t W C F A i t * δ t i I
E s t a b l i s h m e n t C o s t = i E C o s t s S t a n d i  
Equations (12) and (13) were used to compute the discounted harvesting and transportation costs in the stands.
H T C o s t S t a n d i = j h [ ( P L D i j h * D S M i j * T C ) + ( H C i h * X i h ) ] * δ h i I  
H a r v e s t i n g T r a n s p o r t C o s t = i H T C o s t S t a n d i  
Several equations were used to compute the value of the C released at the harvest time. Equations (14) and (15) were used for the scenario where it was assumed that 100% of the C accumulated was released at the harvest time.
V a l u e C R S t a n d i = h X i h * A c c C i h * C P * δ h i I
V a l u e C a r b o n R e l e a s e d = i V a l u e C R S t a n d i
Likewise, Equations (16)–(19) were used for the scenario that assumed that 50% of the C accumulated was released at the harvest time, and the other 50% was released over the next 5 years after the harvest.
V a l u e C R S t a n d A i = h X i h * ( A c c C i h * 0.5 ) * C P * δ h i I
V a l u e C R i h t = X i h * ( A c c C i t * 0.1 ) * C P * δ t i I ,   h H , t T | h < t h + 5
V a l u e C R S t a n d B i = h h < t h + 5 V a l u e C R i h t I
V a l u e C a r b o n R e l e a s e d = i V a l u e C R S t a n d A i + Value C R S t a n d B i

Constraints

In addition, three groups of constraints were included in the model to ensure that (a) every stand was cut once within periods 7 to 10 (Equation (20)), (b) no stand could be harvested before period 7 (minimum age to harvest a stand) [12,18] (Equation (21)), and (c) the volume of timber delivered to the pulp mills did not exceed the volume available of these products in the stands (Equation (22)). A constraint in Equation (20) was included since trees harvested at an early age (≤ 6 years) produce wood with a very low pulp yield, and there is a decline in marginal growth when trees are harvested after period 10.
h H X i h = 1 i   I
p P X i p = 0 i   I
j J P L D i j h = X i h * A v a P L i h i   I   ,   h H

2.4.2. Data Input

The area of the 88 forest stands used for the analysis ranged between 5.5 and 54.3 ha (average = 21.9 ha). Site and stand variables for the stands at the beginning of the planning period are presented in Table 1. Parameters associated with C stocks were calculated as per the description provided in Section 2.3, while a range of C prices (from 0 to 30 USD t−1) was used for the analyses. These C prices correspond to the price per ton of organic C stored in trees resulting from CO2 sequestration. The carbon market of the European Union Emissions Trading System (https://sandbag.org.uk/carbon-price-viewer/ (accessed on 15 December 2020) was consulted to define the C prices used in the study.
For the analysis, the base scenario included an IR of 6%, a C price of 0 USD t−1, and a delivered price for pulp logs of 55 USD m−3. Unit harvesting costs ranged between 17 and 21 USD m−3 as a function of tree volume and harvesting age (periods 7, 8, 9, or 10), assuming a typical cut-to-length (CTL) system for Eucalyptus plantations in Uruguay [34]. The CTL system comprises one or more wheeled harvesters/processors that perform tree felling and stem processing tasks, followed by forwarders that extract the processed logs to the roadside. Based on previous studies [35], a single transport cost of 0.1 USD t-km−1 was used. Distances from stands to pulp mills were calculated with ArcGis 10.1 (ESRI, 2011); they ranged from 152 to 337 km (average of km) to F. Bentos pulp mill, and from 107 to 191 km (average of 157 km) to P. Toros pulp mill. In Uruguay, road transport is usually performed by 6-axis trucks with a gross vehicle mass of 48 tons and an average tare of 13 tons (net payload of approximately 33 tons).
In addition to harvesting and transport costs, the NPV calculation included costs associated with site preparation and plantation (year 0 at a cost of 800 USD ha−1) as well as weed control (periods 1 to 3 at a cost of 100 USD ha−1, and fertilization and ant control between periods 1 and 3 at a cost of 95 USD ha−1) [34].

2.4.3. Model Implementation

The optimization model was implemented using the IBM DocPlex library v. 2.19.202 (https://pypi.org/project/docplex/ (accessed on 15 December 2020), licensed under the Apache License v2.0 within the IBM Decision Optimization CPLEX Modeling for Python program. The model was run on a computer Dell Inspiron 5530 (Dell Inc., Texas, USA) equipped with an Intel® Core™ i7-8850H, 2.60GHz (6 cores) processing unit, and 32 Mb of RAM. The model script was coded using the PyCharm editor v.2020.3.3 (Professional Edition), and to facilitate the runs of the optimization model, a simple GUI was programmed with the PyQt5 Library (https://pypi.org/project/PyQt5/ (accessed on 15 December 2020). All the input data were imported from Excel and converted into Pandas data frames for later use in the optimization model. After each run, all the model outputs were exported back to Excel for further analysis.

2.4.4. Scenarios and Sensitivity Analysis

In total, 54 scenarios were assessed and their NVPs calculated and compared. These scenarios included the combinations of three IRs (6, 8, and 10%), three timber prices (55, 65, and 75 USD m−3), and six C prices (0, 5, 10, 15, 20, and 30 USD t−1), which were used to conduct the sensitivity analyses. The above scenarios were grouped into two classes to facilitate the analyses and comparisons:
  • Scenarios that included revenue only from the sale of timber (pulplogs) generated during clear-cut (SC1);
  • Scenarios that included revenue from both sources, timber generated during the clear-cut, and C sequestered over the rotation length of the stands (SC2).
Sets of outputs combining harvest periods (periods 7 to 10) and C prices included timber revenue and sequestered C and its revenue, along with harvest and transport costs to both pulp mills. The outputs also included the optimal harvest age (final cut) of each stand and the corresponding value of the objective function (NPV). All statistical analyses and summaries were performed in Python, using the NumPy and Pandas libraries. All statistically significant differences between scenarios were computed using a paired t-test (p ≤ 0.05). In addition, maps with the optimal spatial solutions were created using ArcGIS® software by Esri.

3. Results

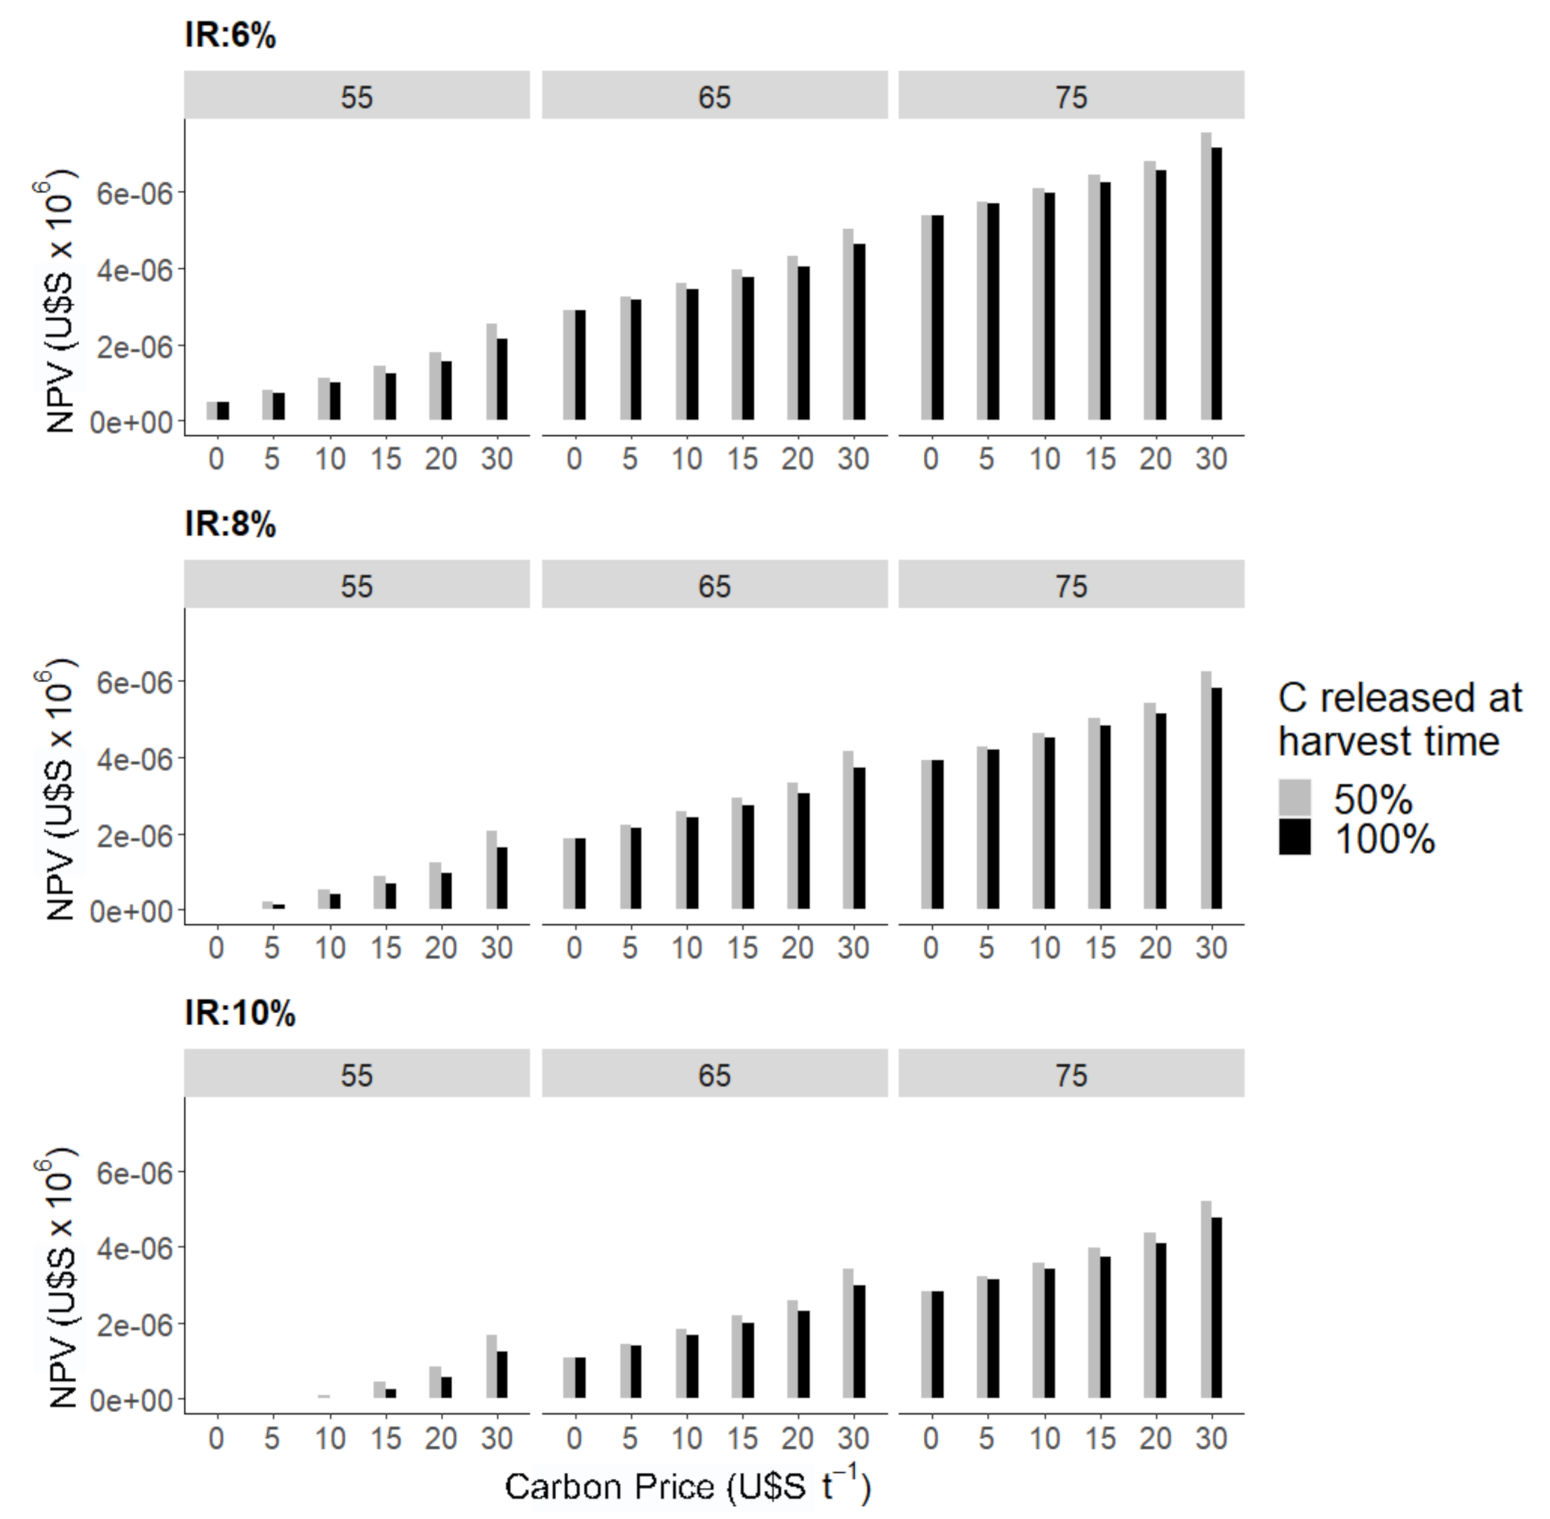
3.1. Effect of C and Timber Price, IR, and C Release Approach on NPV

Figure 2 shows the relationship between NPV and C price for the range of IRs, timber prices, and C release approaches (50 or 100% of C released at the harvest time) included in the study. As expected, in SC2 scenarios, NPV was sensitive to C prices and IR. There was a clear relationship between NPV and C price, with NPVs that, on average, increased at a rate of 0.55 (IR = 6%), 1.38 (IR = 8%), and 1.61 M USD (IR = 10%) for every 5 USD t−1 rise in C price. The maximum NPV among all the scenarios evaluated (2.52 M USD) was calculated for a C price of 30 USD t−1, an IR of 6% and a timber price of 75 USD m−3. In addition, there was a substantial reduction in NVP when the IR increased from 6 to 10%. For example, for a C price of 15 USD t−1, a timber price of 65 USD m−3, and a 100% C release approach, the NVP was 3.75, 2.73, and 1.99 M USD for an IR of 6, 8, and 10%, respectively. The differences in NPV between the three IRs were statistically significant at p ≤ 0.05. For SC2 scenarios that included an IR of 8 and 10%, and a timber price of 55 USD t−1, NPVs became positive only after a minimum C price. For an IR of 8%, this minimum C price was 5 USD m−3 irrespective of the C release approach being used. For an IR of 10%, the minimum price was 10 USD m−3 for a 50% C release approach, and 15 USD m−3 for a 100% C release approach.
On average, using a 50% C release approach resulted in NPVs that were 8 (IR = 6%), 28 (IR = 8%), and 33% (IR = 10%) higher than using a 100% C release approach. These differences were statistically significant at p ≤ 0.05, excepting for IR between 8 and 10%. It is worth noting that differences in NPV between the 50 and the 100% C release approaches occurred in SC2 scenarios only, since in SC1 scenarios all the revenue was obtained solely from the sale of timber. The largest difference in NPV between the two C release approaches was obtained for a C price of 30 USD t−1. At this C price and a timber price of 65 USD m−3, the differences were 0.39, 0.43, and 0.43 M USD, for an IR of 6, 8, and 10%, respectively.

3.2. Effect of C Price and Timber Price, IR, and C Release Approach on Revenue

The impact of C price on revenue is presented in Table 3, considering a timber price of 65 USD m−3, and a 50% C release approach. The results are broken down by IR, total revenue, revenue from C, and revenue from timber. As expected, total revenues increased with higher C prices and lower IRs. The minimum revenue (11.3 M USD) was obtained in an SC1 scenario with an IR of 10%, where 100% of the revenue resulted from the sale of timber. On the contrary, the maximum revenue (23.1 M USD) was obtained in an SC2 scenario with an IR of 6%, where 70% of the revenue resulted from the sale of timber and 30% from C credits.
Since prices were considerably higher for timber than for C credits, regardless of C price and IR, the revenue from timber in SC2 was always higher than the revenue from C credits. The largest gap (88% difference of contribution to total revenue or 15.1 M USD) between revenue from timber and revenue from C credits was obtained for a C price of 5 USD t−1 and an IR of 6%. In contrast, the smallest gap (28% difference of contribution to total revenue or 7.7 M USD) was obtained for a C price of 30 USD t−1 and an IR of 10%. The highest proportional contribution to revenue from C credits was 34% for an IR of 10% and a C price of 30 USD t−1, whereas the highest monetary contribution was 6.8 M USD and occurred for the same C price and an IR of 6%. Irrespective of the C price and IR, the contribution of C credits to total revenue ranged between 6–7% and 30–34%. In addition, there was a notable variation in the revenue attributed to C credits and timber. Thus, the coefficient of variation for C revenue was 74.7 (IR = 6%), 76.7 (IR = 8%), and 77.1% (IR = 10%), whereas the variation for timber revenue was only 0.5 (IR = 6%), 1.5 (IR = 8%), and 0.6% (IR = 10%), which reflects the impact of C prices on this variation.

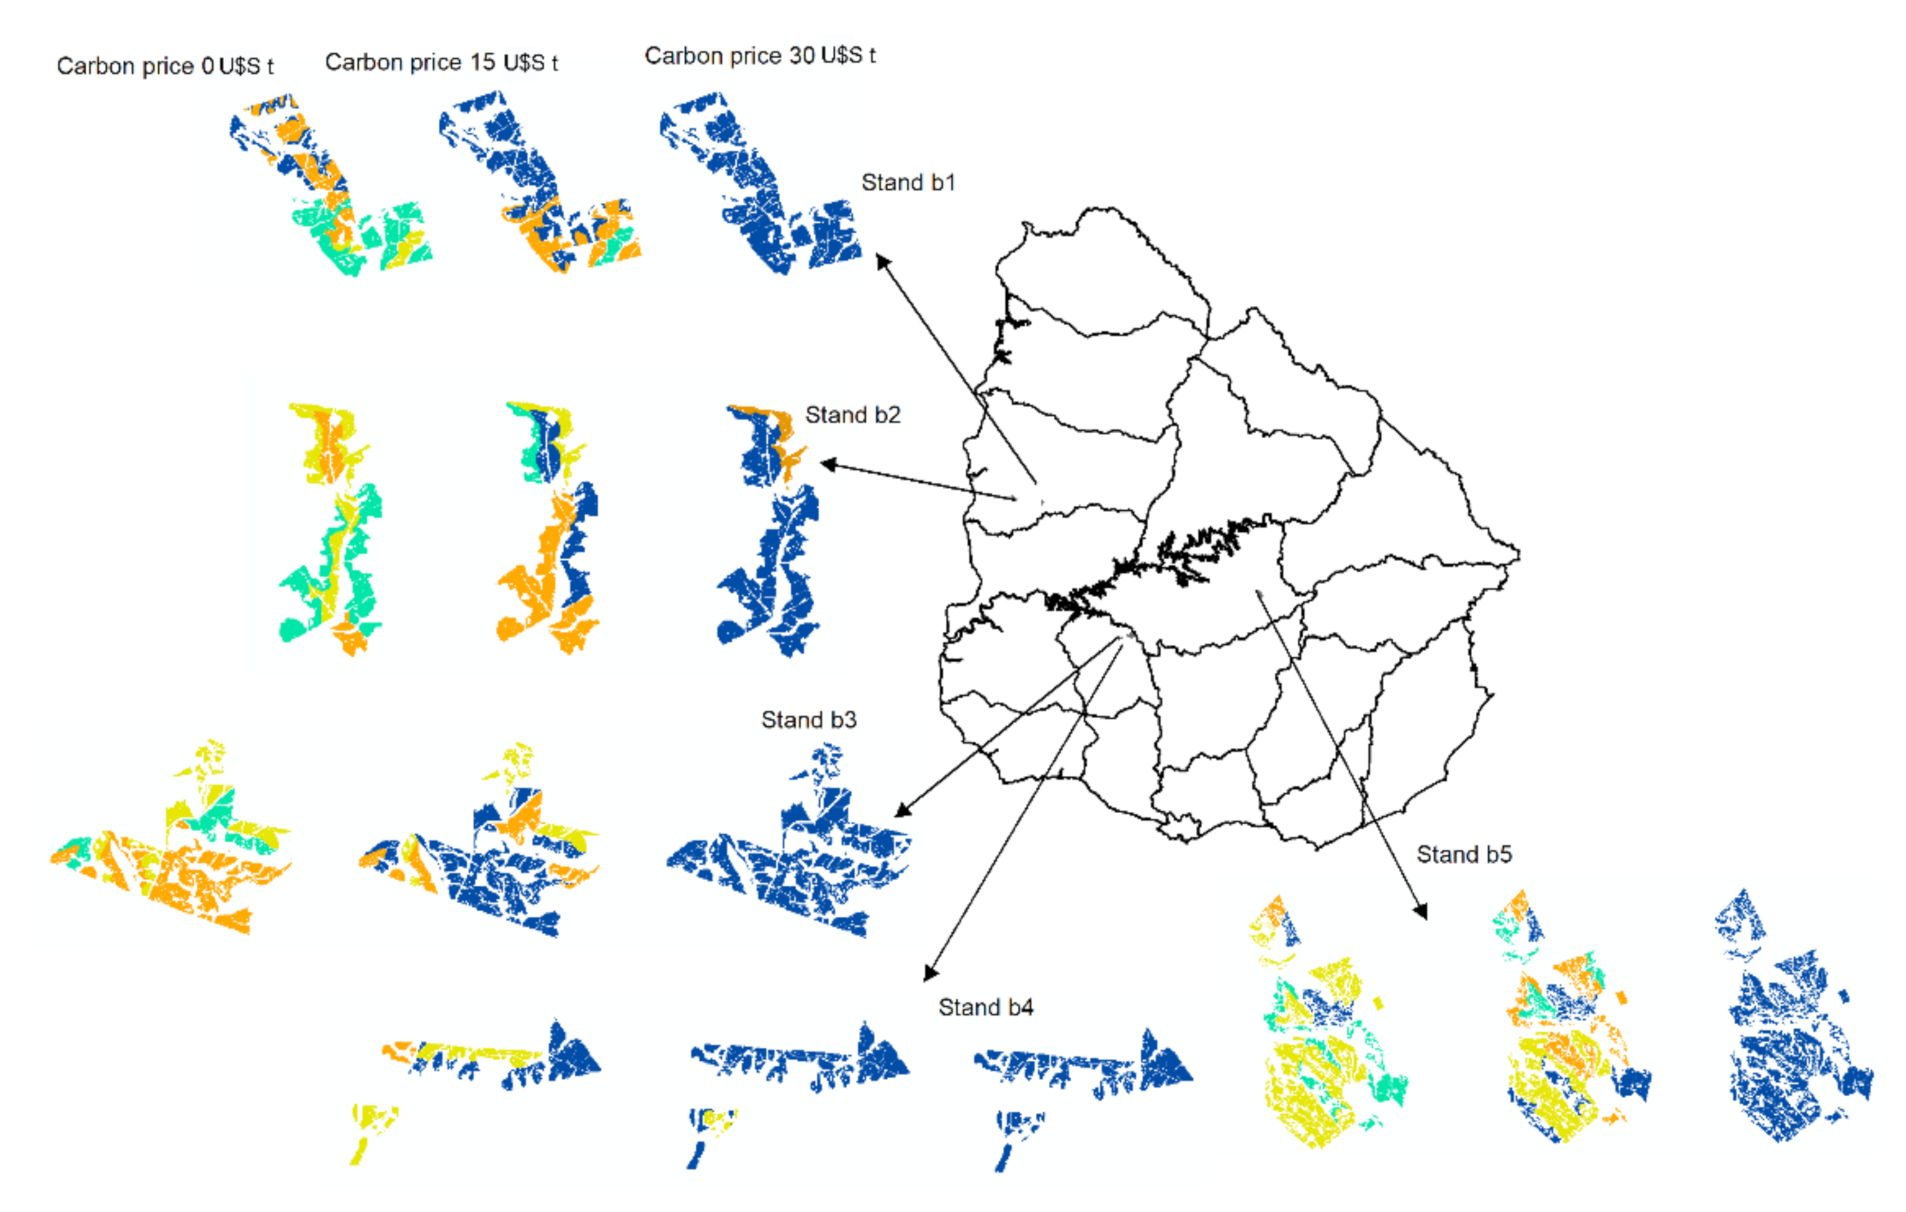
3.3. Effect of C Price on Harvest Scheduling (Harvest Age) and Volume Harvested (Supplied) Per Period

Table 4 presents the volume harvested (m3) by harvest age, C price, and IR. Irrespective of the IR, in SC2 scenarios, the number of stands being harvested in period 10 grew gradually as C prices passed from 5 to 30 USD t−1, which resulted in higher volumes of timber being harvested and delivered to customers during this period. For example, for a C price of 30 USD t−1 and an IR of 6, 8, and 10%, the proportion of stands being harvested in period 10 was 100 (88 stands), 99 (87 stands), and 75% (66 stands), respectively. From Table 4, it is observed that harvest ages commenced declining when IR passed from 6 to 8 and 10%, which resulted in more stands being harvested (and a higher volume of timber delivered) in periods 7, 8, and 9. On the contrary, for a C price of 0 USD t−1 (SC1 scenarios) and an IR of 8 or 10%, the largest proportion of the stands were harvested in period 7 (minimum harvest age). In SC1 scenarios, due to the absence of revenue from C credits, a larger proportion of the stands was harvested in periods 7 and 8, particularly when the IR was 8 or 10%. The most notable case was that with an IR of 10%, where 44% of the stands (39 out of 88) were harvested in period 7. Harvest ages also had an impact on the total volume being harvested across the planning periods. Thus, for example, in SC2 scenarios with a C price of 30 USD t−1, a timber price of 65 USD m−3, and an IR of 6, 8, and 10%, the total volume harvested in all periods was 435,830, 435,372, and 417,993 m3, respectively. As a comparison, in SC1 scenarios (C price = 0 USD t−1), the volume harvested in all periods was only 411,592, 367,740, and 356,882 m3 for an IR of 6, 8, and 10%, respectively.
The spatial distribution of the stands being harvested per period (Figure 3) was impacted by harvest age, C and timber prices, and IR. Spatially arranged harvest of stands aimed to minimize harvest and transport costs, and maximize returns from timber and C, thereby maximizing NPV. This also had an impact on the flow of timber being delivered from stands to customers (Figure 4). In the case of SC2 scenarios, the peak flow of timber from stands to P. Toros pulp mill occurred at longer harvest ages when C price increased from 5 to 30 USD t−1, reaching a maximum volume (174,289 m3) in period 10 when C price equaled 30 USD t−1. On the contrary, in SC1 scenarios, the maximum flow of timber to P. Toros pulp mill occurred during periods 7 and 8, reaching a maximum of 73,807 m3 in year 8. Regarding timber flows to F. Bentos pulp mill in SC2 scenarios, maximum volumes of 96,529, 129,289, 138,632, 186,163, and 255,142 m3, were obtained in year 10 for C prices of 5, 10, 15, 20, and 30 USD t−1, respectively. In SC1 scenarios, the maximum volume delivered to F. Bentos pulp mill (78,889 m3) was obtained in period 9. In all scenarios that included a C price lower than or equal to 15 USD t−1, there was a positive volume of timber delivered to F. Bentos pulp mill. For scenarios that included a C price of 20 USD t−1, there was no timber flow to F. Bento from coupes being harvested in period 8. The same occurred in periods 7, 8, and 9 for a C price of 30 USD t−1. At this C price, no timber was delivered to any pulp mills since no forest stands were harvested in these periods.

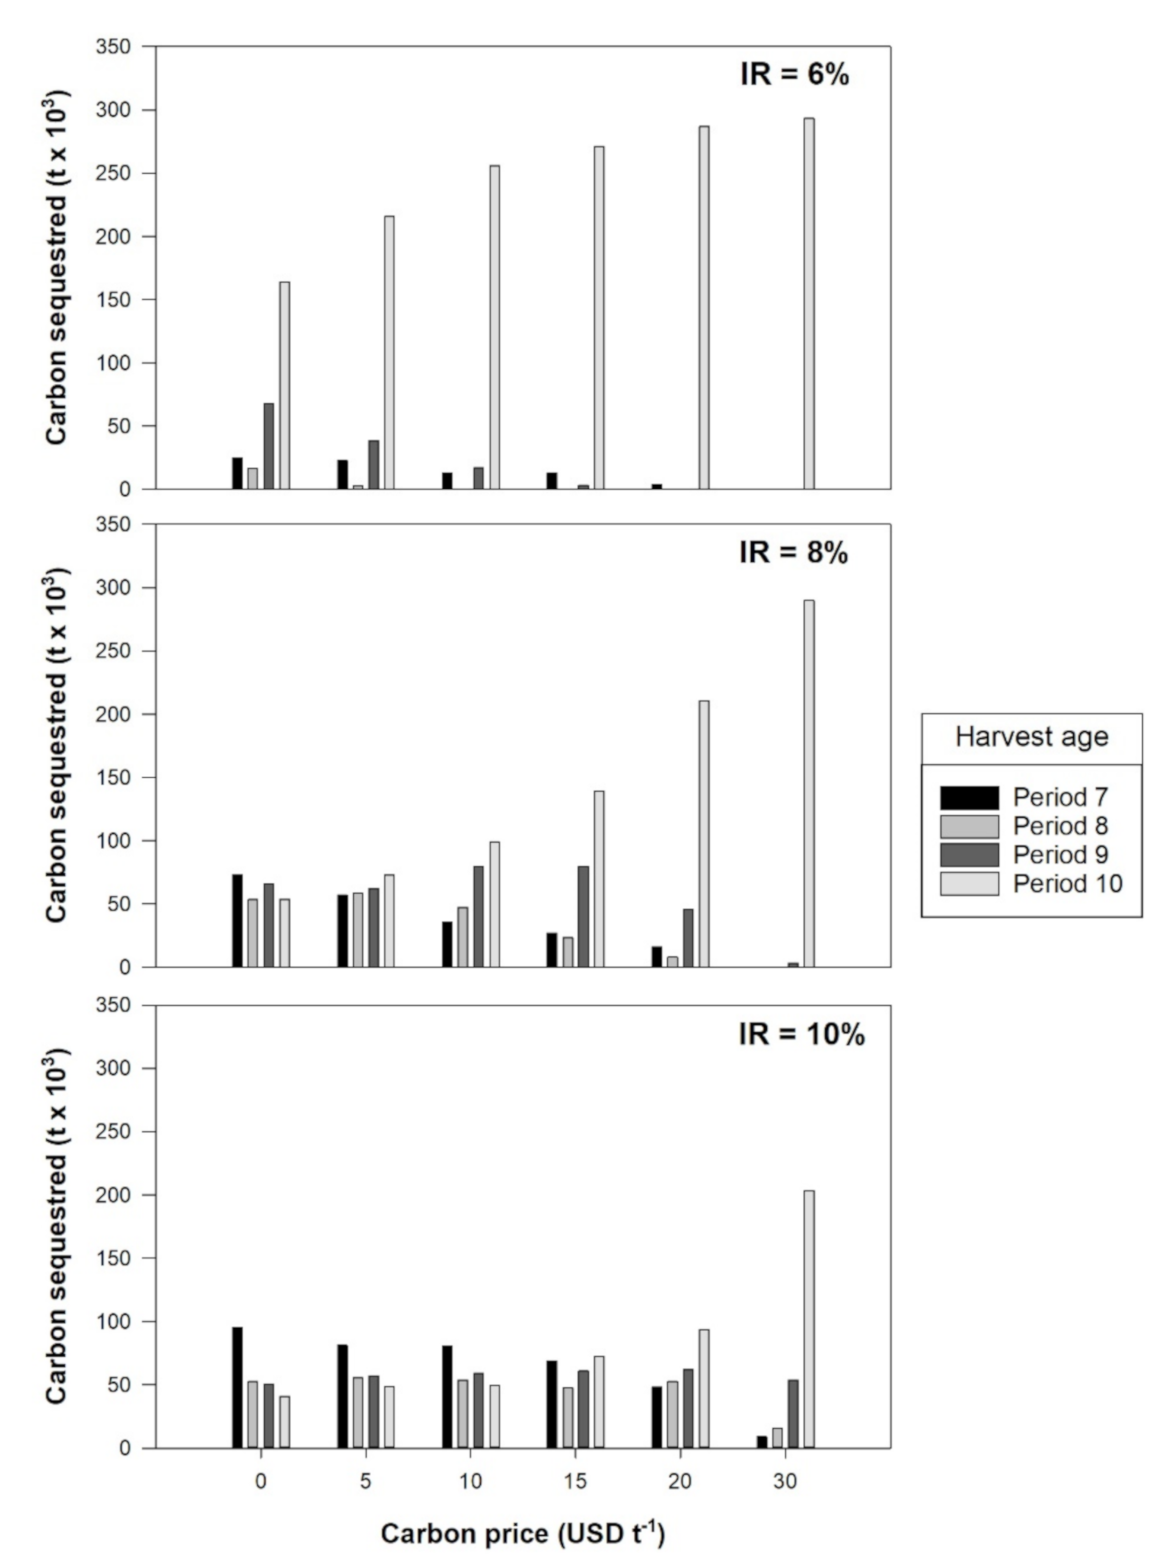
3.4. Effect of Carbon Price and IR on Carbon Sequestered

As observed in Figure 5, both the total and per period C sequestered were shown to be very sensitive to C prices, and highly affected by the harvest age. In all scenarios, the maximum amount of C sequestered occurred in period 10 for a C price of 30 USD t−1. At this C price, most stands were harvested in period 10 to maximize revenue from C credits; amounts of C sequestered totaled 293,196 t for an IR of 6%, 289,196 t for an IR of 8%, and 203,586 t for an IR of 10%. The amount of C sequestered in period 10 declined with lower C prices, which was more evident in scenarios with an IR of 8 and 10%. In the latter case, the C sequestered dropped by 53.9% when C price was reduced from 30 to 20 USD t−1. With an IR of 6%, the C sequestered declined gradually when C price was reduced from 30 to 0 USD t−1. Likewise, when passing from 30 to 10 USD t−1, the drop in C sequestered occurred at an average rate of 9295 t per every 5 USD t−1 reduction in C price, while when passing from 10 to 0 USD t−1, the drop was about 46,145 t per every 5 USD t−1 reduction in C sequestered.
For C prices lower than 30 USD t−1, the amount of C sequestered in periods 7, 8, and 9 showed a gradual increase when IR passed from 6 to 10%. Thus, for an IR of 6%, the average amount of C sequestered in periods 7, 8, and 9 was 15,590, 3892, and 25,310 t, respectively. Likewise, for an IR of 8%, the average amount of C sequestered in periods 7, 8, and 9 was 41,785, 38,159, and 66,703 t, respectively. Finally, for an IR of 10%, the average amount of C sequestered in periods 7, 8, and 9 was 74,909, 52,326, and 57,959 t, respectively. The above results show clearly that the optimization model aimed to maximize C sequestration at higher C prices and the production of timber at lower C prices.

4. Discussion

The results obtained in this study show that paying for C sequestered can increase economic returns in short-rotation plantations depending on C and timber, as well as logging and market conditions. However, the implementation of forest planning that includes C sequestration as a source of revenue in Eucalyptus plantations requires regulatory changes at the international and national level [36]. Optimizing harvest schedules and harvest age of stands considering C and timber prices is key to maximize the use of the forestry resources that are subject to intensive silviculture schemes [8]. The results show that NPVs were quite sensitive to the range of C prices evaluated in the study. For any C price, adding up the revenue from C credits and the sale of timber gave the best economic returns. High C prices increased the proportional contribution of C credits to NPV and reduced the contribution of timber, as found in previous studies [8,9,10,37]. Growth rates were used to compute C sequestered and stored in aboveground biomass, and a sensitivity analysis was conducted to quantify the effect of IR as well as C and timber prices on NVP and optimal harvest scheduling (including stands’ harvest age). Following similar approaches to those from previous studies [21,33], gross revenue in each stand was computed from the sale of timber as well as from credits associated with C sequestration due to forest growth. In addition, C released at the harvest time and costs associated with the management of the stands were used to quantify NPV. Taking all these considerations into account, our optimization modeling approach proved to be a practical and effective method to determine the impact of C and timber prices on harvest scheduling and economic returns in Eucalyptus short-rotation plantations.
The harvest schedule provided by our solution approach maximized the revenue from timber and C sequestration in each stand. This plan was generated by using a mathematical programming model that optimized harvest scheduling between periods 7 and 10, and which served as the basis to program new plantations. As confirmed in our study, optimal planning models are critical to maximize the economic and silvicultural outcomes of forest management plans [33,38]. Additionally, determining optimal harvesting scheduling and harvest age, including multiple products and services from forest ecosystems, is essential for implementing sustainable forest management strategies [39]. The production of Eucalyptus in Uruguay, however, has a clear orientation for pulp, so other products were not contemplated in our study (e.g., sawn wood), since no markets exist for these products in the country. Optimal biological rotations are dictated by the annual rate of C accumulation in tree biomass. For example, for short-rotation Eucalyptus plantations in subtropical China, Zhou et al. [40], showed that the marginal annual rate of C accumulation increased from year 4 to year 10, and sharply decreased from year 13 to year 21, suggesting optimal rotations between 12 and 15 years. However, economic and biological optimal rotations determined at the stand level usually differ from harvest ages determined at the forest level, since the former is driven by several operational constraints and affected by management costs and the prices of multiple products, such as C and timber.
Regarding economic optimal rotations, Diaz-Balteiro and Rodríguez (2006) [21], developed several models using dynamic programming to calculate the optimal rotation for intensive Eucalyptus plantations in Spain and Brazil. Their solution approach did not include operational constraints as we did in our study, but it focused primarily on determining the economic rotation age at the stand level using the Land Expectation Value. Regardless of the solution approach, when including the combined revenue from timber and C sequestration, the rotation or harvest age tends to increase when C prices are high, as reported by various authors [33,37,38]; this, however, will depend on the annual rate of C sequestration. In our study, the annual rate of C sequestered increased continuously until period 10, which was set as the maximum harvest age for any stand in the plantation estate. In addition to annual rates of C sequestered, harvest ages were determined by the ratio between timber (pulplogs) and C prices. Thus, the impact of C revenue on NPV was more pronounced when C prices were high and exceeded that of pulplogs; this resulted in longer optimal harvest ages when C prices were higher and shorter optimal harvest ages when C prices were lower. IR also had an impact on the harvest age of the stands. Thus, there was a larger proportion of stands with longer harvest ages when the IR was 6% and a lower proportion when the IR was 8 or 10%. Historically, a harvest age of 8 years has been adopted by most forester growing pulp-oriented Eucalyptus plantations in Uruguay, based primarily on MAIs figures reported in previous studies [41]. The results presented in our study show that harvest ages can range between 7 and 10 years without impacting financial returns and C sequestration. However, the impact of shorter rotations (<7 years) must be further investigated since it might have negative implications on timber supply and economic returns. Additionally, in a context where forests are one of the most important carbon sinks to mitigate climate change, a substantial reduction in the optimal harvest age may impact their C sequestration capacity [42,43]. Hence, it is essential to monitor and accurately predict and quantify changes of C stocks with the assistance of local models [44] and remote sensing technologies [38].
C pricing can be used as a political and planning tool. For example, in a study that involved forests being managed to maximize discounted revenue from both timber production and C, Pukkala (2020) [9] reported that if 100 EUR t−1 of C were paid to forest land owners every 100 years, the C sequestration of Finnish forests would increase by 70% (nearly the maximum increase obtained by subsides). Although these results are consistent with our findings, some slight differences were observed. These can be attributed to the range of forest products (multiple timber products in the case of Pukkala’s study, and a single timber product in the case of our study) and C prices. In the case of our study, discounted returns obtained primarily from the sale of timber when C prices were lower than or equal to 15 USD t−1, and from C sequestration when C prices were higher than 15 USD t−1. The high volatility of prices in the C market might be associated with uncertain C revenues, so this should be an important variable to be factored into the economic analysis of intensive silviculture strategies [39,40].
Our results reveal that the spatial arrangement and number of stands to be harvested in each period were sensitive to C prices. With low C prices (0 and 5 USD t−1), the model aimed to maximize NPV and returns from the sale of timber, which resulted in the harvesting of a large proportion of stands in periods 7 and 8; these stands were associated with lower harvesting and transport costs due to their yield per ha and distance to the pulp mills. On the contrary, with high C prices (20 and 30 USD t−1), the model aimed to maximize NPV and returns from C sequestration, which resulted in longer harvest ages (9 and 10 years) and in a large proportion of stands that reached high yields per ha in these periods.
Globally, forest planners are concerned with the sustainability of planted forests. Strategies to increase C sequestration are under consideration by many forest owners and government agencies in their forest management and logging plans [8]. Linear programming economic models of forest management that include C sequestration in intensive Eucalyptus plantations are a powerful tool to optimize their role for climate change mitigation [45]. These optimization-based solution techniques are essential to quantify the economic value and potential contribution of natural forest and plantations to climate change based on integrated returns obtained from multiple ecosystem services and forest products [46]. Silviculture geared to maximize C sequestration promotes the growth and conservation of standing biomass stocks, either by modifying the standard forest management strategies or by optimizing the rotation age [47]. In addition, these goals are achieved through the assessment and control of different silvicultural schemes, including optimal thinning and harvesting strategies, promotion of agroforestry systems, and diversification of forest uses that provide multiple ecosystems services and increase the value of the forests [48].
As far as we know, our optimal modeling proposal is the first effort in assessing the incorporation of C sequestration into forest management plans of Eucalyptus plantations in Uruguay. However, we are aware of some of the limitations of our study. Firstly, the data were collected from clonal trees in three regions in Uruguay for the two most common Eucalyptus species, plus geographical conditions, proximity to pulp mills, harvesting technology, and market conditions may affect the impact of C prices on harvesting plans and NPV. It is expected that expanding the number of forest sites and other genetic sources might overcome these limitations. Secondly, our analysis did not include decisions on initial stocking or the possibility of thinning. Of course, these decisions can be included in future studies to be able to assess their impact on C storage strategies in low-yield plantations. Additionally, our research focused primarily on investigating how C and timber prices impact harvest scheduling (harvest age) and NPV; the assessment quantified C sequestration and storage in each period, and C released at the end of the planning period. It is worth pointing out that since there is no formal C market for plantations in Uruguay, we used a rather conservative range of C prices (from 0–30 USD t−1) to analyze the potential impact that this parameter could have on the harvest age, harvest scheduling, and NPV, based on similar articles found in the literature. Additionally, due to the absence of applicable legal mechanisms for C crediting and payment in Uruguay, these models have limited use in the current scenario. On the other hand, our analysis focused more on highlighting the impact of C pricing on forestry planning (space and time) and its importance to Eucalyptus plantation afforestation rather than on comparing payment mechanisms (subsidies and taxes). The optimization model developed and presented in our study is deterministic and generates the same outcomes under a set of initial conditions and value of the parameters (e.g., timber and C prices, C accounting). We are aware of the limitations of this approach, and given the role attributed to forests in climate change policy and in view of potential future policy discussions, it is important to verify and quantify the potential of forest carbon sequestration in the presence of uncertainty [49]. Future research should test and implement alternative solution approaches (e.g., stochastic programming, robust optimization, etc.) that can deal with uncertainty in C sequestration projects, since forest management decisions under uncertainty could deviate from those made with the assistance of deterministic models. In addition, our analysis did not consider the impact of logging and transportation operations on C emissions. However, previous studies have shown that their contribution is small compared to the C contained in wood and biomass products, with ratios of about 40:1 and 45:1 for roundwood and biomass, respectively [50]. According to previous reports, other variables included in the study will also influence forest management and C storage strategies, including IRs, growth rates, and prices of sawn wood and biomass. Our analysis included a limited range of prices and costs, and their fluctuation may affect decisions related to C storage.
Management alternatives, such as silvopastoralism or forest plantations destined for solid wood, were not included. The accumulation and flux of C from these forest management alternatives may be different from those computed in our study. Biomass was not included in our analyses, since in Uruguay, a common practice is to leave the logging debris on site to mitigate the impact of the harvest equipment on the soil.

5. Conclusions

Sustainable forest management strategies that allow the provision of multiple timber products and enhance C sequestration require the assessment of scenarios to quantify the impact of carbon (C) and timber prices on harvest scheduling and optimal harvest age. Our results show that mixed-integer linear programming is a practical and effective tool for developing optimal forest management plans in short-rotation Eucalyptus plantations. These management plans must be designed and implemented with the assistance of accurate field data, remote sensing tools (e.g., LiDAR) and growth estimation models. The results of our study in Uruguay suggest that high C prices (>10 USD t−1) can result in longer harvest ages, as well as increased timber flows to customers, C sequestration, and economic returns in Eucalyptus stands. Our results also demonstrate that harvest scheduling, harvest age, and NPV are very sensitive to C and timber prices, and that the best economic returns are obtained when the stands are managed to maximize timber production and C sequestration.

Author Contributions

Conceptualization, A.H., M.A., and R.N.-C.; methodology, A.H., M.A., and R.N.-C.; formal analysis, A.H., M.A, and C.R.-C.; investigation, A.H., M.A., R.N.-C., and C.R.-C.; writing—original draft preparation, A.H., M.A., and R.N.-C.; writing—review and editing, C.R.-C. and J.F.; supervision, R.N.-C. and J.F. All authors have read and agreed to the published version of the manuscript.

Funding

This research received no external funding.

Acknowledgments

The authors thank the Instituto Nacional de Investigaciones Agropecuarias (INIA-Uruguay) for supporting our research work, for help during the fieldwork, and the INIA Scholarship for PhD studies. We are particularly grateful for the support of Leonidas Carrasco Letelier, Roberto Scoz (INIA), Pablo Rodriguez, Carola Odonne, and Juan Carlos de Mello (FOSA). We acknowledge the institutional support of the University of Cordoba-Campus de Excelencia CEIA3.

Conflicts of Interest

The authors declare no conflict of interest.

References

  1. Nunes, L.J.R.; Meireles, C.I.R.; Gomes, C.J.P.; Ribeiro, N.M.C.A. Forest management and climate change mitigation: A review on carbon cycle flow models for the sustainability of resources. Sustainability 2019, 11, 5276. [Google Scholar] [CrossRef] [Green Version]
  2. Kuzminyh, Y.V.; Gryaznov, S.E.; Shaitarova, O.E.; Sukonkin, S.E.; Yu Abakulina, L. Forestry Development as An Instrument for Implementing the Climate Policy of Russia. In Proceedings of the IOP Conference Series: Earth and Environmental Science, Saint Petersburg, Russia, 16–18 June 2020; Volume 574. [Google Scholar]
  3. Lal, R. Forest soils and carbon sequestration. For. Ecol. Manag. 2005, 220, 242–258. [Google Scholar] [CrossRef]
  4. Dixon, R.K.; Wisniewski, J. Global forest systems: An uncertain response to atmospheric pollutants and global climate change? Water Air Soil Pollut. 1995, 85, 101–110. [Google Scholar] [CrossRef]
  5. Dixon, R.K.; Brown, S.; Houghton, R.A.; Solomon, A.M.; Trexler, M.C.; Wisniewski, J. Carbon pools and flux of global forest ecosystems. Science 1994, 263, 185–190. [Google Scholar] [CrossRef] [PubMed]
  6. Hui, D.; Deng, Q.; Tian, H.; Luo, Y. Climate change and carbon sequestration in forest ecosystems. Handb. Clim. Chang. Mitig. Adapt. 2017, 555, 594. [Google Scholar]
  7. Braakhekke, M.C.; Doelman, J.C.; Baas, P.; Müller, C.; Schaphoff, S.; Stehfest, E.; Van Vuuren, D.P. Modeling forest plantations for carbon uptake with the LPJmL dynamic global vegetation model. Earth Syst. Dyn. 2019, 10, 617–630. [Google Scholar] [CrossRef] [Green Version]
  8. Acuna, M.; Ma Navarro-Cerrillo, R.; Ruiz-Gómez, F.; Lara-Gómez, M.; Pérez-Romero, J.; Varo-Martínez, M.Á.; Palacios-Rodríguez, G. How does carbon pricing impact optimal thinning schedules and net present value in Mediterranean pine plantations? For. Ecol. Manag. 2021, 482, 118847. [Google Scholar] [CrossRef]
  9. Pukkala, T. At what carbon price forest cutting should stop. J. For. Res. 2020, 31, 713–727. [Google Scholar] [CrossRef] [Green Version]
  10. Broz, D.; Durand, G.; Rossit, D.; Tohmé, F.; Frutos, M. Strategic planning in a forest supply chain: A multigoal and multiproduct approach. Can. J. For. Res. 2017, 47, 297–307. [Google Scholar] [CrossRef]
  11. Weintraub, A.; Romero, C. Operations research models and the management of agricultural and forestry resources: A review and comparison. Interfaces 2006, 36, 446–457. [Google Scholar] [CrossRef]
  12. Viana Céspedes, V. Optimizacion en la Planificacion de Servicios de Cosecha Forestall. Master’s Thesis, Universidad de la República, Magíster en Investigación de Operaciones, Montevideo, Uruguay, 2018. [Google Scholar]
  13. Acuna, M.; Sessions, J.; Zamora, R.; Boston, K.; Brown, M.; Ghaffariyan, M.R. Methods to Manage and Optimize Forest Biomass Supply Chains: A Review. Curr. For. Rep. 2019, 5, 124–141. [Google Scholar] [CrossRef]
  14. Pohjanmies, T.; Eyvindson, K.; Mönkkönen, M. Forest management optimization across spatial scales to reconcile economic and conservation objectives. PLoS ONE 2019, 14, e0218213. [Google Scholar] [CrossRef]
  15. Shan, Y.; Bettinger, P.; Cieszewski, C.J.; Li, R.T. Trends in spatial forest planning. Math. Comput. For. Nat.-Resour. Sci. 2009, 1, 86–112. [Google Scholar]
  16. MGAP (Ministerio de Ganadería Agricultura y Pesca); DIEA (Dirección de Estadísticas Agropecuarias). Anuario Estadístico Agropecuario 2019; Editorial Hemisferio Sur: Montevideo, Uruguay, 2019. [Google Scholar]
  17. Instituto Uruguay XXI Informe Anual de Comercio Exterior; Uruguay XXI: Montevideo, Uruguay, 2019. [CrossRef]
  18. Dieste, A. Programa de Promoción de Exportaciones de Productos de Madera. DNIMIEM-CSFM En. 2012. Available online: http://gp.gub.uy/es/node/860 (accessed on 26 December 2020).
  19. Resquin, F.; De Mello, J.; Fariña, I.; Mieres, J.; Assandri, L. Caracterización de la Celulosa de Especies del Género Eucalyptus Plantadas en Uruguay; Serie Técnica N 152; INIA: Montevideo, Uruguay, 2005; p. 82. [Google Scholar]
  20. Andreoni, M.I.; Bussoni, A. Evaluación económica de dos programas de mejoramiento genético en Eucalyptus grandis/Economic Assessment of Two Breeding Programs in Eucalyptus grandis. Agrocienc. Urug. 2014, 18, 153. [Google Scholar]
  21. Diaz-Balteiro, L.; Rodriguez, L.C.E. Optimal rotations on Eucalyptus plantations including carbon sequestration—A comparison of results in Brazil and Spain. For. Ecol. Manag. 2006, 229, 247–258. [Google Scholar] [CrossRef]
  22. Raymer, A.K.; Gobakken, T.; Solberg, B. Optimal forest management with carbon benefits included. Silva Fenn. 2011, 45, 395–414. [Google Scholar] [CrossRef] [Green Version]
  23. Quintero-Mendez, M.A.; Jerez-Rico, M. Heuristic forest planning model for optimizing timber production and carbon sequestration in teak plantations. iForest 2016, 10, 430–439. [Google Scholar] [CrossRef] [Green Version]
  24. Asante, P.; Armstrong, G.W.; Adamowicz, W.L. Carbon sequestration and the optimal forest harvest decision: A dynamic programming approach considering biomass and dead organic matter. J. For. Econ. 2011, 17, 3–17. [Google Scholar] [CrossRef]
  25. Enzinger, S.; Jeffs, C. Economics of forests as carbon sinks: An Australian perspective. J. For. Econ. 2000, 6, 227–249. [Google Scholar]
  26. Asante, P. Carbon Sequestration and the Optimal Economic Harvest Decision by Patrick Asante A Thesis Submitted to the Faculty of Graduate Studies and Research in Partial Fulfillment of the Requirements for the Degree of Doctor of Philosophy in Forest Biology and Man. Ph.D. Thesis, University of Alberta, Edmonton, AB, Canada, 2011. [Google Scholar]
  27. Loza-Balbuena, I. Impacto del Mercado del Carbono en la Performance Económica de Proyectos Forestales. Estudio de Caso para Uruguay. In Simposio Internacional Medición y Monitoreo de la Captura de Carbono en Ecosistemas Forestales; UACH: Valdivia, Chile, 2001; pp. 145–249. [Google Scholar]
  28. Castaño, J.P.; Giménez, A.; Ceroni, M.; Furest, J.; Aunchayna, R.; Bidegain, M. Caracterización Agroclimática del Uruguay 1980–2009; INIA: Montevideo, Uruguay, 2011. [Google Scholar]
  29. Methol, R. SAG Eucalyptus: Sistema de Apoyo A la Gestión de Plantaciones Orientadas A la Producción de Celulosa En Uruguay; INIA: Montevideo, Uruguay, 2008. [Google Scholar]
  30. Methol, R. SAG Grandis Sistema de Apoyo A la Gestión de Plantaciones de Eucalyptus Grandis; Serie Técnica 131; INIA: Montevideo, Uruguay, 2003. [Google Scholar]
  31. Toochi, E.C. Carbon sequestration: How much can forestry sequester CO2? For. Res. Eng. 2018, 2, 148. [Google Scholar] [CrossRef] [Green Version]
  32. Hirigoyen, A.; Varo-Martinez, M.A.; Rachid-Casnati, C.; Franco, J.; Navarro-Cerrillo, R.M. Stand Characterization of Eucalyptus spp. Plantations in Uruguay Using Airborne Lidar Scanner Technology. Remote Sens. 2020, 12, 3947. [Google Scholar] [CrossRef]
  33. Quintero-Méndez, M.A.; Jerez-Rico, M. Optimizing thinnings for timber production and carbon sequestration in planted teak (Tectona grandis L.f.) stands. For. Syst. 2019, 28, 1. [Google Scholar] [CrossRef] [Green Version]
  34. Panorama Forestal Nro 34. Available online: http://tardaguila.com.uy/web/forestal?start=16 (accessed on 26 December 2020).
  35. Acuna, M.; Strandgard, M.; Wiedemann, J.; Mitchell, R. Impacts of early thinning of a Eucalyptus globulus labill. Pulplog plantation in Western Australia on economic profitability and harvester productivity. Forests 2017, 8, 415. [Google Scholar] [CrossRef] [Green Version]
  36. Yan, Y. Integrate carbon dynamic models in analyzing carbon sequestration impact of forest biomass harvest. Sci. Total Environ. 2018, 615, 581–587. [Google Scholar] [CrossRef] [PubMed]
  37. Bourque, C.P.A.; Neilson, E.T.; Gruenwald, C.; Perrin, S.F.; Hiltz, J.C.; Blin, Y.A.; Horsman, G.V.; Parker, M.S.; Thorburn, C.B.; Corey, M.M.; et al. Optimizing carbon sequestration in commercial forests by integrating carbon management objectives in wood supply modeling. Mitig. Adapt. Strateg. Glob. Chang. 2007, 12, 1253–1275. [Google Scholar] [CrossRef]
  38. Rubilar, R.A.; Allen, H.L.; Fox, T.R.; Cook, R.L.; Albaugh, T.J.; Campoe, O.C. Advances in silviculture of intensively managed plantations. Curr. For. Rep. 2018, 4, 23–34. [Google Scholar] [CrossRef]
  39. Keleş, S. Edades óptimas de corte en bosques de álamos híbridos incluyendo captación de carbono: Un estudio de caso en Turquía. Rev. Chapingo Ser. Cienc. For. Ambiente 2016, 22, 339–349. [Google Scholar] [CrossRef] [Green Version]
  40. Olschewski, R.; Benítez, P.C. Optimizing joint production of timber and carbon sequestration of afforestation projects. J. For. Econ. 2010, 16, 1–10. [Google Scholar] [CrossRef]
  41. Binkley, D.; Campoe, O.C.; Alvares, C.; Carneiro, R.L.; Cegatta, Í.; Stape, J.L. The interactions of climate, spacing and genetics on clonal Eucalyptus plantations across Brazil and Uruguay. Forest Ecol. Manag. 2017, 405, 271–283. [Google Scholar] [CrossRef] [Green Version]
  42. Zhou, W.; Gao, L. The impact of carbon trade on the management of short-rotation forest plantations. For. Policy Econ. 2016, 62, 30–35. [Google Scholar] [CrossRef]
  43. Wang, G.B.; Deng, F.F.; Xu, W.H.; Chen, H.Y.H.; Ruan, H.H. Poplar plantations in coastal China: Towards the identification of the best rotation age for optimal soil carbon sequestration. Soil Use Manag. 2016, 32, 303–310. [Google Scholar] [CrossRef]
  44. Resquin, F.; Navarro-Cerrillo, R.M.; Carrasco-Letelier, L.; Casnati, C.R. Influence of contrasting stocking densities on the dynamics of above-ground biomass and wood density of Eucalyptus benthamii, Eucalyptus dunnii, and Eucalyptus grandis for bioenergy in Uruguay. For. Ecol. Manag. 2019, 438, 63–74. [Google Scholar] [CrossRef]
  45. Ruíz-Peinado Gertrudix, R. Modelos para la estimación del carbono en la biomasa de los sistemas forestales. Influencia de la selvicultura en los stocks de carbono. Cuad. Soc. Esp. Cienc. For. 2013, 231. [Google Scholar] [CrossRef]
  46. Callaghan, D.W.; Khanal, P.N.; Straka, T.J.; Hagan, D.L. Influence of forestry practices cost on financial performance of forestry investments. Resources 2019, 8, 28. [Google Scholar] [CrossRef] [Green Version]
  47. Loisel, P. Under the risk of destructive event, are there differences between timber income based and carbon sequestration based silviculture? For. Policy Econ. 2020, 120, 102269. [Google Scholar] [CrossRef]
  48. Romero, C.; Putz, F.E. Financial viability and carbon payment potential of large-scale silvicultural intensification in logged dipterocarp forests in Indonesia. For. Policy Econ. 2017, 85, 95–102. [Google Scholar] [CrossRef]
  49. Dumortier, J. The effects of uncertainty under a cap-and-trade policy on afforestation in the United States. Environ. Res. Lett. 2013, 8, 11. [Google Scholar]
  50. Blouin, M.; Cormier, D. Carbon and greenhouse gas accounting of forest operations in FPInterface. Int. J. For. Eng. 2012, 23, 64–69. [Google Scholar] [CrossRef]
Figure 1. Location of the study sites: b1 and b2 (Guichon); b3 and b4 (Trinidad); and zone b5 (Sarandí del Yi) in Uruguay. In green, E. grandis stands, in red, E. dunnii stands; circle in cyan: pulp mill Fray Bentos (−33.12148; −58.25455), circle in black: pulp mill Paso de Los Toros (−32.83006; −56.49728, approx. building under construction).
Forests 12 00651 g001
Figure 2. Net present value by C price (from 0 to 30 USD t−1) for three interest rates (IR) and timber prices (55, 65, and 75 USD t−1).
Forests 12 00651 g002
Figure 3. Harvest age and harvest spatial distribution of the stands by C price (0, 15, and 30 USD t−1). The harvest ages are represented in yellow (period 7), green (period 8), orange (period 9), and blue (period 10).
Forests 12 00651 g003
Figure 4. Timber delivered to pulp mills by C price and harvest age assuming 50% of C released at the harvest time, an IR of 8%, and a timber price of 65 USD m−3.
Forests 12 00651 g004
Figure 5. C sequestered and accumulated until harvest age by C price and interest rate (IR).
Forests 12 00651 g005
Table 1. Stand characteristics of Eucalyptus grandis and Eucalyptus dunnii in Uruguay. Variables and abbreviations: diameter at breast height (DBH, cm); total height (H, m); above ground biomass (AGB, Mg C ha−1); stored carbon (Mg ha−1); age (years); and stem density (N, trees ha−1). Where: stdev = standard deviation, min = minimum, max = maximum.
Field AttributesMinMeanMaxStdev
DBH (cm)12.5716.819.81.8
E. grandis (n = 43)H (m)14.721.934.64.5
AGB (Mg ha−1)104.7218.3428.974.2
Stored Carbon (Mg ha−1)52.87110.2216.537.47
Age (years)4.506.849.51.5
N (tree ha−1)9861051112825.2
DBH (cm)11.0415.7819.981.67
E. dunnii (n = 45)H (m)9.2519.9229.354.05
AGB (Mg ha−1)70.10210.3360.458.7
Stored Carbon (Mg ha−1)35.45106.2181.829.64
Age (years)4.56.288.41.20
N (tree ha−1)10281069110316.84
Table 2. Sets, parameters, and variables of the thinning optimization model.
TermDefinition
Sets
IForest stands, I = {1, …, 88}
JDestinations, J = {1, 2}
TPlanning periods, T = {1, …, 15}
H ⊂ THarvesting periods, H = {7, …, 10}
P ⊂ TPeriods before the minimum age for harvesting, P = {1, …, 6}
Parameters
DPLDelivered price of logs at pulp mill—(USD m−3)
CPCarbon price (USD t−1)
TCTransport cost (USD t-km−1)
DSMijTransport distance from stand i ∈ I to pulp mill j ∈ J (km)
HCihHarvesting cost in stand i ∈ I in period h ∈ H (USD)
SPPCiSite and plantation costs in stand I ∈ I (USD)
WCFAitWeed control, fertilization, and ant control costs in stand i ∈ I in period t ∈T (USD)
AvaPLihPulp logs available in stand i ∈ I if harvested in period h ∈ H (m3)
SeqCitCarbon sequestered in stand i ∈ I in period t ∈ T (t)
AccCihCarbon accumulated in stand i ∈ I that is harvested in period h ∈ H (t)
irInterest rate (decimal)
Decision variables
XihBinary variable. 1, if stand i ∈ I is harvested in period h ∈ H, 0 otherwise
PLDijhContinuous variable. Pulp logs delivered from stand i ∈ I to pulp mill j∈ J in period h ∈ H (t)
Accounting variables
RevenuePLStandiRevenue from the sale of pulp logs generated in stand i ∈ I (USD)
ValueCSStandiValue of carbon sequestered by stand i ∈ I (USD)
ValueCSihtValue of carbon sequestered by stand i ∈ I in period t ∈ T, if the stand is harvested in period h ∈ H (USD)
ECostStandiEstablishment cost in stand i ∈ I (USD)
HTCostStandiHarvesting and transport cost in stand i ∈ I (USD)
ValueCRStandiValue of carbon released from stand i ∈ I (USD)
ValueCRihtValue of carbon released from stand i ∈ I and period t ∈ T, if the stand is harvested in period h ∈ H (USD).
ValueCRStandAiValue of carbon released from stand i ∈ I (USD) at the harvest time
ValueCRStandBiValue of carbon released from stand i ∈ I (USD) over the 5 years after the harvest
Table 3. Effect of C and timber price, and IR on revenue. Values (in millions of dollars) are calculated for a timber price of 65 USD m−3 and considering 50% of C released at the harvest time. In parenthesis, it is the percentage of total revenue associated with timber and carbon.
C price (USD/t)Interest Rate (%)Total Revenue
(M USD)
Revenue Timber
(M USD)
Revenue Carbon
(M USD)
0
5
10
15
20
30
6
6
6
6
6
6
16.0
17.3
18.5
19.7
20.8
23.1
16.0 (100%)
16.2 (94%)
16.3 (88%)
16.3 (83%)
16.3 (78%)
16.3 (70%)
0.0 (0%)
1.1 (6%)
2.2 (12%)
3.4 (17%)
4.5 (22%)
6.8 (30%)
0
5
10
15
20
30
8
8
8
8
8
8
13.1
14.2
15.4
16.5
17.8
20.0
13.1 (100%)
13.2 (93%)
13.4 (87%)
13.5 (82%)
13.7 (77%)
13.6 (68%)
0 (0%)
1.0 (7%)
2.0 (13%)
3.0 (18%)
4.1 (23%)
6.4 (32%)
0
5
10
15
20
30
10
10
10
10
10
10
11.3
12.2
13.1
14.1
15.1
17.3
11.3 (100%)
11.3 (93%)
11.3 (87%)
11.4 (81%)
11.5 (76%)
11.5 (66%)
0 (0%)
0.9 (7%)
1.8 (13%)
2.7 (19%)
3.6 (24%)
5.8 (34%)
Table 4. Total volume harvested (m3) by harvest age, C price, and IR. Numbers in parentheses represent the number of stands being harvested in each scenario. The last column shows the total volume including all the periods. Values were calculated for a timber price of 65 USD m−3 and considering 50% of C released at the harvest time.
Harvest Age
C Price (USD/t)IR (%)Period 7Period 8Period 9Period 10Total All Periods
0
5
10
15
20
30
6
6
6
6
6
6
36,167 (11)
33,687 (9)
19,218 (5)
19,218 (4)
5804 (2)
30,067 (4)
5449 (1)
106,407 (17)
63,306 (8)
31,062 (4)
5941 (1)
238,951 (56)
319,907 (70)
380,126 (79)
407,481 (83)
429,772 (86)
435,830 (88)
411,592
422,349
430,406
432,550
435,576
435,830
0
5
10
15
20
30
8
8
8
8
8
8
116,139 (26)
89,757 (22)
54,241 (15)
39,916 (11)
23,967 (6)
79,352 (23)
92,171 (21)
77,472 (11)
41,170 (5)
15,329 (2)
99,155 (24)
93,794 (23)
121,949 (32)
126,845 (24)
76,348 (8)
5941 (1)
73,094 (15)
101,379 (22)
137,919 (30)
197,098 (48)
305,800 (72)
429,431 (87)
367,740
377,101
391,581
405,029
421,444
435,372
0
5
10
15
20
30
10
10
10
10
10
10
150,399 (39)
129,958 (32)
129,204 (31)
110,743 (24)
76,361 (18)
13,346 (4)
76,976 (20)
82,195 (23)
79,623 (22)
72,719 (20)
86,047 (18)
28,206 (3)
74,850 (18)
84,701 (20)
87,622 (21)
91,610 (22)
92,758 (23)
89,372 (15)
54,657 (11)
65,577 (13)
66,607 (14)
96,590 (22)
128,076 (29)
287,069 (66)
356,882
362,431
363,056
371,662
383,242
417,993
Publisher’s Note: MDPI stays neutral with regard to jurisdictional claims in published maps and institutional affiliations.

