Article

Developmental Dynamics of Gilbertiodendron dewevrei (Fabaceae) Drive Forest Structure and Biomass in the Eastern Congo Basin

by
Henry B. Glick
1,†,
Peter M. Umunay
1,2,*,†,
Jean-Remy Makana
3,
Sean C. Thomas
4,
Jonathan D. Reuning-Scherer
1 and
Timothy G. Gregoire
1
1
School of the Environment, Yale University, New Haven, CT 06511, USA
2
United Nations Environment Programme, P.O. Box 30552-00100, Nairobi, Kenya
3
Faculty of Science, University of Kisangani, Kisangani, Democratic Republic of the Congo
4
Institute of Forestry and Conservation, University of Toronto, Toronto, ON M5S 3B3, Canada
*
Author to whom correspondence should be addressed.
These authors contributed equally to this work.
Submission received: 16 May 2021 / Revised: 28 May 2021 / Accepted: 29 May 2021 / Published: 4 June 2021
(This article belongs to the Section Forest Ecology and Management)

Abstract

:
Patterns of structural change associated with monodominant tropical forest complexes have remained enigmatic for decades. Here, we extend previous efforts in presenting a longitudinal, local-scale analysis of forest dynamics in central Africa. Using four 10-ha census plots measured across three time periods (959,312 stems ≥1 cm DBH), we analyzed changes in a number of biometrical attributes for four distinct forest types capturing the developmental gradient from mixed species forest to Gilbertiodendron dewevrei-dominated forest. We modeled above-ground biomass (AGB), basal area (BA), and stem density across all species, and diameter at breast height (DBH), recruitment, and mortality for Gilbertiodendron dewevrei. We hypothesized that trends in these attributes are consistent with a slow spread of Gilbertiodendron dewevrei into adjacent mixed species forest. We identified statistically significant increases in AGB and BA across sites and positive, though nonsignificant, increases in AGB and BA for most forest types. DBH and relative recruitment increased significantly for Gilbertiodendron dewevrei stems, while relative mortality did not. When looking from mixed species to transitional to monodominant forest types, we found a statistically significant pattern of developmental aggradation and net expansion of monodominant forest. We do not attribute this to atmospheric forcing but to a combination of (a) landscape-scale recovery or response to widespread disturbance (primarily historical fires), (b) Gilbertiodendron dewevrei’s ectomycorrhizal association, and (c) Gilbertiodendron dewevrei’s exceptional stress tolerance traits.

1. Introduction

The structural dynamics of tropical forests and their relation to species diversity have been a topic of interest for most of a century [3,4,5,6,7,8]. Patterns of forest structure vary biogeographically [1,2,7,9,10,11,12,13,14,15,16,17], and an exceptional pattern is the dominance of a particular tree species or cohort of species in lowland tropical rain forests [15,17,18,19]. Tropical forest monodominance was once viewed as anomalous [6,17,18,20], though we now know that it occurs to varying degrees in all of the major tropical forest regions [16,18,21]. Still, we lack a unified understanding of how these monodominant forests grow and change through time, and on the ways in which structural changes lead to, and promote, monodominance, or vice versa [9,16,21,22,23].
Central Africa’s Congo River basin contains 30% of the world’s tropical forests [1,8], which themselves possess unique structural characteristics among global rain forests [6,10,16]. Compared to comparable forests of South America and Southeast Asia, the Congo basin has lower species diversity [7,15,24], and species diversity also saturates more quickly across space, such that neighboring communities are more similar to one another than in Neotropical or Asiatic counterparts [24]. However, Central African tropical forests also tend to have high carbon density relative to their low species diversity [24] and, therefore, remain a critical repository of forest biomass and continued carbon sequestration [2,8,24,25]. Of particular interest here is that large portions of the Congo basin are characterized by the dominance of Gilbertiodendron dewevrei, a long-lived leguminous canopy species [26] in the Caesalpinioideae subfamily of Fabaceae [10]. Gilbertiodendron dewevrei, hereafter Gilbertiodendron, has captured scientific attention for decades [4,10,13,19,27]. This is in part because of the spatial extent and completeness of its dominance relative to other species, including other canopy species from Caesalpinioideae, such as Julbernardia seretii and Cynometra alexandri [1,6,7,10,19,27].
Landscape disturbance history and drivers of forest structure vary across the Congo basin’s extent [13,15]. Here, we focus on the Ituri rain forest of the Ituri province in northeastern Democratic Republic of the Congo, which exemplifies a mixture of Gilbertiodendron monodominance and mixed species forest assemblages, often with sharp boundaries [10,11]. Some previous research has indicated that Gilbertiodendron-dominated forests may not differ substantially from adjacent mixed species forest communities in stem density or species richness [1], edaphic characteristics [11,12], species diversity as measured over large areas [7,19], above-ground carbon stocks [2], or change in above-ground biomass [21]. However, other research [1,10,13,14,15,18,26] and extensive field experience provide evidence that Gilbertiodendron-dominated forest possesses unique characteristics that both enable it to persist across time and to slowly convert mixed species forest into monodominant forest through a slow successional process.
To expand our understanding of forest dynamics in the Ituri region, we assessed changes in forest structure associated with undisturbed forest free from major human influence, ultimately seeking to understand the manner in which Gilbertiodrendron was or was not responsible for major structural shifts across the landscape. Our primary interest was in evaluating whether Gilbertiodendron was a dominant driver of forest development, as captured by the growth and geographic expansion of monodominant stands in an otherwise species-diverse landscape. We considered forest change using a putative developmental scheme in which a mixed species forest becomes transitional forest and transitional forest becomes Gilbertiodendron-dominated forest. Under this umbrella, we tested the following hypotheses related to forest biometrics and spatial dynamics, supported, in part, by a recent theoretical model of stand dynamics proposed by Hall et al. [28]. Building on earlier efforts [11,14,29], Hall et al. [28] reframed previous conceptual models of Gilbertiodendron stand dynamics into one of resource acquisition and use efficiency. While we do not provide a full test of their framework, the present work offers a partial independent evaluation.

1.1. Hypotheses Related to Forest Structure and Growth

We hypothesized that the highest above-ground biomass (AGB) and basal area (BA) would be associated with Gilbertiodendron-dominated forest (forest types defined below), owing to the species’ stature and dominance relative to competing species, and patterns identified in other studies [7,26]. We also hypothesized that the rates of AGB and BA accumulation would reflect the degree of Gilbertiodendron dominance. We expected to find the highest rates of accumulation in mixed species forest, intermediate rates in transitional forest, and the lowest rates in Gilbertiodendron-dominated forest. This expectation is consistent with Hall et al.’s [28] model in that Gilbertiodendron (a) tends to have high survivorship rates, owing to large seeds and ectomycorrhizal fungal association; and (b) the stand dynamics reveal rapid growth during recruitment and sapling stages, owing to plasticity in light capture [28,29]. Greater light availability in mixed species forest compared to monodominant forest [7,15] would suggest more rapid growth in mixed and transitional forest types.

1.2. Hypotheses Related to Tree Species Composition

We hypothesized that species diversity and stem densities would be lowest in Gilbertiodendron-dominated forest and highest in mixed species forest types; that the relative rates of Gilbertiodendron recruitment would be greatest in mixed species and transitional forest types in which Gilbertiodendron was not already dominant; and that the relative rates of Gilbertiodendron mortality would not increase over time in any forest type. As above, these hypotheses are supported by related efforts in other parts of Central Africa [26,30] and align with Hall et al.’s [28] conceptual model in that greater light availability in mixed species forest mimics, to some extent, gap formation in a mature Gilbertiodendron forest. The greater light levels support an abundance of seedlings, which themselves help to alter the light environments of competitors. Stable or decreasing mortality rates in the face of increasing recruitment would signal a net increase in abundance, consistent with development towards monodominance.

1.3. Hypotheses Related to Development and Geographic Expansion

We hypothesized that the observed changes in forest types would be uni-directional: mixed species forest would shift towards transitional forest, which would, in turn, shift towards Gilbertiodendron-dominated forest. This hypothesis derives from long-term field observations (personal observation by P. Umunay); observations of greater rates of recruitment and survival at monodominant patch boundaries [14]; and again, differences in light availability [7,15] paired with Gilbertiodendron’s relative success in high light conditions [28].
To evaluate these hypotheses, we analyzed tree-level data from three repeated censuses of four large (10-ha) plots established in 1994 in the Ituri forest. This research builds on related efforts from Lewis et al. [2] and Makana et al. [1]. Lewis et al. [2] used a model-based approach to look at carbon storage within intact African forests, relying on data from the first two Ituri censuses (among other data), aggregated across each of the 10-ha plots. Makana et al. [1] evaluated changes in AGB and species-specific demography, aggregating data across each of the 10-ha plots, which were treated as either Gilbertiodendron-dominated or mixed species forest. Here, we extend these efforts (a) by using model-based frameworks to evaluate temporal trends among a number of key forest biometrics within four distinct forest types; and (b) by explicitly considering the spatial dynamics of stand structure through a developmental lens. Instead of using an aggregation approach, we treat plots as heterogeneous community structures that have local-level variability [31]. We postulated that a more nuanced assessment of trends in these biometrics and spatial dynamics would support previous research suggesting that Gilbertiodendron dewevrei was a critical determinant of forest structure in this region and help to support observations of Gilbertiodendron’s slow imposition on the surrounding mixed species forest.

2. Materials and Methods

We present here an overview of our data and the methods we employed. Please consult the Supplementary Material for a detailed account of our analyses, background information, and more complete justification of our statistical modeling choices. All data management, analysis, and visualization were performed using R v. 3.5.3 (R Core Team, 2019). Specific packages and workflows are described in the Supplementary Material.

2.1. Field Plots and Data Structures

The Ituri Forest Dynamics Project was established in 1994 by the Centre de Formation et de Recherche en Conservation Forestière and includes four 10-ha plots (200 m × 500 m) selected in representative stands that encompass both mixed species and Gilbertiodendron-dominant forest types found in the region (Figure 1 and Figure 2). The plots are located within the 13,700 km2 Okapi Faunal Reserve of the Ituri Forest, which is itself part of a Core Conservation zone [32]. The plots fall in two sets (edoro1 and edoro2, and lenda1 and lenda2) with approximately one half kilometer between plots within a set and approximately 31 km between sets. All trees ≥1 cm DBH (diameter at 1.3 m height) within plots were measured to the nearest 0.1 cm, geographically located, tagged, and identified (>99% to species level), either in the field or using shoot specimens [33] in three censuses (n = 959,312). The first census ran from 2 Febuary 1994–15 July 1996, the second ran from 2 Febuary 2001–9 January 2002, and the third ran from 10 January–30 November 2007. These plots and their standardized measurement protocols have been thoroughly detailed elsewhere [32,34].
We unified tree-level tabular records from the three censuses and then utilized tree-level coordinates in developing spatially explicit data objects in an appropriate coordinate reference system (Universal Transverse Mercator zone 35). To mitigate the impacts of outlying stem metrics (e.g., unusually large basal area or an unusually large number of new recruits) and to make the results more broadly generalizable to the main forest types of the region, we elected to aggregate tree-level metrics to quadrats for many portions of our analysis ( n = 160 quadrats per site per census). We selected a quadrat size of 25 m × 25 m to help mitigate the effects of data collection errors stemming from field protocols while retaining reasonable granularity. Each quadrat was classified into one of four forest types (Figure 3). Classification was performed using a two-step process. In the first step, quadrats were classified as (a) Gilbertiodendron-dominated forest, in which Gilbertiodendron represented ≥50% of the total (living) basal area on a given quadrat; (b) transitional forest, in which Gilbertiodendron represented ≥5% and <50% of the total basal area; or (c) mixed species forest, in which Gilbertiodendron represented <5% of the total basal area on a given quadrat. These thresholds were selected based on field experience and previous research. Bauters et al. [26] separated mixed species and Gilbertiodendron-dominated forest with a threshold of 60% Gilbertiodendron BA, while Hart et al. [19] separated the two at 70%. We elected to use a comparable, if slightly lower, threshold of 50% to match our field observations. A threshold of 5% was selected to separate mixed species from transitional forest because (a) there is a wide range of Gilbertiodendron presence suggestive of increasing dominance and (b) selecting such a low threshold helped ensure that our mixed species forest class was distinct from the Gilbertiodendron-dominated class by virtue of the wide range of Gilbertiodendron stem densities encapsulated by the transitional forest class.
In the second step, any quadrat that intersected hydrological features was reclassified as riparian. The riparian class is somewhat anomalous relative to the others, which together represent a continuum of Gilbertiodendron development from species diverse to monodominant forest types. However, the riparian class was included to provide a casual test of Gilbertiodendron’s association with water [28,35], and as contrast to statements about floristically distinct riparian forest [19,32]. If these quadrats were actually unique, isolation would help to mitigate confounding effects in statistical analyses. If they were instead similar to another forest class (notably, Gilbertiodendron-dominated forest), this would also be apparent.

2.2. Statistical Analysis

We used two forms of regression modeling to capture trends in above-ground live biomass (AGB), basal area (BA), live stem count (A), Gilbertiodendron stem diameter (DBH), relative Gilbertiodendron recruitment, and relative Gilbertiodendron mortality. Each model was derived through its own model selection workflow, but to ensure that forest class-specific changes could be captured, all models included a median-centered temporal variable to capture trends across time, a categorical variable capturing our four forest classes, and an interaction term of time × forest class.
Changes in live above-ground biomass (AGB), live basal area (BA), live stem count (A), and the diameter of live Gilbertiodendron stems (DBH) were captured using a linear mixed effects modeling framework [36] with random intercepts and random slopes on the temporal variable, by unique quadrat. Mixed effects models are commonly employed to account for clustering or dependence across one or more dimensions, and here, we rely on the random effects submodels to account for temporal autocorrelation between observations. For the AGB, BA, and A models, we used unique quadrat identifiers as the grouping variable, such that random effects were estimated for each of the 640 unique quadrats. For our DBH increment growth model, we used stem-specific identifiers as the grouping variable. Linear mixed effects models accounted for spatial autocorrelation and heteroscedasticity. The presence of spatial autocorrelation was evaluated through variography and the inclusion of patterned covariance matrices that accounted for spatial autocorrelation between quadrats. We did not find, in any model, statistically significant spatial autocorrelation, for which the effects could be mitigated through the inclusion of modeled covariance structures. This may be due to the aggregation-based homogeneity (i.e., the modifiable areal unit problem [37]), and it is possible that spatial autocorrelation exists at other scales. However, all models benefited from submodels capturing non-constant error variance.
Our models of Gilbertiodendron-specific recruitment and mortality, represented as proportions, were captured using variable dispersion beta regression [38,39]. To account for temporal autocorrelation among observations, the variance-covariance matrices of beta regression model errors were subjected to post hoc sandwich variance–covariance estimators [40,41,42]. We used a sandwich estimator that extends estimators for clustered standard covariances to multiple, non-nested dimensions [43].
With the exception of DBH, our goal with each model was to produce the best predictive fit to the data on hand, but not necessarily to produce a model to be used in forecasting. For this reason, we allowed for the use of any explanatory term that was not a direct derivative of any other explanatory term. For example, we did not use DBH as an explanatory term in modeling BA, since BA is directly calculated from DBH; we did use BA as an explanatory in modeling AGB, since their relationship is more nuanced and less direct. It is important to note that, when referring to BA or AGB, for example, these values are quadrat level aggregations, and so the apparent relationship between BA and AGB is much less clear than would be the case when looking at a single record. For our model of DBH, we looked only at the relationship between DBH and time.
We used case resampling to bootstrap both linear mixed effects models and beta regression models. In the former, we resampled relative to the hierarchical levels in the data (population level and quadrat level), and used n = 10 , 000 iterations of resampling and modeling to obtain coefficient estimates, 95% confidence intervals on the coefficient estimates, and estimates of predicted change. To obtain estimates of predicted change, for each of the 10,000 models we computed (fitted values at census 3 − observed values at census 1)/observation period, and used the distribution of results to obtain a mean and 95% confidence interval of change per year. In the case of beta regression models, for each of the 10,000 iterations, we both fit the variable dispersion beta regression model and obtained sandwich-corrected estimates of error to inform our estimates of the coefficients and 95% confidence intervals. These coefficient estimates were then used to obtain estimated change per year, given the other terms in the models.
With the exception of AGB, all response variables were directly derived from tree-level data. Above-ground biomass estimates were distributed with the data and were initially produced for trees ≥1 cm DBH using a pan-tropical allometric equation for above-ground biomass of tropical moist forest trees [44]. Specifically, Equation II.3 of [44] was used to produce tree-specific estimates of AGB using a polynomial model of the form l n ( A G B ) = a + b ( l n ( D ) ) + c ( l n ( D ) 2 ) + d ( l n ( D ) 3 ) + l n ( ρ ) , where a, b, c, and d are fitted model parameters; D is measured DBH; and ρ is wood-specific gravity. Functionally, this equation is applied as
A G B = ρ × e C F + a + b ( l n ( D ) ) + c ( l n ( D ) 2 ) + d ( l n ( D ) 3 )
A G B = ρ × e 0 . 356 2 2 1.562 + 2.148 ( l n ( D ) ) + 0.207 ( l n ( D ) 2 ) 0.0281 ( l n ( D ) 3 )
where CF is a first-order correction factor of the form R S E 2 2 , accounting for back transformation bias when moving from l n ( A G B ) to A G B , often attributed to Baskerville [45] in a forestry context. Values of ρ are included in a hierarchical manner, applying the most targeted of species-, genus-, or family-specific values available.
Lastly, we evaluated whether our data exhibited uni-directional developmental patterns by evaluating the forest class of each quadrat that exhibited a class change between temporally adjacent censuses. We used a two-sample permutation test of proportions (comparable to Fisher’s exact test) [46] to evaluate whether the proportion of quadrats that exhibited the hypothesized directional change was significantly greater than the proportion that exhibited the inverse change. We omitted the edoro2 field site from this analysis, as it was installed as a control and contained no Gilbertiodendron.

3. Results

3.1. Overall Results

From 1994–2007, the Ituri Forest dynamics plots exhibited a pattern of increasing above-ground biomass and related forest structural parameters. A statistically significant ( α = 0.05 ) increase in BA of 0.09 ± 0.07/0.08 m2ha−1y−1 (95% margin of error; +3.59% ± 2.34/2.75% over 12 years; Figure 4a–c) and a statistically significant increase in AGB of 1.76 ± 1.25/1.5 Mg ha 1 y 1 (+6.14% ± 3.19/3.94% over 12 years; Figure 4d–e) were observed across the 40 ha sample as a whole. Where margins of error are unbalanced due to bootstrapping, they are presented as upper bound/lower bound. Stem loss through mortality and breakage slightly exceeded recruitment, but there was no significant difference in average (living) stem density in the sample, with an average change of −3.29 ± 9.44/9.03 stems ha 1 y 1 (−0.11% ± 1.67/1.52% over 12 years; Figure 4g–i). The observed increase in basal area and above-ground biomass is thus attributable entirely to the growth of existing trees rather than to an increase in stem density.

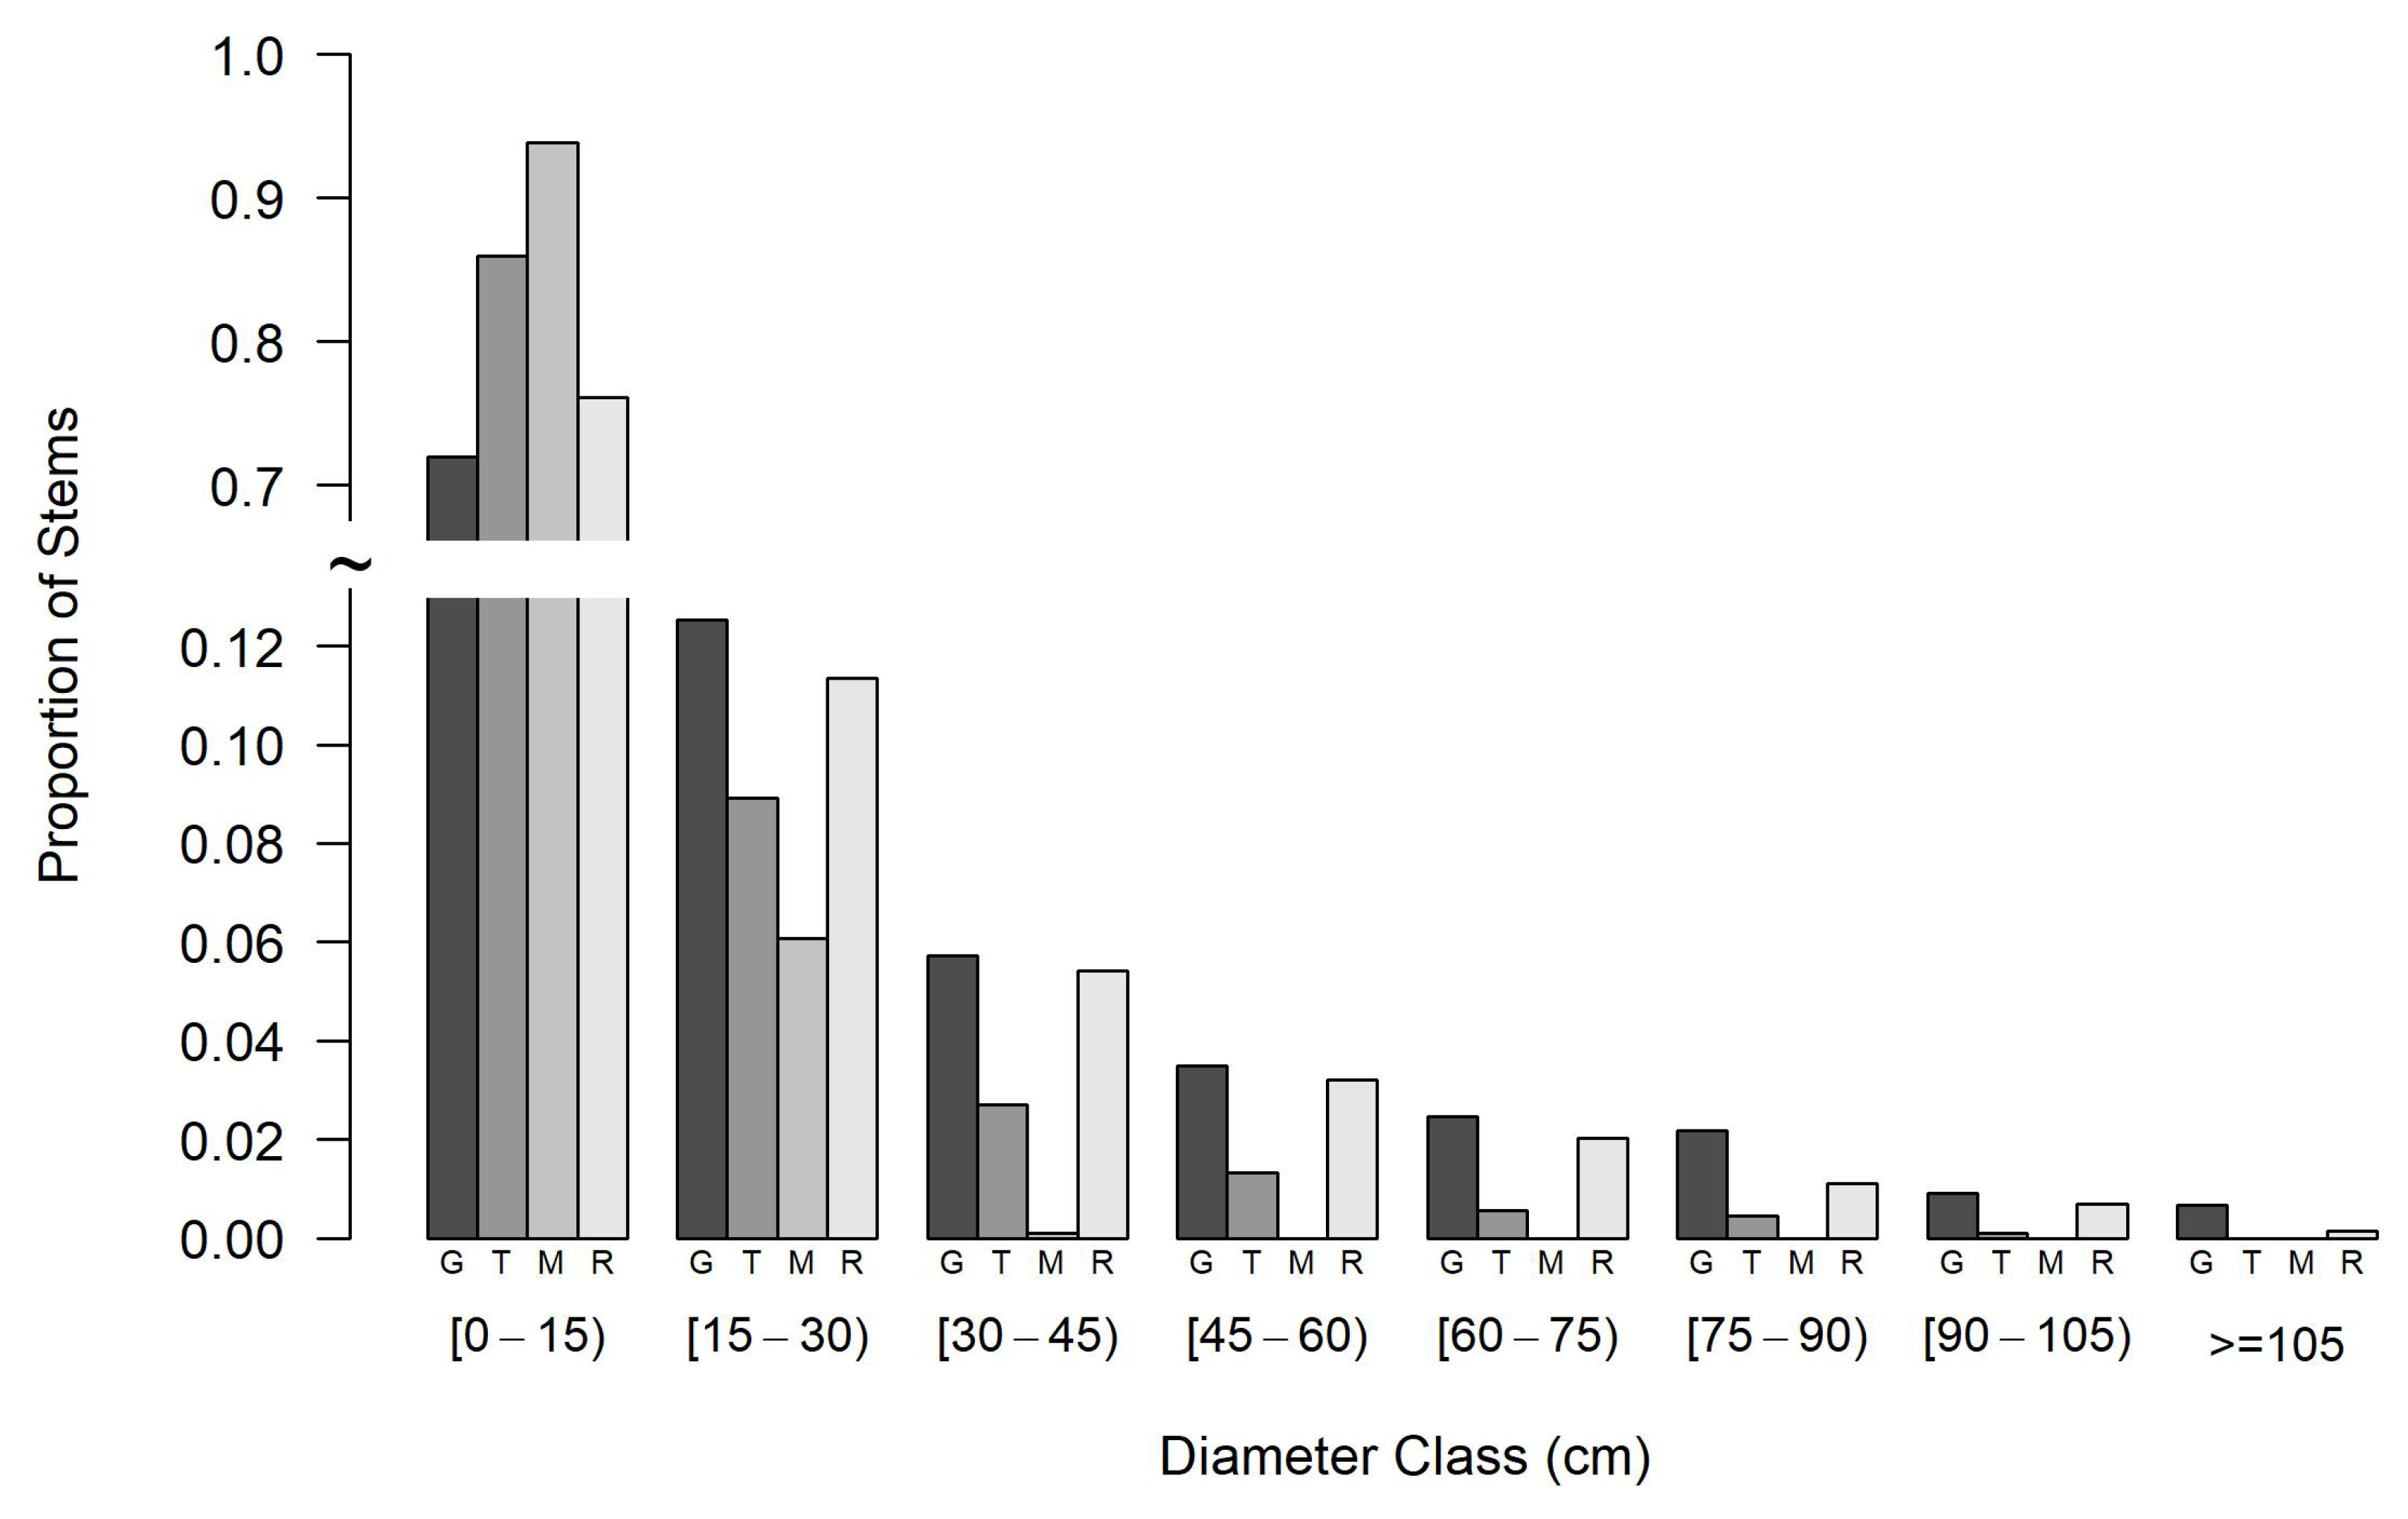
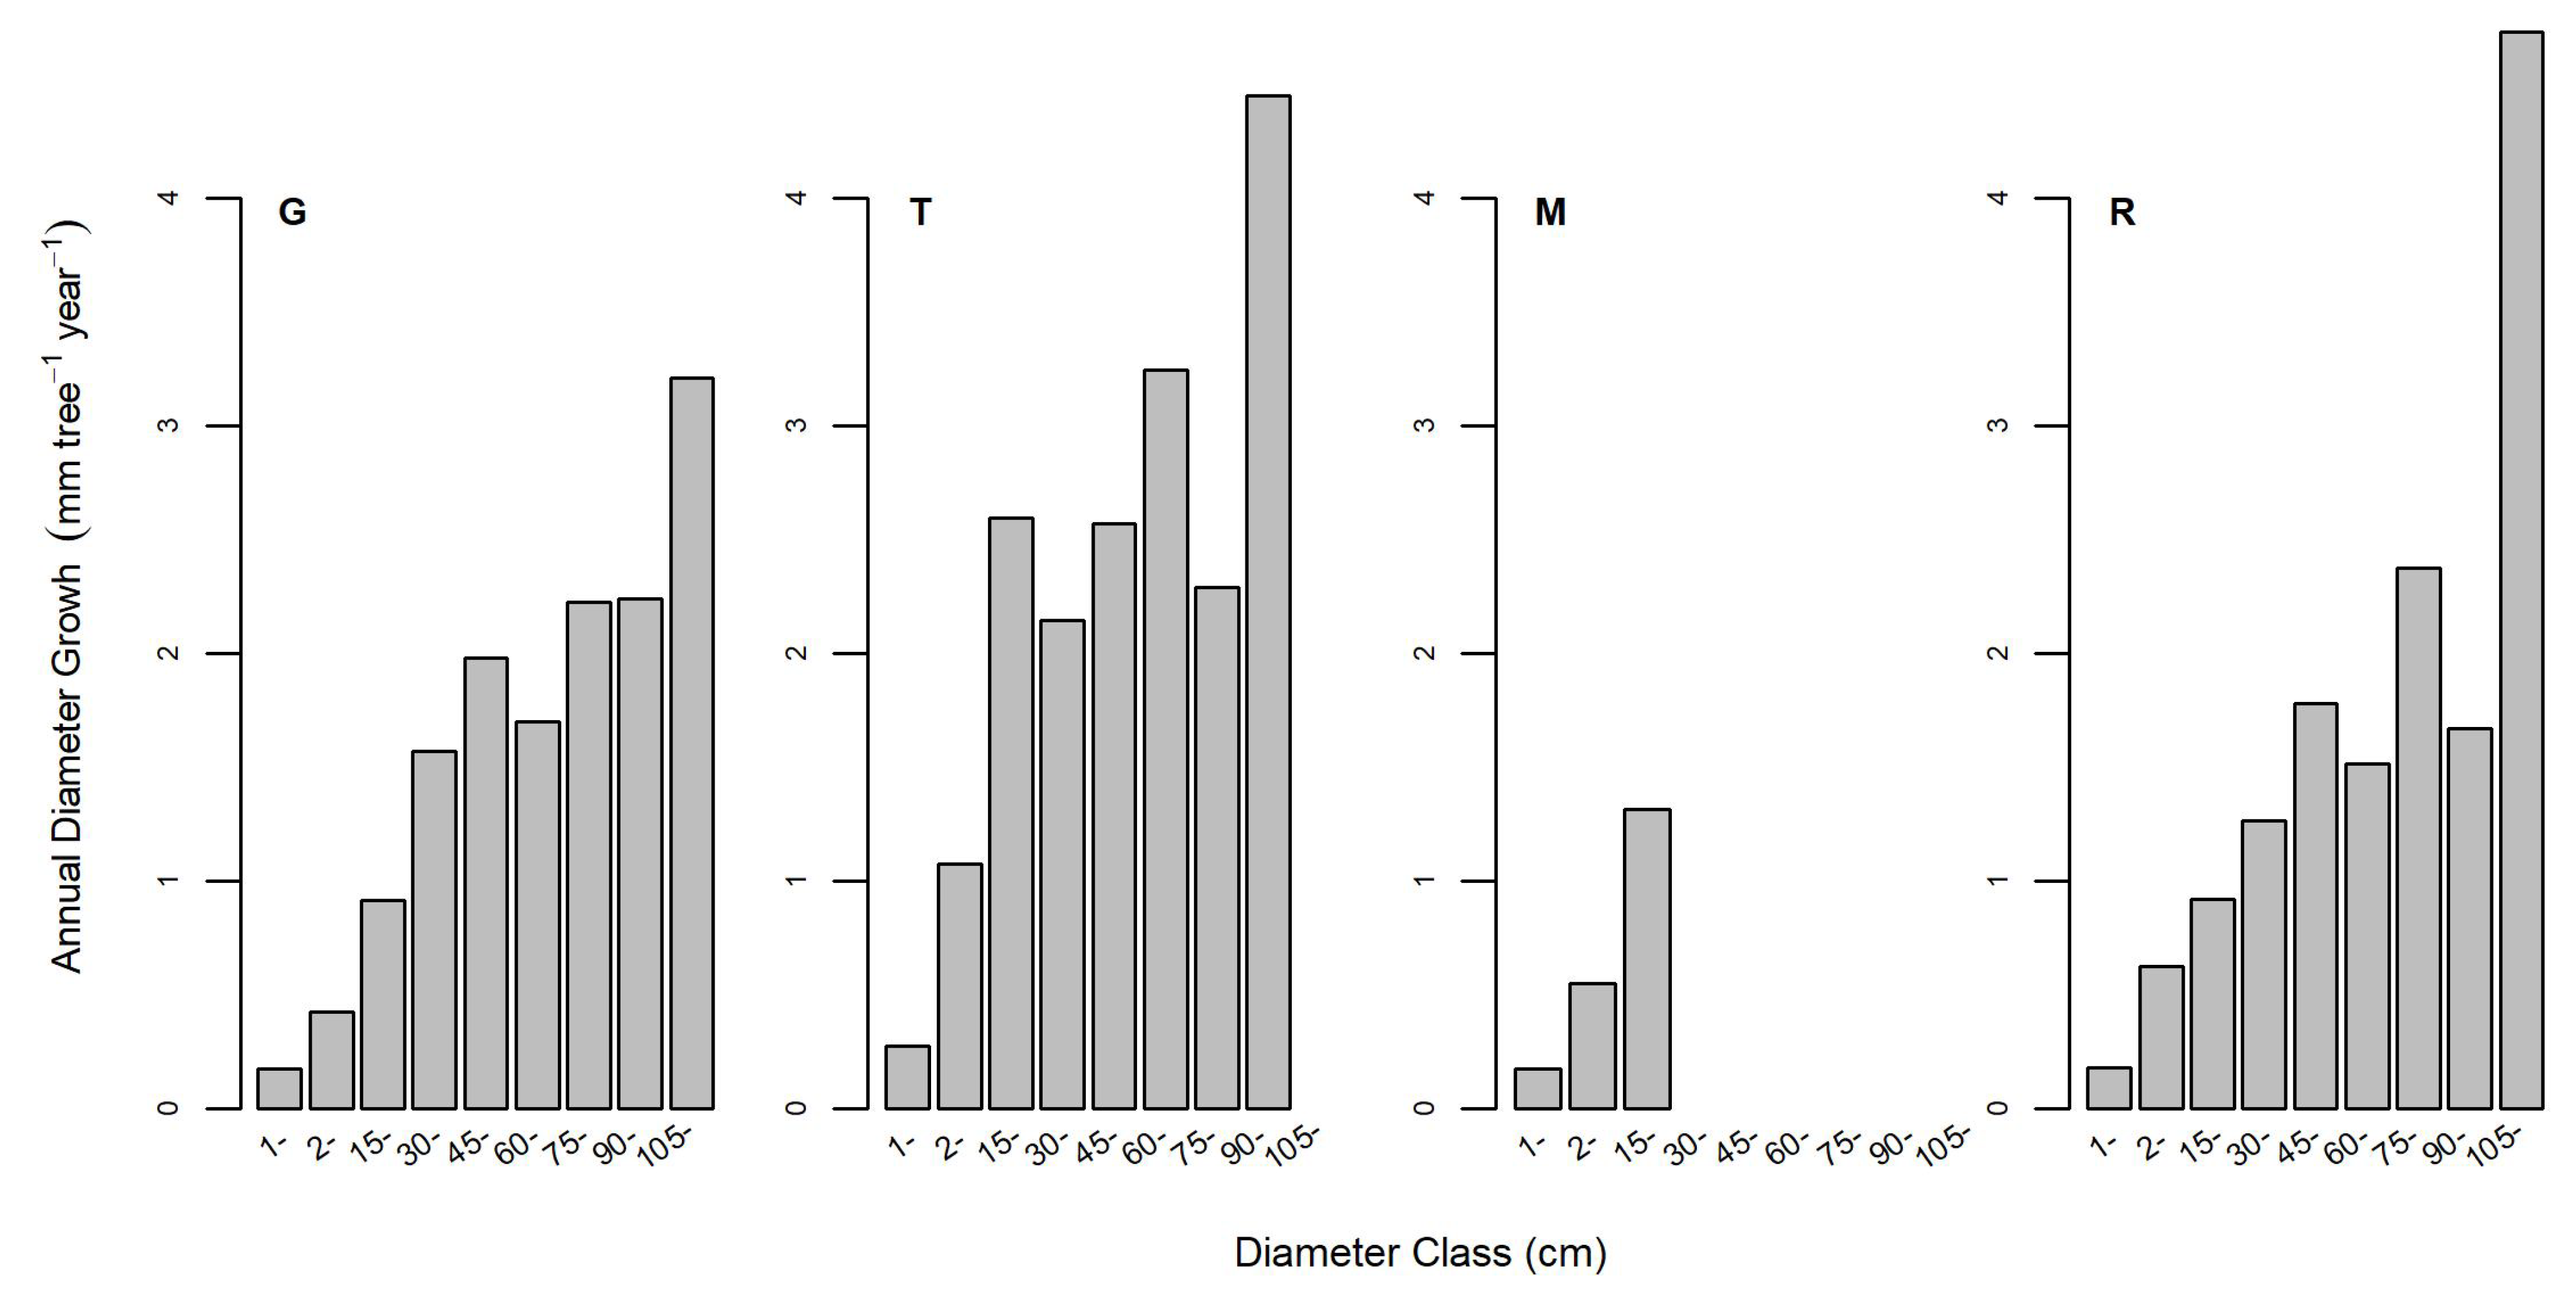
3.2. Hypotheses Related to Forest Structure and Growth

Changes in several forest structural and demographic attributes differed among forest types (Table 1). At census three, Gilbertiodendron-dominated forest stored significantly more AGB than any of the other three forest types (611 ± 39.6 Mg ha 1 ), which themselves were similar (421 ± 68.1 to 460 ± 57.4 Mg ha 1 ). These differences are generally mirrored by those of BA. Mixed species forest had the second largest total BA, mainly attributable to Cynometra alexandri and Julbernardia seretii.
As the forest shifts along the developmental gradient from a mixed species forest to a transitional forest, and from a transitional forest to a Gilbertiodendron-dominated forest, we see a clear pattern of increasing proportional representation of Gilbertiodendron and decreasing proportional representation of Cynometra alexandri and Julbernardia seretii (Figure 5). Gilbertiodendron tends to be represented in smaller size classes in mixed species and transitional forest types (Figure 6), resulting in lower BA and AGB compared to a Gilbertiodendron-dominated forest. That riparian forest has similar BA and AGB storage to transitional and mixed species forest (Table 1), which may reflect an increase in the presence of Gilbertiodendron and a decrease in competing species (Figure 5). Neither Cynometra alexandri nor Julbernardia seretii are particularly tolerant of water logging, so they tend to occur in mixed species and transitional forest types more than in riparian zones. Furthermore, Kearsley et al. [35] speak to Gilbertiodendron’s relatively poor ability to regulate water use and how the species possesses a collection of traits for water use and transport, leading to its association with riparian sites.
No forest type exhibited a statistically significant change in AGB over time, though the observed changes follow the expected directionality. Transitional forests showed the highest estimated AGB change (+2.85 ± 3.95/4.2 Mg ha 1 y 1 ) and the highest variability among forest types. Only the mixed species forest exhibited a statistically significant trend over time, and only the mixed species forest differed significantly from another forest class (Gilbertiodendron-dominated).

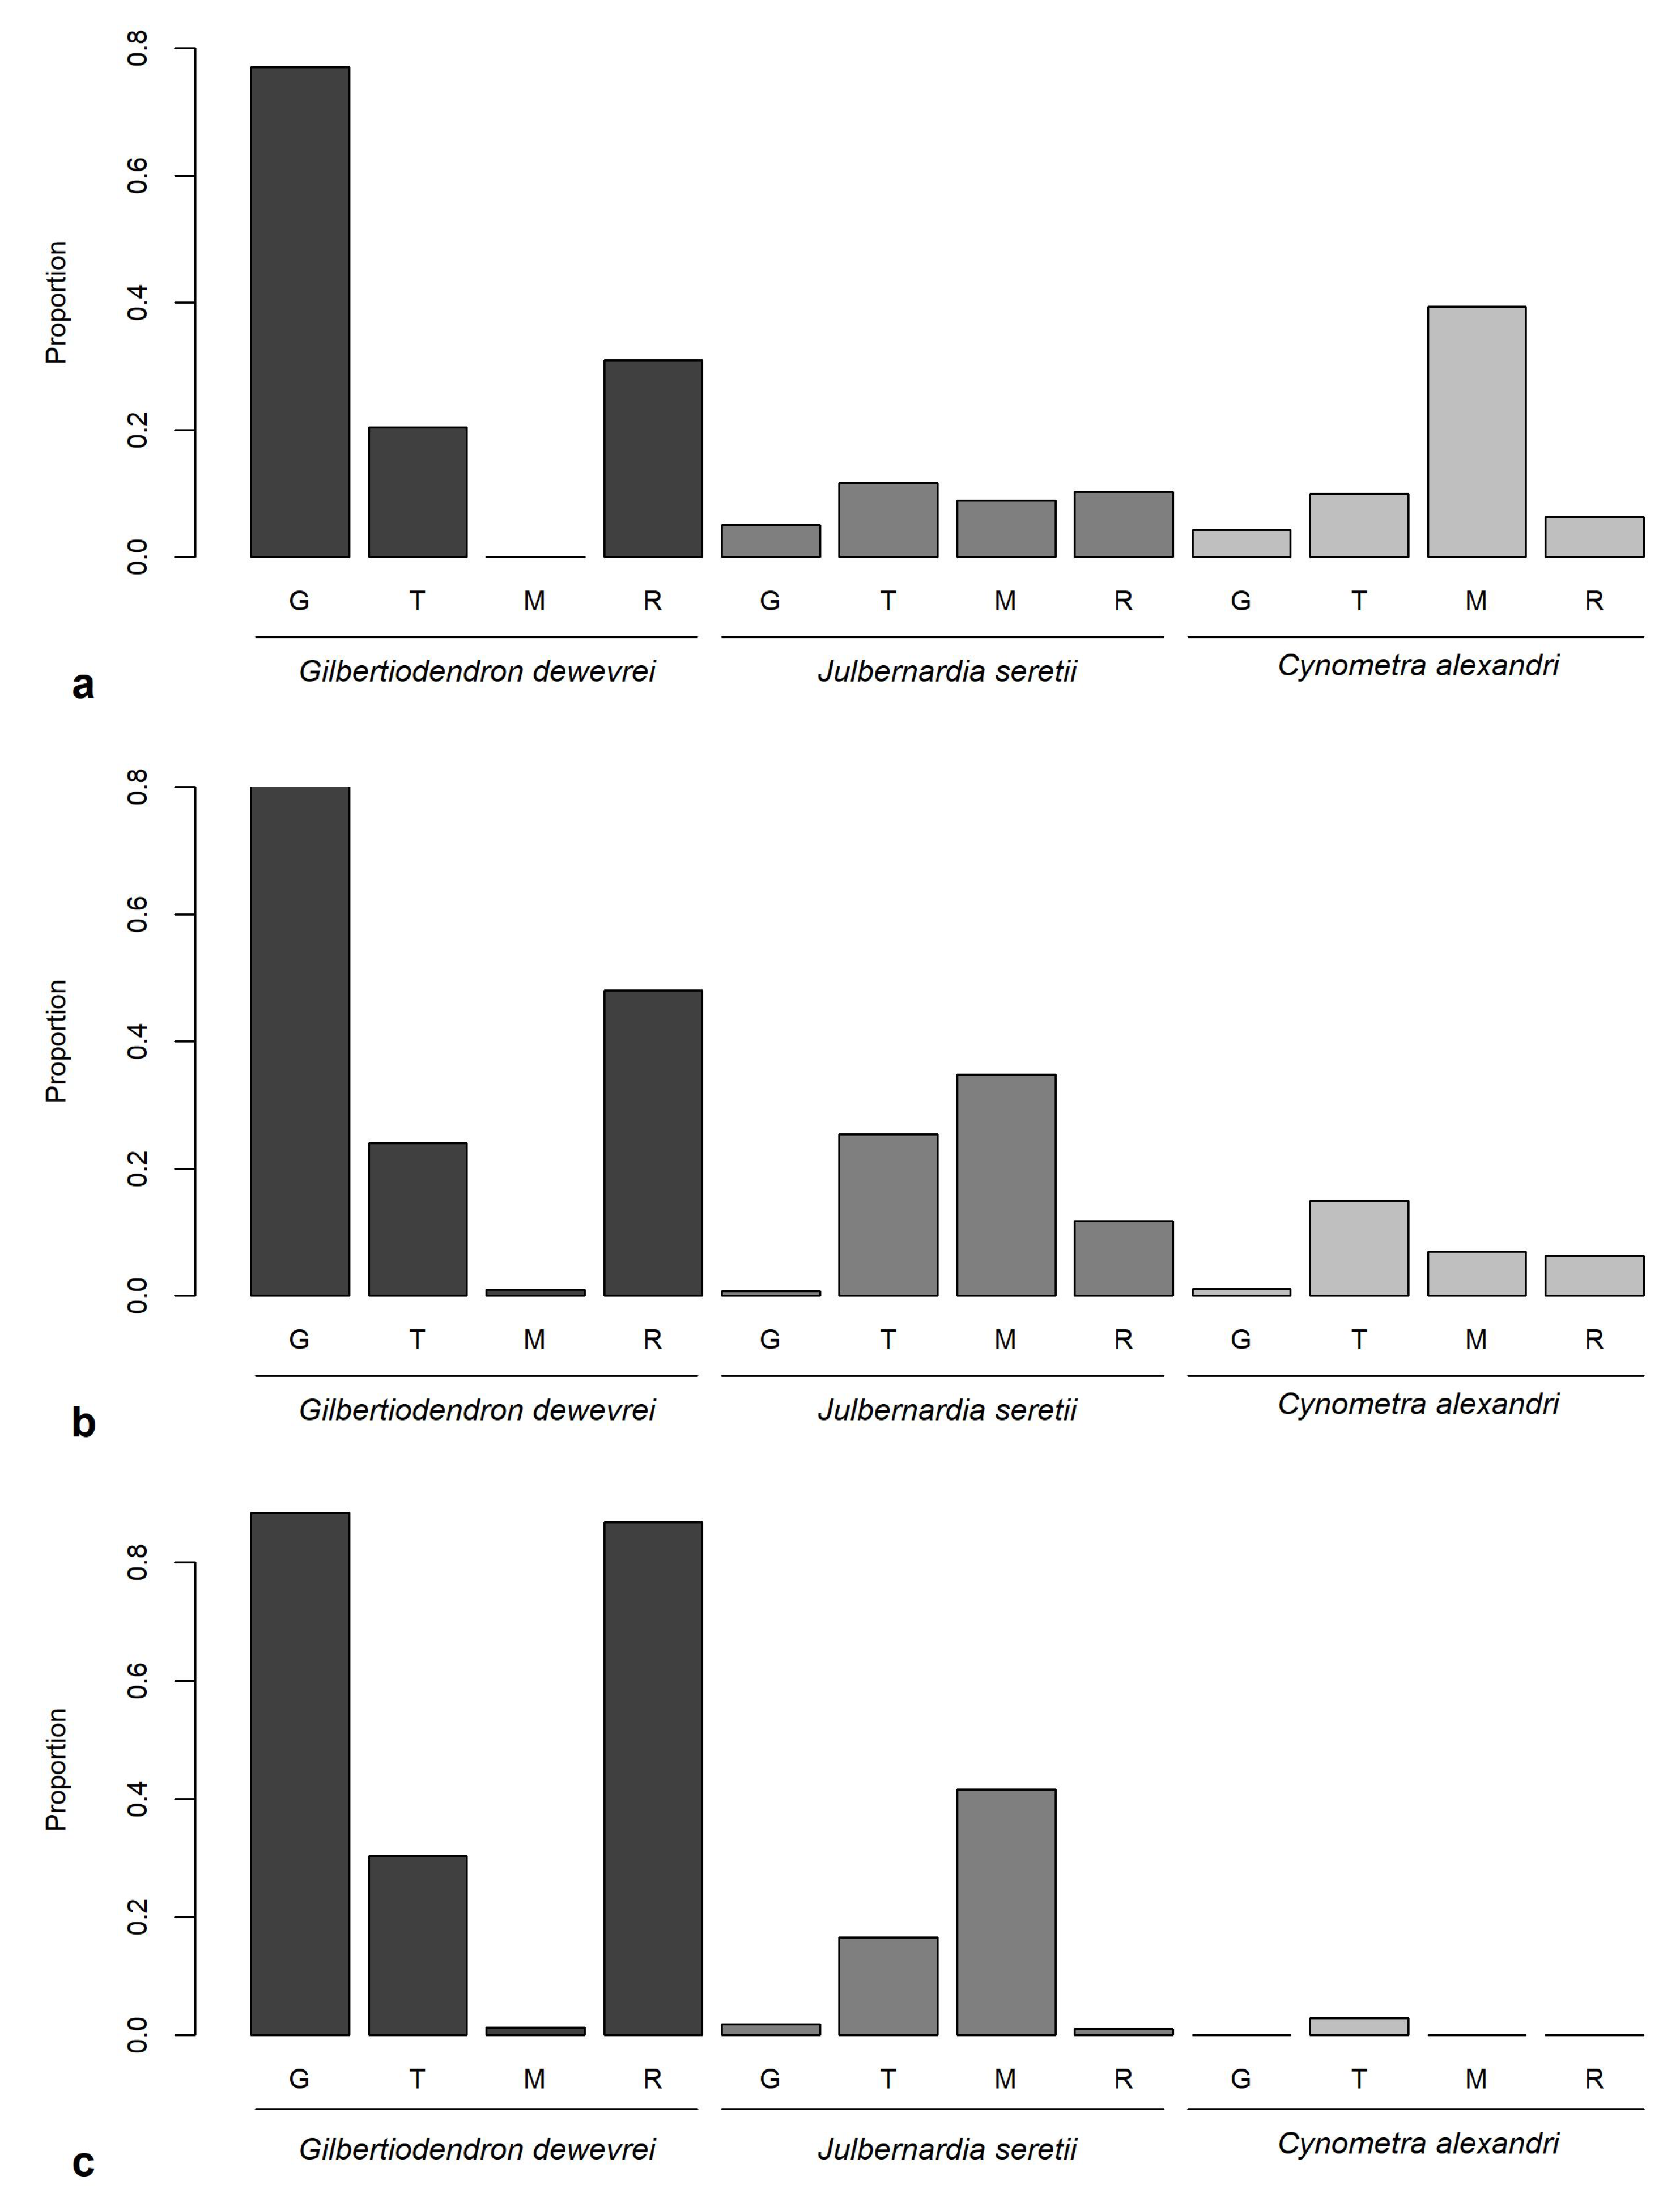
3.3. Hypotheses Related to Tree Species Composition

As hypothesized, riparian and Gilbertiodendron-dominated forest types possessed the lowest stem densities of the four forest types (6173 ± 333.7 trees ha 1 and 6828 ± 161.2 trees ha 1 , respectively), while transitional (7765 ± 372.2 trees ha 1 ) and mixed species (8001 ± 172.7 trees ha 1 ) forest had higher stem densities. This reflects the greater proportions of small diameter stems in these latter forest types, relative to the former, revealing a negative exponential (“reverse-J”) distribution often, though not always (c.f. [47]), associated with diameter distributions in mature forests with limited disturbance [48,49,50] (Figure 6). In combination with our AGB and BA findings, the lower stem density of Gilbertiodendron-dominated forest reflects a structure of larger and more sparsely situated stems. None of the forest types exhibited a significant change in stem density across time, though significant differences between forest types were observed.
Fisher’s alpha diversity values for the third census show that Gilbertiodendron-dominated forest has significantly lower species diversity than any of the other forest types, reflecting its monodominance at the scale of analysis, and the relative floristic similarity of the other forest classes (c.f. [51]). The great diversity of species present in the region ( n = 438 unique species across all sites) is reflected in the higher alpha diversity values of non-Gilbertiodendron-dominated forest types.
We would expect the stem density and diversity of transitional (and mixed species) forest to be greater than Gilbertiodendron-dominated forests given the inclusion of additional species and a more diverse size class distribution, though this may be scale dependent [1]. We would not necessarily expect diversity and AGB to be positively correlated [8]. As with the low rates of AGB and BA accumulation in the riparian forest, riparian forest stem density mimics that of the monodominant forest. Collectively, these findings provide support for the idea that our riparian forest class is largely dominated by Gilbertiodendron. This is not improbable given the species’ low drought tolerance and limited water regulation potential on some sites [35].
Among Gilbertiodendron stems, the increase in annual diameter was statistically significant for all forest types. When stems <20 mm were omitted (not shown in Table 1), the results were 0.93 mm tree 1 y 1 for Gilbertiodendron-dominated forest, 0.90 mm tree 1 y 1 for transitional forest, 1.36 mm tree 1 y 1 for mixed species forest, and 0.97 mm tree 1 y 1 for riparian forest. These figures indicate that, for this dataset, and relative to the figures shown in Table 1, the smallest diameter stems reduce average growth rates by approximately 14%, 17%, 17%, and 13%, respectively. Figure 7 suggests that diameter growth increases somewhat monotonically with tree size. When paired with previous studies on understory Gilbertiodendron growth response [14,29], the limited yet positive gains made by small diameter stems support the hypothesis that these stems are advance regeneration [48]. That fewer large diameter stems (stems ≥105 cm) exist in mixed species and transitional forest types, is what we would expect if increasing Gilbertiodendron density leads to structural changes and reclassification as transitional or Gilbertiodendron-dominated forest. Note that this analysis does not include stems <1 cm DBH, masking the effects of the smallest seedlings on perceptions of recruitment, mortality, and persistence.
Relative recruitment (i.e., the proportion of Gilbertiodendron stems that were new recruits at a given census) displayed a statistically significant positive trend for all forest types (Figure 8a), and both mixed and riparian forest were significantly different from the others. Recruitment was lowest for riparian quadrats, where the odds ratio increased by 3.9% ± 3.7/4.0% per year. If explanatory terms other than time are held constant at their mean values, the raw proportion (not odds ratio) of new recruits increased at a rate of 0.4% ± 0.4% per year, based on the one-year period surrounding 2001 (the median study year). Mixed species forest exhibited the most pronounced trend (O.R. = 8.3% ± 6.5/7.1% per year, raw % = 0.8% ± 0.7/0.6%).
In modeling the relative mortality of Gilbertiodendron stems, we found that no forest type exhibited significant changes over time (Figure 8b). In combination with our models of recruitment, this may suggest that there is a small net increase in the number of Gilbertiodendron stems over time. Mortality was lowest in riparian forest and greatest in mixed species forest. For riparian forest, the odds increased at a rate of 0.991% ± 4.1/3.8% per year, which is to say that mortality decreased across time. In holding the non-temporal explanatory terms constant at their means while looking in the one year period around 2001, this equates to a change of −0.02% ± 0.01% per year in the raw proportion of stems that died. As with recruitment, mixed species forest also exhibited the most pronounced trend in mortality, and displayed the only positive and significantly different trend among the four forest types. This is not unreasonable given that greater recruitment (see Figure 6) may well lead to greater mortality (O.R. = 15.8% ± 21.6/18.6% per year, raw % = 0.33% ± 0.39/0.38% per year).

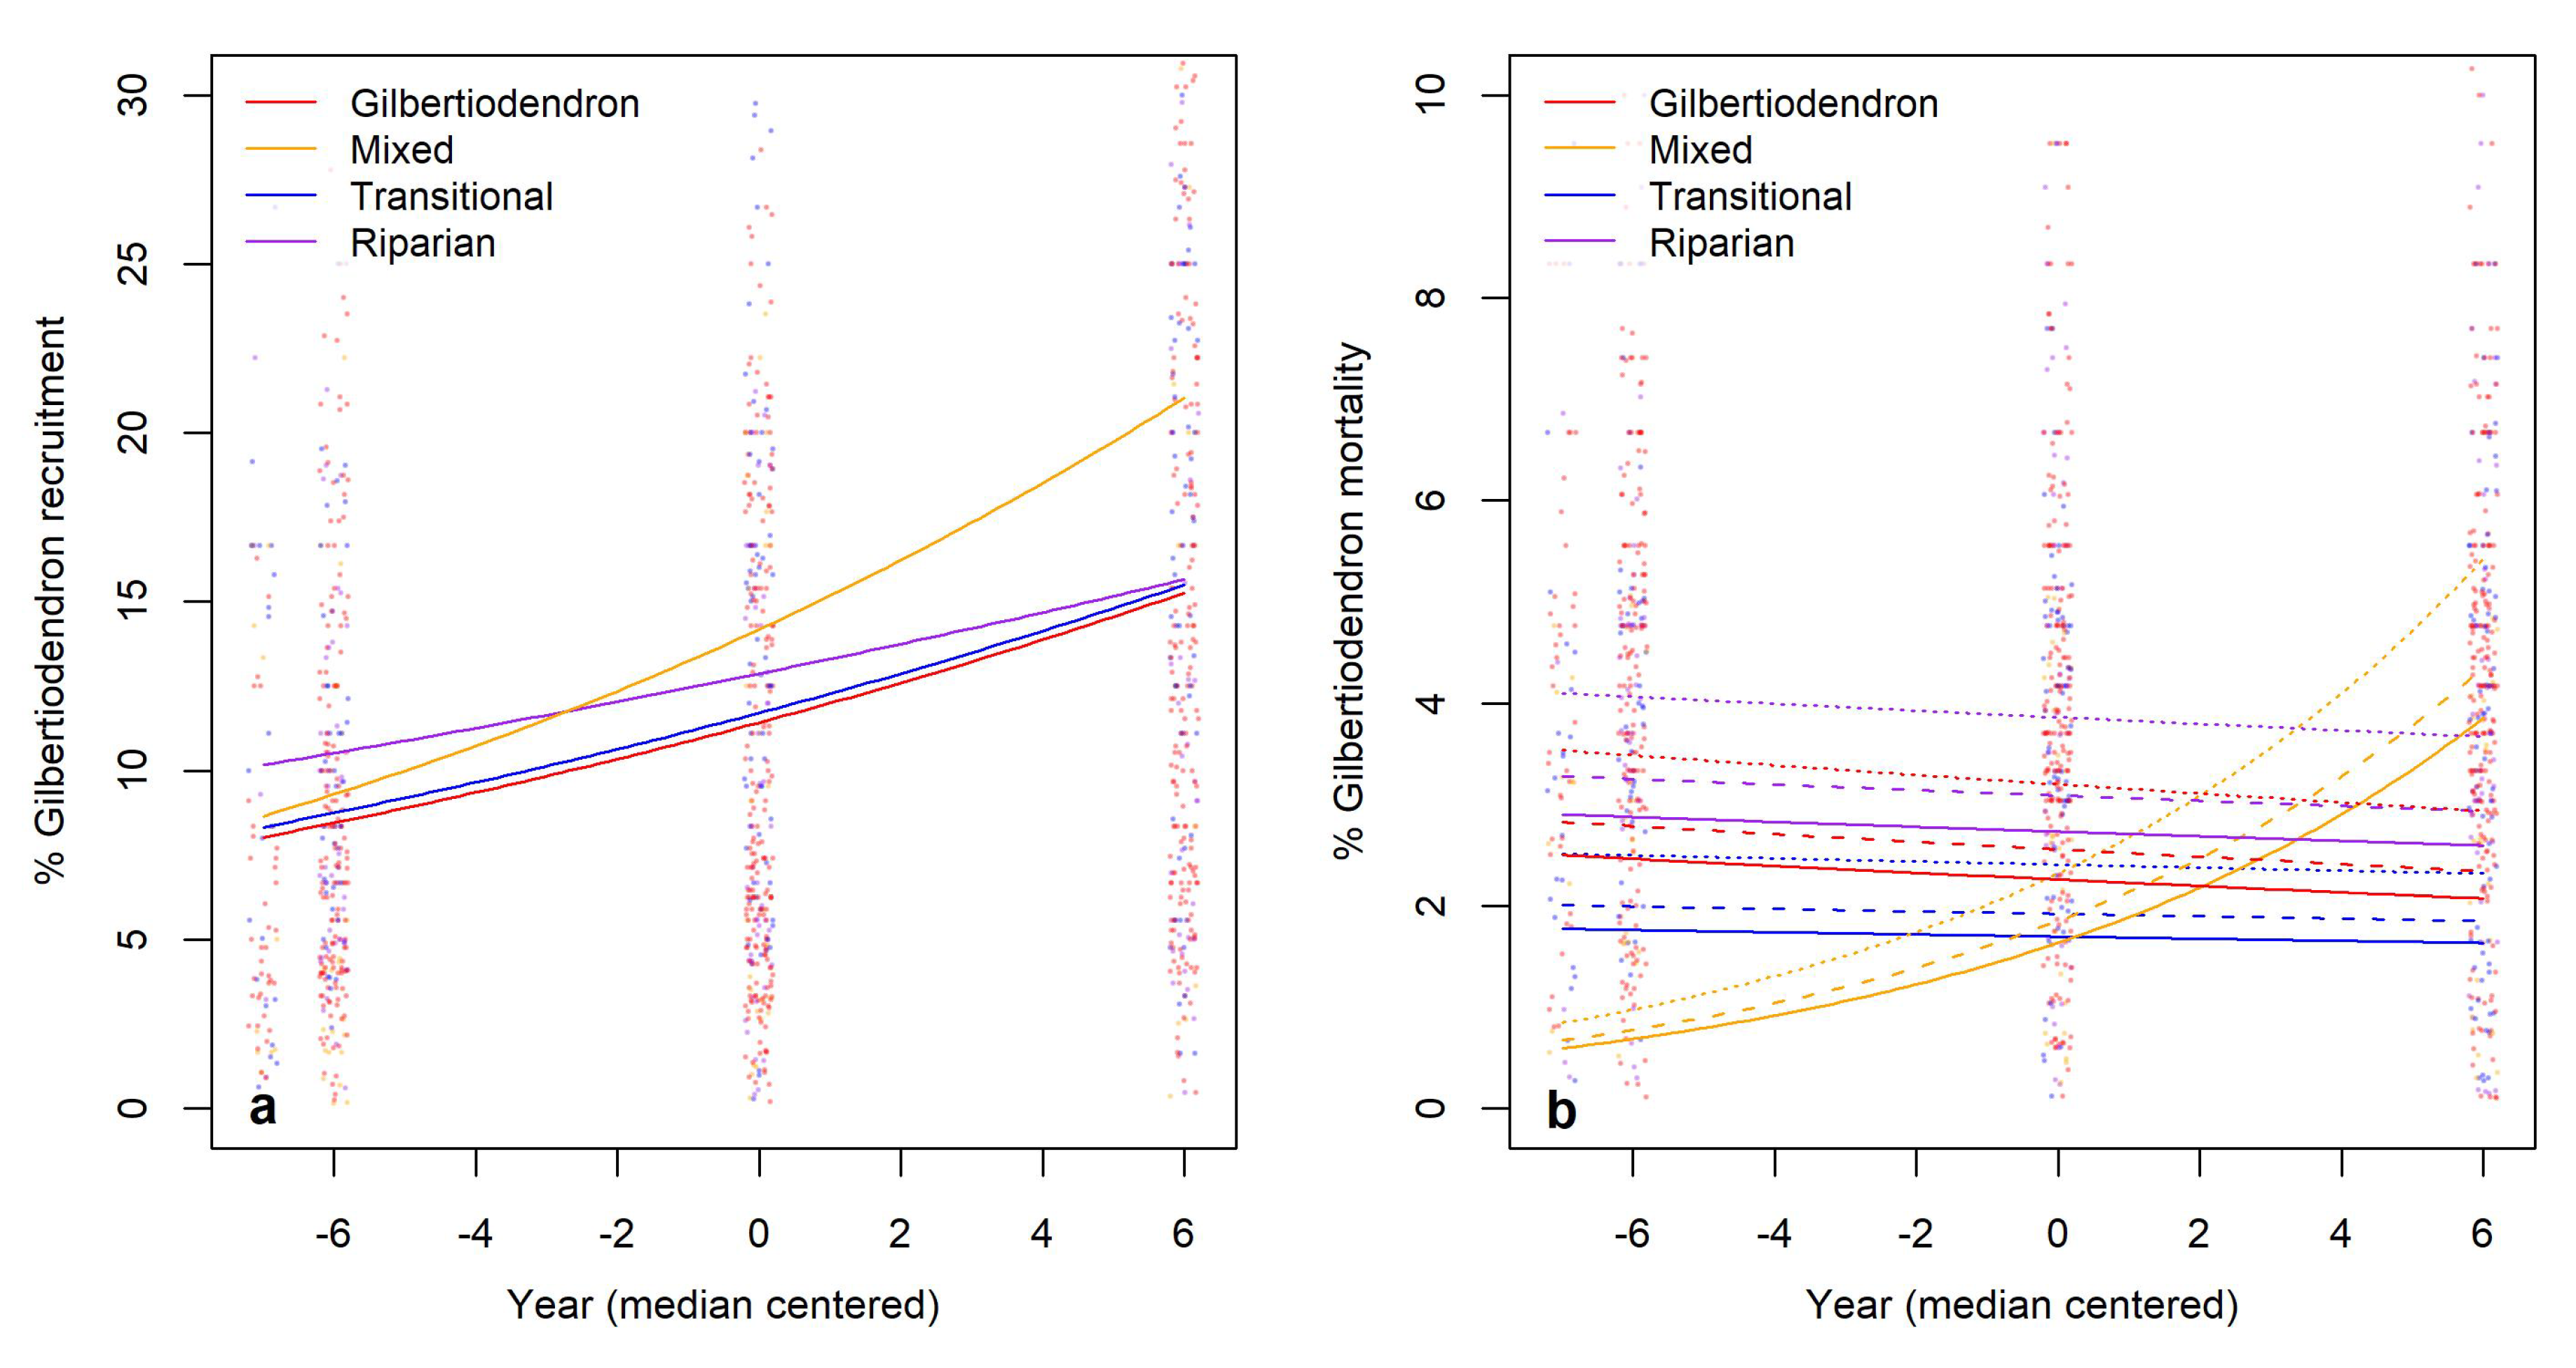
3.4. Hypotheses Related to Development and Geographic Expansion

Of the total number of quadrats that could have changed forest class ( n = 960 ), 19 distinct shifts were observed across the three field sites that contained Gilbertiodendron (Figure 9). Of these 19 shifts, 15 followed the developmental gradient we hypothesized, of mixed species forest shifting into transitional forest, and of transitional forest shifting into Gilbertiodendron-dominated forest. Of the four quadrats that exhibited a different pattern, all were in lenda2. Two vacillated between transitional forest and Gilbertiodendron-dominated forest, suggesting that these quadrats fell on classification thresholds, while the other two fell in an area that appeared to be shifting in structure at the time. The remaining quadrat may reflect mature forest gap dynamics [52]. Our two-sample permutation test of proportions revealed that the proportion of quadrats following our hypothesized developmental gradient (15/19 = 79%) was significantly greater ( p < 0.001 ) than that which did not (4/19 = 21%).

4. Discussion

Collectively, our findings support the overarching hypothesis that Gilbertiodendron dewevrei is a dominant driver of forest development in the Ituri region. They provide compelling evidence of the growth and geographic expansion of monodominant stands into mixed species forest, and are consistent with both a recent model of Gilbertiodendron stand dynamics [28], as well as with functional traits related to the species’ plasticity of light capture [28,29] and water use regulation [35].

4.1. AGB and BA

While slightly higher, our estimates of AGB for mixed species and riparian forest types align well with the mean AGB for Central African closed canopy forests [25,53,54]. However, our estimates for transitional and Gilbertiodendron-dominated forest are greater than AGB estimates from intact closed-canopy old-growth tropical forests in Amazonia [55], East Asia [56], and Central Africa at large [25], showing the relative importance of Gilbertiodendron-dominated forests in short-term carbon sequestration. Our estimates also align well with the significantly greater AGB that has been found in Gilbertiodendron-dominated forest relative to non-Gilbertiodendron-dominated forest (514.9 versus 384.1 Mg ha 1 in [25], and 596.1 Mg ha 1 versus 401.7 Mg ha 1 in [54]). Our estimates of BA ha 1 follow a similar pattern to that presented in Djuikouo [54], in which Gilbertiodendron-dominated forest showed significantly greater BA ha 1 than mixed species forest (“terra firme forest”) while riparian forest (“periodically flooded forest”) did not differ significantly from the mixed species forest. Despite differences in data aggregation and analytical strategies, our results for total AGB are generally in agreement with those of Makana et al. [1].
That our estimated rates of AGB change are not significant (excepting mixed species forest), and are not significantly different between forest types, which is similar to Cuni-Sanchez et al.’s [53] findings. As with our study, they found that within-forest class variability had greater swamped changes than that between forest classes, though their focus on the succession of savanna to mixed Marantaceae hlforest in Gabon is a different developmental process than that found at Ituri. Importantly, our lower and nonsignificant rate of AGB accumulation within Gilbertiodendron-dominated forests is certainly influenced by mortality. As a long-lived, canopy-bound species, larger Gilbertiodendron stems may show signs of decadence and are subject to natural disturbance. It has been hypothesized that the uniformity of monodominant forest canopy reduces susceptibility to wind damage [15], but it does not eliminate it completely [19]. During the inspection of outlying residual values associated with our regression analyses, we found that unusual values were associated with triplets of records (one for each census year) in which AGB (or BA) dropped substantially relative to a previous benchmark. Given our data aggregation strategy, this speaks to the sheer quantity of biomass held by individual stems in our field sites. A number of tropical forest studies have found AGB to be strongly correlated with the number of large stems (≥70 cm; [54], and references therein), and similar plot-level reductions in AGB from the loss of large trees has been observed in other studies [53]. In mixed species and transitional forest, there is a proportionally greater number of stems in small size classes compared to Gilbertiodendron-dominated forest (Figure 6), so the loss of an individual tree has a proportionally smaller impact on cumulative AGB or BA. This aligns with Makana et al.’s [1] finding that the gains in AGB were nearly entirely due to the growth of existing trees and not due to new recruits.

4.2. Species Diversity and Stem Density

A broad trend towards increasing monodominance and AGB storage is also captured by our species diversity and stem density metrics. Our significantly lower species diversity for Gilbertiodendron-dominated forest, relative to the two mixed species forest types, aligns well with both Djuikouo et al.’s [54] (c.f. Table 1) and Peh et al.’s [51] work in Southeastern Cameroon (c.f. Table 2), and with Kearsley et al.’s [35] work in central Democratic Republic of the Congo (c.f. Table 1). Note, however, that there is appreciable variation in the floristic associations of Gilbertiodendron-dominated forest across Central Africa. With respect to our findings from the Ituri region, this variation is captured, for example, by the wide separation in species diversity between Peh et al.’s [51] monodominant and mixed species plots, which themselves contained no Gilbertiodendron, and by Fayolle et al.’s [50] work across Cameroon, the Central African Republic, and the Republic of Congo, in which Gilbertiodendron-dominated forest was only sparsely distributed along rivers.
Our findings align with Peh et al.’s [51] reported size class distributions for Gilbertiodendron-dominated and mixed species forest (c.f. Figure 2), and with the typical reverse-J shape associated with old-growth tropical forests [50] and with mature forests generally [48,49]. Our diversity and stem density measures align with Gilbertiodendron’s known growth patterns, in which Gilbertiodendron stands form dense, deep canopies with a more open understory structure [1,7,14]. In the highly light-restricted understory, seedlings of this species can often out-compete those of other species, including other leguminous late-emergent species such as Julbernardia seretii [10,14,15,28], leading to a reduction in species diversity (see Supplementary Material § Mechanistic Synthesis). In part, this may be related to the robust growth of Gilbertiodendron seedlings in rich light conditions, which, in turn, alter the light environments of smaller competitors [28].

4.3. Succession and Geographic Expansion

With respect to forest development and the geographic expansion of monodominant forest into mixed species forest, we found clear evidence that Gilbertiodendron is a driving forest structure along a uni-directional trajectory. Many of the observed class changes occurred on patch peripheries, as might be expected. This aligns well with Hart’s [14] observation of increased Gilbertiodendron seed survival rates at the peripheries of conspecific mast areas, and with Hall et al.’s [28] conceptual model suggesting that transition between forest types is a function of plasticity of light capture, among other things. The changes we observed reflect the “edge diffusion” developmental pattern discussed by Favier et al. [57] in their work on savanna–forest transitions in coastal Republic of the Congo, and observed in other parts of tropical Africa (e.g., [58,59,60,60]). A single forest class conversion that occurred in a patch interior may reflect secondary forest gap dynamics [52], and this requires further exploration.
Hart et al. [10,19] remark that the slow growth rates and poorly dispersed seeds of Gilbertiodendron should “mitigate against rapid colonization” [19] (p. 557). However, our results indicate that this forest is experiencing notable developmental change across a relatively short period of time. Other studies surrounding the DRC, although focused on savanna–forest ecotones, have also detected developmental shifts across relatively short time periods [61]. It may be that our observed changes in forest class are a function of how we defined those classes, and we know that developmental pathways are highly influenced by land-use history, local conditions, and anthropogenic factors [57,61]. Consider, for instance, Cuni-Sanchez et al.’s work [53], which, while focused on transitional savanna in Gabon, provides an apt contrast to our findings and those cited by Mitchard et al. [61]. Across 20 years of monitoring (contemporaneous with the present study), they were unable to identify even a single field plot that could be reclassified into the subsequent successional forest type.

4.4. Support for Existing Developmental Dynamics Frameworks

The general similarities in stem density, BA change, AGB change, DBH growth, and mortality measures between Gilbertiodendron-dominated forest and riparian forest, as portrayed in Table 1 and Figure 5 and Figure 6, provide support for the idea that our riparian forest class is not sufficiently distinct from our Gilbertiodendron-dominated forest class to warrant isolation. Our riparian forest appears to be largely dominated by Gilbertiodendron stems, and this aligns well with a number of studies that link the species to riparian sites and water use traits.
Fayolle et al. [50] found Gilbertiodendron to be sparsely distributed along rivers in the Republic of Congo, and to a lesser extent in Southeastern Cameroon and Southern Central African Republic. Letouzey ([50,62]) distinguished Gilbertiodendron-dominated forest along rivers from upland mixed species forest. Gèrard [5], as cited in [28], found Gilbertiodendron to have a deep tap root, which may facilitate deep ground water extraction and lead to establishment on sites with lower water tables. This aligns with Kearsley et al.’s [35] study of functional traits in the North-Central Democratic Republic of Congo, which ties Gilbertiodendron to riparian sites through its poor ability to regulate water use. Hall et al. [28] have integrated moisture limitations into their conceptual model of Gilbertiodendron stand dynamics, highlighting how moisture availability may help shape the species’ distribution. To better test Gilbertiodendron’s association with riparian sites, future efforts similar to that presented here might benefit from evaluating results across a range of spatial grains (i.e., spatial scale analysis).
With respect to Hall et al.’s [28] model, our findings are consistent with the notion that plasticity in light acquisition provides seedlings with a competitive advantage to recruit and release at different light levels. This can be inferred, albeit weakly, from our results that follow a developmental gradient, which itself embodies a gradient of light availability across forest classes (c.f. [15,29], see also Supplementary Material § Mechanistic Synthesis). Our findings are also consistent with the idea that light-rich environments (i.e., our mixed species forest, relative to our monodominant forest) lead to an abundance of large seedlings that shape the light environments of smaller competitors, as can be seen in our estimates of stem density in relation to the developmental gradient. The general idea of large seeds leading to limited dispersal and gregarious habit [15,28] is also indirectly supported by our spatial visualizations (Figure 9), and by the locations of forest class transitions, which largely occurred on patch peripheries.
Historically, forest stand dynamics have been viewed through one of two major developmental pathways: relay floristics and initial floristics, or complete initial floristics [48,63,64]. The former takes a more holistic view of ecology, where “succession is interpreted teleologically as the process of development of an ecosystem of maximum stability (by the yardstick of resistance to disturbance) and of maximum efficiency in the utilization of resources” ([65], p. 109). Allow that in the absence of additional disturbance, a relay floristics developmental trajectory ultimately culminates in what is viewed as a steady state, variously referred to as a “climax” or “late successional” community [48,66]. In isolation, relay floristics is an idealization of sequential developmental stages that rarely appear in nature. In contrast, initial floristics is more reductionist, with “sequential physiognomic dominance of the site by species with different life histories, growth rates and sizes at maturity” ([65], p. 110). More recently, Egler’s [63] initial floristics paradigm has been reframed by Wilson et al. [64,67] as “complete initial floristics” and “preemptive initial floristics”, akin to what Connell and Slayter [68] refer to as the “inhibition” model of development.
In considering the manner in which Gilbertiodendron extends its grasp on the surrounding mixed species forest, the developmental process at Ituri is a unique combination of initial floristics and relay floristics with a “climax” or “pseudo-climax” phase. In the absence of major disturbance, mixed species forest is prevalent in the region and provides what appears to be a multicohort, vertically stratified base. As viewed through the lens of initial floristics [63,64,67], Gilbertiodendron has been present in the region over recent history, though we know that, at a local level, some sites (e.g., the edoro2 field plot) contain no Gilbertiodendron, and we have little evidence of the species’ long-term historical presence at Ituri [19]. Gilbertiodendron’s notable tolerance of deep shade leads to abundant, albeit slow growing, understory growth [14]—both seedling and sapling advance regeneration [48]. Here, mast fruit germinates, whether during understory reinitiation or otherwise, and then grows slowly under restrictive conditions. When paired with the resource use efficiencies described above, the advance regeneration responds well when released from competition, growing vigorously [28,29]. Where Gilbertiodendron seedlings are present, they may appear in high numbers, leading to typical, if protracted, stem exclusion dynamics as the advance regeneration makes slow upward gains. Without holding too tightly onto a definition, these life history traits generally follow a preemptive initial floristics stand development pathway.
While Gilbertiodendron stands possess some of the characteristics associated with preemptive initial floristics [64], we are still faced with a slow conversion from mixed species forest to monodominant forest, and an apparent “succession to climax”. While the present study was not focused on the developmental pathways leading to Ituri’s mixed species assemblages, for decades, it has been thought that Gilbertiodendron slowly establishes itself in mixed species forest, displacing other species in its path to dominance [6,14,29]. Dominance is then sustained through the mechanisms described in the Supplementary Material (§ Mechanistic Synthesis) and summarized by Hall et al. [28]. Of interest here, is the manner in which Gilbertiodendron indirectly suppresses other species by creating microsite conditions withstood by only the extremely shade tolerant [28] (c.f. [69,70]). In this way, in the presence of Gilbertiodendron, the forests of Ituri progress from mixed species assemblages to monodominance, but then fail to advance further. It is for this reason that we describe Gilbertiodendron as a type I monodominant [17]. Only Peh et al. [51] have considered violations of persistent monodominance, though their findings do not implicate the potential for any local species to disrupt the monodominant canopy structure through widespread competition. In the absence of major disturbances, we lack evidence that this species will be succeeded by any other [10], making Gilbertiodendron a “climax” species on many sites.
In isolation, historical stand development paradigms do not sufficiently describe the dynamics on the Ituri landscape—a single model has never served forest ecology well. Instead, the stand development visible at Ituri follows heterogeneous pathways on a site-by-site basis, driven, in part, by initial floristic composition; gap dynamics [52,71]; resource gradients; advance regeneration; and, through the developmental modes of advancement, relay floristics. The complement of stand development mechanisms at play reflects a more modern perspective on forest stand dynamics, in which a suite of autogenic and allogenic agents lead to a stochastic process of canopy openings, regeneration, and closure [48]. These mechanisms, in concert with the supporting literature and general growth traits we identify above, have produced what appear to be uneven-aged (multi-cohort), vertically stratified, closed-canopy stands in all of the Ituri field plots (with the noted absence of Gilbertiodendron at the edoro2 field plot). However, it is important to recognize that variability in tree age with respect to other biometrics (e.g., DBH) has not yet been studied, and we currently lack a definitive understanding of the age distributions of the forests at Ituri. Hubau et al. [72] and Baker et al. [73] reveal that age distributions within stratified tropical forests are not always what they seem. This represents a potentially fruitful area of research, in that recharacterization of uneven-aged stands into even-aged stands would necessitate a reframing of Gilbertiodendron’s developmental dynamics and persistence.
The present work captures only a coarse approximation of developmental patterns over time and space, and does not preclude the possibility of (a) another species surpassing Gilbertiodendron’s stature and rate of growth through response to local-level environmental conditions; or (b) a finite end to monodominant patch expansion caused by the interaction of autogenic and allogenic constraints. We did not directly focus on either of these topics, but they are important lines of inquiry for future research. Similarly, we did not seek to evaluate the persistence or ephemerality of small diameter stems and how their presence may or may not influence perceptions of stand-level recruitment and mortality. Additional research is needed in expanding previous recruitment and growth response studies by Hart [14], and Makana and Thomas [29].

5. Conclusions

Patterns of structural change associated with monodominant tropical forest complexes have remained enigmatic for decades. In an effort to better understand the temporal trends and spatial patterns of lowland tropical rain forest in central Africa, we have built on previous research (e.g., [7,10,11,15,16]) to provide a long-term, fine-scale assessment of forest dynamics in the Ituri region. We revealed subtle but consistent patterns of developmental aggradation, with evidence that Gilbertiodendron dewevrei is a controlling determinant of the forest structure and species composition in this region. Changes within a Gilbertiodendron-dominated forest, relative to the adjacent and more diverse mixed species forest assemblages, were not as pronounced as we had anticipated. However, our findings are unified in reflecting net positive change in BA, AGB, and Gilbertiodendron sapling recruitment in the absence of clear changes in overall stem density and Gilbertiodendron mortality. When looking across a developmental gradient based on Gilbertiodendron presence, we found patterns consistent with the hypothesized expansion of this species. The present work has demonstrated the utility of analyzing both across and within large field plots, and has highlighted the need to explore the spatiotemporal dynamics of Gilbertiodendron and other tropical dominants. It is clear that at least some species drive predictable patterns of change in tropical forests, and future efforts may benefit from viewing such changes through a geographic lens.

Supplementary Materials

The following are available online at https://0-www-mdpi-com.brum.beds.ac.uk/article/10.3390/f12060738/s1: § Methodological details, § Mechanistic synthesis

Author Contributions

P.M.U., H.B.G., and J.-R.M. were responsible for conceptualization, with contributions from T.G.G., S.C.T., and J.D.R.-S.; P.M.U., J.-R.M., and S.C.T. performed field-based investigation; H.B.G. and P.M.U. developed and implemented the methodology and formal analysis, with statistical support from T.G.G. and J.D.R.-S.; H.B.G. and P.M.U. wrote the original draft; all authors contributed to writing—review and editing—and approved of the final manuscript prior to submission. All authors have read and agreed to the published version of the manuscript.

Funding

This research was indirectly supported by the Yale School of the Environment.

Institutional Review Board Statement

Not applicable.

Informed Consent Statement

Not applicable.

Data Availability Statement

The research relied on data from the Ituri Forest Dynamic Plots curated by the Smithsonian Tropical Research Institute’s Forest Global Earth Observatory (ForestGEO), currently comprising 67 long-term forest monitoring plots. The data are available to researchers upon reasonable request through the ForestGEO data request platform, located at https://forestgeo.si.edu/sites/africa/ituri (accessed on 2 June 2021), and through correspondence with the plot principal investigators: Corneille E. N. Ewango ([email protected]) and Jean-Remy Makana ([email protected]). Limitations of use and requirements associated with publication of analyses derived from the Ituri plot data can be found at the aforementioned URL.

Acknowledgments

In partnership with the Smithsonian Tropical Research Institute’s Forest Global Earth Observatory (ForestGEO), the Ituri Forest Dynamics Plots program is a collaborative effort between the Centre de Formation et de Recherche en Conservation Forestière and the Wildlife Conservation Society–DRC (WCS), through its conservation project in the Okapi Faunal Reserve. The Ituri field plots are financially supported by the WCS, the Frank Levinson Family Foundation, and ForestGEO. The Institut Congolais pour la Conservation de la Nature (ICCN) graciously provided the research permit. The Ituri field plots received critical long-term contributions from Terese A. and John B. Hart and from Corneille E. N. Ewango. The authors are grateful to Corneille Ewango for his contributions to field work and botanical identification of tree species; to Jacob Madidi, Floribert Bujo, Jacques Mukinzi, Victor Lubuku, and Dieudonné Batido for their assistance with field work; to Suzanne Lao and Marie-Noelle Ndiu for their assistance with data entry and management; and to Chad Oliver and peer referees for their comments and suggestions.

Conflicts of Interest

The authors declare no conflict of interest. The funders had no role in the design of the study; in the collection, analyses, or interpretation of data; in the writing of the manuscript; or in the decision to publish the results.

References

  1. Makana, J.R.; Ewango, C.N.; McMahon, S.M.; Thomas, S.C.; Hart, T.B.; Condit, R. Demography and biomass change in monodominant and mixed old-growth forest of the Congo. J. Trop. Ecol. 2011, 27, 447–461. [Google Scholar] [CrossRef]
  2. Lewis, S.L.; Lopez-Gonzalez, G.; Sonké, B.; Affum-Baffoe, K.; Baker, T.R.; Ojo, L.O.; Phillips, O.L.; Reitsma, J.M.; White, L.; Comiskey, J.A. Increasing carbon storage in intact African tropical forests. Nature 2009, 457, 1003. [Google Scholar] [CrossRef] [PubMed]
  3. Davis, T.; Richards, P.W. The vegetation of Moraballi Creek, British Guiana: An ecological study of a limited area of tropical rain forest. Part II. J. Ecol. 1934, 106–155. [Google Scholar] [CrossRef]
  4. Beard, J. The Mora forests of Trinidad, British West Indies. J. Ecol. 1946, 173–192. [Google Scholar] [CrossRef]
  5. Gérard, P. Etude Ècologique de la Forêt Dense à Gilbertiodendron dewevrei dans la Région de l’Uele; Institut national pour l’étude agronomique du Congo: Brussels, Belgium, 1960. [Google Scholar]
  6. Hart, T.B. THE Ecology of a Single-Species-Dominant Forest and of a Mixed Forest in Zaire, Africa. Ph.D. Thesis, Michigan State University, East Lansing, MI, USA, 1985. [Google Scholar]
  7. Makana, J.R.; Terese, B.; Hibbs, D.; Condit, R.; Losos, E.; Leigh, E. Stand structure and species diversity in the Ituri forest dynamics plots: A comparison of monodominant and mixed forest stands. In Tropical Forest Diversity and Dynamism: Findings from a Large-Scale Plot Network; University of Chicago Press: Chicago, IL, USA, 2004; Chapter 12; pp. 159–174. [Google Scholar]
  8. Day, M.; Baldauf, C.; Rutishauser, E.; Sunderland, T.C. Relationships between tree species diversity and above-ground biomass in central African rainforests: Implications for REDD. Environ. Conserv. 2013, 41, 64–72. [Google Scholar] [CrossRef]
  9. Lewis, S.L.; Malhi, Y.; Phillips, O.L. Fingerprinting the impacts of global change on tropical forests. Philos. Trans. R. Soc. London. Ser. B 2004, 359, 437–462. [Google Scholar] [CrossRef] [PubMed]
  10. Hart, T.B.; Hart, J.A.; Murphy, P.G. Monodominant and species-rich forests of the humid tropics: Causes for their co-occurrence. Am. Nat. 1989, 133, 613–633. [Google Scholar] [CrossRef]
  11. Peh, K.S.H.; Sonké, B.; Lloyd, J.; Quesada, C.A.; Lewis, S.L. Soil does not explain monodominance in a Central African tropical forest. PLoS ONE 2011, 6, e16996. [Google Scholar] [CrossRef]
  12. Lokonda, M.; Freycon, V.; Gourlet-Fleury, S.; Kombele, F. newblock Are soils under monodominant Gilbertiodendron dewevrei and under adjacent mixed forests similar? A case study in the Democratic Republic of Congo. J. Trop. Ecol. 2018, 34, 176–185. [Google Scholar] [CrossRef]
  13. Maley, J. A catastrophic destruction of African forests about 2500 years ago still exerts a major influence on present vegetation formations. IDS Bull. 2002, 33, 13–30. [Google Scholar] [CrossRef]
  14. Hart, T.B. Seed, seedling and sub-canopy survival in monodominant and mixed forests of the Ituri Forest, Africa. J. Trop. Ecol. 1995, 11, 443–459. [Google Scholar] [CrossRef]
  15. Torti, S.D.; Coley, P.D.; Kursar, T.A. Causes and consequences of monodominance in tropical lowland forests. Am. Nat. 2001, 157, 141–153. [Google Scholar] [CrossRef] [PubMed]
  16. Tovar, C.; Harris, D.J.; Breman, E.; Brncic, T.; Willis, K.J. Tropical monodominant forest resilience to climate change in Central Africa: A Gilbertiodendron dewevrei forest pollen record over the past 2700 years. J. Veg. Sci. 2019, 30, 575–586. [Google Scholar] [CrossRef]
  17. Connell, J.H.; Lowman, M.D. Low-diversity tropical rain forests: Some possible mechanisms for their existence. Am. Nat. 1989, 134, 88–119. [Google Scholar] [CrossRef]
  18. Hart, T.B. Monospecific dominance in tropical rain forests. Trends Ecol. Evol. 1990, 5, 6–11. [Google Scholar] [CrossRef]
  19. Hart, T.B.; Hart, J.A.; Dechamps, R.; Fournier, M.; Ataholo, M. Changes in forest composition over the last 4000 years in the Ituri basin, Zaire. In The Biodiversity of African Plants; van der Maesen, L.J.G., van der Burgt, X.M., van Medenbach de Rooy, J.M., Eds.; Springer: Wageningen, The Netherlands, 1996; pp. 545–560. [Google Scholar] [CrossRef]
  20. Read, J.; Hallam, P.; Cherrier, J.F. The anomaly of monodominant tropical rainforests: Some preliminary observations in the Nothofagus-dominated rainforests of New Caledonia. J. Trop. Ecol. 1995, 11, 359–389. [Google Scholar] [CrossRef]
  21. Chave, J.; Condit, R.; Muller-Landau, H.C.; Thomas, S.C.; Ashton, P.S.; Bunyavejchewin, S.; Dattaraja, H.S.; Davies, S.J.; Esufali, S.; Ewango, C.E. Assessing evidence for a pervasive alteration in tropical tree communities. PLoS Biol. 2008, 6, e45. [Google Scholar] [CrossRef]
  22. Nelson, B.W. Pervasive alteration of tree communities in undisturbed Amazonian forests. Biotropica 2005, 37, 158–159. [Google Scholar] [CrossRef]
  23. Wright, S.J. Tropical forests in a changing environment. Trends Ecol. Evol. 2005, 20, 553–560. [Google Scholar] [CrossRef]
  24. Sullivan, M.J.; Talbot, J.; Lewis, S.L.; Phillips, O.L.; Qie, L.; Begne, S.K.; Chave, J.; Cuni-Sanchez, A.; Hubau, W.; Lopez-Gonzalez, G. Diversity and carbon storage across the tropical forest biome. Sci. Rep. 2017, 7, 39102. [Google Scholar] [CrossRef]
  25. Lewis, S.L.; Sonké, B.; Sunderl, T.; Begne, S.K.; Lopez-Gonzalez, G.; Van Der Heijden, G.M.; Phillips, O.L.; Affum-Baffoe, K.; Baker, T.R.; Banin, L.; et al. Above-ground biomass and structure of 260 African tropical forests. Philos. Trans. R. Soc. B 2013, 368, 20120295. [Google Scholar] [CrossRef]
  26. Bauters, M.; Vercleyen, O.; Vanlauwe, B.; Six, J.; Bonyoma, B.; Badjoko, H.; Hubau, W.; Hoyt, A.; Boudin, M.; Verbeeck, H.; et al. Long-term recovery of the functional community assembly and carbon pools in an African tropical forest succession. Biotropica 2019, 51, 319–329. [Google Scholar] [CrossRef]
  27. Umunay, P.; Gregoire, T.; Ashton, M. Estimating biomass and carbon for Gilbertiodendron dewevrei (De Wild) Leonard, a dominant canopy tree of African tropical rainforest: Implications for policies on carbon sequestration. For. Ecol. Manag. 2017, 404, 31–44. [Google Scholar] [CrossRef]
  28. Hall, J.S.; Harris, D.J.; Saltonstall, K.; Medjibe, V.d.P.; Ashton, M.S.; Turner, B.L. Resource acquisition strategies facilitate Gilbertiodendron dewevrei monodominance in African lowland forests. J. Ecol. 2019. [Google Scholar] [CrossRef]
  29. Makana, J.R.; Thomas, S.C. Effects of Light Gaps and Litter Removal on the Seedling Performance of Six African Timber Species. Biotropica J. Biol. Conserv. 2005, 37, 227–237. [Google Scholar] [CrossRef]
  30. Djuikouo, M.N.K.; Peh, K.S.H.; Nguembou, C.K.; Doucet, J.L.; Lewis, S.L.; Sonké, B. Stand structure and species co-occurrence in mixed and monodominant Central African tropical forests. J. Trop. Ecol. 2014, 30, 447–455. [Google Scholar] [CrossRef]
  31. Chave, J.; Condit, R.; Lao, S.; Caspersen, J.P.; Foster, R.B.; Hubbell, S.P. Spatial and temporal variation of biomass in a tropical forest: Results from a large census plot in Panama. J. Ecol. 2003, 91, 240–252. [Google Scholar] [CrossRef]
  32. Makana, J.R.; Hart, T.; Liengola, I.; Ewango, C.; Hart, J.; Condit, R. Ituri forest dynamics plots, Democratic Republic of Congo. In Tropical Forest Diversity and Dynamism: Findings from a Large-Scale Plot Network; University of Chicago Press: Chicago, IL, USA, 2004; Chapter 28; pp. 492–505. [Google Scholar]
  33. Muller-Landau, H.C. Interspecific and inter-site variation in wood specific gravity of tropical trees. Biotropica 2004, 36, 20–32. [Google Scholar] [CrossRef]
  34. Condit, R. Tropical Forest Census Plots: Methods and Results from Barro Colorado Island, Panama and a Comparison with Other Plots; Springer: Berlin/Heidelberg, Germany, 1998. [Google Scholar]
  35. Kearsley, E.; Verbeeck, H.; Hufkens, K.; Van de Perre, F.; Doetterl, S.; Baert, G.; Beeckman, H.; Boeckx, P.; Huygens, D. Functional community structure of African monodominant Gilbertiodendron dewevrei forest influenced by local environmental filtering. Ecol. Evol. 2017, 7, 295–304. [Google Scholar] [CrossRef]
  36. Fitzmaurice, G.; Laird, N.; Ware, J. Applied Longitudinal Analysis; Wiley Series in Probability and Statistics; John Wiley & Sons, Inc.: Hoboken, NJ, USA, 2004. [Google Scholar]
  37. Jelinski, D.E.; Wu, J. The modifiable areal unit problem and implications for landscape ecology. Landsc. Ecol. 1996, 11, 129–140. [Google Scholar] [CrossRef]
  38. Kieschnick, R.; McCullough, B.D. Regression analysis of variates observed on (0, 1): Percentages, proportions and fractions. Stat. Model. 2003, 3, 193–213. [Google Scholar] [CrossRef]
  39. Ferrari, S.; Cribari-Neto, F. Beta regression for modelling rates and proportions. J. Appl. Stat. 2004, 31, 799–815. [Google Scholar] [CrossRef]
  40. Berger, S.; Graham, N.; Zeileis, A. Various versatile variances: An object-oriented implementation of clustered covariances in R. In Report, Working Papers in Economics and Statistics; University of Innsbruck: Innsbruck, Austria, 2017; Volume 12. [Google Scholar]
  41. Arellano, M. Practitioner’s Corner: Computing robust standard errors for within-groups estimators. Oxf. Bull. Econ. Stat. 1987, 49, 431–434. [Google Scholar] [CrossRef]
  42. Liang, K.Y.; Zeger, S.L. Longitudinal data analysis using generalized linear models. Biometrika 1986, 73, 13–22. [Google Scholar] [CrossRef]
  43. Cameron, A.C.; Gelbach, J.B.; Miller, D.L. Robust inference with multiway clustering. J. Bus. Econ. Stat. 2011, 29, 238–249. [Google Scholar] [CrossRef]
  44. Chave, J.; Andalo, C.; Brown, S.; Cairns, M.A.; Chambers, J.; Eamus, D.; Fölster, H.; Fromard, F.; Higuchi, N.; Kira, T. Tree allometry and improved estimation of carbon stocks and balance in tropical forests. Oecologia 2005, 145, 87–99. [Google Scholar] [CrossRef]
  45. Baskerville, G. Use of logarithmic regression in the estimation of plant biomass. Can. J. For. Res. 1972, 2, 49–53. [Google Scholar] [CrossRef]
  46. Millard, S.P. EnvStats: An R Package for Environmental Statistics; Springer: New York, NY, USA, 2013. [Google Scholar]
  47. Muller-Landau, H.C.; Condit, R.S.; Harms, K.E.; Marks, C.O.; Thomas, S.C.; Bunyavejchewin, S.; Chuyong, G.; Co, L.; Davies, S.; Foster, R.; et al. Comparing tropical forest tree size distributions with the predictions of metabolic ecology and equilibrium models. Ecol. Lett. 2006, 9, 589–602. [Google Scholar] [CrossRef]
  48. Oliver, C.D.; Larson, B.C. Forest Stand Dynamics; John Wiley & Sons Inc.: Hoboken, NJ, USA, 1996. [Google Scholar]
  49. Niklas, K.J.; Midgley, J.J.; Rand, R.H. Tree size frequency distributions, plant density, age and community disturbance. Ecol. Lett. 2003, 6, 405–411. [Google Scholar] [CrossRef]
  50. Fayolle, A.; Picard, N.; Doucet, J.L.; Swaine, M.; Bayol, N.; Bénédet, F.; Gourlet-Fleury, S. A new insight in the structure, composition and functioning of central African moist forests. For. Ecol. Manag. 2014, 329, 195–205. [Google Scholar] [CrossRef]
  51. Peh, K.S.H.; Sonké, B.; Séné, O.; Djuikouo, M.N.K.; Nguembou, C.K.; Taedoumg, H.; Begne, S.K.; Lewis, S.L. Mixed-forest species establishment in a monodominant forest in central Africa: Implications for tropical forest invasibility. PLoS ONE 2014, 9, e97585. [Google Scholar] [CrossRef] [PubMed]
  52. Yamamoto, S.I. Forest gap dynamics and tree regeneration. J. For. Res. 2000, 5, 223–229. [Google Scholar] [CrossRef]
  53. Cuni-Sanchez, A.; White, L.J.; Calders, K.; Jeffery, K.J.; Abernethy, K.; Burt, A.; Disney, M.; Gilpin, M.; Gomez-Dans, J.L.; Lewis, S.L. African savanna-forest boundary dynamics: A 20-year study. PLoS ONE 2016, 11, e0156934. [Google Scholar] [CrossRef] [PubMed]
  54. Djuikouo, M.N.K.; Doucet, J.L.; Nguembou, C.K.; Lewis, S.L.; Sonké, B. Diversity and aboveground biomass in three tropical forest types in the Dja Biosphere Reserve, Cameroon. Afr. J. Ecol. 2010, 48, 1053–1063. [Google Scholar] [CrossRef]
  55. Baker, T.R.; Phillips, O.L.; Malhi, Y.; Almeida, S.; Arroyo, L.; Di Fiore, A.; Erwin, T.; Killeen, T.J.; Laurance, S.G.; Laurance, W.F.; et al. Variation in wood density determines spatial patterns in Amazonian forest biomass. Glob. Chang. Biol. 2004, 10, 545–562. [Google Scholar] [CrossRef]
  56. Slik, J.; Aiba, S.I.; Brearley, F.Q.; Cannon, C.H.; Forshed, O.; Kitayama, K.; Nagamasu, H.; Nilus, R.; Payne, J.; Paoli, G.; et al. Environmental correlates of tree biomass, basal area, wood specific gravity and stem density gradients in Borneo’s tropical forests. Glob. Ecol. Biogeogr. 2010, 19, 50–60. [Google Scholar] [CrossRef]
  57. Favier, C.; De Namur, C.; Dubois, M.A. Forest progression modes in littoral Congo, central Atlantic Africa. J. Biogeogr. 2004, 31, 1445–1461. [Google Scholar] [CrossRef]
  58. Schwartz, D.; Lanfranchi, R.; Mariotti, A. Origine et évolution des savanes intramayombiennes (RP du Congo). I. Apports de la pédologie et de la biogéochimie isotopique (13C and 14C). In Paysages Quaternaires de l’Afrique Centrale Atlantique; ORSTOM: Paris, France, 1990; pp. 314–325. [Google Scholar]
  59. Schwartz, D.; De Foresta, H.; Mariotti, A.; Balesdent, J.; Massimba, J.; Girardin, C. Present dynamics of the savanna-forest boundary in the Congolese Mayombe: A pedological, botanical and isotopic (13C and 14C) study. Oecologia 1996, 106, 516–524. [Google Scholar] [CrossRef]
  60. Delègue, M.A.; Fuhr, M.; Schwartz, D.; Mariotti, A.; Nasi, R. Recent origin of a large part of the forest cover in the Gabon coastal area based on stable carbon isotope data. Oecologia 2001, 129, 106–113. [Google Scholar] [CrossRef]
  61. Mitchard, E.T.; Flintrop, C.M. Woody encroachment and forest degradation in sub-Saharan Africa’s woodlands and savannas 1982–2006. Philos. Trans. R. Soc. B 2013, 368, 20120406. [Google Scholar] [CrossRef]
  62. Letouzey, R. Notice de la Carte Phytogèographique du Cameroun au 1: 500,000 (map); Institut de la Recherche Agronomique (Herbier National): Yaoundeé, Cameroun, 1985. [Google Scholar]
  63. Egler, F.E. Vegetation science concepts I. Initial floristic composition, a factor in old-field vegetation development. Vegetatio 1954, 4, 412–417. [Google Scholar] [CrossRef]
  64. Wilson, J.B.; Gitay, H.; Roxburgh, S.H.; McG, W.; Tangney, R.S. Egler’s concept of ‘initial floristic composition’ in succession: Ecologists citing it don’t agree what it means. Oikos 1992, 64, 591–593. [Google Scholar] [CrossRef]
  65. Finegan, B. Forest succession. Nature 1984, 312, 109–114. [Google Scholar] [CrossRef]
  66. Kotar, J. Approaches to Ecologically Based Forest Management on Private Lands; Minnesota Extension Service; University of Minnesota: Minneapolis, MN, USA, 1997. [Google Scholar]
  67. Wilson, J.B. Does the Initial Floristic Composition model of succession really work? J. Veg. Sci. 2014, 25, 4–5. [Google Scholar] [CrossRef]
  68. Connell, J.H.; Slatyer, R.O. Mechanisms of succession in natural communities and their role in community stability and organization. Am. Nat. 1977, 111, 1119–1144. [Google Scholar] [CrossRef]
  69. Wierman, C.A.; Oliver, C.D. Crown stratification by species in even-aged mixed stands of Douglas-fir–western hemlock. Can. J. For. Res. 1979, 9, 1–9. [Google Scholar] [CrossRef]
  70. Larson, B.C. Development and growth of even-aged stands of Douglas-fir and grand fir. Can. J. For. Res. 1986, 16, 367–372. [Google Scholar] [CrossRef]
  71. McCarthy, J. Gap dynamics of forest trees: A review with particular attention to boreal forests. Environ. Rev. 2001, 9, 1–59. [Google Scholar] [CrossRef]
  72. Hubau, W.; De Mil, T.; Van den Bulcke, J.; Phillips, O.L.; Ilondea, B.A.; Van Acker, J.; Sullivan, M.J.; Nsenga, L.; Toirambe, B.; Couralet, C.; et al. The persistence of carbon in the African forest understory. Nat. Plants 2019, 5, 133–140. [Google Scholar] [CrossRef]
  73. Baker, P.J.; Bunyavejchewin, S.; Oliver, C.D.; Ashton, P.S. Disturbance history and historical stand dynamics of a seasonal tropical forest in western Thailand. Ecol. Monogr. 2005, 75, 317–343. [Google Scholar] [CrossRef]
Figure 1. An example of Gilbertiodendron-dominated forest conditions in the Ituri Forest (site lenda1), Ituri Province, Democratic Republic of the Congo. Photo credit: P. Umunay.
Forests 12 00738 g001
Figure 2. Overview of the study area. (a) Central Africa, (b) field sites edoro1 (left) and edoro2 (right), and (c) field sites lenda1 (upper) and lenda2 (lower). Quadrat dimensions are those used in analysis, not in field work. CM = Cameroon, CF = Central African Republic, SS = South Sudan, UG = Uganda, RW = Rwanda, BI = Burundi, TZ = Tanzania, ZM = Zambia, AO = Angola, CD = Democratic Republic of the Congo, CG = Republic of the Congo, GA = Gabon, and GQ = Equatorial Guinea.
Forests 12 00738 g002
Figure 3. Forest cover classification at census 3 in field sites edoro1 (a), edoro2 (b), lenda1 (c), and lenda2 (d). R = riparian forest, M = mixed species forest, T = transitional forest between mixed species and Gilbertiodendron dewevrei-dominated, and G = Gilbertiodendron dewevrei-dominated forest.
Forests 12 00738 g003
Figure 4. Predicted versus observed values from models of (ac) basal area, (df) above-ground biomass, and (gi) stem density. A single outlying observation was omitted from panels (e,f) to improve visual clarity. Panels (c,f,i) illustrate residual relationships with one of several explanatory variables.
Forests 12 00738 g004
Figure 5. The proportion of AGB that each of three large-growing canopy species represents of the total AGB for a given forest class and field site, looking across all three censuses. The field sites are (a) edoro1, (b) lenda1, and (c) lenda2. The forest classes are G = Gilbertiodendron dewevrei-dominated, T = transitional between Gilbertiodendron dewevrei-dominated and mixed species forest, M = mixed species forest, and R = riparian forest.
Forests 12 00738 g005
Figure 6. Gilbertiodendron dewevrei stem diameter class distributions by forest type. R = riparian forest, M = mixed species forest, T = transitional forest between mixed and Gilbertiodendron dewevrei-dominated, and G = Gilbertiodendron dewevrei-dominated forest. Note broken Y axis.
Forests 12 00738 g006
Figure 7. Estimates of annual diameter growth in Gilbertiodendron stems for each of nine size classes, in each of four forest types: G = Gilbertiodendron dewevrei-dominated forest, T = transitional forest between mixed species and Gilbertiodendron dewevrei-dominated, M = mixed species forest, and R = riparian forest. Where estimates are not shown (M and T forest types), the dataset contained an insufficient number of stems of a given size class, for proper model convergence. Horizontal axis labels reflect the lower bounds of each diameter class.
Forests 12 00738 g007
Figure 8. Relative recruitment (a) and relative mortality (b) of Gilbertiodendron stems across time, with time-variant explanatory terms held constant at their means. For visual clarity, data points have been jittered in a positive direction with respect to Y axis if they were <0.03, and in a negative direction if they were >0.97. Y axes have been limited to improve visual clarity.
Forests 12 00738 g008
Figure 9. Change in forest cover classification in field sites edoro1 (a), lenda1 (b), lenda2 (c), and across censuses 1–3. R = riparian forest, M = mixed species forest, T = transitional forest between mixed species and Gilbertiodendron dewevrei-dominated forest, and G = Gilbertiodendron dewevrei-dominated forest. Cells bounded in black reflect a change in classification (forest development) between the current census and one of the previous censuses. Quantification of this change is shown in the rightmost column. With the exception of four changes in lenda2, all changes ( n = 19 ) reflect spatial propagation and increasing dominance of Gilbertiodendron dewevrei attributable to developmental processes.
Forests 12 00738 g009
Table 1. Descriptive statistics from longitudinal modeling. Interval values are margins of error for a 95% confidence level, derived through bootstrapping. In cases where the intervals are not symmetric, intervals are presented as upper bound/lower bound. Estimates that share a superscript letter are not significantly different from one another, as tested using Tukey honest significant differences.
MetricGilbertiodendronTransitionalMixedRiparian
Number of quadrats (census 3) (%)208 (32.5)73 (11.4)297 (46.4)62 (9.7)
Fisher’s alpha (census 3) 15.68 ± 0.52 a 20.75 ± 1.12 b d 19.22 ± 0.42 c d 19.91 ± 0.54 b c d
Stem density (ha 1 , census 3) 6828 ± 161.2 a 7765 ± 372.2 b c 8001 ± 172.7 b c 6173 ± 333.7 d
Stem density change (stems ha 1 y 1 ) 0.33 ± 18.76 / 16.85 a c 26.23 ± 28.52 / 28.34 b 9.06 ± 11.69 / 11.09 a c d 20.28 ± 31.92 / 24.6 c d
Basal area (m 2 ha 1 ) 40 ± 2.1 a b 36 ± 3.8 a b c d 33 ± 1.4 b c d 33 ± 3.6 b c d
Basal area change (m 2 ha 1 y 1 ) 0.03 ± 0.13 / 0.17 a b d 0.14 ± 0.28 / 0.25 a b c d 0.14 ± 0.09 / 0.11 b c d 0.01 ± 0.21 / 0.24 a b c d
Live AGB (Mg ha 1 ) 611 ± 39.6 a 460 ± 57.4 b c d 422 ± 24.8 b c d 421 ± 68.1 b c d
Live AGB change (Mg ha 1 y 1 ) 1.02 ± 2.65 / 3.28 a b c d 2.85 ± 3.95 / 4.2 a b c d 2.3 ± 1.51 / 1.82 a b c d 0.36 ± 3.15 / 4.07 a b c d
DBH growth (mm tree 1 y 1 ) 0.803 ± 0.046 a b d 0.742 ± 0.082 a b d 1.122 ± 0.208 c 0.849 ± 0.1 a b d
Recruitment change (% y 1 at 2001) 0.56 ± 0.16 / 0.15 0.55 ± 0.25 / 0.27 0.79 ± 0.56 / 0.67 0.39 ± 0.36 / 0.41
Recruitment change (Odds y 1 ) 1.057 ± 0.016 / 0.015 a b 1.056 ± 0.026 / 0.027 a b 1.083 ± 0.065 / 0.071 c 1.039 ± 0.037 / 0.04 d
Mortality change (% y 1 at 2001) 0.04 ± 0.05 0.02 ± 0.12 / 0.1 0.33 ± 0.38 / 0.39 0.02 ± 0.1
Mortality change (Odds y 1 ) 0.985 ± 0.018 a b d 0.994 ± 0.047 / 0.038 a b d 1.158 ± 0.216 / 0.186 c 0.991 ± 0.041 / 0.038 a b d
Publisher’s Note: MDPI stays neutral with regard to jurisdictional claims in published maps and institutional affiliations.

