
Investigating the Role of Restoration Plantings in Introducing Disease—A Case Study Using Phytophthora


1
UK Centre for Ecology and Hydrology, Maclean Building, Benson Lane, Crowmarsh Gifford, Wallingford, Oxfordshire OX10 8BB, UK
2
Department of Plant Sciences, University of Cambridge, Downing Street, Cambridge CB2 3EA, UK
3
Forest Research, Northern Research Station, Roslin, Midlothian EH25 9SY, UK
*
Authors to whom correspondence should be addressed.
Forests 2021, 12(6), 764; https://0-doi-org.brum.beds.ac.uk/10.3390/f12060764
Submission received: 14 May 2021
/
Revised: 3 June 2021
/
Accepted: 7 June 2021
/
Published: 10 June 2021
(This article belongs to the Special Issue Role of Human Interventions in Spread of Soilborne Forest Pathogens and Methods for Mitigation)
Abstract
:Translocating plants to natural habitats is a long-standing conservation practice but is growing in magnitude to deliver international targets to mitigate climate change and reverse biodiversity loss. Concurrently, outbreaks of novel plant pests and pathogens are multiplying with increased global trade network connectivity and larger volumes of imported plants, raising concerns that restoration plantings may act as introductory disease pathways. We used UK common juniper, subject since ~1995 to conservation plantings and now experiencing significant mortality from the non-native pathogen Phytophthora austrocedri Gresl. & E. M. Hansen, as an example species to explore the availability of monitoring data that could be used to assess disease risks posed by planting. We compiled spatial records of juniper planting including qualitative data on sources of planting material, propagation settings and organization types that managed planting projects. We found that juniper planting activity expanded every decade since 1990 across the UK and while not all planting resulted in outbreaks, 19% of P. austrocedri detections were found within 2 km of a known planting. We highlight the scale and diversity of organizations raising and planting juniper, as well as the lack of source material traceability, and suggest that cross-sector collaboration and changes in practice are required to reduce the risks of pathogen introduction posed by restoration planting.
Keywords:
restoration; biosecurity; plant pathogens; plant diseases; Phytophthora; planting; juniper; conservation1. Introduction
The UN General Assembly declared the 2020s as the Decade of Ecosystem Restoration, and recommended scaling up restoration of degraded and deforested ecosystems to enhance food security, safeguard water supplies and address the climate and biodiversity crises [1]. The aim is to accelerate existing restoration goals such as the Bonn Challenge to restore 350 million hectares of habitat by 2030 [2]. The UN strategic plan for forests aims to reverse worldwide loss of forest cover through protection, restoration, afforestation and reforestation to increase global forest cover by 3% (120 million hectares) by 2030 [3]. While a large proportion of degraded forest ecosystems results from active deforestation by people [3], losses sustained from invasive pests and diseases (primarily insects and pathogens) can be substantial, e.g., 43 million trees killed by Phytophthora ramorum Werres, De Cock & Man in ‘t Veld in evergreen forests on the western US coast [4] and extensive tree mortality in Europe, North America and Australia induced by infection of multiple genera (including chestnuts, oaks and eucalypts) by the generalist, soil-borne pathogen P. cinnamomi Rands [5]. Not only do invasive pest and disease outbreaks destabilize ecosystem processes and decrease biodiversity by killing host species and altering habitat structure [6], they are often impossible to eradicate, thwarting attempts to remediate their impact. Preventing outbreaks will be far more effective at maintaining and enhancing ecosystem functioning than restoration attempts [7], but this requires an understanding of infection pathways and effective actions to shut them down. A pathway currently subject to little research is the translocation of planting material from plant nurseries to natural environments for habitat restoration projects. Restoration is defined by the IUCN as the re-establishment of all key ecological processes, functions and original biodiversity [8]. Planting is a key method used to restore plant populations and their associated ecosystem functions, and governments are signing up to ambitious planting targets, particularly for trees given their carbon capture potential [9]. For example, the current UK government has committed to plant 30,000 hectares of broadleaf and coniferous woodland every year [10]. Though the importance of biosecurity is detailed in national forest strategies (e.g., those produced by the UK devolved nations [11,12]), there is good evidence that introductions of pests and diseases are increasing [13] as a result of expanding global trade networks [14], with many historic introductions identified on imported plant nursery stock [15]. The accelerated rate of tree planting may, therefore, risk further introductions of invasive pests and diseases, particularly where nursery stock is replanted in native environments.
One genus causing significant mortality when introduced to habitats outside its native range is Phytophthora, which contains many pathogenic species now globally distributed and infecting important native forest species such as Jarrah (Eucalyptus marginata Donn ex Sm.) in Western Australia, Kauri (Agathis australis (D.Don) Lindl.) in New Zealand, coast live oak (Quercus agrifolia Née) among many species in the Western USA, Monterey pine (Pinus radiata) in Chile and alder (Alnus glutinosa (L.) Gaertn.) in Europe [16]. The genus is also found infesting plant nurseries worldwide; one study of 670 nurseries in 18 European countries found that 91.5% of nurseries tested positive for Phytophthora [17]. A further study of close to 4000 water, soil and root samples collected from 133 British plant nurseries revealed high infestations, with 50% of samples testing positive for Phytophthoras belonging to 63 different taxa [18]. High levels of Phytophthora infestation were also reported from container plant nurseries in Oregon [19] and southern California [20], some of which raise native plant stock to restore ecologically sensitive sites, and indeed disease outbreaks in three such sites in California originated from plants translocated from nurseries [21]. This demonstrates the potential for restoration plantings to act as an introductory pathway for disease.
In the UK, one species of particular concern has been detected in British nurseries: P. austrocedri, confirmed in 2012 as the agent causing serious mortality of native juniper [18,22]. A single genotype has so far been identified in the UK [23] infecting c. 60 geographically separate populations in Scotland and England with varying levels of intensity, accelerating ongoing declines that had already reduced many populations to small numbers of old trees with poor seedling recruitment [24,25,26,27,28]. As one of few UK native conifers and an ecologically important component of many habitats, juniper has been a flagship species for conservation action for >20 years, and supplementary planting was advocated since ~1995 as a mitigating action to reinvigorate moribund populations and create or restore native woodlands [29,30,31]. In Scotland, specific juniper management guidance was based on Sullivan’s [29] recommendations in 2003 to divide the country into conservation action zones detailing where juniper planting should be prioritized [32]. Following identification of the first P. austrocedri outbreaks in 2012, the guidance was revised to include further detail about biosecurity measures to prevent inadvertent disease introductions, but planting was still advised in zones where the species was thought to be at greater risk from no natural regeneration [33]. Juniper management guidance issued for England and Wales by DEFRA in 2017 similarly provided a decision tree to assess the vulnerability of populations to P. austrocedri but recommended planting where the disease was absent from a catchment and where the population size was declining too rapidly to be sustained by natural regeneration [34].
The extent to which juniper planting has been conducted in the wider environment is unknown and we believe requires further scrutiny to investigate any link between planting and P. austrocedri outbreaks. The wide geographical coverage of P. austrocedri cannot be explained by its slow, natural dispersal through soil and water run-off, and the pathogen has no ability to disperse aerially [35]. The findings of P. austrocedri infestations in British nurseries and the single pathogen genotype detected across the Great Britain in nurseries and the wider environment alike suggest that outbreaks in native populations may derive from multiple introductions of planted material [35]. The focus of this paper, therefore, was to compile the first spatial dataset of juniper planting locations to understand where and when planting has been carried out and by which organizations, to find out where material is sourced from and how frequently P. austrocedri outbreaks are associated with planted locations both UK-wide and across the Scottish juniper conservation zones. In doing so, we hoped to compile a dataset that could be used as a case study to examine further wider questions about the disease risks posed by supplementary planting, its success as a tool for habitat creation or restoration and to inform the design of future planting schemes.
2. Materials and Methods
2.1. Compilation of UK Juniper Planting Records
The Botanical Society of Britain and Ireland (BSBI) maintains the largest and most comprehensive repository for UK plant species distribution data containing > 40 million records [36]. While some records have been digitized from historical accounts, the majority are observations made by volunteers in publicly accessible areas (i.e., not gardens) that are verified by local vice county recorders prior to accession. All records of Juniperus communis L. were downloaded from the BSBI distribution database that spanned from “before 1738” to January 2020 [37]. Records marked as “alien”, “casual”, “deliberate introduction”, “established in wild”, “surviving in wild” or “planted deliberately” in the “locality status” field were first derived from the data, followed by a keyword search performed in the “comments” field using search terms of “plant*”, “introduc*”, “cultivar”, “garden”, “seed” and “cuttings” to extract further locations of planted populations. Additional localities for planted juniper were then collated from a wider body of literature including survey record cards describing the distribution of juniper sites across England and South Wales 1969–1977 [28], juniper population surveys commissioned by public bodies (e.g., NatureScot) or conservation charities (e.g., Cumbria Wildlife Trust), records held by Forest and Land Scotland of juniper planting conducted on the National Forest Estate and records maintained by the devolved environmental statutory agencies (NatureScot, Natural England, Natural Resources Wales) detailing supplementary juniper planting conducted on Sites of Special Scientific Interest (SSSIs) or Special Areas of Conservation (SACs). Further sites were identified by searching for references to juniper in archived biodiversity action plans or management notes produced by national parks and checking if these projects were successfully actioned by contacting the relevant county council, national park authority or lead organization responsible for the action and requesting information about planting locations and any other details relating to the planting year, seed source, information on how and where material was propagated, the number of trees and any subsequent monitoring notes. Organizations that manage woodlands or nature reserves in areas with naturally occurring or declining juniper populations were also identified and contacted directly with requests for the same information. Some organizations held this centrally, while others identified the most likely areas for juniper planting activity and contacted relevant outposted staff. Some sharing of contacts through plant health inspectors, local knowledge or other professional networks also yielded information about localities not identified by other means. Where locations were supplied as maps, grid references were manually identified at 1 km resolution using the Scotland’s Bird Club grid reference finder [38].
Once all records were compiled, filtering operations were conducted in R version 3.6.2 [39] using the dplyr R package [40]. The planting dataset started with 1306 records. The year of planting was usually supplied with records obtained directly from organizations or survey reports whereas the date recorded in the BSBI database related to the year of observation. Removing these observations would reduce the known spatial distribution of planting which we regarded as more important, so the year of observation was retained as an indication of the most recent year of possible planting, unless it could be substituted with the actual planting year supplied in the “comments” field. Similarly, where the exact year of planting was uncertain but provided as a range of dates, the most recent date was attributed as the planting year. Records supplied with no year of planting or year of observation were removed from the dataset, as were records where the recorder name, grid reference, record date and associated comment exactly duplicated another record. Planting events may still be duplicated in the dataset if (a) recorded by different individuals, (b) recorded in different years or (c) retrieved from multiple sources. Filtering removed 221 records, before a further 58 with insufficient geographical accuracy (>2 km × 2 km) were removed, leaving 1027 records.
2.2. Qualitative Analysis of Juniper Planting Records
Qualitative information associated with planting records was explored prior to any further filtering of the dataset. Keywords pertaining to the organization responsible for planting, the size or purpose of schemes, the source or type of collected material, the type of setting used to propagate material (e.g., nursery, in-situ planting) and any subsequent population monitoring were identified from the information transcribed to the “comments” field. Information for the same planting event could vary with the record source offering further insight. Uncertainty surrounding record duplication prohibited a quantitative keyword analysis but under each theme, the keywords were ordered according to their relative frequency in the dataset.
2.3. Spatial Analysis of UK Juniper Planting
The spatial distribution of planting locations was explored at the tetrad (2 km × 2 km) level to reduce spatial bias resulting from duplicate records and to match the resolution of the native juniper distribution map (see Section 2.4). Grid references supplied at a higher resolution were converted from OS national grid references, latitude/longitude or eastings/northings using the det_tet_quad, gps_latlon2gr and gr_num2let functions in the BRCmap package [41]. As some locations were planted in multiple years, the data were filtered using the combination of tetrad location and planting year and are subsequently referred to as discrete “planting events”. The change in the number and spatial distribution of these planting events over time was plotted using the ggplot2 R package [42] and mapped using ARC GIS v.10.5.1 [43].
The map of Scottish juniper conservation action zones was digitized from an image in ARC GIS and aligned to county boundaries [44] using the align edge tool under the topology menu. The resulting shapefile was imported to R using the rgdal package [45]; the centroids of each planted tetrad were found using the gr2sp_points function in the BRCmap package [41], to which the planting zone was extracted using over from the sp package [46]. The frequency and percentages of planting events that took place before and after publication of the revised guidance in each zone were explored in R and mapped in ARC GIS.
2.4. Spatial Distribution of Native Juniper
A map of the current UK juniper distribution was compiled to understand planting activity in the context of the species’ native range, using the Juniperus communis records downloaded from the BSBI database that remained following extraction of all records referencing planting. Additional grid references were added from records of Juniperus communis supplied by the Centre for Environmental Data Recording (CEDaR) and juniper population surveys provided by Borders Forest Trust [25,47], Causeway Coast and Heritage Trust [25], NatureScot [27,48], Natural Resources Wales [49] and Plantlife [50]. Grid references associated with all units within SSSIs and SACs identified by Natural England as hosting juniper features (including habitats and vascular plant assemblages) were copied from the publicly accessible MAGIC database [51], and further records were taken from P. austrocedri surveys conducted by the Department of Agriculture, Environment and Rural Affairs (DAERA), Forestry Commission and Scottish Forestry, and from symptomatic juniper samples collected from locations confirmed as “wider environment” (see Section 2.5) submitted to the Food and Environment Research Agency (FERA) or Forest Research for identification. A point shapefile of the Scottish montane scrub dataset [52] was filtered to retain only records of “Juniperus communis” in the “species” field from which spatial coordinates were extracted using the rgdal R package [45]. Polygon shapefiles were supplied by Cumbria Wildlife Trust that mapped the extent of all juniper populations within Cumbria [53] and by Scottish Forestry for all habitats mapped by the Native Woodland Survey of Scotland [54], filtered to contain locations where the “dominant habitat” was defined as “juniper scrub”. A regular 1 km grid was created for Scotland and Cumbria using the create fishnet tool in the ARC GIS data management toolbox and overlaid with the corresponding survey polygons so that 1 km grid references could be obtained using the intersect tool in the analysis toolbox. Following compilation of all records, grid references were converted to tetrad resolution using the functions described in Section 2.3 and filtered to retain distinct locations of juniper populations observed between 1990 and 2020.
2.5. Occurrence of P. austrocedri in the Wider Environment
To explore the intersection between planting and P. austrocedri presence, Forest Research and FERA forwarded all records of P. austrocedri symptomatic material submitted to them for testing including samples taken from alternative host species and cultivated settings. The pathogen was first detected in the UK in 2012 [22] and though the dataset was finalized in 2020, the most recent detection was made in 2016. Detections were based on (i) isolation of the pathogen into culture, (ii) PCR and sanger sequencing of the ITS region or (most frequently) (iii) a pathogen-specific qPCR assay as described in [55]. The absence of P. austrocedri from Northern Ireland was confirmed by DAERA [56]. All samples relating to juniper stands (bark, stem, root or soil samples) in the “wider environment” were retained if supplied with a grid reference and year of detection, and a result described as “positive”, “isolate” or “confirmed”. These were mapped against the native juniper distribution map, and any records that did not intersect with an occupied juniper tetrad were queried with plant health inspectors, local foresters or botanists to confirm the presence of juniper. Seven tetrad locations were discovered by this process to derive from gardens and were discarded from the dataset.
To compare if P. austrocedri outbreaks occurred closer to planted locations than populations with no disease incidence, a dataset of apparent “absences” was assembled. It is not possible to prove the absence of a soil pathogen, but we interpreted the absence of foliage symptoms and/or a negative qPCR result as sufficient evidence that a juniper tree was not infected at the time of visit. These locations are henceforth referred to as “absences”. Absence records obtained from Forest Research/FERA that tested “negative” with qPCR were added to records compiled for the Phyto-Threats project [18] of all UK Phytophthora outbreaks provided by the Animal and Plant Health Agency, Science and Advice for Scottish Agriculture, the Royal Horticultural Society, Forest Research, Scottish Forestry and Natural Resources Wales. This assumes that outbreaks of P. austrocedri would be identified if symptomatic juniper was present in the tetrad visited by plant health inspectors (with proof of a visit taken as the presence of a record for another Phytophthora species). The data were filtered to retain records from 2012 onwards in environments described as “woodland”, “watercourse”, “heathland”, “WE” or “wider environment”, “plantations”, “mature woodland” or “hedges/screens/riverbanks” that overlapped with the national map of juniper distribution described in Section 2.4. Additional visits to juniper populations were collected by copying SSSI compartment grid references from MAGIC [51] that matched accessions in site condition monitoring reports made since 2012 by Natural England, populations “re-found” as part of the Natural Resources Wales 2014/15 P. austrocedri survey and populations with no symptoms visited by the authors between 2012 and 2019. Records occupying the same tetrad as those with positive P. austrocedri detections were removed, as were any grid references with >2 km resolution. Next, the distance from each absence or infection record to the nearest tetrad centroid planted in the same or previous years to the visit or detection year was calculated using gDistance in the rgeos R package [57], and the record with the shortest distance for each monad (1 km resolution grid reference) was retained. Records of P. austrocedri absences were randomly sampled to match the same number of infected monads using the base R sample function [39]. The minimum distances to the nearest prior planting event were log10 transformed, but the distributions for both infected and absence locations retained non-normal distributions with a strong, left skew. The average minimum distance to the nearest prior planting events was, therefore, compared between the two groups using a Mann-Whitney U test performed using the stats R package [39] and the wilcoxonR function in the rcompanion package to determine the effect size, r [58].
Lastly, all planting records within a 500 m radius of the shortlisted grid references for infected and absence locations were extracted from the planting dataset using the gBuffer function from the rgeos R package [57]. Because the planting map was produced at 2 km resolution, planting records identified within the 500 m radius buffer zone could be a maximum distance of 2 km from the grid reference. These distances were considered appropriate, as a study of P. austrocedri infection through time conducted at a juniper population in northern England found that colonization occurred frequently within 500 m and infrequently beyond 3 km of the nearest symptomatic juniper (Donald, F., unpublished data). The number of planting events identified in the buffer zone was compared between infected and absence locations, as was the number of juniper planted per event in categories of <50, 50–499 and >500 trees, as differences in infection might be expected to result from trees planted in different orders of magnitude. The number and percentage of records distributed in categories describing the organizations conducting planting, the propagation settings, the source and type of propagation material and the country, region (north, south, east, west) and decade during which planting took place were further collated and compared between infected and absence buffer zones using Chi-squared tests. Test results were reported as (degrees of freedom, total number of records with information) = χ2, p-value.
3. Results
3.1. Spatial and Temporal Distribution of Juniper Planting
Juniper planting has been widely conducted across the UK (Figure 1) with 781 planting events (subject to duplication) conducted in 469 tetrads between 1960 and 2019, of which 149 (32%) were subject to multiple planting events carried out in different years. Planting was recorded in all four nations, in approximately 9% of tetrads occupied by native juniper during the past 30 years (Figure 1). The BSBI contributed the largest number of planted juniper records (41%), augmented with locations submitted by a further 28 organizations.
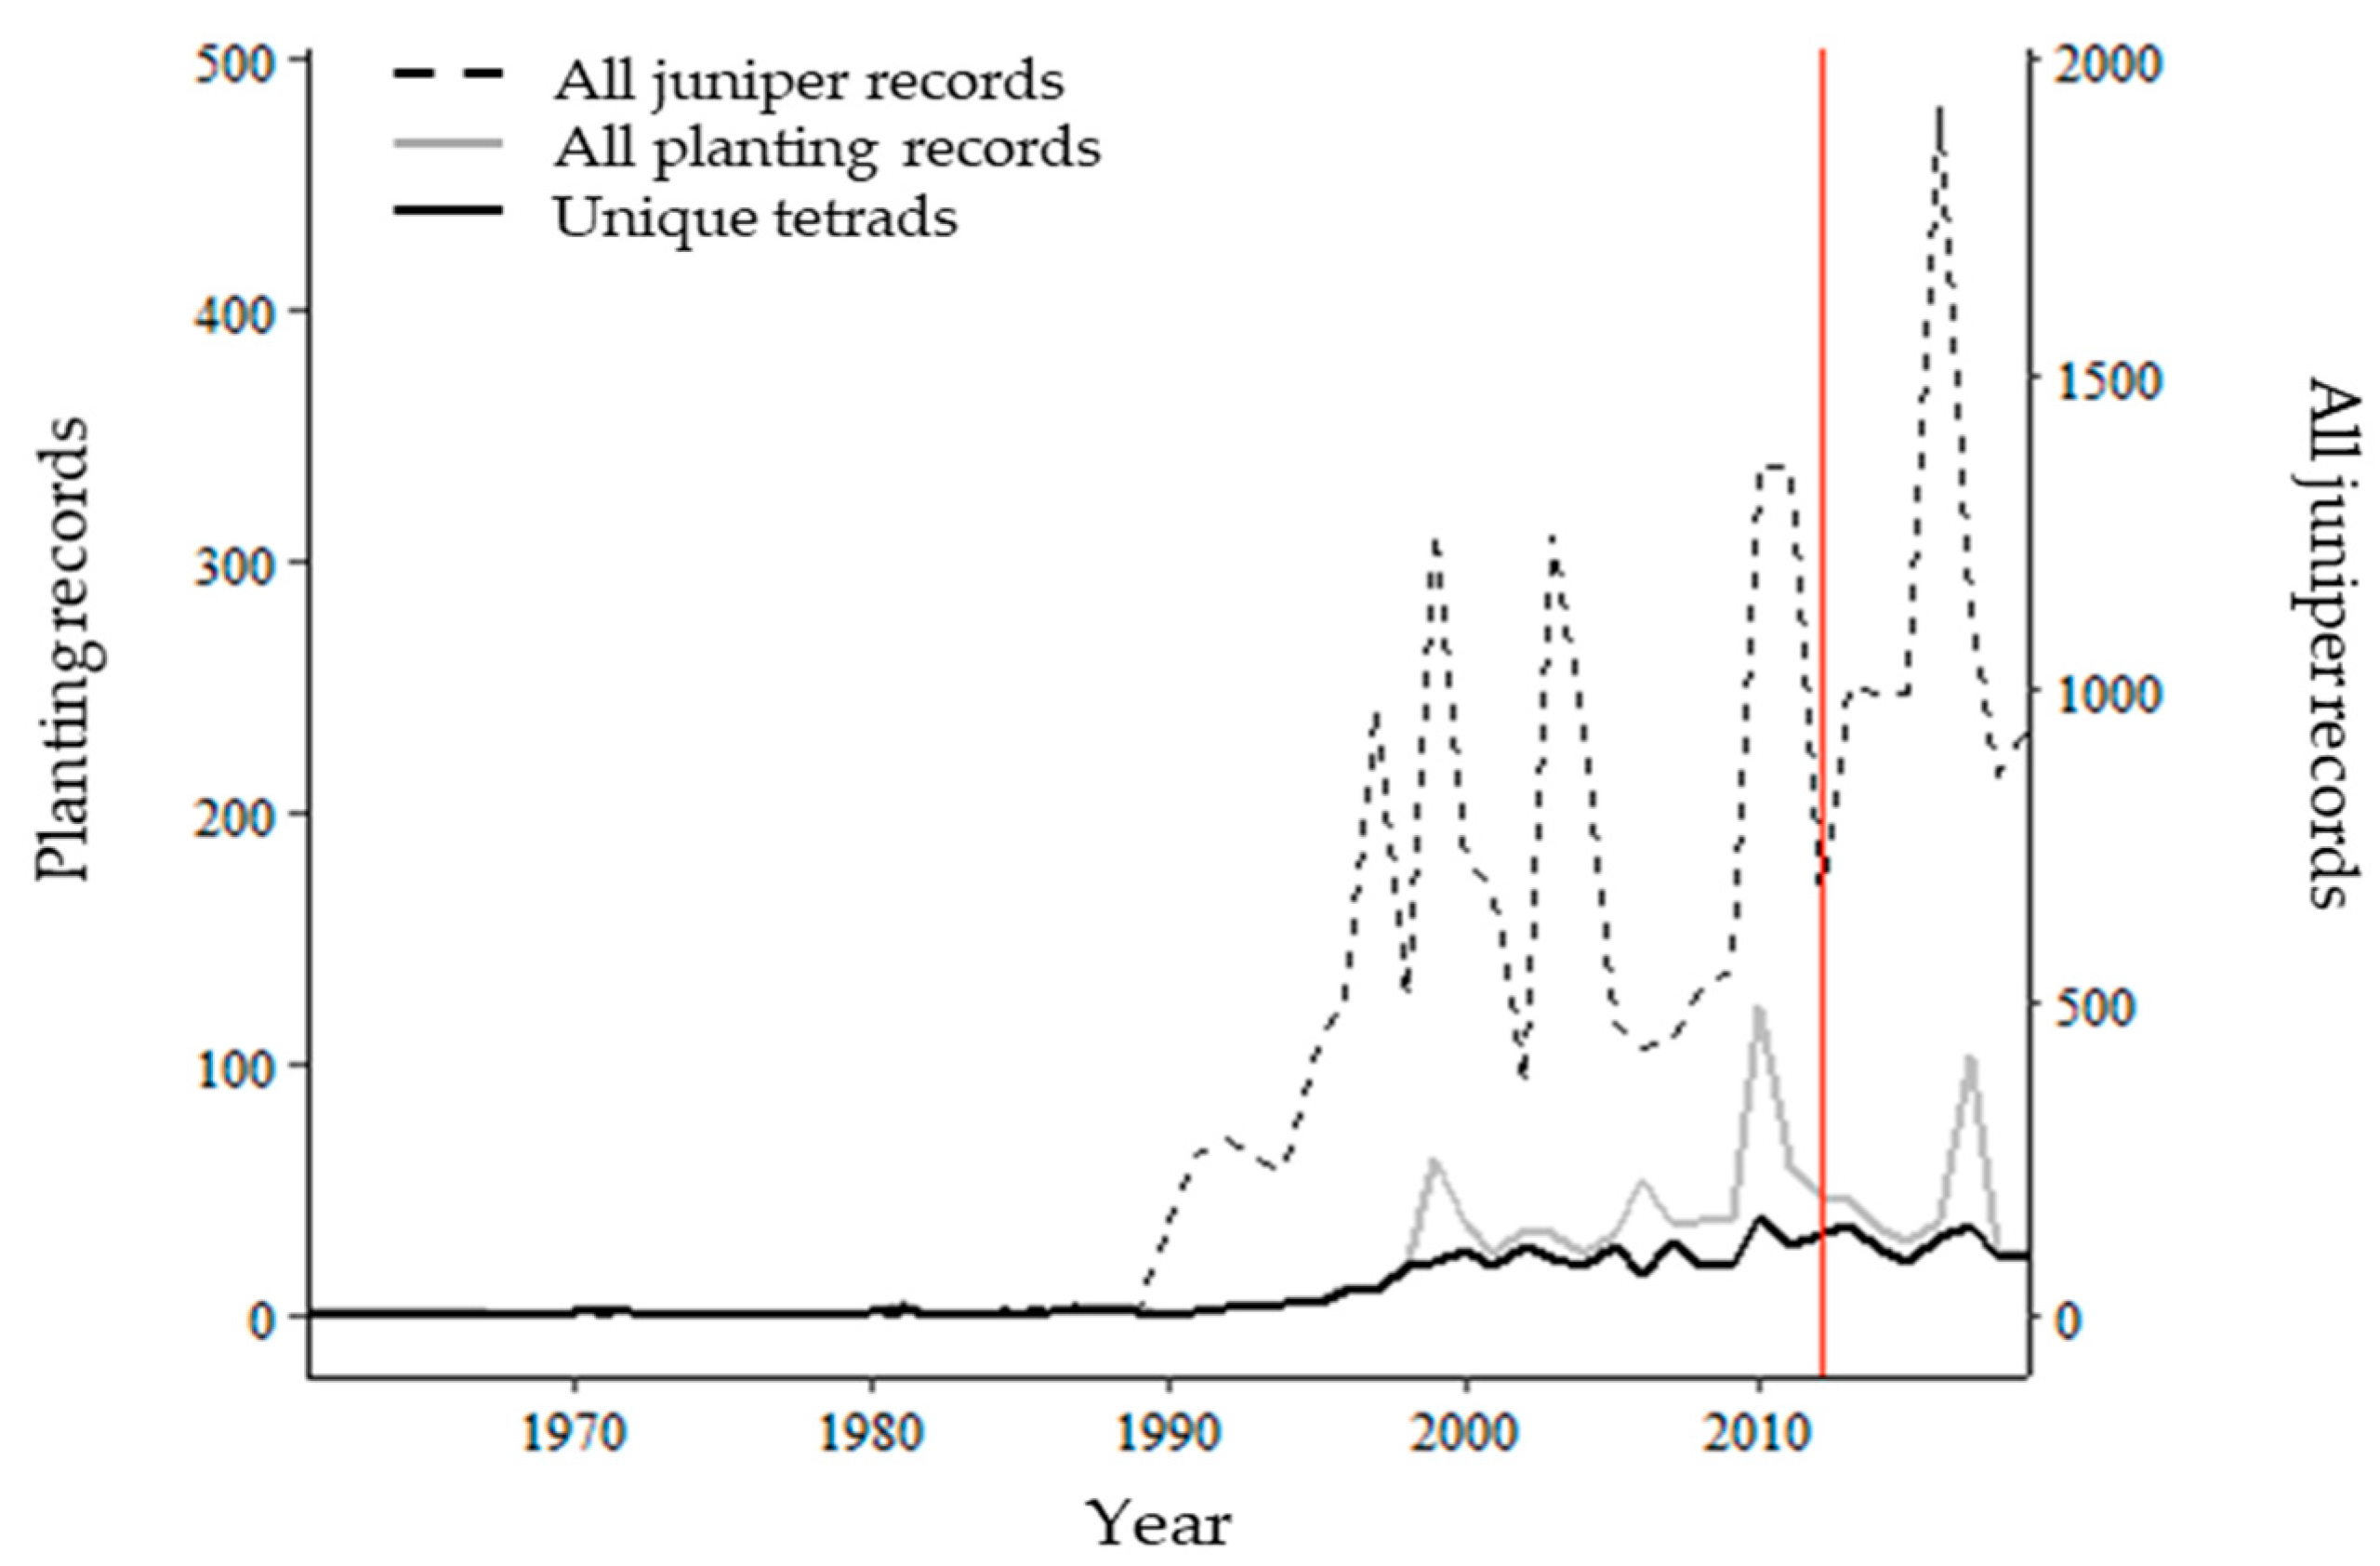
Though P. austrocedri was first confirmed in the UK in 2012 [22], symptoms were first reported from one population—now heavily infected—in the 1990s [59], suggesting that the pathogen was introduced much earlier. Planting activity markedly increased in both frequency and spatial distribution during the 1990s and is sustained to the present day (Figure 2). The number of planting records and number of planted tetrads show similar trends, but the former shows high peaks concentrated at the start and end of each decade that matches the trend of all juniper record submissions and more likely reflects recording than planting activity, as recorders start to re-visit localities last observed in the previous decade (Figure 2). The number of planted tetrads, therefore, gives a more reliable insight into the distribution of planting activity over time (Figure 2). The mean number of tetrads (36) planted between 2000 and 2009 more than doubled (277%) compared to the 1990s (13 tetrads), which already represented a 750% increase compared to the 1980s (2 tetrads) (Figure 2). Planting from 2010 to 2019 further increased to an average of 53 tetrads per year that were distributed further across the UK than any preceding decade (Figure 1, Figure 2).
Planting records associated with publicly funded agri-environment or forestry schemes are missing from the dataset unless recorded ad hoc by BSBI volunteers. Information was requested from Scottish Forestry regarding the extent of funding allocated to subsidize juniper planting in Scotland, but this could not be provided, as species targeted within funding applications have not been recorded [60]. Scottish Forestry was able to advise on the list of “Forestry Grant Scheme” options available 2014–2020 to support juniper management via activities promoting natural regeneration (three options) or planting (four options) [60]. Creation options accounted for the smaller proportion (38%) of the area funded compared to natural regeneration (62%) and formed 33% of the total area (51,528 ha) funded under all woodland creation options [60]. Scottish Forestry further noted that the area of juniper included in applications for either creation or ongoing management was “extremely small” [60]. It is unclear if these proportions are similar in other parts of the UK and, therefore, the extent to which our planting dataset under-represents juniper planting activity.
3.2. Qualitative Assessment of Organizations, Purpose and Propagation Settings Linked to Planting, from Planting Records
The information associated with planting records varied greatly, but 722 of 1059 records contained additional comments that could be used to understand better who is involved in planting schemes and for what reason, as well as the size of schemes and the diversity of locations used to source and propagate material. The organization responsible for planting could be identified for 44% of records, showing that planting activity is not only associated with the public estate (e.g., National Forest Estate, Ministry of Defense) or conservation areas (e.g., national parks, wildlife trust reserves) but also with commercial enterprises, landscaping for infrastructure projects (dams, motorways), private landowners and community groups (most often managing community woodlands) (Table 1). Scheme size, described by 40% of all records, reflected this diversity with almost equal proportions of tetrads (per year) planted with 50 or fewer juniper plants, or between 50 and 4000 plants (Table 1). Two statutory agencies managing areas of the public estate each planted 10,000 junipers, and one conservation charity planted 200 junipers every year for approximately ten years (Table 1). The reasons for planting were only detailed in 12% of records and largely mentioned its use for landscaping around carparks or roads, but some specifically referenced attempts to restore existing moribund or fragmented populations or improve the ratio of male to female plants to encourage natural regeneration (Table 1). A further 45% of records could be assumed to address conservation aims to restore or create juniper habitats based on the organization submitting the information.
The source of juniper used for planting and the propagation settings were detailed in 27% and 20% of records, respectively, and yielded important insight about current practices. Where referenced, source material was usually described as native or collected from a specific local source or was infrequently traced back to commercial nurseries of varying size (Table 1). Cuttings were overwhelmingly used to propagate juniper with only a handful of references to seed collection and four projects that mentioned use of both (Table 1). The locations used to propagate material also varied considerably from nurseries managed “in-house” by a single organization to commercial nurseries, on-site nurseries, research institute nurseries and, in one instance, an individual’s own garden (Table 1). Some organizations emphasized the importance of biosecurity when considering where to propagate material, including one project that chose a nursery because it did not trade with other retailers to reduce any risk. There was some evidence of organizations distributing propagated plants from their central nurseries to other organizations and some movement of plants between countries within the UK. Only one instance of planting stock imported from outside the UK was documented, and the comments noted this was a supply error.
Details of follow-up monitoring conducted to check the success of planting projects represented the smallest subset of comments, associated with 8% of records, and portrayed a mixed picture of the establishment. Some recorders observed that planted populations looked “favourable” or had “80–90% success”, noted that sheep fences or rabbit-proof mesh enclosures were “effective” and noted that plants were berrying or showed no signs of disease. However, comments also reported that some populations were “struggling”, often attributed to management pressures including overgrazing, e.g., “50% pulled up by sheep”, competition, e.g., “under dense shade of large trees” or the “wrong provenance for site”, while others were symptomatic for P. austrocedri, e.g., “65% Paus symptoms” or showed high mortality, e.g., “45% dead, 20% poor health”.
3.3. Associations between Spatial Patterns in Juniper Planting and P. austrocedri
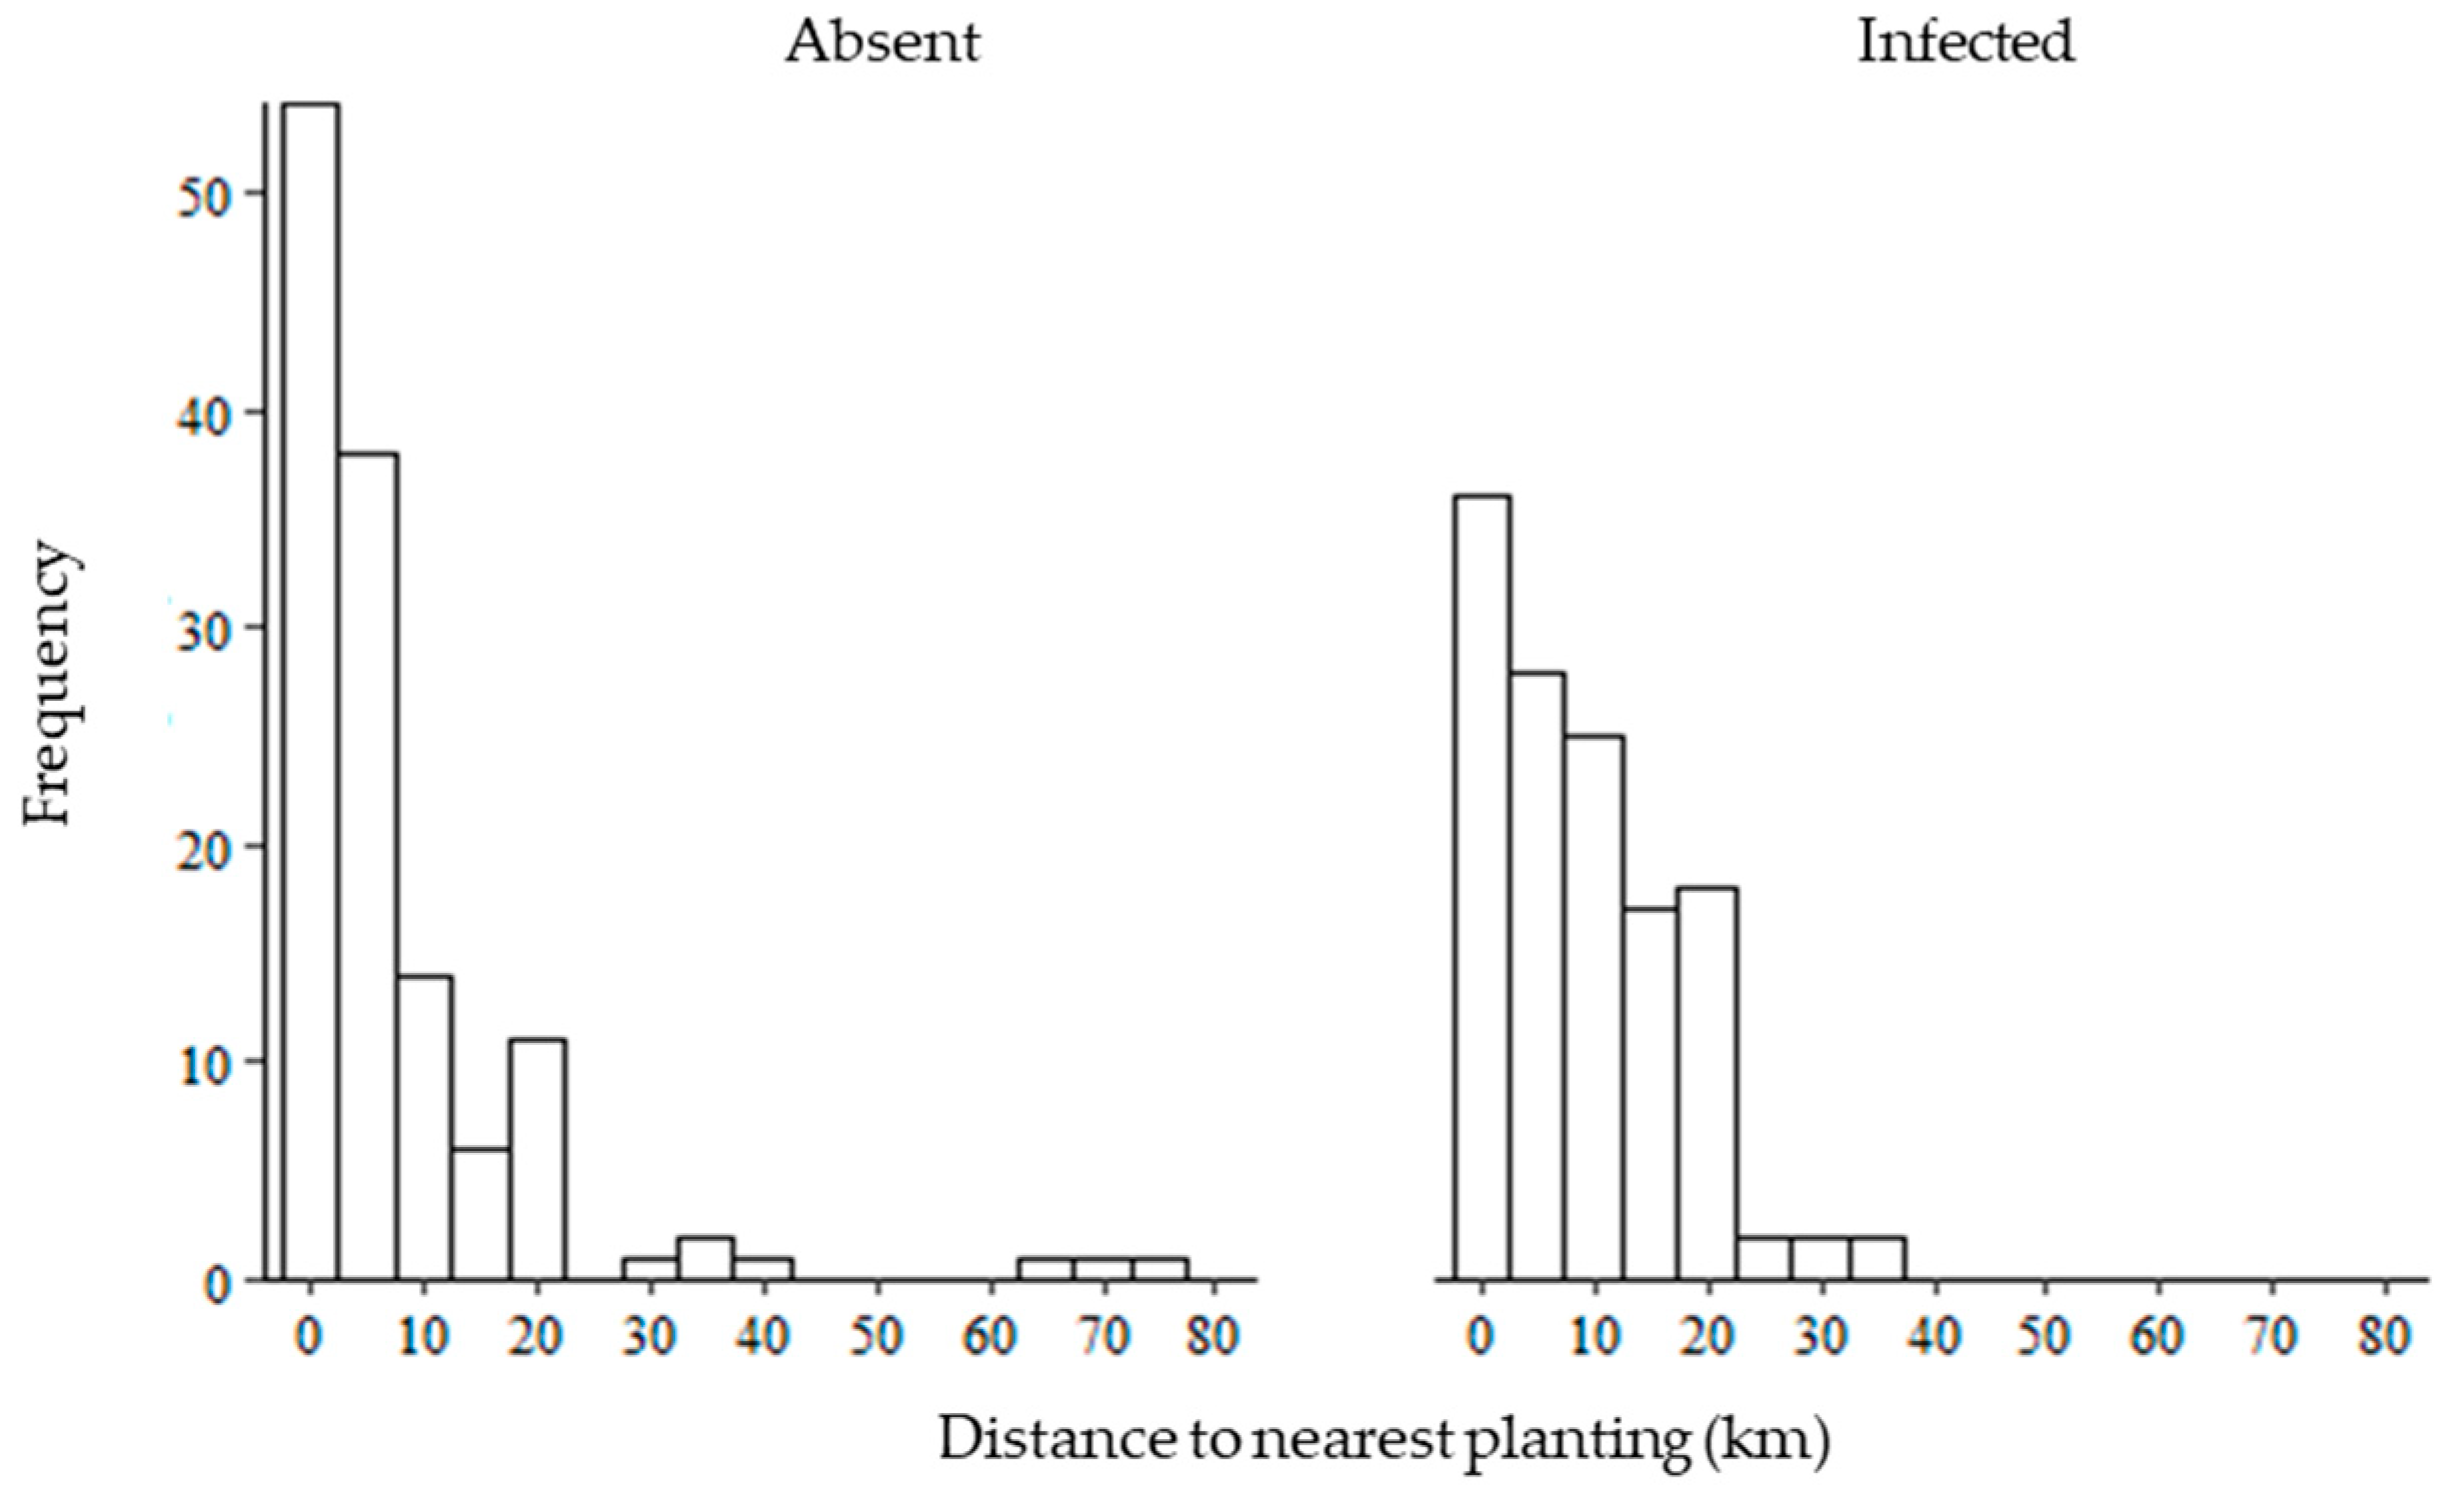
There were 311 positive P. austrocedri detections made from 2012 to 2016 across Scotland and England in the wider environment, distributed across 98 tetrads which represents 2% of UK tetrads occupied by native juniper since 1990. At 1 km resolution, P. austrocedri occupied 130 monads. The average minimum distances to the nearest prior planting events were significantly different between infected locations and the random sample of visited absence locations according to the Mann-Whitney U test (U = 6531, p = 0.002). The small, negative effect size (r = −0.20) suggested that absence locations were slightly further from planting events compared to infected locations. However, though the maximum distance between planting events and an infected monad was shorter (33 km) compared to absence monads (74 km), infected monads occurred at a median distance of 7.7 km from the nearest recorded planting compared to absence locations within a median distance of just 3.6 km (Figure 3). A larger proportion of absence monads was situated within 0–5 km of a planting event (60%) compared to infected monads (40%), and double the number of absence locations (30) occupied the same monad as a planting event compared to infected locations (14) (Figure 3).
This pattern was maintained when events within the 500 m radius buffer zone were examined: 41/130 absence locations compared to 25/130 infected locations were associated with planting events conducted in the same or previous year(s) (Table 2). Though a smaller proportion of planting events intersected with buffer zones around infected compared to absence locations, planting nonetheless occurred in buffers surrounding 19% of all P. austrocedri detections at 1 km resolution. More planting records were collected in the buffer zone around infected locations (115 events) compared to absence locations (89 events) and were associated with higher quality information regarding the scheme size, organizations involved and propagation settings, which constrained the analysis of planting event characteristics (Table 2, Table 3). However, the available information suggested that infected locations were associated with more planting events. The frequency distributions of planting events conducted per buffer zone surrounding infected and absence locations were significantly different, χ2 (10, n = 204) = 18.53, p = 0.05, and a higher median number of events was recorded within zones buffering infected (3) compared to absence (1) locations (Table 2). Larger numbers of juniper were also planted per event in infected buffer zones (median 300 trees compared to 100 in absence buffer zones, Table 2), a difference which was highly statistically significant, χ2 (2, n = 152) = 17.68, p = 0.001, but fewer records identified within absence buffer zones gave details of the size of planting compared to infected zones (Table 2).
A highly significant, greater proportion of planting material was sourced from the central organization or commercial nurseries in infected compared to absence buffer zones, χ2 (3, n = 111) = 18.91, p = 0.000, and managed by conservation charities and wildlife trusts compared to a larger percentage of plantings in absence locations conducted by statutory agencies, χ2 (2, n = 107) = 32.83, p = 0.000 (Table 3). The differences in the distribution of planting events in absence and infected buffers between countries were also highly statistically significant, χ2 (2, n = 204) = 33.58, p = 0.000. Seventy-eight percent of planting events conducted in the buffer zone of infected locations took place in northern England and 18% in southern Scotland, representing similar percentages in the total number of planting events conducted per country (66% Scottish and 63% English planting events were located in infected buffer zones) (Table 4). No locations were infected in Wales, despite planting activity that accounted for 26% of planting events found within absence buffer zones (Table 4). Most of the Welsh planting events related to a project conducted by Natural Resources Wales to restore populations on Anglesey and Ramsey island where local material was propagated at a nursery specifically chosen because it did not trade with other nurseries and only raised juniper collected by the project [61]. No significant difference was found between the number of planting events conducted each decade between absence and infected buffer zones, χ2 (4, n = 204) = 7.95, p = 0.094. However, absence locations were associated with similar numbers of planting events conducted between 2000 and 2009 (49%) and from 2010 to 2019 (37%), while 70% of plantings recorded in infected buffer zones were carried out during 2000–2009 followed by 20% between 2010 and 2019, which could illustrate a time lag between P. austrocedri introduction and symptom detectability (Table 5).
3.4. Planting in Scottish Juniper Conservation Action Zones
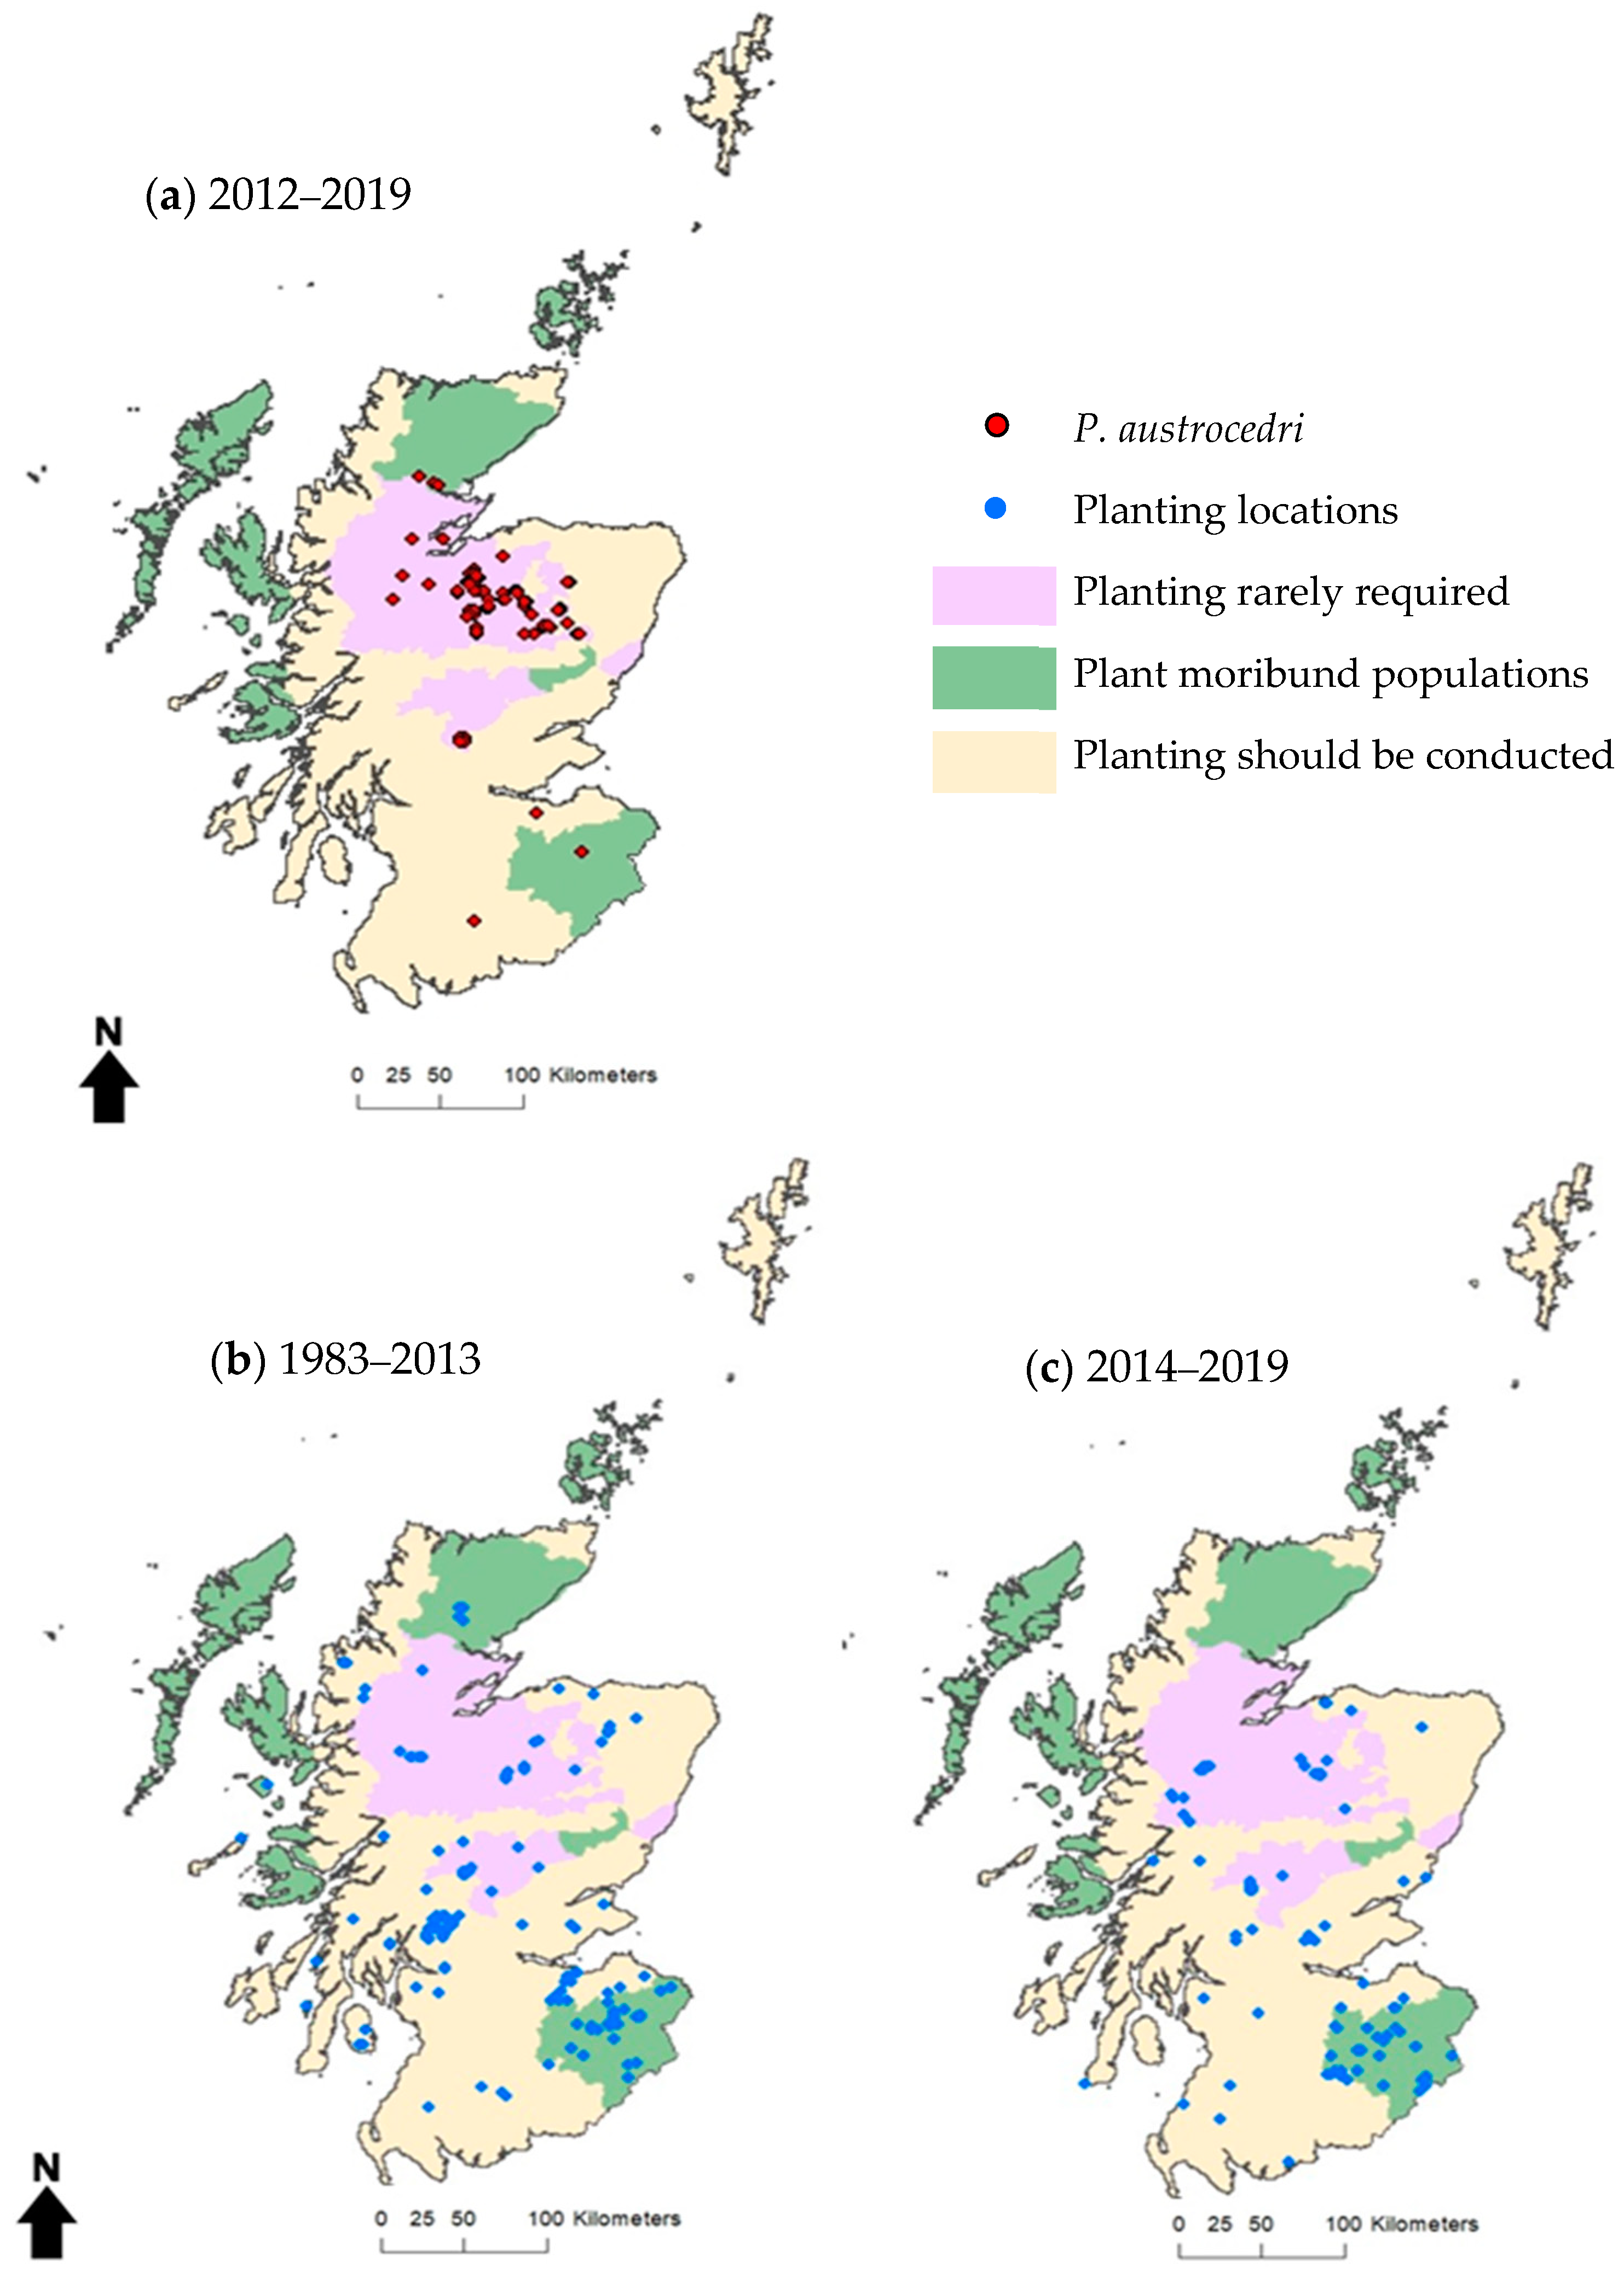
Scotland contains 72% of the UK baseline juniper tetrads and 70% of tetrads with P. austrocedri positive detections. Records of planting were obtained for 262 events, of which 175 took place between 1983 and 2013 and 87 during 2014–2019 following re-publication of the juniper planting guidance in response to the P. austrocedri disease threat that prioritized planting in different zones according to juniper population vulnerability as a function of size [33] (Table 6, Figure 4). Thirty-three percent of all planting conducted in Scotland was concentrated in the six-year period following the guidance publication. Indeed, the peak number of tetrad locations (25) planted in one year since 1960 was reached in 2017. The ratio of planting conducted across the three conservation zones during 1983–2013 matched the recommendations that planting was required in zone 3, may be necessary for moribund populations in zone 2 and would rarely be required in zone 1 (Table 6, Figure 4). Following the guidance update, the proportion of juniper planting conducted during 2014–2019 decreased in zone 3, stayed the same in zone 2 and increased in zone 1: the opposite of the outcome recommended (Table 6, Figure 4). Tetrads infected with P. austrocedri were concentrated in zone 1 (84%) followed by small percentages in zones 3 (12%) and 2 (4%) (Table 6, Figure 4). Planting events only occurred in the same tetrad as P. austrocedri in three locations, each situated in a different zone and associated with no information about source material. The zone 2 tetrad was subject to planting in five different years while the others were associated with a single event.
4. Discussion
Our data show that juniper was introduced by planting to 9% of the species’ native range occupied since 1990 at 2 km resolution across the UK. We suspect this is an under-estimate as there is currently no requirement to document planting, and projects receiving public funding are not systematically recorded [60]. From the 781 records we could compile from 29 organizations, the number and spatial distribution of juniper planted in the wider environment increased every decade following an initial surge in 1990. Planting was conducted by a range of organizations that accessed different settings to propagate planting material including organization-specific, commercial, or on-site nurseries, with or without sharing of material between organizations and regions. We discovered that planting occurred close to recorded juniper populations with and without apparent P. austrocedri infection, and although there was limited evidence that planting occurred further from absence compared to infected locations, the comparison of median planting distances between the two groups suggested that spatial proximity is not the main risk factor determining the probability that a site is infected. The traceability of planting stock was variable, and too few records were associated with propagation information to allow a nuanced, statistical analysis of settings or procedures that increased the risk of disease introductions. However, 19% of 1 km resolution P. austrocedri detections occurred within a short distance (500 m radius buffer zone) of a previously planted location. Elevated risk factors for infection included increased frequency of planting events and larger planting scheme sizes with highly statistically significant differences detected between countries, managing organizations and stock sources. These findings suggest that supplementary planting bears further scrutiny for all habitat creation or restoration projects because transplanting material is a significant risk pathway for the introduction of disease.
Our results highlight the poor quality and lack of available data as key barriers to assessing the risk of supplementary planting as a pathway for pests and diseases and the overall success of planting schemes as a management tool. In compiling the dataset, we discovered that existing knowledge about the establishment of plantings largely relies on observations made by citizen scientists and the details that individual organizations decide to collect and maintain in relation to their own planting operations. We further illustrated that organizations involved in conservation planting are not limited to small-scale projects funded by conservation charities but also include statutory agencies, companies maintaining infrastructure, private landowners and community groups, and that as many schemes plant hundreds of trees as tens of trees. No disease outbreaks within a 500 m radius of planting carried out by commercial companies, community groups or private individuals were discovered, but these may represent groups least likely to maintain planting records and conduct or report follow-up monitoring. Plantings close to P. austrocedri detections included those conducted by statutory agencies and utility companies, but a large number was conducted by conservation charities and wildlife trusts. This highlights the importance of sharing good biosecurity and plant-sourcing practices and monitoring with a wide range of organizations, including those in the environmental sector, and analyzing further how factors such as sourcing and the size or frequency of planting events are linked to risk. Where specified, most material was sourced from UK native stock and while some projects carefully matched the provenance of source material to the receiving environment, very little juniper was raised in situ, with most material grown up in nurseries of varying size and proximity to the replanting location. While sourcing information was only available for 67% of records found within the 500 m buffer zone surrounding P. austrocedri outbreaks, a higher percentage of stock used at these locations was recorded as raised in the central organization or commercial nurseries when compared to absence locations. The association with commercial nurseries is unsurprising given the high incidence and diversity of Phytophthora detections in UK nurseries [16]. However, grouping nurseries in these categories is quite artificial, and better insights would be obtained if sufficient information could be collected about nursery practice such as importing plants in the Cupressaceae from international sellers, quarantining material for a year before planting and using irrigation methods. The absence of P. austrocedri detections from Wales, where the majority of planting material was sourced from a commercial nursery that only grew juniper collected from Welsh populations and did not trade with any other retailers, may exemplify how good biosecurity can determine the success or failure of restoration projects.
Few studies have investigated the frequency and severity of disease introductions resulting from supplementary planting outside of forestry plantation settings. Accidental Phytophthora introductions on planting material used for habitat restoration in three separate locations in California have been documented [21]. While the biosecurity measures introduced at donor nurseries to prevent further introductions required significant changes to existing practices, the measures described to remediate sensitive, inaccessible habitats following disease introduction were significantly more onerous, costly and time-consuming [21]. Remediation is also less likely to succeed long-term compared to preventing initial introductions [62], which native plant nurseries in California showed can be achieved by implementing biosecurity protocols to maintain Phytophthora-free stock [19,58]. No method exists to treat P. austrocedri in the wider environment, so, in keeping with many pathogens, management options are limited to actions that can slow spread [62,63]. The removal of symptomatic trees to reduce pathogen transmission was carried out for six consecutive years at one SSSI-designated juniper population, but newly symptomatic trees appeared every year, and work ceased after ~10% of the original population was removed [64]. A study of P. austrocedri colonization of a juniper population through time found that the pathogen can disperse several kilometers from its source in fewer than five years (Donald, F., unpublished data), so introducing infected material to new geographical areas risks mortality not only in the receiving but also in any neighbouring populations. However, as Californian case studies demonstrate, the risk associated with supplementary planting depends on the biosecurity practices employed when raising, planting [19,60] and managing populations [65]. Hybrid Phytophthora species have been detected in nurseries infested with both parents [66], and introducing material from nurseries where multiple host plants are imported from different origins further increases the likelihood of new strains [67]. If the disease tolerance detected in two native populations [68] is found to be heritable, UK populations may be protected from P. austrocedri-induced extinction, but this protection could wane with the introduction of new strains or hybrids.
The proliferation of tree and plant health guidance for horticultural [69], landscaped [70] and natural environments [71] in recent years is to be welcomed. However, supplementary juniper planting conducted following publication of the guidance proportionately increased in Scottish zones where it was least recommended [33], calling into question if guidance is reaching the intended audiences or aligns with site-level priorities of land managers and, in turn, how effectively it is being implemented. In an aligned study, we are further exploring if and why these publications are not translating to changes in practice by inviting representatives of the user groups identified from the juniper planting dataset to participate in a survey about how risk-assessment processes and tools could inform their decision making around planting. Horticultural accreditation schemes, such as the Nursery Industry Accreditation Scheme Australia [72] and the pilot schemes currently running in California [73] and the UK [74], have huge potential to reduce the risk of pest and disease introductions by changing industry practices and allowing customers to make informed choices to source healthy plants, protecting both businesses and natural environments. Sourcing stock from accredited nurseries could also be used as an eligibility criterion for awards of funding or contracts for projects with a planting component. However, our dataset suggests that a small number of organizations do not routinely access funding or buy in-nursery stock, so alternative methods may be required to transfer knowledge and engage these organizations in changing practices to reduce risks. Maintaining uninfected populations with high genetic diversity is likely to be the best recourse against the disease, so reducing risks associated with potential introductory pathways is essential.
Restoration plantings of juniper increased every decade since 1960 but noticeably increased during the 1990s. Planting may have increased during the 1990s following the listing of five Annex 1 habitat types containing juniper under the EEC Habitats Directive (1992) that introduced targets to maintain populations [75] and early iterations of agri-environment schemes that supported tree planting [76]. Once juniper was listed in all four nations as a priority for biodiversity action [77], and population surveys showed sharp declines in juniper population extent and condition across the UK [24,25,26,27,78], planting was actively encouraged via publications [29,31,79,80] and grant support mechanisms [32,81]. Our dataset suggests that planting projects have had mixed success in addressing restoration aims and that limited follow-up monitoring is being conducted. Planting offers a potentially rapid and visible way to re-invigorate moribund populations, particularly where the age or sex distribution of stands is uneven. However, natural regeneration is likely to deliver longer-term benefits for population adaptation to climate change as well as novel diseases, and failing populations are often subject to other pressures unlikely to be rectified by planting such as inappropriate grazing regimes, waterlogging, competition with other species and lack of suitable recruitment microsites [25,51,73]. The larger area awarded support payments under the Scottish Forestry Grant Scheme for natural regeneration compared to planting projects suggests this is already being recognized by funding bodies [60], but expansion of the data collection, monitoring and enforcement capabilities of such schemes are required, as recommended by the Committee on Climate Change [7]. A review of planting schemes could inform thinking about the need for planting as a tool to protect dwindling populations versus its risk as a pathway for the introduction of pests and pathogens. The resulting insights could be used to revise the juniper management guidance [33,34] with examples of best practice, appropriate versus inappropriate planting settings and time needed following planting to detect disease symptoms. The finding that the highest percentage of planting events co-occurring with disease outbreaks detected between 2012 and 2016 were conducted in 2000–2009 may indicate a time lag between planting and disease detectability, especially as the initial root infection is difficult to diagnose compared to the foliage discoloration and loss that occurs once the pathogen has migrated into the stem and girdled the phloem with necrotic lesions [82]. If so, the extent of planting conducted 2010–2019 potentially foreshadows many more P. austrocedri outbreaks in geographically disparate populations over the coming decade. Though juniper populations planted along coastal fringes of Wales are monitored more routinely than plantings conducted in western Scotland, there is enough active recording to suspect that the lack of pathogen detections in these areas could be limited by shared environmental factors. The collation of this planting dataset will at least enable us to test spatial interactions between planted locations, P. austrocedri outbreaks and environmental conditions. However, the traceability of planting material used to restore habitats must be improved to understand better how these environmental relationships interact with planting practices in order to fulfill the UN goals of setting the right incentives and building capacity to ensure sustainable, long-term ecosystem restoration [1].
Author Contributions
Conceptualization, S.G. and F.D.; methodology, F.D. and B.V.P.; investigation, F.D. and S.G.; formal analysis, F.D.; data curation, F.D.; visualization, F.D.; writing—original draft preparation, F.D.; writing—review and editing, S.G. and B.V.P.; supervision, B.V.P. and S.G.; funding acquisition, B.V.P. and S.G. All authors have read and agreed to the published version of the manuscript.
Funding
This research was funded by the Scottish Forestry Trust, Scottish Forestry, Forest Research, NatureScot, the Royal Botanic Garden Edinburgh and the UK Centre for Ecology and Hydrology.
Data Availability Statement
The dataset “Juniper (Juniperus communis) planting conducted in the UK wider environment 1960–2020” of planting events analysed in this article is available to download from Zenodo at https://0-doi-org.brum.beds.ac.uk/10.5281/zenodo.4916250. These data are made available with kind permission from all contributing parties. The P. austrocedri distribution records are sensitive and partially derive from information submitted by members of the public via TreeAlert, who request that detailed grid references are not made publicly available. However, infected locations can be viewed from 1 km resolution distribution maps available here https://floradonald-juniper-planting-2020.shinyapps.io/Planting2/ accessed on 9 June 2021.
Acknowledgments
The authors would like to acknowledge all the organizations and BSBI recorders who contributed planting records and consented to make the data publicly available. We would especially like to thank Alan Anderson, Liam Blazey, Roy Barlow, Ian Bonner, Alan Brown, Mark Dinning, Mike Douglas, Martin Furness, Barbara Jones, Jill Hodge, Nicola Hunt, Richard Mason, Andrew McBride, Paul Muto, Laura Needham, Rachel Osborn, Jenny Park, Ewan Purser, Sally Pidcock, Shaila Rao, John Ratcliffe, Lee Schofield, Roy Sexton, Dave Shackleton, Gill Smart, Richard Thompson, Lena Ward, Andrew Warwick, Dan Watson and Alan Whitcroft for their advice regarding historical planting locations and for providing key datasets; Mick Biddle for verifying wider environment locations of P. austrocedri and local botanists who verified planting records including Andy Amphlett, Tom Dargie, Duncan Donald, Pete Madden, Keith Robson and Gordon Rothero. We would like to thank Louise Barwell for access to the Phytothreats database from which we compiled UK records of plant inspection visits for Phytophthoras, and Anna-Perez Sierra, Jane Barbrook and Alexandra Schlenzig as key contributors to this data.
Conflicts of Interest
The authors declare no conflict of interest. Scottish Forestry and NatureScot provided data analyzed in the study but none of the funding organizations had any role in the design of the study; analyses or interpretation of data; in the writing of the manuscript or in the decision to publish the results.
References
- United Nations. The United Nations Decade on Ecosystem Restoration; United Nations: New York, NY, USA, 2020; pp. 1–48. Available online: https://wedocs.unep.org/bitstream/handle/20.500.11822/31813/ERDStrat.pdf?sequence=1&isAllowed=y (accessed on 7 March 2021).
- International Union for Conservation of Nature. The Bonn Challenge; IUCN: Gland, Switzerland, 2020; Available online: https://www.bonnchallenge.org/about (accessed on 7 March 2021).
- United Nations Economic and Social Council. United Nations Strategic Plan for Forests 2017–2030 and Quadrennial Programme of Work of the United Nations Forum on Forests for the Period 2017–2020; United Nations: New York, NY, USA, 2017; pp. 1–24. Available online: https://www.un.org/esa/forests/documents/un-strategic-plan-for-forests-2030/index.html (accessed on 7 March 2021).
- Cobb, R.C.; Haas, S.E.; Kruskamp, N.; Dillon, W.W.; Swiecki, T.J.; Rizzo, D.M.; Frankel, S.J.; Meentemeyer, R.K. The magnitude of regional-scale tree mortality caused by the invasive pathogen Phytophthora ramorum. Earth’s Future 2020, 8, 1–15. [Google Scholar] [CrossRef]
- Sena, K.; Crocker, E.; Vincelli, P.; Barton, C. Phytophthora cinnamomi as a driver of forest change: Implications for conservation and management. For. Ecol. Manag. 2018, 409, 799–807. [Google Scholar] [CrossRef]
- Roy, B.A.; Alexander, H.M.; Davidson, J.; Campbell, F.T.; Burdon, J.J.; Sniezko, R.A.; Brasier, C. Increasing forest loss worldwide from invasive pests requires new trade regulations. Front. Ecol. Environ. 2014, 12, 457–465. [Google Scholar] [CrossRef] [Green Version]
- Jones, H.P.; Jones, P.C.; Barbier, E.B.; Blackburn, R.C.; Benayas, J.M.R.; Holl, K.D.; McCrackin, M.; Meli, P.; Montoya, D.; Mateos, D.M. Restoration and repair of Earth’s damaged ecosystems. Proc. R. Soc. B Biol. Sci. 2018, 285, 1–8. [Google Scholar] [CrossRef] [PubMed]
- International Union for Conservation of Nature. IUCN Definitions—English; IUCN: Gland, Switzerland, 2003; pp. 1–79. Available online: https://www.iucn.org/downloads/en_iucn__glossary_definitions.pdf (accessed on 7 March 2021).
- Committee on Climate Change. Land Use: Policies for a Net Zero UK; Committee on Climate Change: London, UK, 2020; pp. 1–121. Available online: https://www.theccc.org.uk/2020/01/23/major-shift-in-uk-land-use-needed-to-deliver-net-zero-emissions/ (accessed on 6 February 2021).
- Conservative Party (UK). The Conservative and Unionist Party Manifesto; The Conservative and Unionist Party: London, UK, 2019; pp. 1–59. Available online: https://assets-global.website-files.com/5da42e2cae7ebd3f8bde353c/5dda924905da587992a064ba_Conservative%202019%20Manifesto.pdf (accessed on 6 March 2021).
- Department for Environment, Food and Rural Affairs. Tree Health Resilience Strategy; DEFRA: London, UK, 2018; pp. 1–63. Available online: https://assets.publishing.service.gov.uk/government/uploads/system/uploads/attachment_data/file/710719/tree-health-resilience-strategy.pdf (accessed on 29 April 2019).
- The Scottish Government. Scotland’s Forestry Strategy 2019–2029; The Scottish Government: Edinburgh, UK, 2019; pp. 1–50. Available online: https://www.gov.scot/publications/scotlands-forestry-strategy-20192029/ (accessed on 31 January 2020).
- Freer-Smith, P.H.; Webber, J.F. Tree pests and diseases: The threat to biodiversity and the delivery of ecosystem services. Biodivers. Conserv. 2017, 26, 3167–3181. [Google Scholar] [CrossRef]
- Chapman, D.; Purse, B.V.; Roy, H.E. Global trade networks determine the distribution of invasive non-native species. Glob. Ecol. Biogeogr. 2017, 1–11. [Google Scholar] [CrossRef]
- Brasier, C.M. The biosecurity threat to the UK and global environment from international trade in plants. Plant Pathol. 2008, 57, 792–808. [Google Scholar] [CrossRef]
- Hansen, E.M. Phytophthora species emerging as pathogens of forest trees. Curr. For. Rep. 2015, 1, 16–24. [Google Scholar] [CrossRef] [Green Version]
- Jung, T.; Orlikowski, L.; Henricot, B.; Abad-Campos, P.; Aday, A.G.; Casal, O.A.; Bakonyi, J.; Cacciola, S.O.; Cech, T.; Chavarriaga, D.; et al. Widespread Phytophthora infestations in European nurseries put forest, semi-natural and horticultural ecosystems at high risk of Phytophthora diseases. For. Pathol. 2016, 46, 134–163. [Google Scholar] [CrossRef] [Green Version]
- Green, S.; Cooke, D.E.L.; Dunn, M.; Barwell, L.; Purse, B.; Chapman, D.; Valatin, G.; Schlenzig, A.; Barbrook, J.; Pettitt, T.; et al. PHYTO-THREATS: Addressing threats to UK forests and woodlands from Phytophthora; identifying risks of spread in trade and methods for mitigation. Forests 2021. under review. [Google Scholar]
- Redekar, N.R.; Eberhart, J.L.; Parke, J.L. Diversity of Phytophthora, Pythium, and Phytopythium species in recycled irrigation water in a container nursery. Phytobiomes J. 2019, 3, 31–45. [Google Scholar] [CrossRef] [Green Version]
- Redekar, N.R.; Bourret, T.B.; Eberhart, J.L.; Johnson, G.E.; Pitton, B.J.; Haver, D.L.; Oki, L.R.; Parke, J.L. The population of oomycetes in a recycled irrigation water system at a horticultural nursery in southern California. Water Res. 2020, 183, 1–10. [Google Scholar] [CrossRef]
- Frankel, S.J.; Conforti, C.; Hillman, J.; Ingolia, M.; Shor, A.; Benner, D.; Alexander, J.M.; Bernhardt, E.; Swiecki, T.J. Phytophthora introductions in restoration areas: Responding to protect California native flora from human-assisted pathogen spread. Forests 2020, 11, 1291. [Google Scholar] [CrossRef]
- Green, S.; Hendry, S.J.; Macaskill, G.A.; Laue, B.E.; Steele, H. Dieback and mortality of Juniperus communis in Britain associated with Phytophthora austrocedrae. New Dis. Rep. 2012, 26, 2. [Google Scholar] [CrossRef] [Green Version]
- Henricot, B.; Pérez-Sierra, A.; Armstrong, A.C.; Sharp, P.M.; Green, S. Morphological and genetic analyses of the invasive forest pathogen Phytophthora austrocedri reveal that two clonal lineages colonized Britain and Argentina from a common ancestral population. Phytopathology 2017, 107, 1532–1540. [Google Scholar] [CrossRef] [Green Version]
- Plantlife Scotland. The State of Scotland’s Juniper in 2015; Plantlife Scotland: Stirling, UK, 2015; pp. 1–20. Available online: https://www.plantlife.org.uk/application/files/6514/8241/0951/ScotsJuniper_report_2015.pdf (accessed on 30 January 2018).
- Hamilton, K. Juniper Juniperus communis and Yew Taxus baccata Survey in the Binevenagh Area, Co. Londonderry; Mantella Environmental: Belfast, UK, 2018; pp. 1–51. [Google Scholar]
- The Borders Forest Trust. Common Juniper (Juniperus communis L.): A Review of Biology and its Status in the Scottish Borders; Borders Forest Trust: Jedburgh, UK, 1996; pp. 1–39. [Google Scholar]
- Clifton, S.J.; Ward, L.K.; Ranner, D.S. The status of juniper Juniperus communis L. in north-east England. Biol. Conserv. 1997, 79, 67–77. [Google Scholar] [CrossRef]
- Ward, L.K. Evaluation of Juniper Sites in England and South Wales: The EC Species and Habitat Directive 1992; Institute of Terrestrial Ecology (Natural Environment Research Council): Wareham, UK, 1994; pp. 1–45. [Google Scholar]
- Sullivan, G. Extent and Condition of Juniper Scrub in Scotland; Scottish Natural Heritage: Inverness, UK, 2003; pp. 1–247. Available online: https://www.nature.scot/naturescot-archive-report-026-extent-and-condition-juniper-scrub-scotland (accessed on 30 January 2018).
- Plantlife International. Juniperus communis L. UK Biodiversity Action Plan (BAP); Plantlife International: Salisbury, UK, 2007; pp. 22–46. Available online: http://adlib.everysite.co.uk/resources/000/091/214/Jun1_dossier.pdf (accessed on 29 April 2019).
- Wilkins, T.C.; Duckworth, J.C. Breaking New Ground for Juniper—A Management Handbook for Lowland England; Plantlife: Salisbury, UK, 2011; pp. 1–38. Available online: https://www.plantlife.org.uk/application/files/4814/8155/5952/Breaking_new_ground_20_5_11.pdf (accessed on 30 January 2018).
- Forestry Commission Scotland. Action for Juniper; Scottish Forestry: Edinburgh, UK, 2009; pp. 1–12. Available online: https://forestry.gov.scot/publications/82-action-for-juniper/viewdocument (accessed on 6 January 2020).
- Forestry Commission Scotland. Guidance Planting Juniper in Scotland: Reducing the Risk from Phytophthora austrocedrae; Scottish Forestry: Edinburgh, UK, 2013; pp. 1–8. Available online: https://forestry.gov.scot/images/corporate/pdf/juniper-planting-guidance.pdf (accessed on 30 January 2018).
- Department for Environment, Food and Rural Affairs. Juniper: Management Guidelines; DEFRA: London, UK, 2017; pp. 1–32. Available online: https://www.planthealthcentre.scot/sites/www.planthealthcentre.scot/files/inline-files/JuniperManagementGuidelinesSeptember2017Published.pdf (accessed on 30 January 2018).
- Riddell, C.E.; Dun, H.F.; Elliot, M.; Armstrong, A.C.; Clark, M.; Forster, J.; Hedley, P.E.; Green, S. Detection and spread of Phytophthora austrocedri within infected Juniperus communis woodland and diversity of co-associated Phytophthoras as revealed by metabarcoding. For. Pathol. 2020, 1–12. [Google Scholar] [CrossRef]
- Mapping the Flora of the British Isles. Available online: https://bsbi.org/maps-and-data (accessed on 26 February 2021).
- Juniperus communis Records from Live Database. Available online: http://bsbi.org/maps?taxonid=2cd4p9h.8r1 (accessed on 6 February 2020).
- Scottish Ornithologists’ Club Interactive Site Finder. Available online: https://www.the-soc.org.uk/bird-recording/grid-reference-finder (accessed on 1 August 2020).
- R Core Team. R: A Language and Environment for Statistical Computing; R Foundation for Statistical Computing: Vienna, Austria, 2019; Available online: https://www.R-project.org/ (accessed on 13 September 2019).
- Wickham, H.; François, R.; Henry, L.; Muller, K. dplyr: A Grammar of Data Manipulation; R Package Version 0.8.4. 2020. Available online: https://cran.r-project.org/package=dplyr (accessed on 19 February 2021).
- Harrower, C. BRCmap: Biological Records Centre Atlas Mapping, R package version 0.10.3.1; UKCEH: Wallingford, UK, 2016. [Google Scholar]
- Wickham, H. ggplot2: Elegant Graphics for Data Analysis; Springer: New York, NY, USA, 2016. [Google Scholar]
- Environmental Systems Research Institute. ArcGIS Desktop: Release 10.5.1; ESRI: Redlands, CA, USA, 2017. [Google Scholar]
- GADM. United Kingdom Administrative Areas Version 1.0. Available online: https://www.diva-gis.org/gData (accessed on 12 September 2017).
- Bivand, R.; Keitt, T.; Rowlingson, B. rgdal: Bindings for the ‘Geospatial’ Data Abstraction Library; R Package Version 1.4-8. 2019. Available online: https://CRAN.R-project.org/package=rgdal (accessed on 19 February 2021).
- Bivand, R.S.; Edzer Pebesma, E.; Virgilio Gomez-Rubio, V. Applied Spatial Data Analysis with R, 2nd ed.; Springer: New York, NY, USA, 2013; pp. 1–405. [Google Scholar] [CrossRef]
- McBride, A.D. Implementation Plan for Borders Forest Trust Juniper Project; Borders Forest Trust: Jedburgh, UK, 1998; pp. 1–35. [Google Scholar]
- Lavery, L. Juniper Survey of Perth and Kinross, 2010; NatureScot: Inverness, UK, 2016; pp. 1–30. Available online: https://www.nature.scot/naturescot-commissioned-report-920-juniper-survey-perth-and-kinross-2010 (accessed on 30 January 2018).
- Squirrell, J.; Hollingsworth, P.M. An Assessment of Juniperus communis ssp. Hemisphaerica in Britain Using Molecular Markers; Natural Resources Wales: Cardiff, UK, 2008; pp. 1–20.
- Dines, T.D.; Daniels, A. Wales Juniper Inventory: An Inventory of Juniper Sites in Wales and an Assessment of Populations in Snowdonia; Plantlife International: Salisbury, UK, 2006; pp. 1–43. [Google Scholar]
- MagicMap. Available online: https://magic.defra.gov.uk/MagicMap.aspx (accessed on 14 November 2020).
- NatureScot/Mountain Woodland Action Group. Montane Scrub Database; NatureScot: Inverness, UK, 2015. [Google Scholar]
- Cumbria Wildlife Trust. Uplands for Juniper Survey, Final Report; Cumbria Wildlife Trust: Kendal, UK, 2014; pp. 1–11. [Google Scholar]
- Forestry Commission Scotland. Native Woodland Survey of Scotland (NWSS); Scottish Forestry: Edinburgh, UK, 2009.
- Mulholland, V.; Schlenzig, A.; MacAskill, G.A.; Green, S. Development of a quantitative real-time PCR assay for the detection of Phytophthora austrocedrae, an emerging pathogen in Britain. For. Pathol. 2013, 43, 513–517. [Google Scholar] [CrossRef]
- Smith, A.; Department of Agriculture, Environment and Rural Affairs, Belfast, UK. Personal communication, 2019.
- Bivand, R.; Rundel, C. rgeos: Interface to Geometry Engine—Open Source (‘GEOS’); R Package Version 0.5-5. 2020. Available online: https://CRAN.R-project.org/package=rgeos (accessed on 19 February 2021).
- Mangiafico, S. rcompanion: Functions to Support Extension Education Program Evaluation; R Package Version 2.4.0. 2021. Available online: https://CRAN.R-project.org/package=rcompanion (accessed on 8 March 2021).
- Tene, A.; Broome, A.; Connolly, T. Investigation of Possible Causes of Die-Back of Glenartney Juniper Wood SAC, Perthshire, 2006/07-2007/08 Part 1: Age Structure Analysis; Report commissioned by NatureScot; Forest Research: Roslin, UK, 2007; pp. 1–29. [Google Scholar]
- Cummings, J. Request under the Environmental Information (Scotland) Regulations 2004 (EIRs); Ref 2021/00152335; Scottish Forestry: Edinburgh, UK, 2021.
- Jones, B.; Countryside Council for Wales, Cardiff, UK. Personal communication, 2019.
- Swiecki, T.J.; Bernhardt, E.A. Testing and implementing methods for managing Phytophthora root diseases in California native habitats and restoration sites. In Proceedings of the Sudden Oak Death Sixth Science Symposium, San Francisco, CA, USA, 21–23 June 2016; pp. 53–55. Available online: https://www.fs.fed.us/psw/publications/documents/psw_gtr255/psw_gtr255_053.pdf (accessed on 5 March 2021).
- Sims, L.; Tjosvold, S.; Chambers, D.; Garbelotto, M. Control of Phytophthora species in plant stock for habitat restoration through best management practices. Plant Pathol. 2019, 68, 196–204. [Google Scholar] [CrossRef] [Green Version]
- Furness, M.; Natural England, Barnard Castle, UK. Personal communication, 2018.
- Colquhoun, I.J.; Kerp, N.L. Minimizing the spread of a soil-borne plant pathogen during a large-scale mining operation. Restor. Ecol. 2007, 15, 85–93. [Google Scholar] [CrossRef]
- Leonberger, A.J.; Speers, C.; Ruhl, G.; Creswell, T.; Beckerman, J.L. A survey of Phytophthora spp. in Midwest nurseries, greenhouses, and landscapes. Plant Dis. 2012, 97, 635–640. [Google Scholar] [CrossRef] [PubMed] [Green Version]
- Santini, A.; Ghelardini, L.; de Pace, C.; Desprez-Loustau, M.L.; Capretti, P.; Chandelier, A.; Cech, T.; Chira, D.; Diamandis, S.; Gaitniekis, T.; et al. Biogeographical patterns and determinants of invasion by forest pathogens in Europe. New Phytol. 2013, 197, 238–250. [Google Scholar] [CrossRef] [PubMed] [Green Version]
- Green, S.; James, E.R.; Clark, D.; Clarke, T.K.; Riddell, C.E. Evidence for natural resistance in Juniperus communis to Phytophthora austrocedri. J. Plant Pathol. 2020, 103, 55–59. [Google Scholar] [CrossRef]
- RHS Plant Health Principles. Available online: https://www.rhs.org.uk/about-the-rhs/policies/plant-health-principles (accessed on 5 March 2021).
- Slawson, D. Guidance: Plant Biosecuity Number 1—Sourcing Plants; National Trust: Swindon, UK, 2015; pp. 1–3. Available online: https://plantnetwork.org/wordpress/wp-content/uploads/3376/24082015-plant-biosecuritynote1sourcing-final.pdf (accessed on 5 March 2021).
- Woodland Trust. Tree Health; UK Biosecurity and plant imports; Woodland Trust: Grantham, UK, 2017; pp. 1–6. Available online: https://www.woodlandtrust.org.uk/media/1731/biosecurity-and-plant-imports-position-statement.pdf (accessed on 5 March 2021).
- Nursery Industry Accreditation Scheme Australia. Best Management Practice Guidelines for Nursery Production Growing Media Supply and Greenlife Market; Greenlife Industry Australia: Sydney, NSW, Australia, 2019; pp. 1–325. Available online: https://nurseryproductionfms.com.au/wp-content/uploads/2020/04/NIASA-Guidelines-8th-Edition-2019_Preview.pdf (accessed on 11 May 2021).
- Plant Health Alliance Steering Group. Plant Health Management Standard—General Requirements for Plant Growers and Suppliers; Plant Health Alliance Steering Group: Norwich, UK, 2019; pp. 1–8. Available online: https://planthealthy.org.uk/assets/downloads/3_Plant-health-management-standard-v1.0-published-240119.pdf (accessed on 5 March 2021).
- Elwes, H.J.; Henry, A. Juniperus communis, Common juniper. In The Trees of Great Britain and Ireland; Cambridge University Press: Cambridge, UK, 2014; Volume 6, pp. 1400–1408. [Google Scholar] [CrossRef]
- Joint Nature Conservation Committee. Conservation Status Assessment for: H2250: Coastal Dunes with Juniperus spp. In Second Report by the United Kingdom under Article 17 on the Implementation of the Directive from January 2001 to December 2006; JNCC: Peterborough, UK, 2007; pp. 1–16. Available online: https://jncc.gov.uk/our-work/article-17-habitats-directive-report-2019 (accessed on 30 January 2018).
- Natural England. Evolution of Agri-Environment Schemes in England; Natural England: York, UK, 2012. Available online: http://publications.naturalengland.org.uk/publication/3567470 (accessed on 6 March 2021).
- Joint Nature Conservation Committee. List of UK BAP Priority Vascular Plant Species; JNCC: Peterborough, UK, 2007; pp. 1–10. Available online: http://jncc.defra.gov.uk/page-5171 (accessed on 29 April 2017).
- Ward, L.K.; Shellswell, C.H. Looking After Juniper: Ecology, Conservation and Folklore; Plantlife: Salisbury, UK, 2017; pp. 1–75. Available online: https://www.plantlife.org.uk/application/files/7614/8958/6210/JUNIPER_DOSSIER_13_2_17_CS.pdf (accessed on 30 January 2018).
- Broome, A. Growing Juniper: Propagation and Establishment Practices; Forestry Commission Information Note: Edinburgh, UK, 2003; pp. 1–12. Available online: https://www.forestresearch.gov.uk/documents/4953/fcin050.pdf (accessed on 31 May 2017).
- Landowners Urged to Stop Juniper Disappearing off the Map in Scotland. Available online: https://webarchive.nationalarchives.gov.uk/20120214195119/http://www.forestry.gov.uk/newsrele.nsf/WebNewsReleases/F339E0C1077D45B18025796B004C6417 (accessed on 5 March 2021).
- Forestry Commission Scotland. Support for Juniper Conservation under the Scottish Rural Development Programme (SRDP); Scottish Forestry: Edinburgh, UK, 2006; pp. 1–9. Available online: https://scotland.forestry.gov.uk/images/corporate/pdf/junipersrdptechnicalnote.pdf (accessed on 6 January 2020).
- Green, S.; Elliot, M.; Armstrong, A.; Hendry, S.J. Phytophthora austrocedrae emerges as a serious threat to juniper (Juniperus communis) in Britain. Plant Pathol. 2015, 64, 456–466. [Google Scholar] [CrossRef]
Figure 1.
Comparison of the distribution of all P. austrocedri detections located in the wider environment (a) with all wider environment juniper planting carried out 1980–2019 (b) and carried out per decade (c–f). Planting locations (dark blue) are mapped against the distribution of native juniper (light blue) recorded since 1990. Maps a and b can be viewed online at https://floradonald-juniper-planting-2020.shinyapps.io/Planting2/ accessed on 9 June 2021.

Figure 2.
Juniper records 1960 to 2019, comparing all records collected at ≥2 km resolution (dotted line) with all planting records (grey line), the number of tetrads (2 km × 2 km grid cells) planted each year (black line) and the first detection of P. austrocedri infecting a juniper population in the wider environment (red line).

Figure 3.
Comparison of distances (km) calculated between 130, 1 km resolution grid cells where P. austrocedri was apparently absent, and the same number of infected cells, to the nearest 2 km resolution planting event conducted before the date visited. Cells treated as “absent” were either visited 2012–2019 and showed no symptoms or sample material tested negative, and were drawn only from 2 km tetrads with no disease detections; infected cells contained a positive P. austrocedri detection (see Section 2.5).

Figure 4.
Distribution of tetrads (2 km × 2 km cells) across juniper conservation action zones for Scotland [33] that specifies different priorities for juniper planting. Maps (a–c) display tetrads containing (a) positive P. austrocedri detections, (b) wider environment juniper planting locations 1983–2013 and (c) planting locations 2014–2019.


Table 1.
List of responses associated with planting records that address the themes (shown in bold) exploring who carries out juniper planting in the UK, their motivations, scheme size and sources of material. Responses are listed in order of frequency.
Table 1.
List of responses associated with planting records that address the themes (shown in bold) exploring who carries out juniper planting in the UK, their motivations, scheme size and sources of material. Responses are listed in order of frequency.
| Theme | Categorized Response |
|---|---|
| Number of plants | ≤50 45% |
| 50–500 35% | |
| 500–4000 14% | |
| 10,000 2% | |
| 200 plants every year for ~10 years 4% | |
| Organizations conducting planting | Conservation charities and wildlife trusts |
| Public estate including county councils and MOD | |
| Utility companies | |
| National/regional parks | |
| Community groups | |
| Private individuals | |
| Commercial (forestry and landscaping) | |
| Reasons for planting | Landscaping for infrastructure (roads, forest tracks, dams) |
| Amenity (trading estates, hotels, golf courses, churchyards, carparks) | |
| Restoration of native woodlands | |
| Woodland creation | |
| Population conservation with explicit references to loss of extent, lack of natural regeneration, gender imbalance, poor age structure | |
| Source material | Local provenance |
| Native stock | |
| Commercial source | |
| Material type | Cuttings |
| Seed | |
| Propagation setting | Central nursery specific to the organization |
| Commercial nursery | |
| On-site nursery | |
| Research institute (e.g., zoo or botanic garden) | |
| Direct in-situ sowing or planting | |
| Private garden | |
| Monitoring | Qualitative assessment, e.g., “favourable”, “well established”, “growing well”, “struggling” |
| Assessment of pressures, e.g., poor quality stock; damaged by herbivores including deer, sheep, rabbits, voles; damaged by snow or wind exposure; lost to muirburn; shaded by other trees or smothered by rank grass | |
| States that monitoring is taking place but provides no further detail | |
| Detailed assessment of planting success, e.g., percentage of surviving plants | |
| Observations of subsequent berrying or natural regeneration | |
| Presence or absence of P. austrocedri symptoms |
Table 2.
Summary of the total number (n) of planting records, total number and percentage (%) of planting events, numbers and percentages of planting events and of juniper planted per event found in the 500 m radius buffer zone surrounding 130 P. austrocedri absence and 130 infected locations, selected as the minimum distance to a planting event per 1 km grid cell (monad). Planting events refer to planting carried out at a location in a specific year that could be documented by one or more planting records. * Records were extracted where planting events took place before, or in the same year, as visit or detection.
| Absence Locations | Infected Locations | ||||
|---|---|---|---|---|---|
| n | % | n | % | ||
| Number of planting records located in buffer zones | 89 | n/a | 115 | n/a | |
| Number of previous * planting events located in buffer zones | 41 | 32 | 25 | 19 | |
| Number of planting events per buffer zone | 1 | 22 | 54 | 8 | 35 |
| 2 | 9 | 22 | 2 | 9 | |
| 3 | 4 | 10 | 3 | 13 | |
| 4 | 3 | 7 | 1 | 4 | |
| 5 | 1 | 2 | 1 | 4 | |
| 7 | 0 | 0 | 1 | 4 | |
| 9 | 1 | 2 | 0 | 0 | |
| 10 | 0 | 0 | 4 | 17 | |
| 11 | 1 | 2 | 0 | 0 | |
| 12 | 0 | 0 | 2 | 9 | |
| 14 | 0 | 0 | 1 | 4 | |
| records with information | 41 | 46 | 23 | 20 | |
| Number of juniper planted per event | <50 | 19 | 44 | 16 | 15 |
| 50–499 | 11 | 26 | 61 | 56 | |
| >500 (to 3000) | 13 | 30 | 32 | 29 | |
| records with information | 43 | 48 | 109 | 95 | |
Table 3.
Propagation setting of planting material and type of organization overseeing the planting project according to categories detailed on Table 1. The number (n) and percentage (%) of planting records with associated information per category are shown for planting events occurring in the buffer zone of absence (41 monads, 89 planting events) and infected (25 monads, 115 planting events) locations.
| Absent | Infected | ||||
|---|---|---|---|---|---|
| n | % | n | % | ||
| Propagation setting | Organization-specific central nursery | 17 | 50 | 44 | 57 |
| Commercial nursery | 10 | 29 | 33 | 43 | |
| Research institute | 1 | 3 | 0 | 0 | |
| Direct in-situ sowing | 6 | 18 | 0 | 0 | |
| records with information | 34 | 38 | 77 | 67 | |
| Organization | Conservation charities and wildlife trusts | 14 | 35 | 59 | 88 |
| Public estate and statuotry agencies | 22 | 53 | 6 | 9 | |
| Utility companies | 4 | 10 | 2 | 3 | |
| records with information | 40 | 45 | 67 | 58 | |
Table 4.
Geographic distribution of planting records in buffer zones associated with absence (41 monads, 89 planting events) and infected (25 monads, 115 planting events) locations shown as the number (n) and percentage (%) of planting records per category.
Table 4.
Geographic distribution of planting records in buffer zones associated with absence (41 monads, 89 planting events) and infected (25 monads, 115 planting events) locations shown as the number (n) and percentage (%) of planting records per category.
| Country | Region | Absent | Infected | ||
|---|---|---|---|---|---|
| n | % | n | % | ||
| Scotland | Western | 8 | 9 | 0 | 0 |
| Eastern | 3 | 3 | 0 | 0 | |
| Central | 1 | 1 | 2 | 2 | |
| Southern | 0 | 0 | 21 | 18 | |
| Country total | 12 | 13 | 23 | 20 | |
| England | Northern | 52 | 58 | 90 | 78 |
| Southern | 2 | 2 | 2 | 2 | |
| Country total | 54 | 61 | 92 | 80 | |
| Wales | North | 15 | 17 | 0 | 0 |
| South | 8 | 9 | 0 | 0 | |
| Country total | 23 | 26 | 0 | 0 | |
Table 5.
Temporal distribution of planting events in buffer zones comparing absence (41 monads, 89 events) and infected (25 monads, 115 events) locations as number (n) and percentage (%) of records per category per decade.
Table 5.
Temporal distribution of planting events in buffer zones comparing absence (41 monads, 89 events) and infected (25 monads, 115 events) locations as number (n) and percentage (%) of records per category per decade.
| Planting Decade | Absence | Infected | ||
|---|---|---|---|---|
| n | % | n | % | |
| 1970–1979 | 1 | 1 | 0 | 0 |
| 1980–1989 | 0 | 0 | 1 | 1 |
| 1990–1999 | 11 | 12 | 10 | 9 |
| 2000–2009 | 44 | 49 | 81 | 70 |
| 2010–2019 | 33 | 37 | 23 | 20 |
Table 6.
Number (n) and percentage (%) of juniper tetrads associated with positive P. austrocedri detections and planting events during 1983–2013 and 2014–2019 (before and after publication of the most recent planting guidance) in Scottish juniper conservation zones.
Table 6.
Number (n) and percentage (%) of juniper tetrads associated with positive P. austrocedri detections and planting events during 1983–2013 and 2014–2019 (before and after publication of the most recent planting guidance) in Scottish juniper conservation zones.
| Juniper Conservation Zone | ||||
|---|---|---|---|---|
| 1 | 2 | 3 | ||
| Planting Rarely Required | Some Planting for Moribund Populations only | Planting Needed to Restore Minimum Breeding Population and Expand Range | ||
| P. austrocedri | n | 57 | 3 | 8 |
| % | 84 | 4 | 12 | |
| Planting 1983–2013 | n | 27 | 50 | 98 |
| % | 15 | 29 | 56 | |
| Planting 2014–2019 | n | 25 | 27 | 35 |
| % | 28 | 31 | 40 | |
Publisher’s Note: MDPI stays neutral with regard to jurisdictional claims in published maps and institutional affiliations. |
© 2021 by the authors. Licensee MDPI, Basel, Switzerland. This article is an open access article distributed under the terms and conditions of the Creative Commons Attribution (CC BY) license (https://creativecommons.org/licenses/by/4.0/).
Share and Cite
MDPI and ACS Style
Donald, F.; Purse, B.V.; Green, S. Investigating the Role of Restoration Plantings in Introducing Disease—A Case Study Using Phytophthora. Forests 2021, 12, 764. https://0-doi-org.brum.beds.ac.uk/10.3390/f12060764
AMA Style
Donald F, Purse BV, Green S. Investigating the Role of Restoration Plantings in Introducing Disease—A Case Study Using Phytophthora. Forests. 2021; 12(6):764. https://0-doi-org.brum.beds.ac.uk/10.3390/f12060764
Chicago/Turabian StyleDonald, Flora, Bethan V. Purse, and Sarah Green. 2021. "Investigating the Role of Restoration Plantings in Introducing Disease—A Case Study Using Phytophthora" Forests 12, no. 6: 764. https://0-doi-org.brum.beds.ac.uk/10.3390/f12060764
Note that from the first issue of 2016, this journal uses article numbers instead of page numbers. See further details here.