
Forest Fire Forecasting Using Fuzzy Logic Models


Soft Computing Research Group at Intelligent Data Science and Artificial Intelligence Research Center, Universitat Politènica de Catalunya, Jordi Girona Salgado 1-3, 08034 Barcelona, Spain
*
Author to whom correspondence should be addressed.
Forests 2021, 12(8), 1005; https://0-doi-org.brum.beds.ac.uk/10.3390/f12081005
Submission received: 7 June 2021
/
Revised: 16 July 2021
/
Accepted: 27 July 2021
/
Published: 29 July 2021
(This article belongs to the Special Issue Wildfire Behavior and Risk: From Fundamental Research to Pioneering Modeling Approaches)
Abstract
:In this study, we explored hybrid fuzzy logic modelling techniques to predict the burned area of forest fires. Fast detection is crucial for successful firefighting, and a model with an accurate prediction ability is extremely useful for optimizing fire management. Fuzzy Inductive Reasoning (FIR) and the Adaptive Neuro-Fuzzy Inference System (ANFIS) are two powerful fuzzy techniques for modelling burned areas of forests in Portugal. The results obtained from them were compared with those of other artificial intelligence techniques applied to the same datasets found in the literature.
1. Introduction
As discussed in [1], weather and climate are the most important factors influencing fire activity, and they are changing due to human industry. In the near future with a warmer climate, we expect more severe fire weather, more burned area, more ignitions and a longer fire season. It is possible to see these effects right now, for example: Australian fires since September 2019 that have burned at least 17.9 million acres, destroyed more than 3000 homes, and killed at least 28 people.
The Climate Atlas of Canada [2], clearly explains this vicious cycle connecting forest fires and climate change. All efforts to reduce global warming help prevent forest fires, which, in turn, mitigates climate change. In this context, any effort to improve forest fire management is of special relevance and utility. In this regard, accurate predictions of burned areas offer useful knowledge for management decisions and resource planning.
It is possible to find in the literature a considerable number of research papers that deal with predicting burned areas using different artificial intelligence and machine-learning models. Several of these, mainly based on neural networks, were developed in [3,4,5], and their usefulness for predicting burned areas were studied and compared. Random forest, radial basis functions, genetic algorithms and support vector machines were also used by several authors for the task at hand [6,7,8,9]. In [9], a wildfire probability prediction method employing Bayesian networks and fuzzy logic was studied and evaluated through a case study in Australia. Other machine-learning methodologies, such as ensemble learning, were also addressed, of which random forest approximations delivered the best results [10]. Another interesting ensemble approach for improving the predictive accuracy of forest fire can be found in [11]. The authors combined a locally weighted learning algorithm with the Cascade Generalization, Bagging, Decorate, and Dagging ensemble learning techniques and applied it to a region of Vietnam. An investigation focused on the Monte Carlo heuristic search algorithm was conducted to predict the spread of forest fires [12].
All of these papers used real data from different parts of the world to train and validate their models.
In this paper we addressed the challenge of modelling forest fires by means of hybrid machine-learning techniques based on fuzzy logic to predict the areas forest fires will burn.
We studied two fuzzy-based learning approaches: Fuzzy Inductive Reasoning (FIR) and the Adaptive Neuro Fuzzy Inference System (ANFIS) because they have been shown to have high predictive power in medicine, energy and other areas [13,14,15,16]. Fuzzy logic modelling can handle uncertainties and explain complex relationships and causal relations between variables to enable better decision-making and design strategies. The forest fires datasets in the UCI repository [17,18] were used in the current research. This was the first time that FIR was used to model forest fire burned areas.
2. Materials and Methods
FIR and ANFIS combine mainly soft computing approaches: FIR combines fuzzy logic with machine-learning and ANFIS combines it with neural networks.
2.1. Fuzzy Inductive Reasoning (FIR)
The General System Problem Solving (GSPS) developed by George Klir [19], is the conceptual basis of this fuzzy approach, the main objective of which is to extract knowledge from data.
This method of modelling and simulation performs an internal and automatic process of relevant feature selection that allows identifying not only the variables that have the most predictive power but also when they are most relevant. FIR can describe systems that contain uncertainty, i.e., those for which the underlying physical laws are not well understood.
We developed two software approaches: FIR and Visual-FIR [20,21]. The first is meant for data scientists with previous knowledge of modelling and data treatment, while the second offers a more user-friendly environment for the development of system models as predetermined blocks with default values for different parameters.
The FIR technique of both FIR and Visual-FIR consists of two steps. The first involves the identification of the model representing the system under study, including feature selection and knowledge extraction from data. The second step corresponds to a prediction of the system’s future behaviour based on the previously identified model.
A FIR model is composed of two fundamental items: structure and historical behavior. The former refers to the selection of both spatial and temporal variables (i.e., feature selection); the latter concerns input/output relationships defined as if–then rules.
As described in [20], feature selection is based on the maximization of a model’s forecasting power quantified by a Shannon entropy-based quality measure, which determines the uncertainty associated with forecasting a particular output state given any legal input state. The overall entropy of the model structure, Hs, is computed as described in Equation (1).
where p(i) is the probability of that input state’s occurring, and Hi is the Shannon entropy relative to the ith input state. Then, a normalized overall entropy Hn is computed, as defined in Equation (2).
Hn is a real number between 0.0 and 1.0, where a higher value indicates a higher forecasting power. The model structure with highest Hn value generates forecasts with the smallest amount of uncertainty.
Once the first item has been completed, i.e., when the features with the most predictive power have been selected, they are used to obtain the input/output relationships from the data reserved for training the model. These relationships are defined by a set of if–then rules. From this rule base, which describes the behaviour of the system, the prediction stage can be carried out. To do this, we selected the subset of k rules that were the closest (using a distance measure) to the new input for which we wanted an output prediction. The kNN (k-nearest-neighbors) fuzzy inference algorithm was used for this purpose. The fuzzy membership function of the current state was predicted by computing a distance-weighted average of the fuzzy membership functions of the rules selected as the closest, as presented in Equation (3).
2.2. Adaptive Neuro-Fuzzy Inference System (ANFIS)
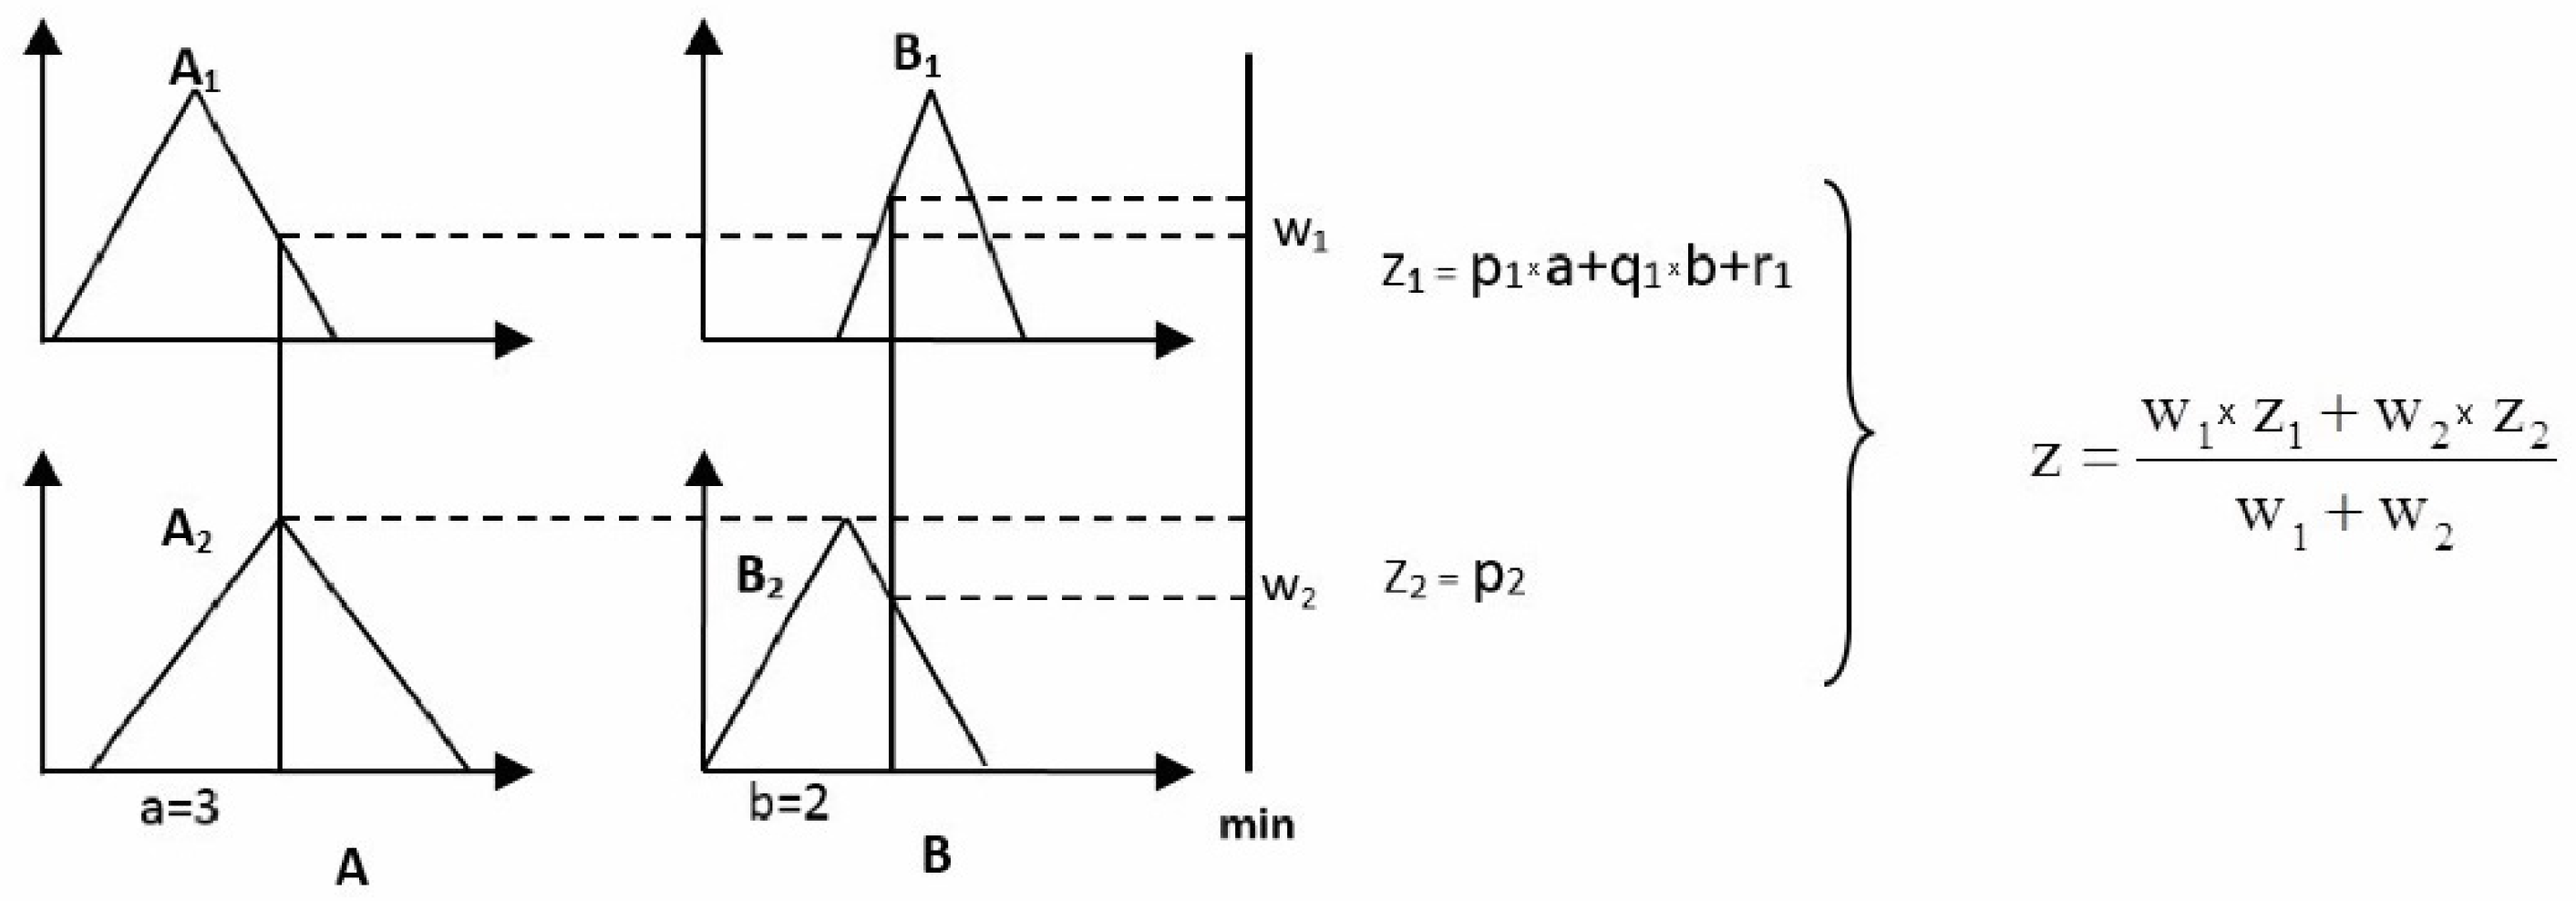
ANFIS is a hybrid neuro-fuzzy system introduced by Jang [22,23] and has been widely used in the literature. ANFIS is a Sugeno-type fuzzy system that uses neural network learning to adjust and tune its own parameters, i.e., membership and output functions. Equation (4) presents an example of two Sugeno rules. Their key property is that the consequent of the rules can be a crisp function or a constant value.
R1: If A is A1 and B is B1 then p1 × a+ q1 × b + r1
R2: If A is A2 and B is B2 then p2
R2: If A is A2 and B is B2 then p2
Figure 1 shows the inference process of a Sugeno-type fuzzy system when the rule set defined in Equation (4) conforms to the fuzzy model.
The input values of the fuzzy variables A and B, i.e., a = 3 and b = 2, are singletons to which the T-norm operator (min) is applied to determine the firing strength of each rule (left-hand side of Figure 1). The min operator stablishes the weights, w1 and w2, associated with each rule, which are then used to obtain the output of the inference process, i.e., z (right-hand side of Figure 1), by a weighted average equation.
Therefore, Sugeno’s fuzzy system has two sets of parameters that must be set or learned. One refers to the parameters of the membership functions of fuzzy variables. The other refers to the values p1, q1, r1 and p2 of the polynomials that determine the consequents. The ANFIS initializes these parameter sets and then tunes them automatically using optimization algorithms commonly used in neural networks. The input parameters are tuned using a gradient descent algorithm, and the output parameters are tuned by means of a least-squares estimator algorithm. A deeper explanation can be found in [22,23]. The fuzzy toolbox of Matlab contains an implementation of the ANFIS.
2.3. Forest Fire Data
The data used in this study came from the UCI machine learning repository [18] and contains information on fires in the northeast region of Portugal from January 2020 to December 2003. As explained in [17], the data set was built as a composition of two sources. In the first, every time a forest fire occurred, several features were registered daily: time, date, spatial location in a 9 × 9 grid, type of vegetation involved, components of the forest fire weather index (FWI) and the total burned area. The FWI is the Canadian system for rating fire danger [24] in which high FWI values correspond to severe burning. The second source contains several weather observations recorded within a 30 min period by a meteorological station. The two databases were integrated into a single dataset of 517 forest fire entries. Table 1 describes the registered data features.
The first four rows contain spatial and temporal attributes. Then, we have the FWI attributes, where FFMC stands for Fine Fuel Moisture Code; DMC is Duff Moisture Code; DC is for Drought Code; and ISI is for Initial Spread Index. The last 5 features are weather attributes, the values of which correspond to the records obtained by the station sensors once the fire has been detected. However, the rain values correspond to the accumulated precipitation during the previous half hour. On the other hand, a logarithm transformation was applied to the burned area variable to reduce the positive skew trait.
2.4. Model Evaluation
In this research, a 10 fold cross validation (10-fold CV) technique was applied to study the performance and viability of the models. The training data were used to obtain the model and the test data were used to determine the model error. We performed the cross validation 10 times. This means that the dataset was randomly partitioned 10 times into a training and test subsets, then the model was obtained from the training data and the error on the test set was calculated. This allowed us to have sufficient statistical confidence.
The RMSE (root mean square) and the MAE (mean absolute deviation) errors are the ones chosen to determine the models performance. These error measures are described in Equations (5) and (6), respectively.
where is the predicted output, the system output and the number of samples.
Both RMSE and MAE are commonly used accuracy measures for comparing different methods on the same data, as is the case in this research. The MAE gave equal weight to errors in the average, i.e., corresponded to a linear score. The RMSE gave a relatively high weight to large errors, since the errors were squared before being averaged. This meant that the RMSE was the most useful when large errors were particularly undesirable.
2.5. Fuzzy Model Development
In this research, 100 fuzzy models were developed and validated for FIR and the ANFIS: a 10-fold cross validation applied 10 times, gives the identification of 100 models.
The first step to obtain a fuzzy models was the discretizing of the variables in the system. The process entailed the transformation of crisp variables into fuzzy variables, i.e., it was necessary to define fuzzy sets and their representation by means of membership functions.
An analysis of the variables (see Table 1) was carried out, taking into account their histograms and the input/output correlation to determine the most suitable number of classes to discretize each of them. As a consequence, the variables X, Y, month, FFMC, DMC, DC, ISI, RH, temperature and wind were represented in three fuzzy sets and the day of the week and rain were discretized into two classes. For the day-of-the-week variable, we grouped weekdays and weekends. Two classes were also used for the rain variable since there is no much variability in this parameter. Although the amount of rain varied from 0.2 to 6.4 mm/m2, the number of rain events was small. This limitation meant that the precision of the model did not increase when this variable was represented by a greater number of fuzzy sets. On the contrary, an increase in the number of classes led to a “curse of dimensionality” problem.
Finally, the output variable was discretized into three classes or fuzzy sets, but it was used only by the FIR approximation since, as previously mentioned, the ANFIS has a function as its output (see Figure 1). All fuzzy sets were represented by bell-shaped membership functions.
2.5.1. FIR Models
As previously mentioned, to identify the best FIR models that capture the knowledge of the system, it is first of all necessary to convert quantitative data into qualitative data. This is done by the fuzzification process once the necessary parameters have been defined, which are the number of linguistic values (fuzzy sets) and their representation through membership functions.
The shape and distribution of the membership functions depend on the algorithm used in the discretization process, which will directly influence the prediction process and, therefore, the inference results. In this research, FIR uses two discretization algorithms: the equal-width partition (EWP) and the equal-frequency partition (EFP) [15]. In the first, the universe of discourse of the linguistic variable is divided in such a way that the membership functions are uniformly distributed. In the second one, the membership functions are distributed so that each represents the same number of data points. Following this rule, the distribution of the membership functions obtained is usually non-uniform.
Variables X, Y, month, FFMC, DMC, DC, ISI, RH, temperature, day of the week and wind are discretized using the EFP algorithm. The variables of rain and area are discretized using the EWP algorithm.
Once the data has been discretized, FIR performs a feature selection process where the more relevant causal relations between the input and output variables are identified. To this end, we used the model structure identification process of fuzzy inductive reasoning to perform a feature selection based on the entropy reduction measure as described in Section 2.1.
The feature selection process performed by FIR concluded that temperature, RH, wind, rain and FFMC, are the most relevant (have the strongest causal relationship to the output) for determining the burned area efficiently and accurately. If we had use additional variables in the inference process, the entropy would have increased, thereby decreasing the predictive power.
2.5.2. The ANFIS Models
In this case, as mentioned before, it is necessary to define three fundamental parameters to carry out the tuning process of the fuzzy system. The first one corresponds to the function that defines the consequent of the rules, which can be a first-order polynomial or a zero-order constant. In this research, a constant is defined as consequent since this option is less computationally expensive and, in this case, using a first-order polynomial did not improve the precision of the fuzzy model. The second parameter corresponded to the fuzzy system optimization algorithm. Here, we used the gradient descent algorithm combined with the least-squares estimator algorithm. The third parameter allowed us to define the number of training epochs: in this case, 50 epochs were enough for the tuning to converge.
In the ANFIS, variables are initially discretized following a uniform distribution of the membership functions in their dimensionality space. The ANFIS could not use the 12 input variables to predict the total burned area output since the computational cost is high and the Matlab software ran out of internal memory. Therefore, it was first necessary to achieve a feature selection to be able to obtain models and study their accuracy. To this end, we decided to make use of the FIR feature selection process as a pre-processing step, and use the subset of selected input variables, previously mentioned, to obtain the best ANFIS model to predict the burned areas.
3. Results
The main goal of this research was to study the performance of hybrid fuzzy logic modelling techniques to predict the burned area of forest fires. As mentioned earlier, models with accurate prediction ability are beneficial for optimizing fire management efforts. Therefore, the results obtained by FIR and ANFIS models are presented in this section.
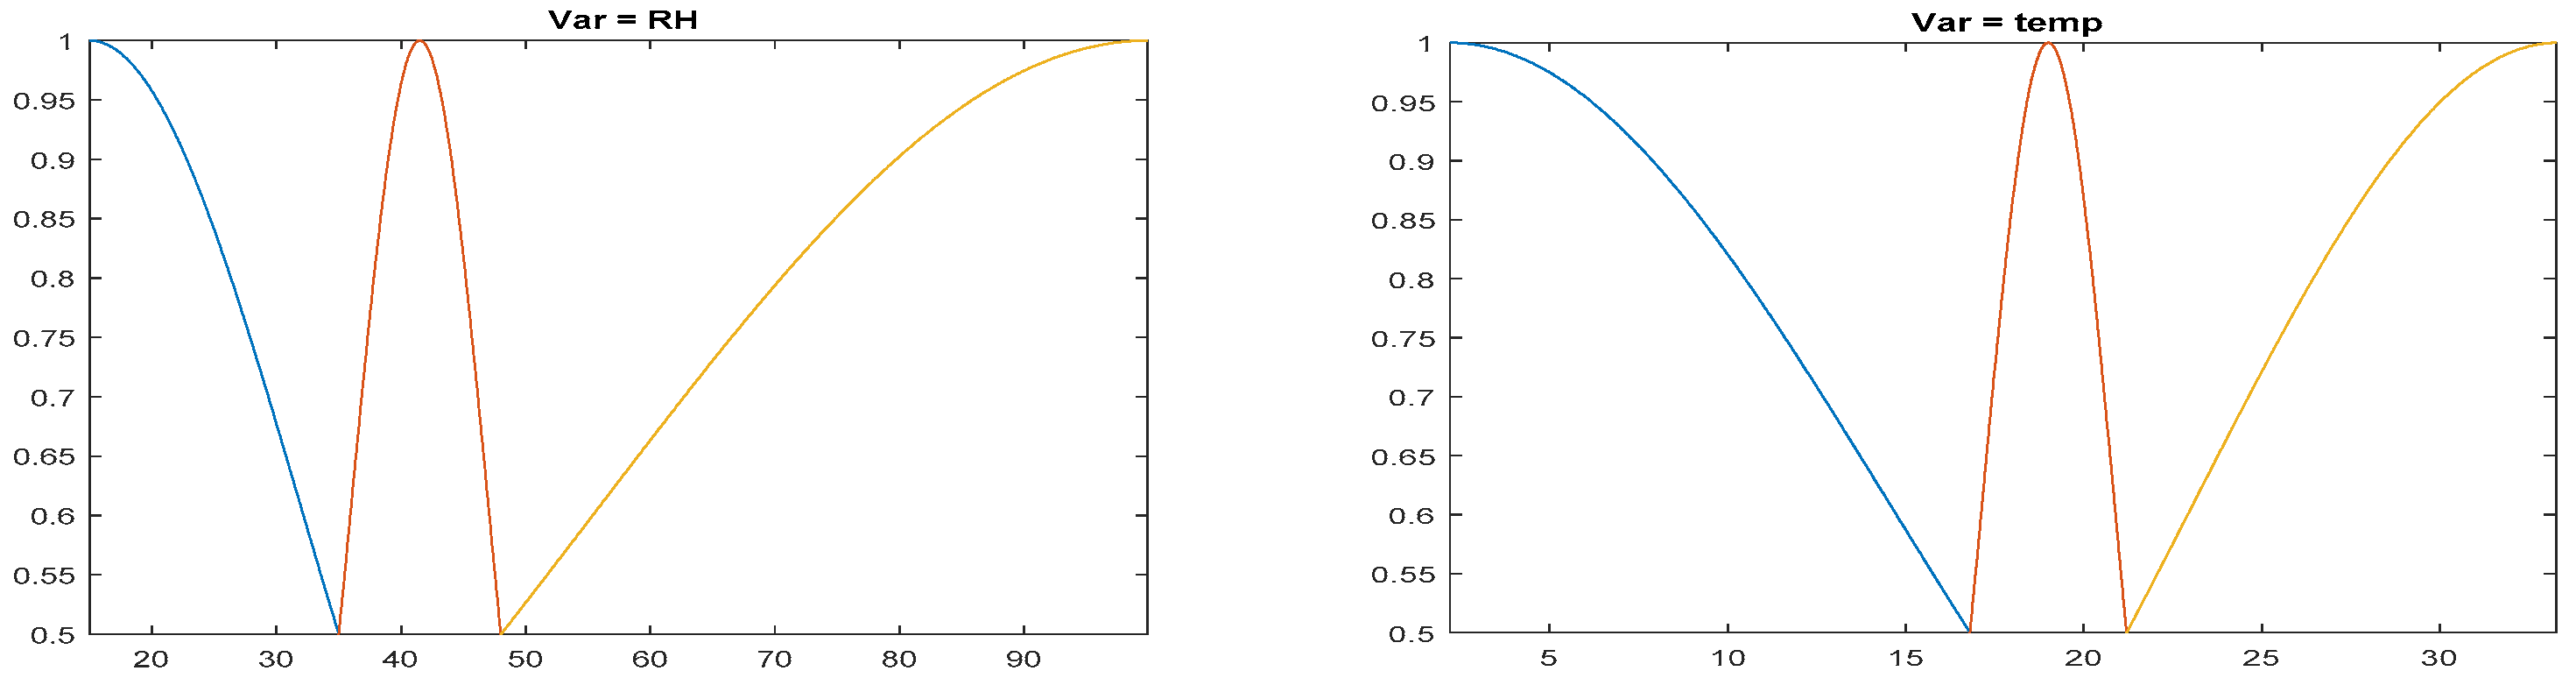
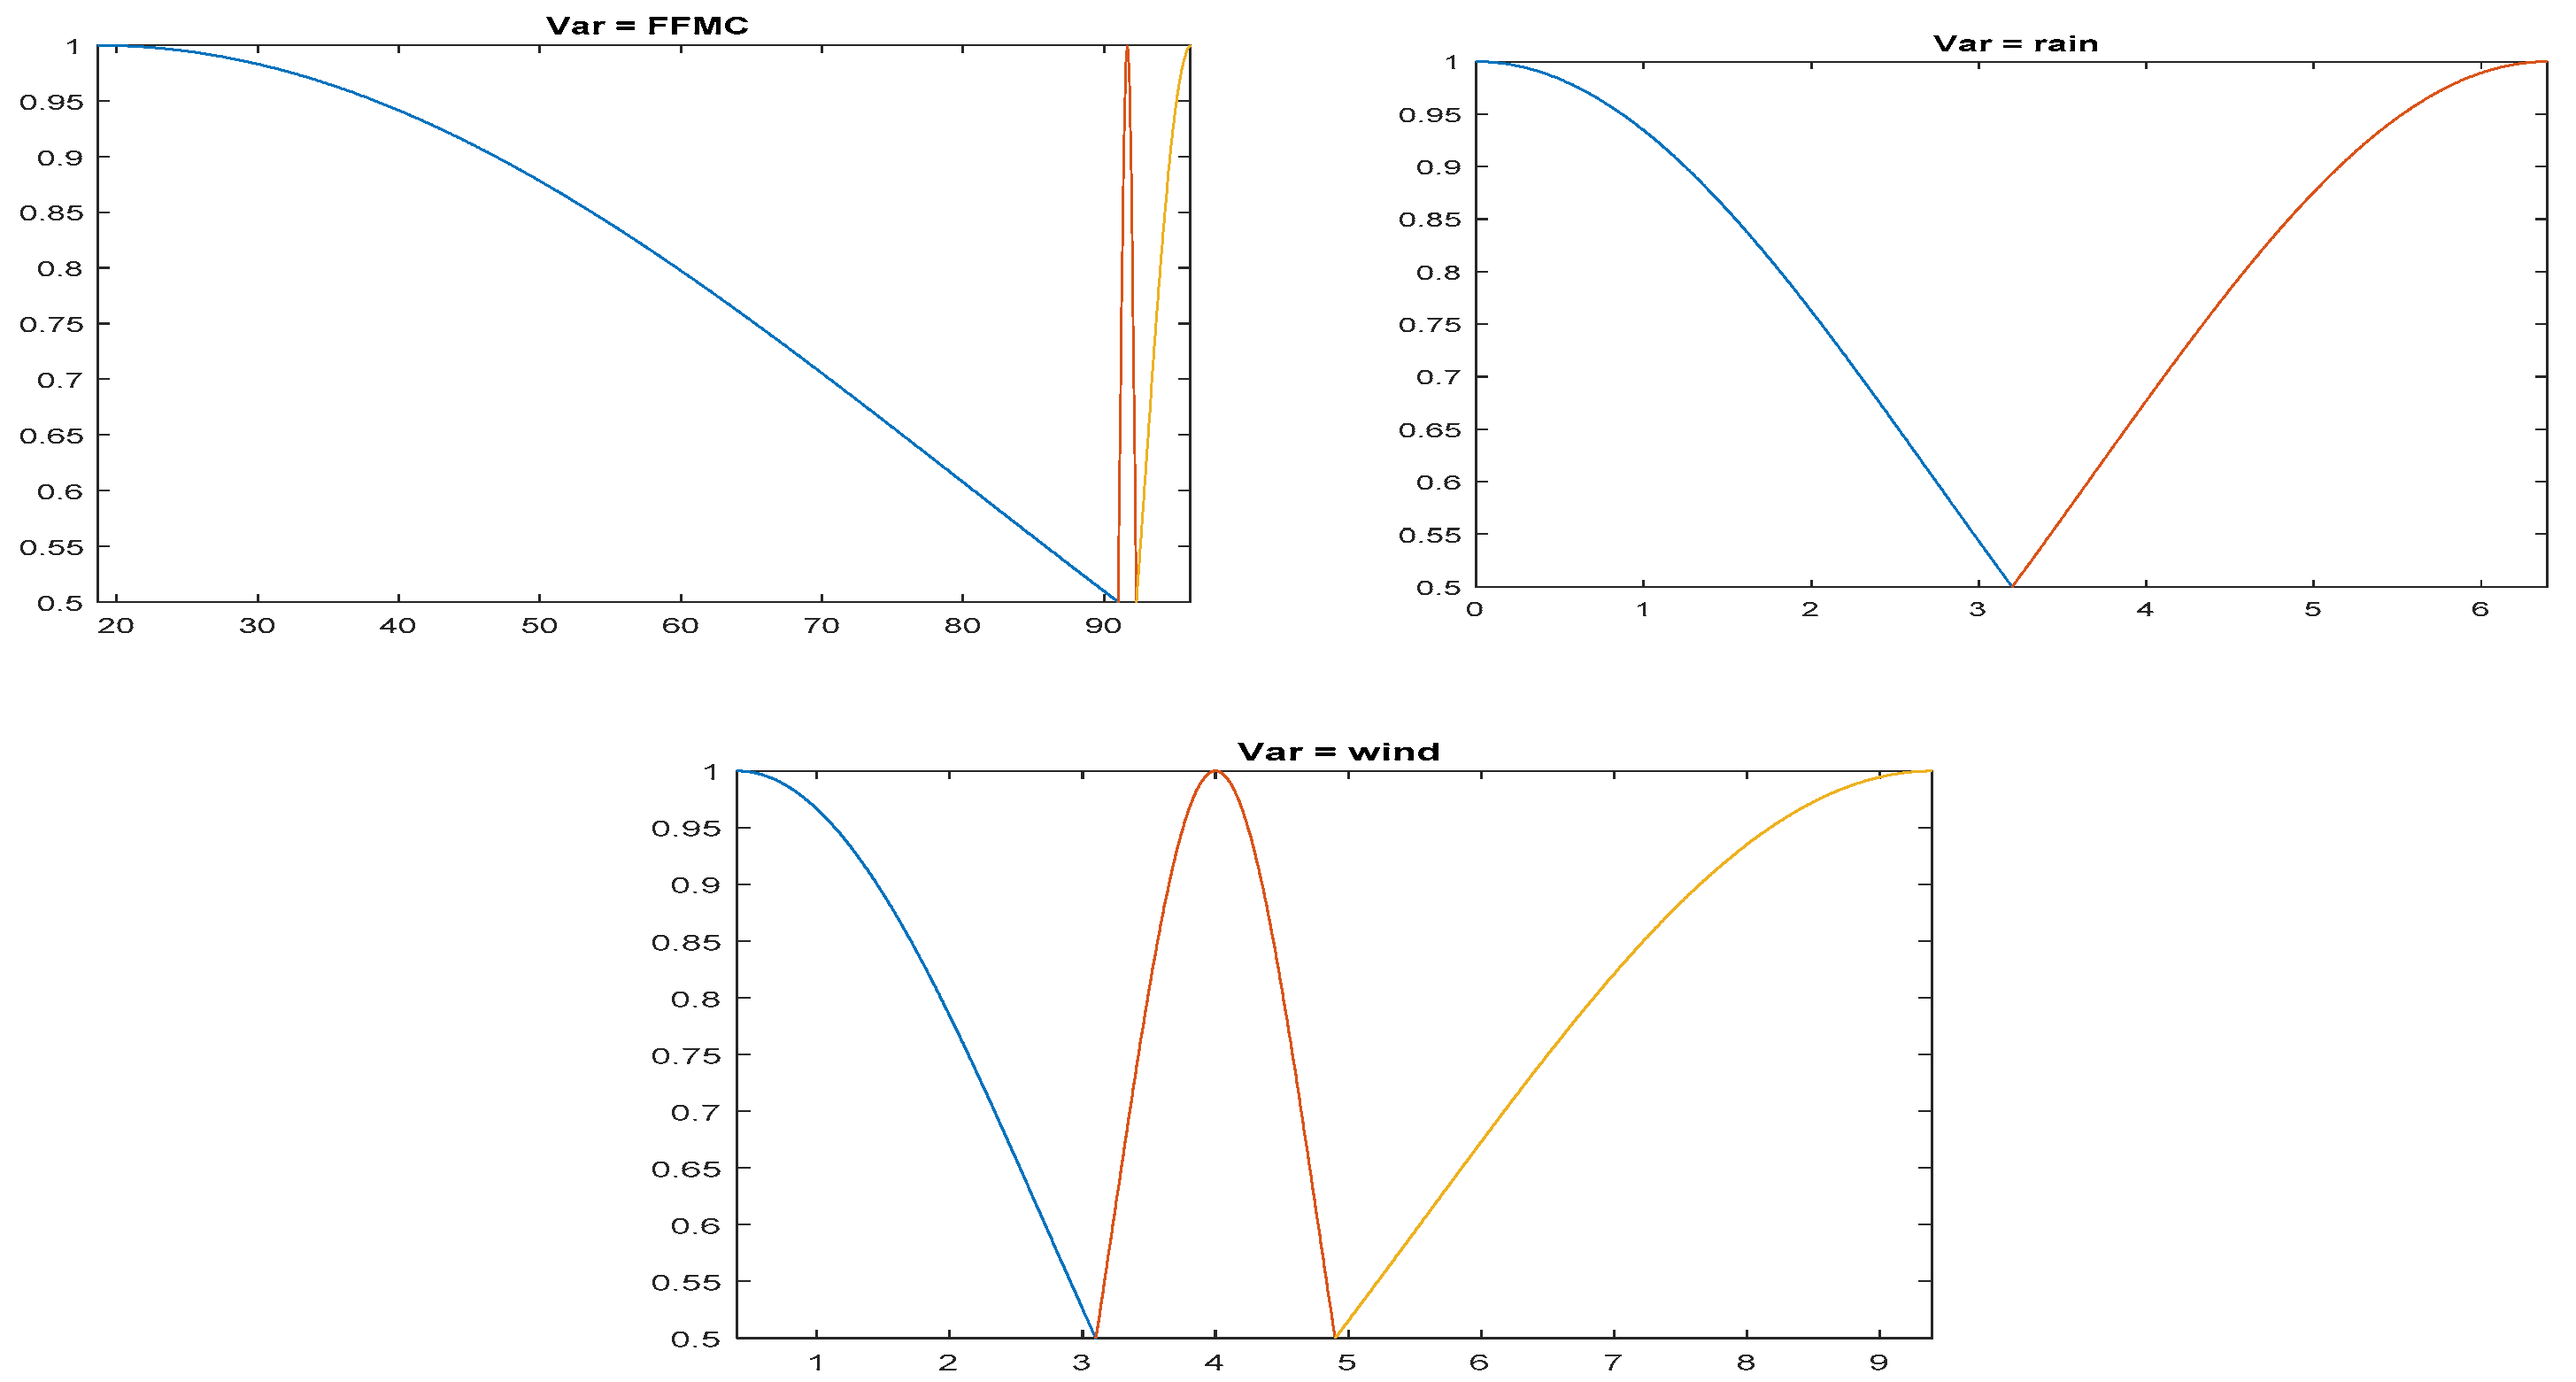
First of all, it is interesting to show the fuzzy sets of the input variables resulting from the modeling processes. These sets are represented by their membership functions, and Figure 2 shows the fuzzy sets that resulted from the FIR modeling. The membership function distribution of the five relevant input variables are presented.
Notice that the membership functions of the FFMC variable were those with a less uniform distribution, which was due to the characteristics of the available data. The FFMC variable had the vast majority of the data in the 90–100 range. FIR determined that a representation of fuzzy sets where the data was distributed in a similar proportion to each membership function is the one that provided the best predictive power. The fuzzy sets of the input variables resulting from the ANFIS models training process are shown in Figure 3.
The distribution of the membership functions that represent the fuzzy sets differed slightly from the ones selected by FIR because each methodology optimized membership functions holistically by taking into account both the modeling and inference processes. It should be remembered that the inference process of both methodologies were markedly different. While the FIR inference process was based on the k-nearest neighbors approach, the ANFIS fit the model using algorithms derived from neural networks and obtained the prediction as a result of applying a Sugeno-type inference system.
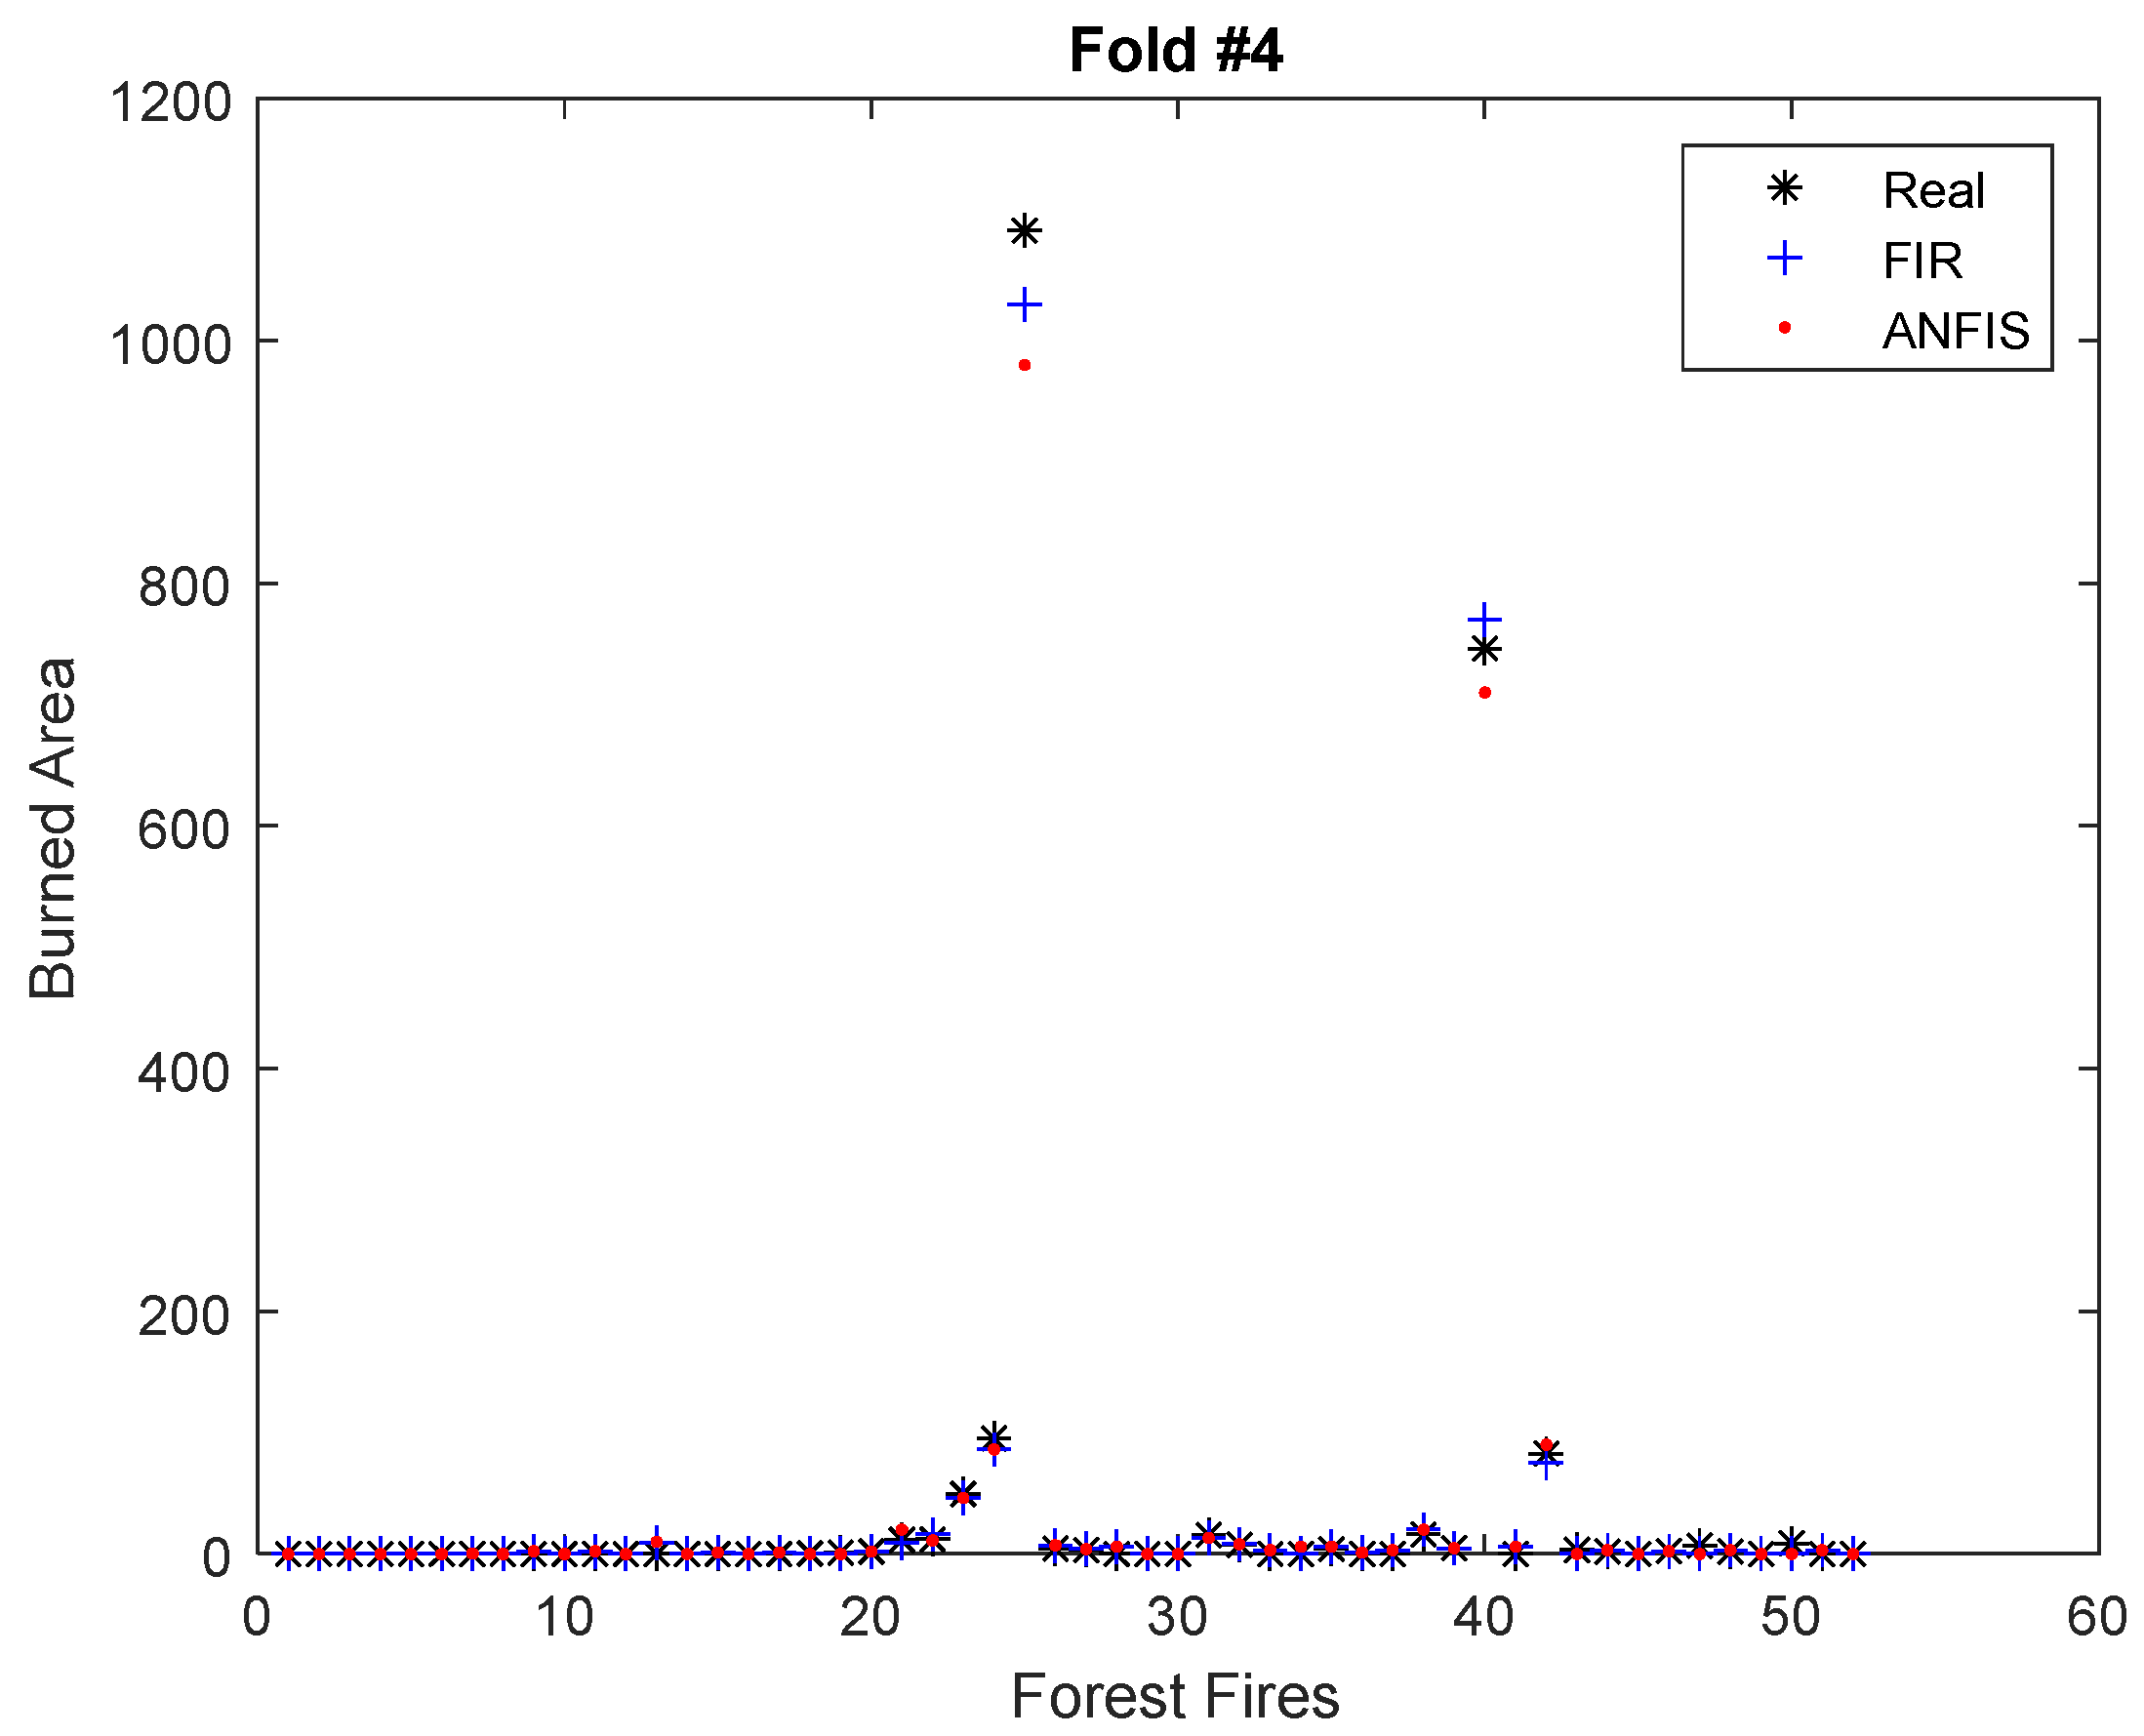
As explained before, a 10-fold cross-validation was performed and repeated 10 times for both FIR and the ANFIS. Figure 4 and Figure 5 show graphically the results of the FIR and ANFIS models for two folds of the dataset, #2 and #4. Figure 4 presents a fold that contained forest fires with high burned areas. The RMSE obtained by the FIR and ANFIS models in this fold was 69.17 and 110.10, respectively.
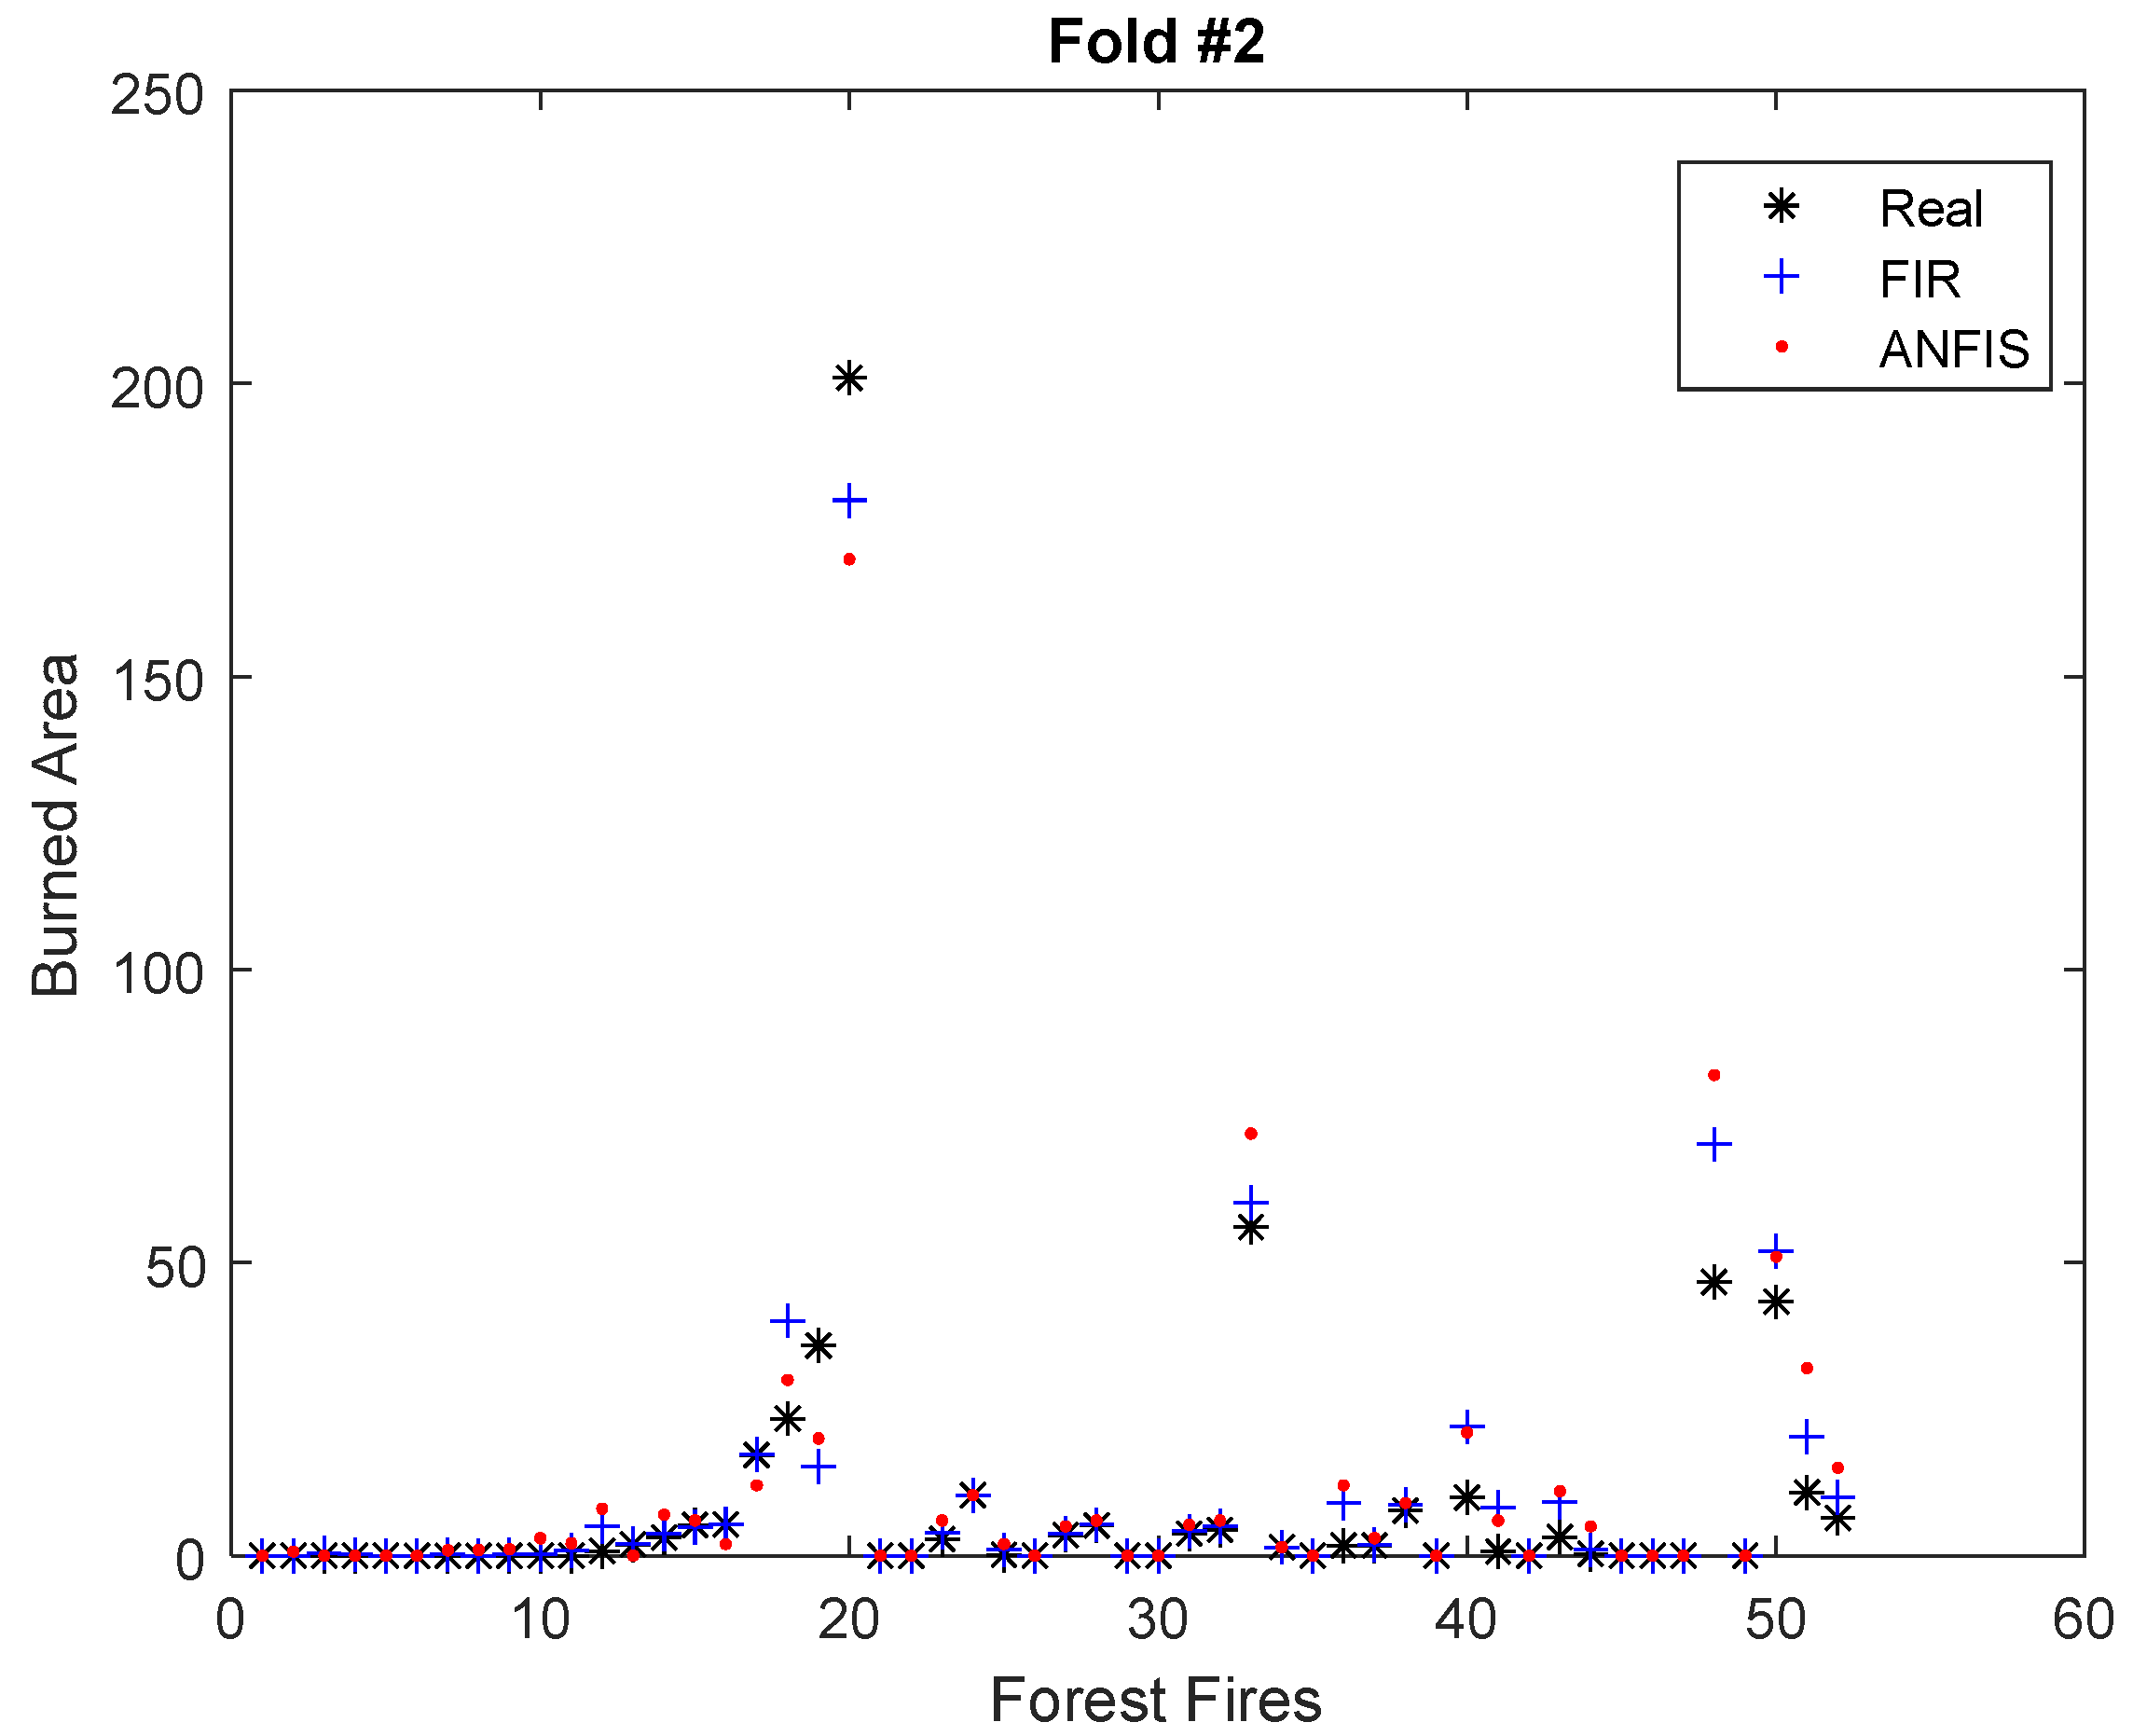
In Figure 5, fold #2 is presented, where forest fires were of a lower magnitude and therefore had a much lower burned area. The RMSE obtained by FIR and the ANFIS in this fold was 46.95 and 61.83, respectively.
It should be noted that both models were capable of predicting large and small areas considerably well. However, the FIR predictions were more accurate than those of the ANFIS models. The average RMSE of the 10 executions for each 10-fold cross-validation was 48.92 for FIR and 65.61 for the ANFIS. In the next section we discuss the accuracy of these results by comparing them with the results obtained by other methodologies that dealt with the same datasets.
4. Discussion
To evaluate the prediction quality of this type of models, it is essential to contrast the results with those of other artificial intelligence and machine-learning methodologies. For this purpose, this section showed the results for the same problem (and the same datasets) by other published research. The RMSE and MAE errors presented in Equations (5) and (6), respectively, are used for this comparison.
Table 2 presents these errors different models applied to the same datasets in the literature [3,17,25,26], as well as the errors obtained by FIR and the ANFIS (bottom of the table). These datasets have worked with various approaches within the area of AI as well as in statistical models. Here, we presented published results that could be directly compared with the ANFIS and FIR models developed in this research since the experimentation was carried out following the same criteria for data treatment, model construction and validation.
The first three columns of Table 2 show the methods, the specific parameters used to generate the model where this information appeared in the publication and the references. The last two columns show the MAE and RMSE errors, respectively. It should be noted that there are methods in different papers that use different modeling parameters, thus reporting different results.
For all the fuzzy and non-fuzzy models presented, the predicted output was post-processed using the inverse of the logarithmic transformation. If the transformation results were negative, they were unified to zero.
From analyzing the results shown in Table 2, it is clear that the lowest errors for both metrics were obtained with FIR models, i.e., MAE = 11.93 and RMSE = 48.9. This implied a higher prediction accuracy of the FIR models with respect to all the other models in the table.
It was not possible to conclude which method obtained the model with the highest error since in the results presented by Castelli et al. [25] the RMSE was not available, and it became difficult to understand the MAE results published by Al Janabi et al. [3], which were extremely high. Therefore, this analysis was not intended to rank the different methodologies but simply to show that fuzzy approximations can be a good alternative to the methods previously studied.
The ANFIS models obtained equivalent results to those achieved by the decision trees (DTs), multiple regression (MR) and support vector machines (SVMs) of Cortez et al. [18], and the transparent open-box (TOB) network of Wood [26]. In addition, the ANFIS obtained better results than all the methods presented by Castelli et al. [25]: SVM, RF, LR, ST–GP, IR and NN, except the geometric semantic genetic programming (GSGP) model, which achieved a very similar MAE to that of the ANFIS (12.9 GSGP vs. 13.02 ANFIS).
It should be noted that the reduction of the RMSE of the FIR models with respect to the others is relevant, which can be interpreted as meaning that FIR was better able to deal with outliers. Remember that the RMSE is more sensitive to outliers than the MAE.
FIR also had a MAE error value (11.93) lower than those of the other methods. The closest MAE was obtained by the SVM presented by Cortez et al. [17], which had a value of 12.71.
One aspect that we consider relevant to the improvement obtained by FIR is that it performed, as mentioned above, a feature selection process within its internal model identification structure. In the problem at hand, FIR determined that only five of the 12 input variables were relevant to predicting the burned area accurately. These five variables (temperature, RH, wind, rain and FFMC) were the only ones used by FIR (and the ANFIS) to infer the model with the highest predictive power.
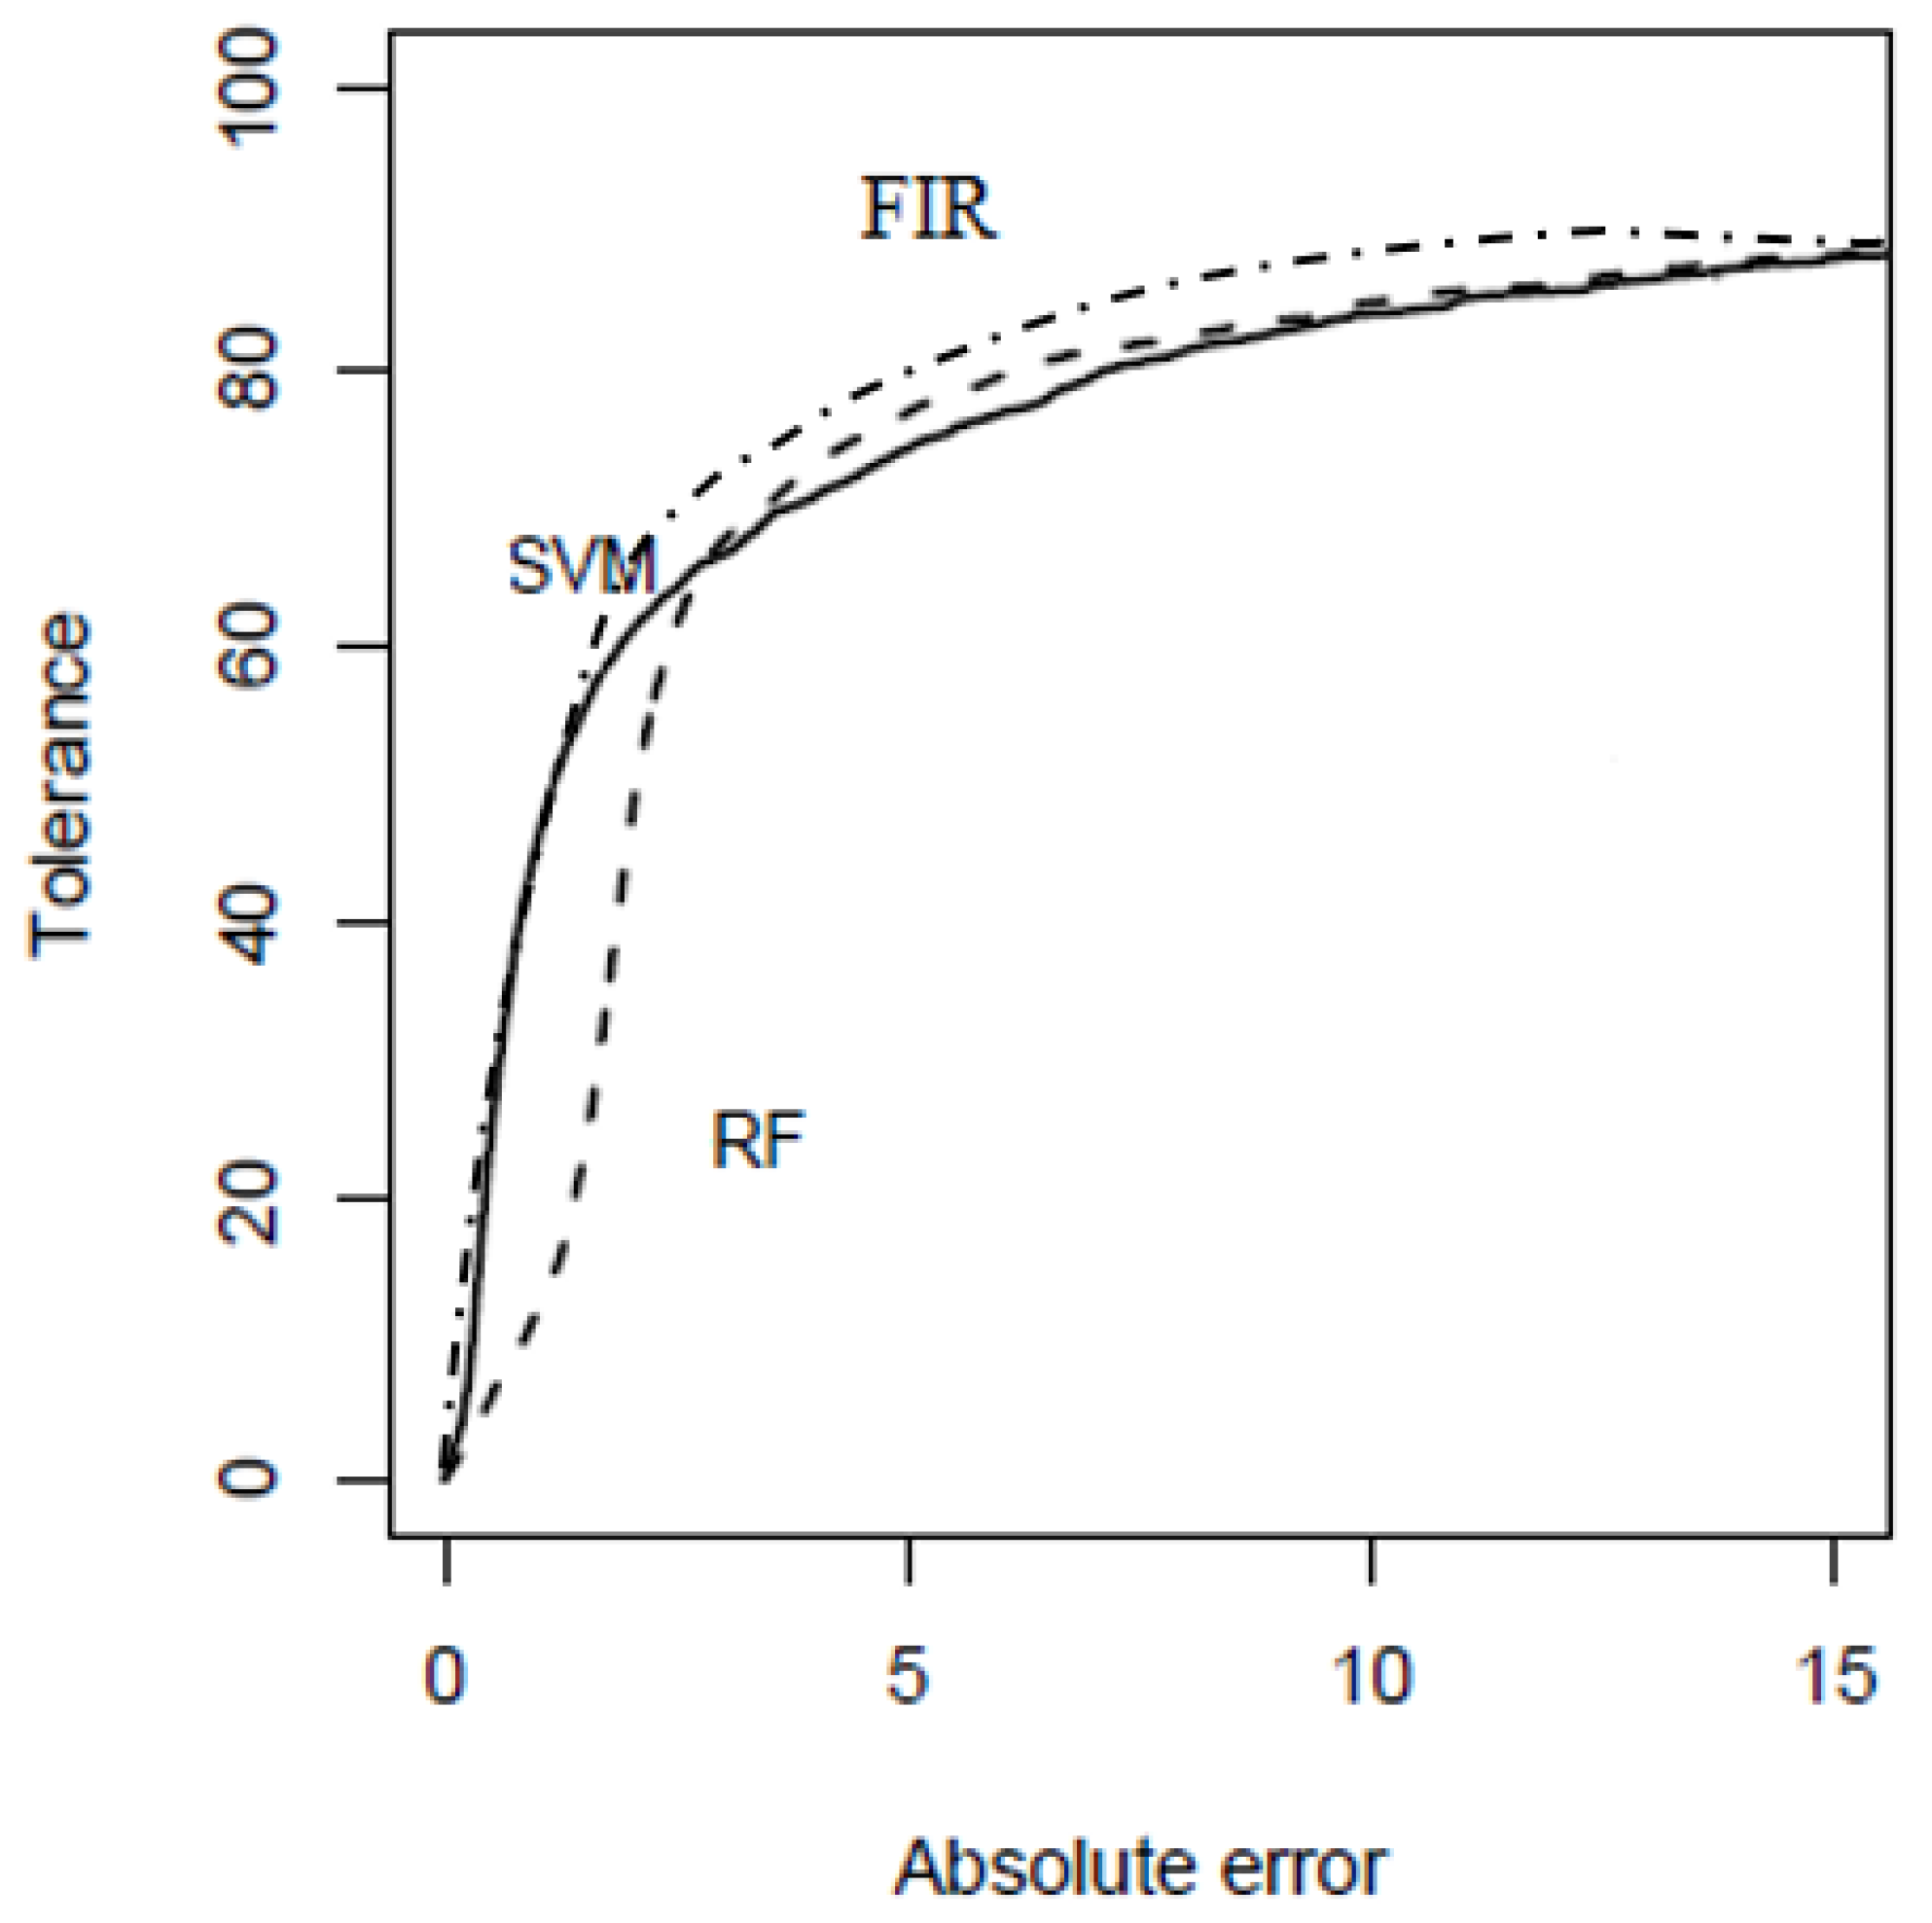
In fact, this result coincided with the conclusions of Cortez et al. [17], who said that the weather variables were the most relevant. Figure 6 presents the REC curves obtained by the RF and SVM of Cortez et al. [18] and FIR models, which are the methodologies that produced better MAE–RMSE relation accuracy.
Clearly, FIR was the best solution as it has the largest area under the curve. Both, SVM and FIR obtained the same results for low absolute errors, but differed on the number of points predicted correctly while increasing the error. The FIR models were able to obtain a slightly better percentage of correct predicted points compared to the SVM models.
5. Conclusions
The main objective of this work was to study the effectiveness of models based on fuzzy logic to predict areas burned by forest fire. There is clearly a vicious cycle connecting forest fires and climate change [2]; therefore, any effort to help manage forest fires better is of special relevance and will also be of great utility for slowing climate change. In this line, accurate predictions of burned areas offer useful knowledge for fire management decision’s regarding resource planning.
In this research, the forest fires data were registered from the Montesinho Natural Park (Portugal), available from the UCI machine-learning repository [18].
The fuzzy inductive reasoning (FIR) and the adaptive neuro-fuzzy inference system (ANFIS) hybrid fuzzy logic methodologies were presented and used to model the burned areas. We used a 10-fold cross-validation, in which model identification and validation was repeated 10 times. In total, 100 FIR and 100 ANFIS models were generated to analyze the generalization performance of these hybrid fuzzy models.
FIR was used, in a first step, as a feature selection process to determine which of the 12 input variables were more relevant for predicting the output. In this sense, FIR found that temperature, RH, wind, rain and FFMC were highly causal; therefore, the FIR and ANFIS models used only these five features to obtain their corresponding models. This conclusion coincided with that of Cortez et al. [17], who said that weather variables were the most relevant.
The prediction results obtained by the ANFIS and FIR were compared with those in the literature [3,17,25,26], that used the same data and followed the same criteria for data treatment, model construction and validation. These papers presented the results of a considerable number of methodologies: different kinds and structures of neural networks (CCN, MPNN, PNN, RBF), support vector machines (SVMs), decision trees (DTs), multiple regression (MR), random forest (RF), transparent open-box (TOB) network, geometric semantic genetic programming (GSGP), linear regression (LR), standard genetic programming decision tree (ST-GP) and isotonic regression (IR).
The results indicated that FIR models had the highest predictive power, with the lowest MAE and RMSE errors compared to all other models. The ANFIS models obtained equivalent results to those achieved by some configurations of DT, MR, SVMs and TOB. It can be concluded that RF and SVM are the methodologies that get better MAE–RMSE relation accuracy behind FIR.
We consider that the results open a path of study and analysis to develop and apply hybrid fuzzy methodologies to the field of forest fires and climate change.
Author Contributions
Conceptualization, À.N. and F.M.; methodology, À.N. and F.M.; software, À.N.; validation, À.N. and F.M.; investigation, À.N.; resources, À.N.; writing—original draft preparation, À.N.; writing—review and editing, À.N. and F.M. All authors have read and agreed to the published version of the manuscript. Please turn to the CRediT taxonomy for the term explanation. Authorship must be limited to those who have contributed substantially to the work reported.
Funding
This research received no external funding.
Data Availability Statement
The data used has been obtain form the UCI Machine Learning Repository, https://archive.ics.uci.edu/ml/datasets/Forest+Fires accessed on 28 July 2021.
Conflicts of Interest
The authors declare no conflict of interest.
References
- IPCC. Landmark United in Science Report Informs Climate Action Summit. World Meteorological Organization under the Auspices of the Science Advisory Group of the UN Climate Action Summit. 2019. Available online: https://www.ipcc.ch/2019/09/22/united-in-science-report-climate-summit/ (accessed on 28 July 2021).
- Landmark United in Science Report Informs Climate Action Summit. Available online: https://climateatlas.ca/forest-fires-and-climate-change (accessed on 12 March 2021).
- Al_Janabi, S.; Al_Shourbaji, I.; Salman, M.A. Assessing the suitability of soft computing approaches for forest fires prediction. Appl. Comput. Inform. 2018, 14, 214–224. [Google Scholar] [CrossRef]
- Gholamnia, K.; Gudiyangada Nachappa, T.; Ghorbanzadeh, O.; Blaschke, T. Comparisons of Diverse Machine Learning Approaches for Wildfire Susceptibility Mapping. Symmetry 2020, 12, 604. [Google Scholar] [CrossRef] [Green Version]
- Liang, H.; Zhang, M.; Wang, H. A neural network model for wildfire scale prediction using meteorological factors. IEEE Access 2019, 7, 176746–176755. [Google Scholar] [CrossRef]
- Jaafari, A.; Pourghasemi, H.R. Factors Influencing Regional-Scale Wildfire Probability in Iran: An Application of Random Forest and Support Vector Machine. Spat. Model. GIS R Earth Environ. Sci. 2019, 607–619. [Google Scholar] [CrossRef]
- García-Llamas, P.; Suárez-Seoane, S.; Taboada, A.; Fernández-Manso, A.; Quintano, C.; Fernández-García, V.; Fernández-Guisuraga, J.M.; Marcos, E.; Calvo, L. Environmental drivers of fire severity in extreme fire events that affect Mediterranean pine forest ecosystems. For. Ecol. Manag. 2019, 433, 24–32. [Google Scholar] [CrossRef]
- Moayedi, H.; Mehrabi, M.; Bui, H.R.; Pradhan, B.; Foong, L.K. Fuzzy-metaheuristic ensembles for spatial assessment of forest fire susceptibility. J. Environ. Manag. 2020, 260, 109867. [Google Scholar] [CrossRef] [PubMed]
- Naderpour, M.; Rizeei, H.M.; Ramezani, F. Wildfire Prediction: Handling Uncertainties Using Integrated Bayesian Networks and Fuzzy Logic. In Proceedings of the IEEE International Conference on Fuzzy Systems (FUZZ-IEEE), Glasgow, UK, 19–24 July 2020; pp. 1–7. [Google Scholar]
- Xie, Y.; Peng, M. Forest fire forecasting using ensemble learning approaches. Neural Comput. Appl. 2019, 31, 4541–4550. [Google Scholar] [CrossRef]
- Tuyen, T.T.; Jaafari, A.; Yen, H.P.H.; Nguyen-Thoi, T.; Phong, T.V.; Nguyen, H.D.; Van Le, H.; Phuong, T.T.M.; Nguyen, S.H.; Prakash, I.; et al. Mapping forest fire susceptibility using spatially explicit ensemble models based on the locally weighted learning algorithm. Ecol. Inform. 2021, 63, 101292. [Google Scholar] [CrossRef]
- Valero, M.M.; Jofre, L.; Torres, R. Multifidelity prediction in wildfire spread simulation: Modeling, uncertainty quantification and sensitivity analysis. Environ. Model. Softw. 2021, 141, 105050. [Google Scholar] [CrossRef]
- Nebot, A.; Mugica, F. Energy Performance Forecasting of Residential Buildings Using Fuzzy Approaches. Appl. Sci. 2020, 10, 720. [Google Scholar] [CrossRef] [Green Version]
- Jurado, S.; Nebot, A.; Mugica, F.; Avellana, N. Hybrid methodologies for electricity load forecasting: Entropy-based feature selection with machine learning and soft computing techniques. Energy 2015, 86, 276–291. [Google Scholar] [CrossRef] [Green Version]
- Navid, K.; Bardhan, A.; Kim, D.; Samui, P.; Zhou, A. Modelling the energy performance of residential buildings using advanced computational frameworks based on RVM, GMDH, ANFIS-BBO and ANFIS-IPSO. J. Build. Eng. 2021, 35, 102105. [Google Scholar]
- Yadollahpour, A.; Nourozi, J.; Mirbagheri, S.A.; Simancas-Acevedo, E.; Trejo-Macotela, F.R. Designing and Implementing an ANFIS Based Medical Decision Support System to Predict Chronic Kidney Disease Progression. Front. Physiol. 2018, 9, 1753. [Google Scholar] [CrossRef] [PubMed]
- Cortez, P.; Morais, A.J.R. A Data Mining Approach to Predict Forest Fires using Meteorological Data. In New Trends in Artificial Intelligence. In Proceedings of the 13th EPIA 20—Portuguese Conference on Artificial Intelligence, Guimarães, Portugal, 3–7 December 2007; pp. 512–523. [Google Scholar]
- UCI Machine Learning Repository. Available online: https://archive.ics.uci.edu/ml/datasets/Forest+Fires (accessed on 12 March 2021).
- Klir, G.; Elias, D. Architecture of Systems Problem Solving, 2nd ed.; Plenum Press: New York, NY, USA, 2002. [Google Scholar]
- Nebot, A.; Mugica, F. Fuzzy Inductive Reasoning: A consolidated approach to data-driven construction of complex dynamical systems. Int. J. Gen. Syst. 2012, 41, 645–665. [Google Scholar] [CrossRef]
- Escobet, A.; Nebot, A.; Cellier, F.E. Visual-FIR: A tool for model identification and prediction of dynamical complex systems. Simul. Model. Pract. Theory 2008, 16, 76–92. [Google Scholar] [CrossRef]
- Jang, J.-S.R. ANFIS: Adaptive-network-based fuzzy inference system. IEEE Trans. Syst. Man Cybern. 1993, 23, 665–685. [Google Scholar] [CrossRef]
- Nauck, D.; Klawonn, F.; Kruse, R. Neuro-Fuzzy Systems; John Wiley & Sons: Chichester, UK, 1997. [Google Scholar]
- Taylor, S.W.; Alexander, M.E. Science, technology, and human factors in fire danger rating: The Canadian experience. Int. J. Wildland Fire 2006, 15, 121–135. [Google Scholar] [CrossRef]
- Castelli, M.; Vanneschi, L.; Popovič, A. Predicting burned areas of forest fires: An artificial intelligence approach. Fire Ecol. 2015, 11, 106–118. [Google Scholar] [CrossRef]
- Wood, D.A. Prediction and data mining of burned areas of forest fires: Optimized data matching and mining algorithm provides valuable insight. Artif. Intell. Agric. 2021, 5, 24–42. [Google Scholar]
Figure 1.
Sugeno inference system example.

Figure 2.
Fuzzy sets of the five relevant input variables: RH, temperature, FFCM, rain and wind for the FIR models. Only the range 0.5–1 is plotted to show membership functions more clearly.
Figure 2.
Fuzzy sets of the five relevant input variables: RH, temperature, FFCM, rain and wind for the FIR models. Only the range 0.5–1 is plotted to show membership functions more clearly.


Figure 3.
Fuzzy sets of the five relevant input variables: RH, temperature, FFCM, rain and wind for the ANFIS models. Only the range 0.5–1 is plotted to show membership functions more clearly.
Figure 3.
Fuzzy sets of the five relevant input variables: RH, temperature, FFCM, rain and wind for the ANFIS models. Only the range 0.5–1 is plotted to show membership functions more clearly.

Figure 4.
Real versus ANFIS and FIR prediction results for burned-area models. Each point in the plot represents a forest fire. The results correspond to fold #4 in one of the 10 iterations. RMSE obtained by FIR and ANFIS models in this fold are 69.17 and 110.10, respectively.
Figure 4.
Real versus ANFIS and FIR prediction results for burned-area models. Each point in the plot represents a forest fire. The results correspond to fold #4 in one of the 10 iterations. RMSE obtained by FIR and ANFIS models in this fold are 69.17 and 110.10, respectively.

Figure 5.
Real versus ANFIS and FIR prediction results for burned area models. Each point in the plot represents a forest fire. The results correspond to fold #2 in one of the 10 iterations. RMSE obtained by the FIR and ANFIS models in this fold was 46.95 and 61.83, respectively.
Figure 5.
Real versus ANFIS and FIR prediction results for burned area models. Each point in the plot represents a forest fire. The results correspond to fold #2 in one of the 10 iterations. RMSE obtained by the FIR and ANFIS models in this fold was 46.95 and 61.83, respectively.


Table 1.
Data features, description and measures.
| Attribute | Description (Measure) |
|---|---|
| Spatial Attributes | |
| X | x-axis coordinate (from 1 to 9) |
| Y | y-axis coordinate (from 1 to 9) |
| Temporal Attributes | |
| month | Month of the year (January to December) |
| day | Day of the week (Monday to Sunday) |
| Fire Weather Index (FWI) Attributes | |
| FFMC | FFMC code (Real numbers) |
| DMC | DMC code (Real numbers) |
| DC | DC code (Real numbers) |
| ISI | ISI index (Real numbers) |
| Weather Attributes | |
| temp | Outside temperature (in °C) |
| RH (relative humidity) | Outside relative humidity (in %) |
| wind | Outside wind speed (in km/h) |
| rain | Outside rain (in mm/m2) |
| area | Total burned area (in ha) |
Table 2.
Mean absolute and root mean square prediction errors obtained by different models found in the literature [3,17,25,26], as well as by the ANFIS and FIR models. The results are given in the form of mean ± t-student 95% confidence intervals in cases where this information was available. DT stands for decision trees, MR for multiple regression, NN for neural network, SVM for support vector machine, RF for random forest, GS-GP for geometric semantic genetic programming, LR for linear regression, ST-GP for standard genetic programming decision tree, IR for isotonic regression, CCN for cascade correlation network, MPNN for multi-layer perceptron neural network, PNN for polynomial neural network, RBF for radial base function neural network and TOB for transparent open-box network.
| Method | Parameters | Reference | MAE | RMSE |
|---|---|---|---|---|
| DT | Reduction of the sum of squares | Cortez et al. [17] | 13.18 ± 0.05 | 64.5 ± 0.0 |
| MR | Least squares alg. | Cortez et al. [17] | 13.01 ± 0.00 | 64.5 ± 0.0 |
| NN | MLP 1HL; logistic/linear; 100 epochs; 3 times; BFGS alg.; Hidden Lay. = 4 neurons | Cortez et al. [17] | 13.71 ± 0.69 | 66.9 ± 3.4 |
| SVM | Sequential Minimal Optimization alg.; RBF kernel; C = 3; Gamma = 2−5 | Cortez et al. [17] | 12.71 ± 0.01 | 64.7 ± 0.0 |
| RF | T = 500 | Cortez et al. [17] | 12.93 ± 0.01 | 64.4 ± 0.0 |
| GS-GP | Crossover = 0.7; Mutation Rate = 0.3; Mutation Step = 0.1; Elitism | Castelli et al. [25] | 12.9 | - |
| SVM | Polynomial kernel (second degree) | Castelli et al. [25] | 13.6 | - |
| RF | Not specified | Castelli et al. [25] | 19.3 | - |
| LR | Not specified | Castelli et al. [25] | 19.6 | - |
| ST-GP | Not specified | Castelli et al. [25] | 21.0 | - |
| IR | Not specified | Castelli et al. [25] | 21.5 | - |
| NN | Feed forward; Backpropagation | Castelli et al. [25] | 33.8 | - |
| CCN | Num. Layers = 3; Sigmoid/Gaussian; Hidden Lay. = 2 neurons | Al-Janabi et al. [3] | 551.4 | 62.6 |
| MPNN | Num. Layers = 3; logistic/linear; Hidden Lay. = 1 neuron | Al-Janabi et al. [3] | 617.4 | 63.1 |
| PNN | Gaussian kernel; p1 = 31.30; p2 = −27.30; p3 = 1.13; p4 = 6.30 | Al-Janabi et al. [3] | 516.5 | 63.2 |
| RBF | Num. Neur. = 100; Min. Rad. = 0.01; Max. Rad. = 519.669; Min. Lambda = 0.01328; Max. Lambda = 9.95337 | Al-Janabi et al. [3] | 911.2 | 54.2 |
| SVM | RBF kernel; C = 84.18; Epsilon = 0.001; Gamma = 3800.2 | Al-Janabi et al. [3] | 282.4 | 54.0 |
| TOB | Two stages; Wn = 0.5; Q = 10; Evol 2–6; Optimum | Wood [26] | 13.08 | 63.26 |
| ANFIS | Hybrid alg.; constant func.; 50 epochs | Our research | 13.02 ± 0.04 | 64.6 ± 0.0 |
| FIR | EWP-EFP; 2–3 FS per var. | Our research | 11.93 ± 0.01 | 48.9 ± 0.0 |
Publisher’s Note: MDPI stays neutral with regard to jurisdictional claims in published maps and institutional affiliations. |
© 2021 by the authors. Licensee MDPI, Basel, Switzerland. This article is an open access article distributed under the terms and conditions of the Creative Commons Attribution (CC BY) license (https://creativecommons.org/licenses/by/4.0/).
Share and Cite
MDPI and ACS Style
Nebot, À.; Mugica, F. Forest Fire Forecasting Using Fuzzy Logic Models. Forests 2021, 12, 1005. https://0-doi-org.brum.beds.ac.uk/10.3390/f12081005
AMA Style
Nebot À, Mugica F. Forest Fire Forecasting Using Fuzzy Logic Models. Forests. 2021; 12(8):1005. https://0-doi-org.brum.beds.ac.uk/10.3390/f12081005
Chicago/Turabian StyleNebot, Àngela, and Francisco Mugica. 2021. "Forest Fire Forecasting Using Fuzzy Logic Models" Forests 12, no. 8: 1005. https://0-doi-org.brum.beds.ac.uk/10.3390/f12081005
Note that from the first issue of 2016, this journal uses article numbers instead of page numbers. See further details here.