Article

Ecosystem Productivity and Evapotranspiration Are Tightly Coupled in Loblolly Pine (Pinus taeda L.) Plantations along the Coastal Plain of the Southeastern U.S.

1
Department of Forestry and Environmental Resources, North Carolina State University, Raleigh, NC 27695, USA
2
Eastern Forest Environmental Threat Assessment Center, Southern Research Station, USDA Forest Service, Research Triangle Park, NC 27709, USA
3
Department of Ecosystem Science and Management, Texas A&M University, College Station, TX 77843, USA
4
Bordeaux Sciences Agro, UMR 1391 INRA ISPA, CEDEX, 33175 Gradignan, France
5
Institute of Environment and Department of Biological Sciences, Florida International University, 11200 SW 8th Street, Miami, FL 33199, USA
6
School of Informatics, Computing and Cyber Systems, Northern Arizona University, Flagstaff, AZ 86011, USA
*
Author to whom correspondence should be addressed.
Submission received: 21 July 2021 / Revised: 13 August 2021 / Accepted: 16 August 2021 / Published: 22 August 2021

Abstract

:
Forest water use efficiency (WUE), the ratio of gross primary productivity (GPP) to evapotranspiration (ET), is an important variable to understand the coupling between water and carbon cycles, and to assess resource use, ecosystem resilience, and commodity production. Here, we determined WUE for managed loblolly pine plantations over the course of a rotation on the coastal plain of North Carolina in the eastern U.S. We found that the forest annual GPP, ET, and WUE increased until age ten, which stabilized thereafter. WUE varied annually (2–44%), being higher at young plantation (YP, 3.12 ± 1.20 g C kg−1 H2O d−1) compared to a mature plantation (MP, 2.92 ± 0.45 g C kg−1 H2O d−1), with no distinct seasonal patterns. Stand age was strongly correlated with ET (R2 = 0.71) and GPP (R2 = 0.64). ET and GPP were tightly coupled (R2 = 0.86). Radiation and air temperature significantly affected GPP and ET (R2 = 0.71 − R2 = 0.82) at a monthly scale, but not WUE. Drought affected WUE (R2 = 0.35) more than ET (R2 = 0.25) or GPP (R2 = 0.07). A drought enhanced GPP in MP (19%) and YP (11%), but reduced ET 7% and 19% in MP and YP, respectively, resulting in a higher WUE (27–32%). Minor seasonal and interannual variation in forest WUE of MP (age > 10) suggested that forest functioning became stable as stands matured. We conclude that carbon and water cycles in loblolly pine plantations are tightly coupled, with different characteristics in different ages and hydrologic regimes. A stable WUE suggests that the pine ecosystem productivity can be readily predicted from ET and vice versa. The tradeoffs between water and carbon cycling should be recognized in forest management to achieve multiple ecosystem services (i.e., water supply and carbon sequestration).

1. Introduction

Ecosystem water use efficiency (WUE) is expressed as the fraction of carbon gained through gross primary productivity (GPP) to water lost through evapotranspiration (ET) at the ecosystem level [1,2]. The balance between photosynthesis and ET depends on the leaf functioning regulated by stomatal opening [3]. Under limiting resource conditions (e.g., low light intensity, drought), this balance depends on the trade-off between maintaining a high amount of CO2 absorption (benefit) and a low transpiration rate (cost) at the ecosystem scale. Whether or not forested wetlands can regulate WUE over the long run in a drier environment is a question that ecosystem modelers must consider. Studying WUE is important to determine the carbon–water coupling amidst climate change and extreme weather events [4,5]. However, multiple-year information about the response of forested wetland ecosystems to global warming and drought is scarce.
Ecosystem WUE (expressed as GPP/ET) [5,6,7,8] is determined in many eddy covariance flux studies. Other studies used intrinsic WUE which take into account the GPP and surface conductance [9,10] or inherent WUE, which considers the vapor pressure deficit in the ratio between GPP and ET [1,11,12]. Other studies even calculated WUE as the fraction of GPP and ET obtained from the Breathing Earth System Simulator (BESS) model [13,14,15,16].
Many authors have reported that radiation, temperature, and soil water induce variation in inter-annual [17] or seasonal ET [18,19] and GPP rates [20,21,22]. However, evaluating what influences WUE is rather complicated since the variation in WUE results from changes in evapotranspiration and ecosystem productivity, which sometimes are decoupled. WUE was reported to be associated with light availability [6], soil water [23], and temperature [24]. However, long-term observations of radiation and temperature do not necessarily change over time. Thus, the patterns and trends in soil water dynamics closely associated with groundwater level depth at a seasonal scale may become one of the critical factors in WUE.
Climate change predictions indicate a frequent occurrence of dry spells along the US southern coastal plains [25]. Evaluating the relationship between the climate and WUE in forested wetlands may offer new knowledge relative to ecosystem responses to climate variability and expected future extreme conditions. Besides maximizing economic returns in managed forests, the role of forest management in maintaining forest carbon stocks and the maximization of water use efficiency must be emphasized in forest planning because these actions will help mitigate climate change [26]. Age-related trends may also be a primary source of spatial variability in carbon and water fluxes [27,28,29,30] across the landscape and, thus, WUE.
Researchers often find it difficult to obtain long-term ecological observations. Therefore, some studies use sites of different age but sharing similar attributes (chronosequence) to examine how an ecosystem behaves after a disturbance [31,32]. It is important that a chronosequence follows the same growth trajectory, similar species composition, and low frequency/severity of major disturbances [33].
Recognizing its limitations, the eddy covariance flux methodology has advantages for estimating GPP [31] and ET [34,35,36] at the ecosystem level, such as a large footprint and continuous monitoring of C and water fluxes, that integrate environmental and ecophysiological variation over relevant scales. With the aim of better understanding the WUE (GPP/ET) of converted forested wetlands in North Carolina, we compared the eddy covariance flux estimates of two adjacent loblolly pine plantations. One is a young pine plantation (2–8 years old) and the other a mature pine plantation (15–28 years old), which comprised a chronosequence in the current study. These flux stations are registered under the AmeriFlux/FLUXNET network [37,38,39,40,41,42,43,44]. In this study, we aimed to (1) determine the inter-annual and seasonal trends in GPP, ET, and WUE and (2) evaluate the impact of age and climate, to include the 2007/2008 drought, on WUE and its components. We hypothesized that (1) a mature pine plantation will have a higher GPP and ET than young pine; (2) there is a strong dependence of WUE on age; (3) there would be an enhancement in WUE with drought events; (4) strong coupling of ET and GPP would exist even with drought. Our results may integrate WUE controls in simulating functional adjustments of forested wetland ecosystems to future fast growing commercial plantations in response to changing environmental conditions.

2. Methods

2.1. Study Site

The pine plantation sites are located along the coastal plain in Washington County, North Carolina, USA, at 35°48′ N 76°40′ W. The sites are registered as US-NC2 and US-NC1 under the FLUXNET database, and from hereon will be called, respectively, young plantation (YP, 2–8 years old) with measurement period from 2005 to 2011 and mature plantation (MP, 15–28 years old) measured from 2005 to 2018 (Figure 1). Weyerhaeuser NR Company managed these two adjacent loblolly pine (Pinus taeda L.) plantations. The MP site is now under its fifth rotation (rotation cycle is ~30 years). The flux tower at MP was built in 2005. During that time, the plantation was 15 years old. A thinning operation was conducted in August 2009 at MP. YP flux tower was established near the MP tower also in 2005 after a clear-cut operation. Measurement at YP ended in 2012.
A network of 90–130 cm deep ditches with 90 m spacing and road side canals drained the plantations [45]. The sites sit <5 m above sea level elevation. The groundwater depth reaches 0.5–1.0 m during the non-growing season. The mean annual rainfall was 1366 ± 57 mm (1971–2018), and the mean annual temperature was 16.4 ± 0.4 °C (2005–2018). The study sites experienced two dry spells during the duration of the study (2007 and 2008). During these drought years, the annual rainfall fell 60% and 45% lower than the long-term average, respectively. More information of our study sites are described in previous studies [45,46,47,48,49,50].

2.2. Climate and Eddy Covariance Flux Monitoring

We used an eddy covariance flux tower to measure CO2 and H2O flux, latent heat (LE), and sensible (H) fluxes at 11.6 m and 28.7 m above the flux towers at YP and MP, respectively. In both flux towers, ecosystem exchange of CO2 and H2O was measured using an open-path gas analyzer (LI-7500, LI-COR, Lincoln, NE, USA) and a sonic anemometer (CSAT-3, Campbell Scientific. Loga, UT, USA). Meteorological sensors such as HMP-45C (Vaisala, Helsinki, Finland) measured relative humidity and air temperature. CNR-1 and CNR-4 (Kipp & Zonen, Delft, The Netherlands) were used to measure net radiation while an ultrasonic water level datalogger (Infinities, Port Orange, FL, USA) measured groundwater table depth. CR1000 dataloggers were used to record and store these meteorological data.

2.3. Data Quality Control, Gap filling, and WUE Computation

The 30 min mean fluxes of CO2 and H2O were calculated as the covariance of vertical wind speed and the concentration of CO2 and H2O, consistent with previous data processing procedures [42,46,48,49]. Standard quality checks and corrections were applied for spike detection [51], planar fit coordinate rotation of wind vectors [52], correction of the time lags between scalar concentrations and wind speed (covariance maximization), air density fluctuation [53], and high [54] and low pass filtering [55]. Flux gap-filling of missing data and partitioning of NEE30min into gross primary productivity (GPP) and ecosystem respiration (RE) was conducted following the protocol provided by the Max Planck Institute for Biogeochemistry (https://www.bgc-jena.mpg.de/bgi/index.php/Services/REddyProcWeb, accessed on 20 February 2019). Data gaps for latent heat (LE) were filled using the relationship between observed ET and grass reference evapotranspiration estimated by the FAO Penman–Monteith method. The total 30 min ET was converted from LE (W m−2) using the formula: ET = LE × (0.01800/44000) × 3600 × 0.5 [43].
Daily GPP (g C m−2 d−1) was computed as the difference between daily RE (g C m−2 d−1) and NEE (g C m−2 d−1). Daily ET (kg H2O m−2 d−1) was the sum of 30 min ET over 24 h. These data were extracted from [37,46] and monthly averages were computed. Ecosystem WUE (g C kg H2O−1) was calculated as the ratio of GPP to ET according to [56,57]. No further filtering on WUE was done.

2.4. Determining Drought Years

Drought years were determined based on the soil water stress index (SWSI) [58]. SWSI is an ecological drought indicator and was calculated in previous papers [37,46]. Drought year occurred when SWSI median values fell below SWSI = 0. Analysis revealed that years 2007 and 2008 in both YP and MP sites had highly negative annual SWSI. We used all year’s growing season (April–September) data in determining drought impacts.

2.5. Chronosequence Sites

To form the chronosequence, we set the GPP, ET, and WUE series across the measurement period in YP to become the initial few years of the chronosequence (i.e., 2–8 years old); then, those variables from the MP site were added in the chronosequence according to their ages in ascending manner (i.e., 15–28 years old). Thus, there was a gap between ages 9 and 14 years in the sequence, which we did not fill.

2.6. Data Analyses

Regression curves and linear relationships were performed using the ggplot2 package. Climatic clustering was analyzed using the K-means cluster package. These clusters were herein referred to as low, medium, and high for net radiation and air temperature and shallow, medium, and deep for groundwater table depth. We used R version 4.0.2 in all analyses (R Core Team, 2020).

3. Results

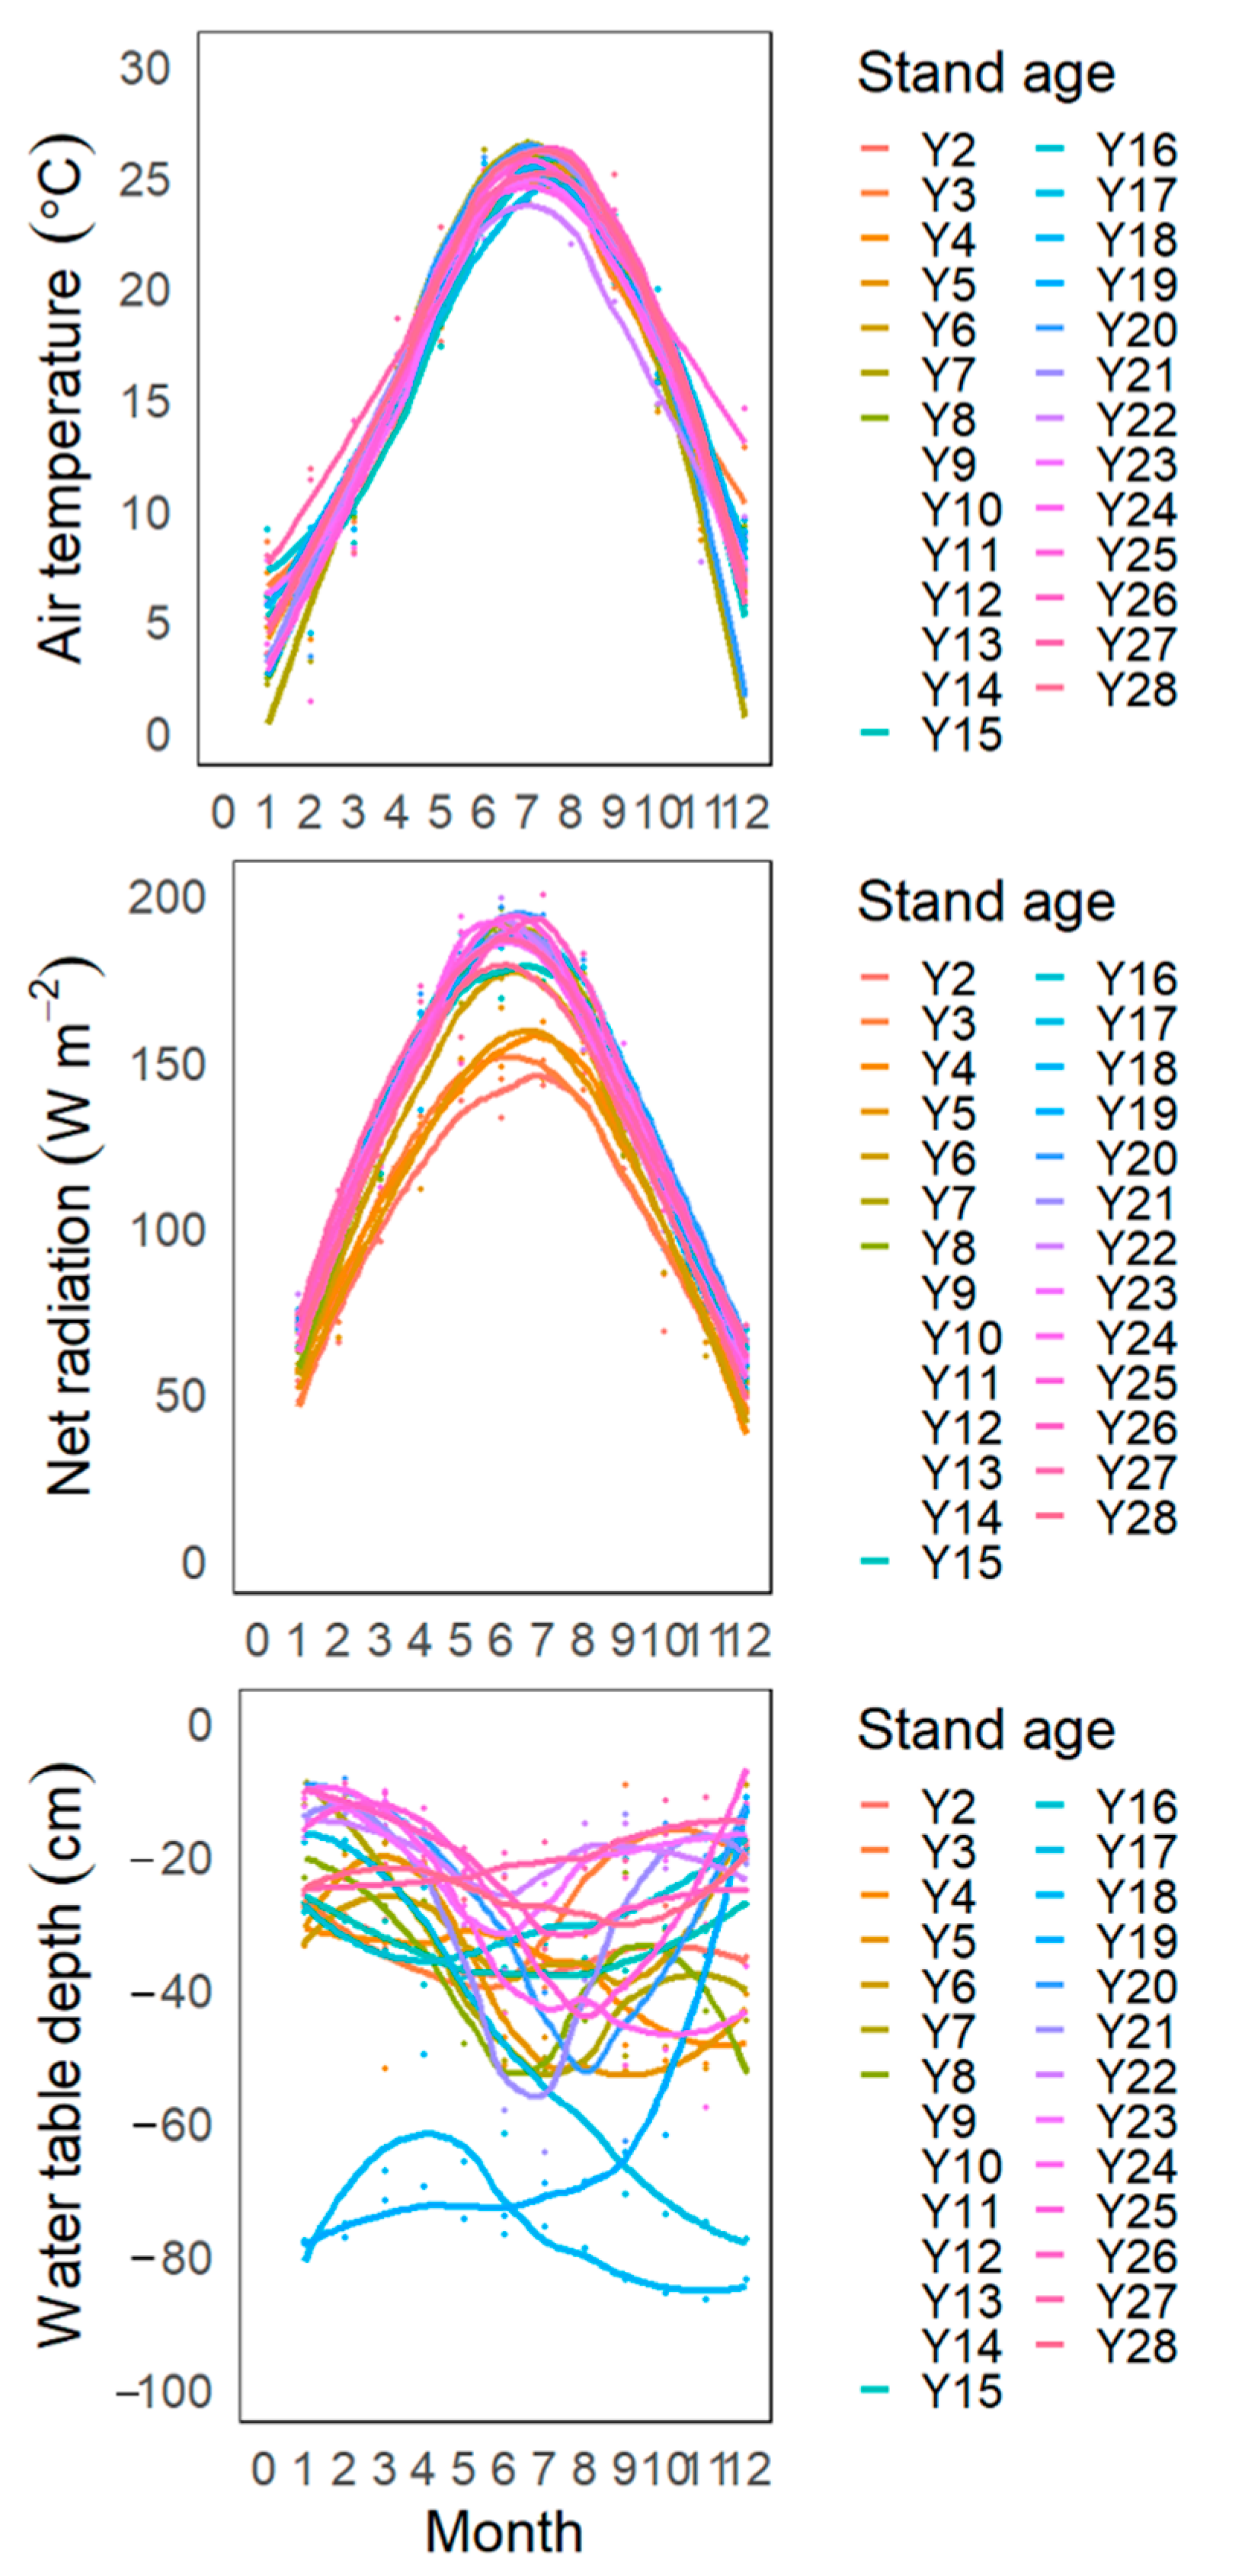
3.1. Inter-Annual and Seasonal Variations in Climate

Only a small percentage of inter-annual air temperature variability (i.e., 1–6%) at YP and (1–5%) at MP was observed. Net radiation varied by 4–11% at the YP site and 1–4% at the MP site. During the 2007/2008 drought years, the groundwater table depth was 11–23% deeper than the average years.
The seasonality of air temperature and net radiation followed a similar increasing trend from winter (i.e., January–March) towards spring (i.e., April–June), peaked in summer (i.e., July–September), and gradually declined in fall (i.e., October–December). However, the seasonal pattern of groundwater table depth varied, ranging from −26 cm to −40 cm depth, although the groundwater level was deeper in July to August than the rest of the year. As a result, an exceptionally severe water depletion was observed in the 2007/2008 summer season (Figure 2).

3.2. Interannual Variation in GPP, ET, and WUE

The YP site had an increasing inter-annual trend in ET starting from 2 yr old (annual mean = 1.58 ± 0.58 kg H2O m−2 d−1) to 8 yr old (2.51 ± 0.27 kg H2O m−2 d−1). However, the MP site had no distinct trend in the annual ET, with a 2–12% inter-annual variability ranging from 2.37 ± 1.03 to 2.92 ± 1.55 kg H2O m−2 d−1 (Figure 3).
A similar increasing inter-annual trend of GPP was observed at the YP site, ranging from 3.61 ± 1.30 g C m−2 d−1 at 2 yr old up to 7.21 ± 1.11 g C m−2 d−1 at 8 yr old. The inter-annual rate of change in GPP at the MP site was low (i.e., 2–9%), ranging from 6.54 ± 1.40 g C m−2 d−1 to 8.01 ± 2.60 g C m−2 d−1.
The inter-annual variability in WUE varied from 2 to 44%, along the chronosequence. The YP site had a higher annual WUE (i.e., 3.12 ± 1.20 g C kg−1 H2O d−1) compared to the MP site (i.e., 2.92 ± 0.45 g C kg−1 H2O d−1), indicating that the discrepancy between the rate of carbon absorbed and water leaving the plant was slightly greater in the YP site than in the MP site.

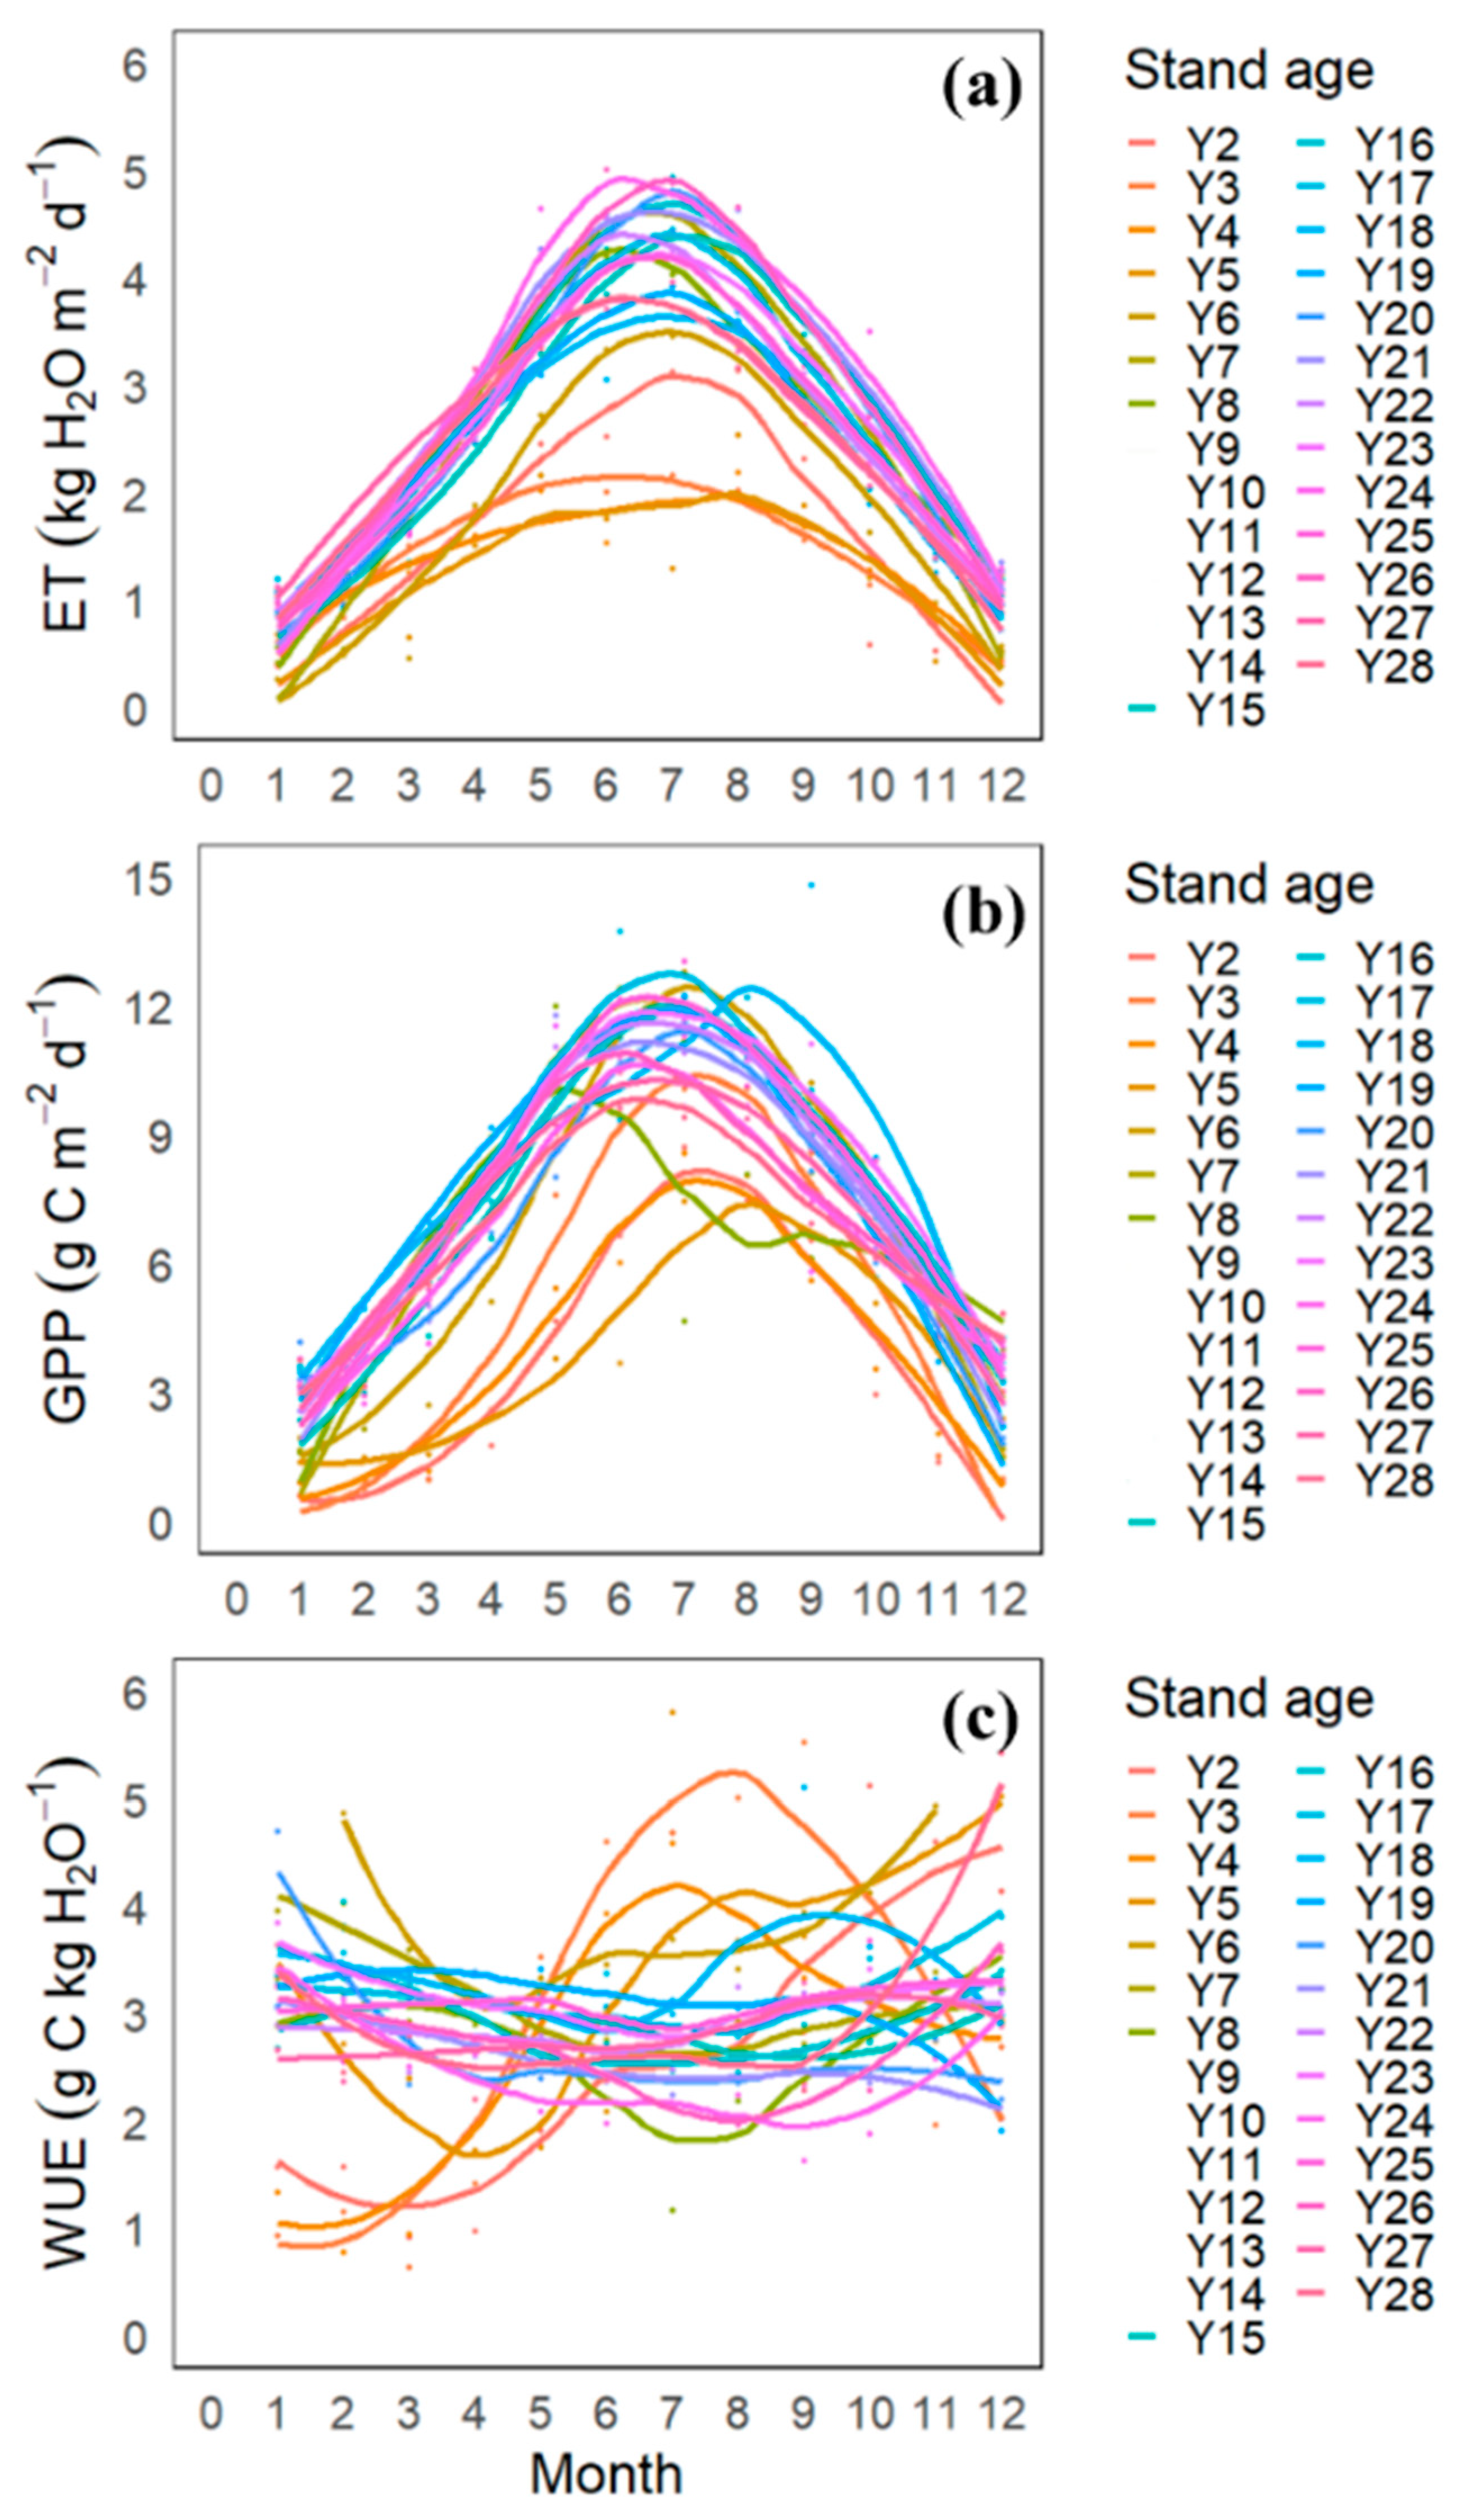
3.3. Monthly Variation in GPP, ET, and WUE

The seasonality of GPP and ET in both YP and MP was distinct, with a higher carbon uptake and evapotranspiration in April–September when spring and summer conditions favored leaf development, and generally lower during the non-growing months (i.e., October–December and January–March). During spring and summer seasons, the average GPP was 8.39 ± 1.55 g C m−2 d−1 in YP and 10.46 ± 1.47 g C m−2 d−1 in MP. However, during the fall and winter season, GPP was only 2.98 ± 1.16 g C m−2 d−1 in YP and 4.98 ± 1.75 g C m−2 d−1 in MP. In the same manner, ET during the growing season reached 2.76 ± 0.94 kg H2O m−2 d−1 and 3.87 ± 0.60 kg H2O m−2 d−1 for YP and MP, respectively. In contrast, during the non-growing season, ET was only 1.06 ± 0.65 kg H2O m−2 d−1 in YP and 1.67 ± 0.66 kg H2O m−2 d−1 at the MP site (Figure 4).
However, there was no clear seasonal pattern in WUE, even though a higher variability was observed during the growing season, with higher WUE in YP (i.e., 3.22 ± 1.05 g C kg−1 H2O−1) compared to MP (i.e., 2.74 ± 0.47 g C kg−1 H2O−1). Interestingly, the WUE at YP and MP during the non-growing season did not differ significantly at 3.05 ± 1.61 g C kg−1 H2O and 3.05 ± 0.53 g C kg−1 H2O, respectively.

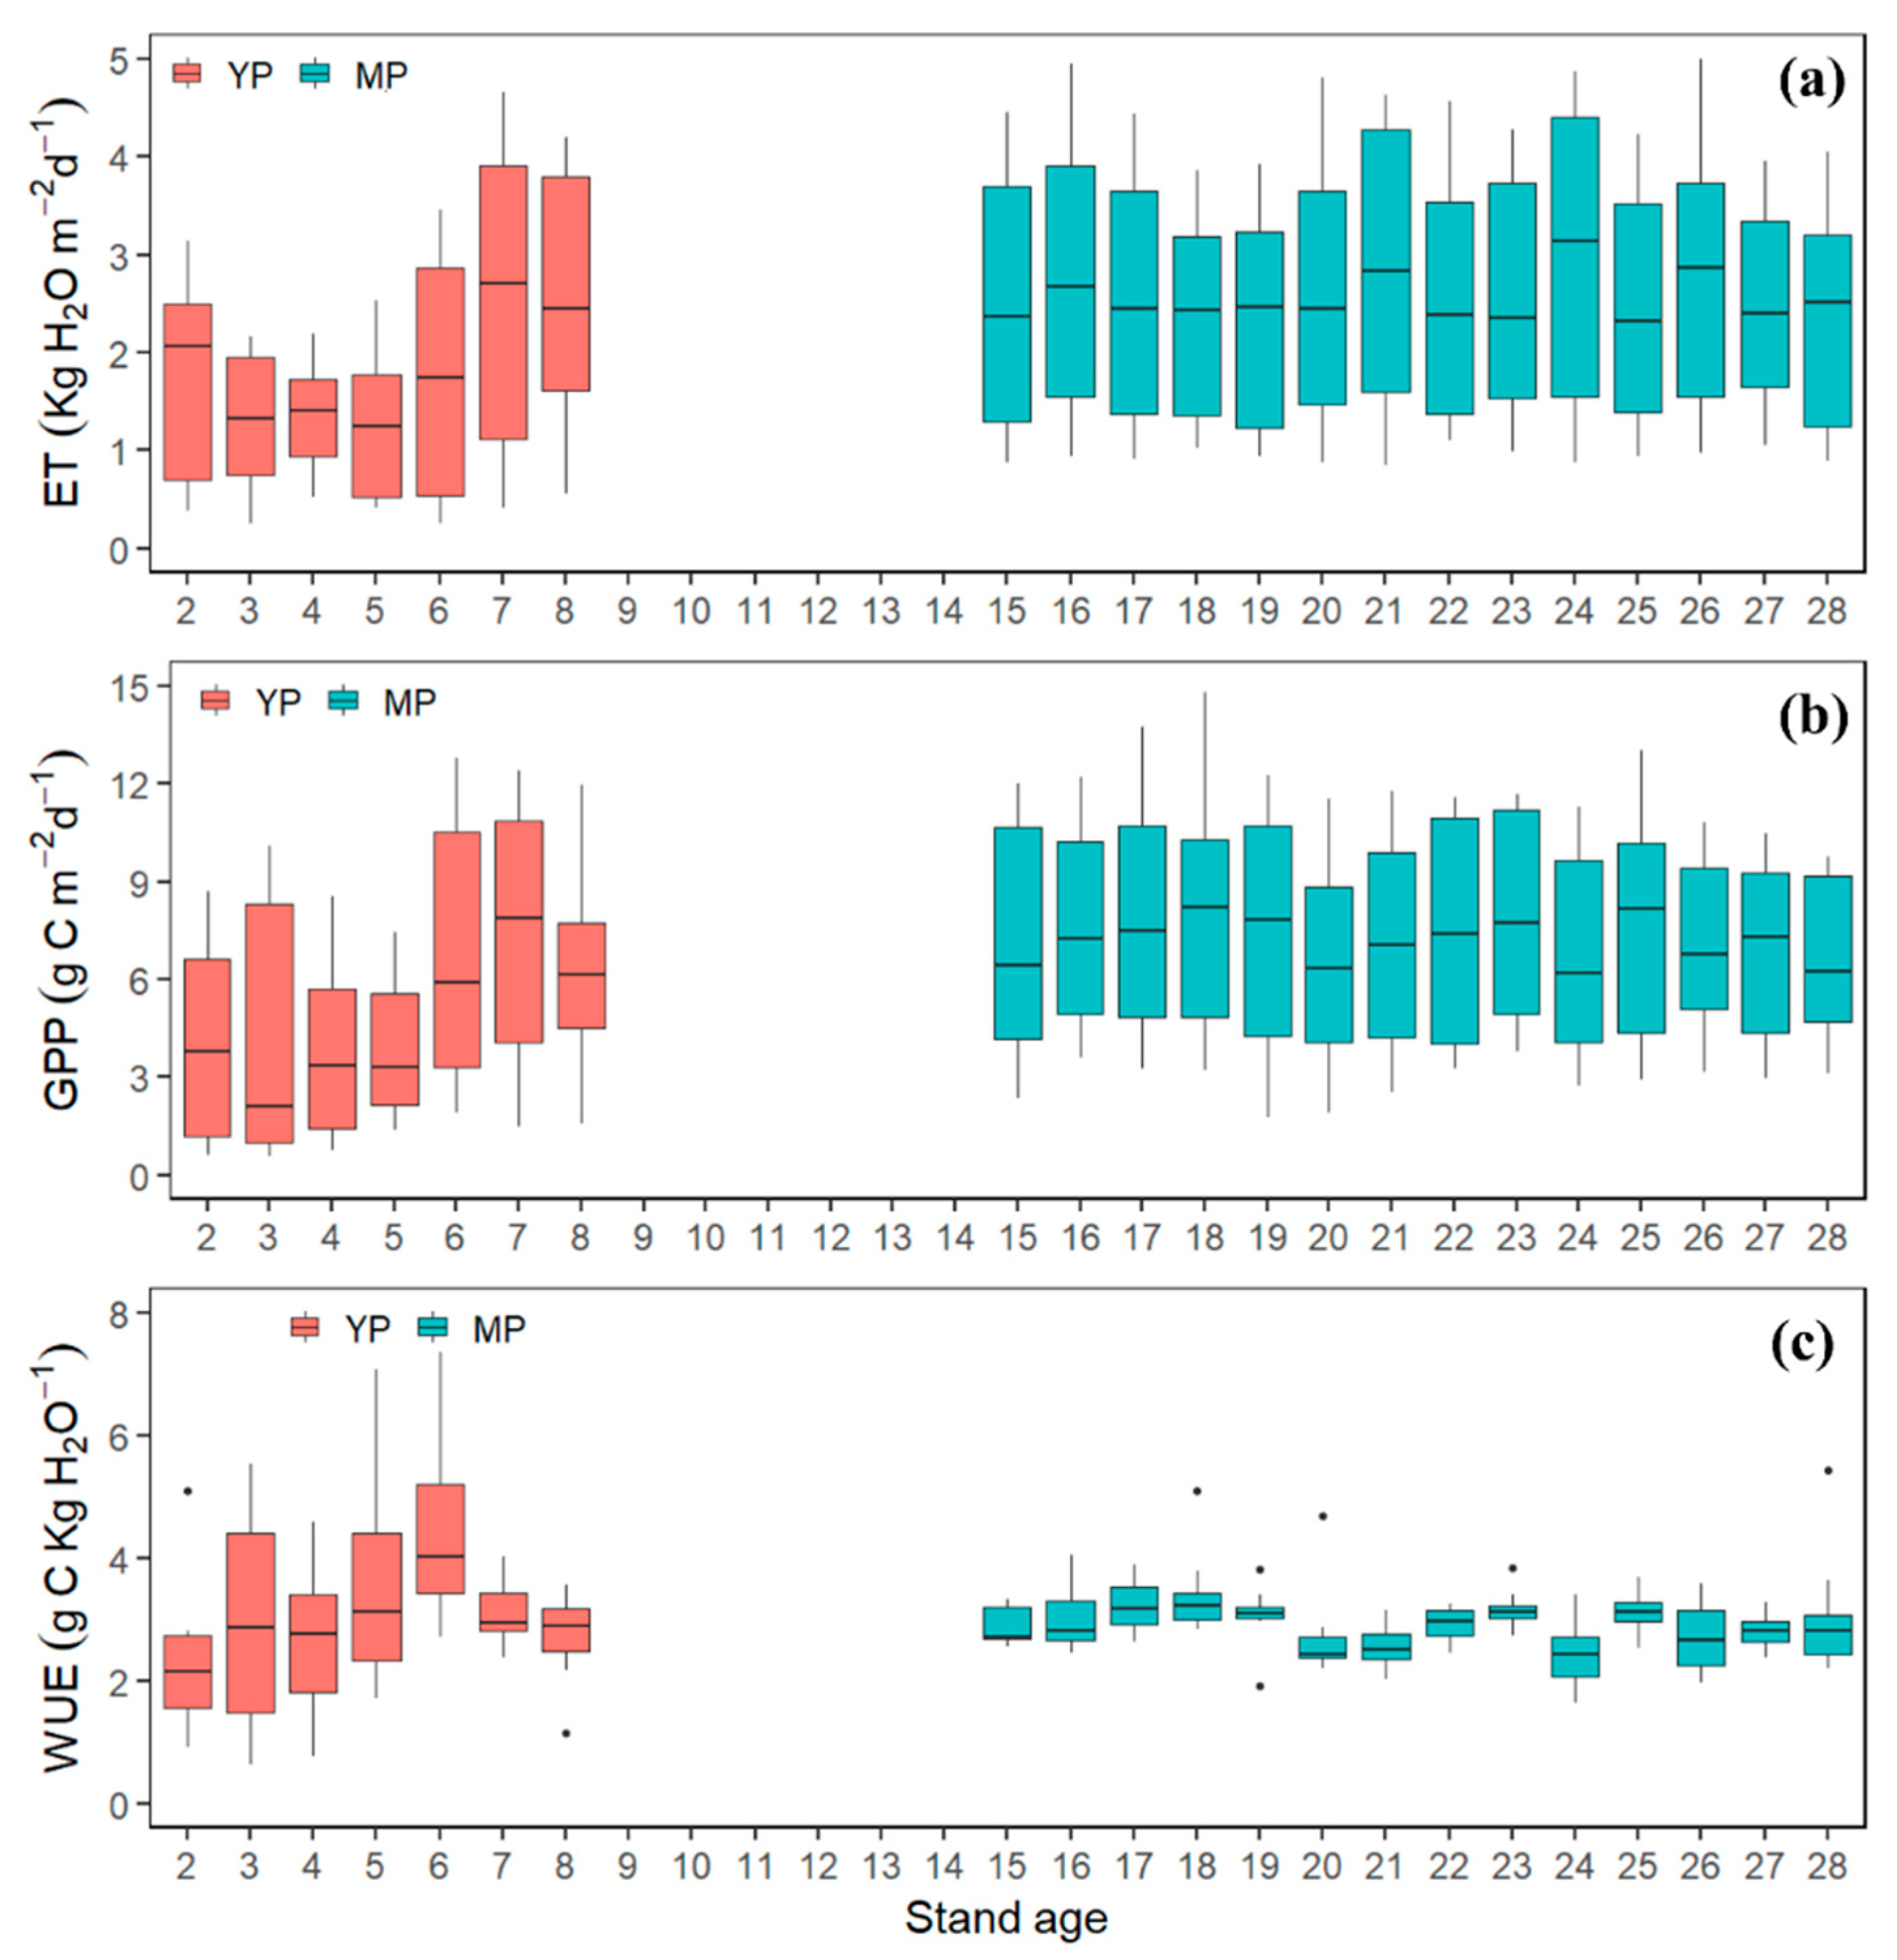
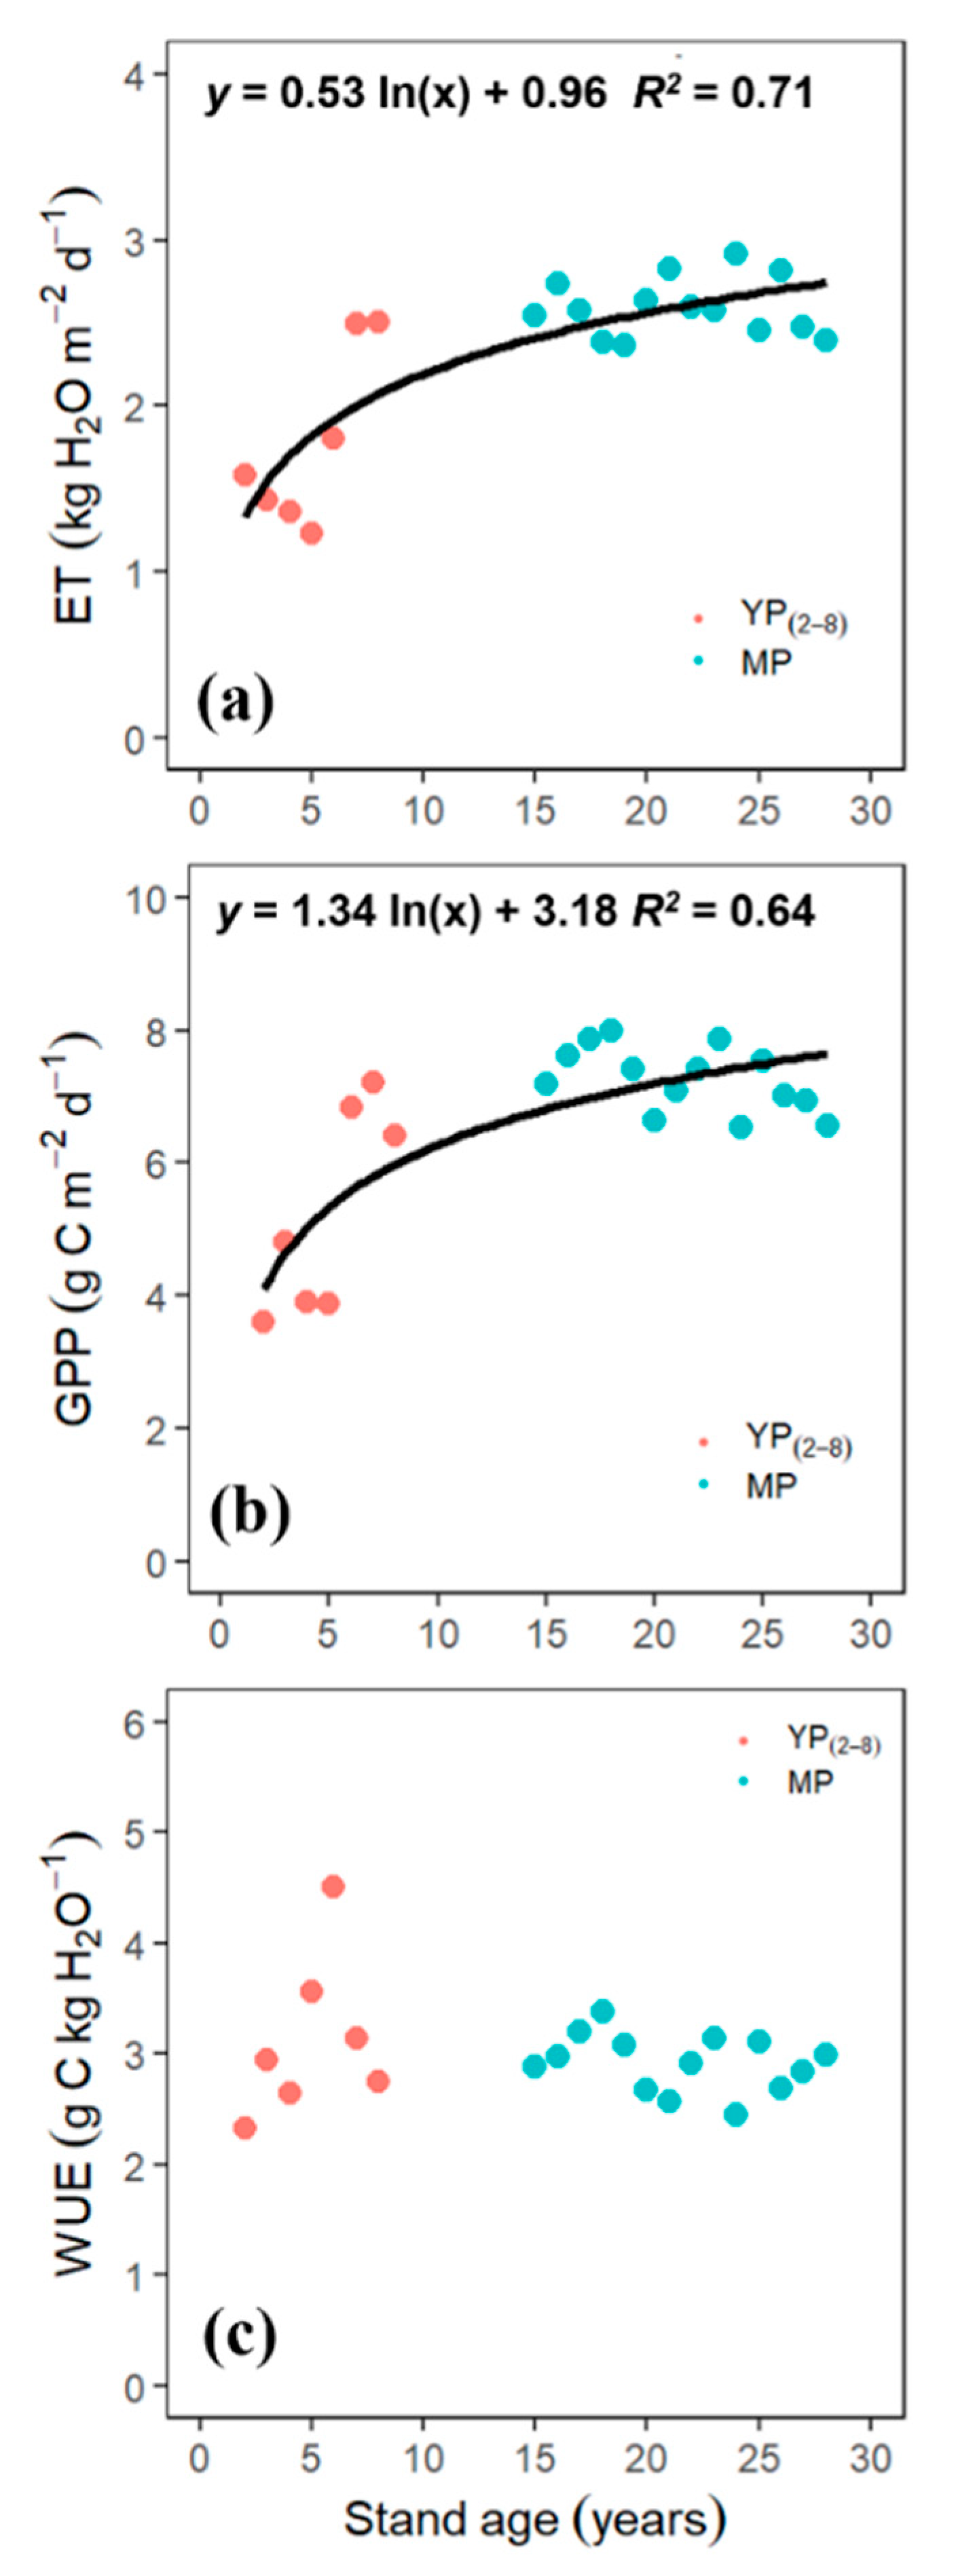
3.4. Age-Dependency of GPP, ET, and WUE

We found a strong age-dependency of ET (R2 = 0.71, p < 0.01) and GPP (R2 = 0.64, p < 0.01, Figure 5). ET and GPP increased withstand development, with a rapid increase from the stand initiation stage (YP) towards 10–15 years of age and then relative stabilization afterward. However, WUE was not affected by age (p > 0.05).

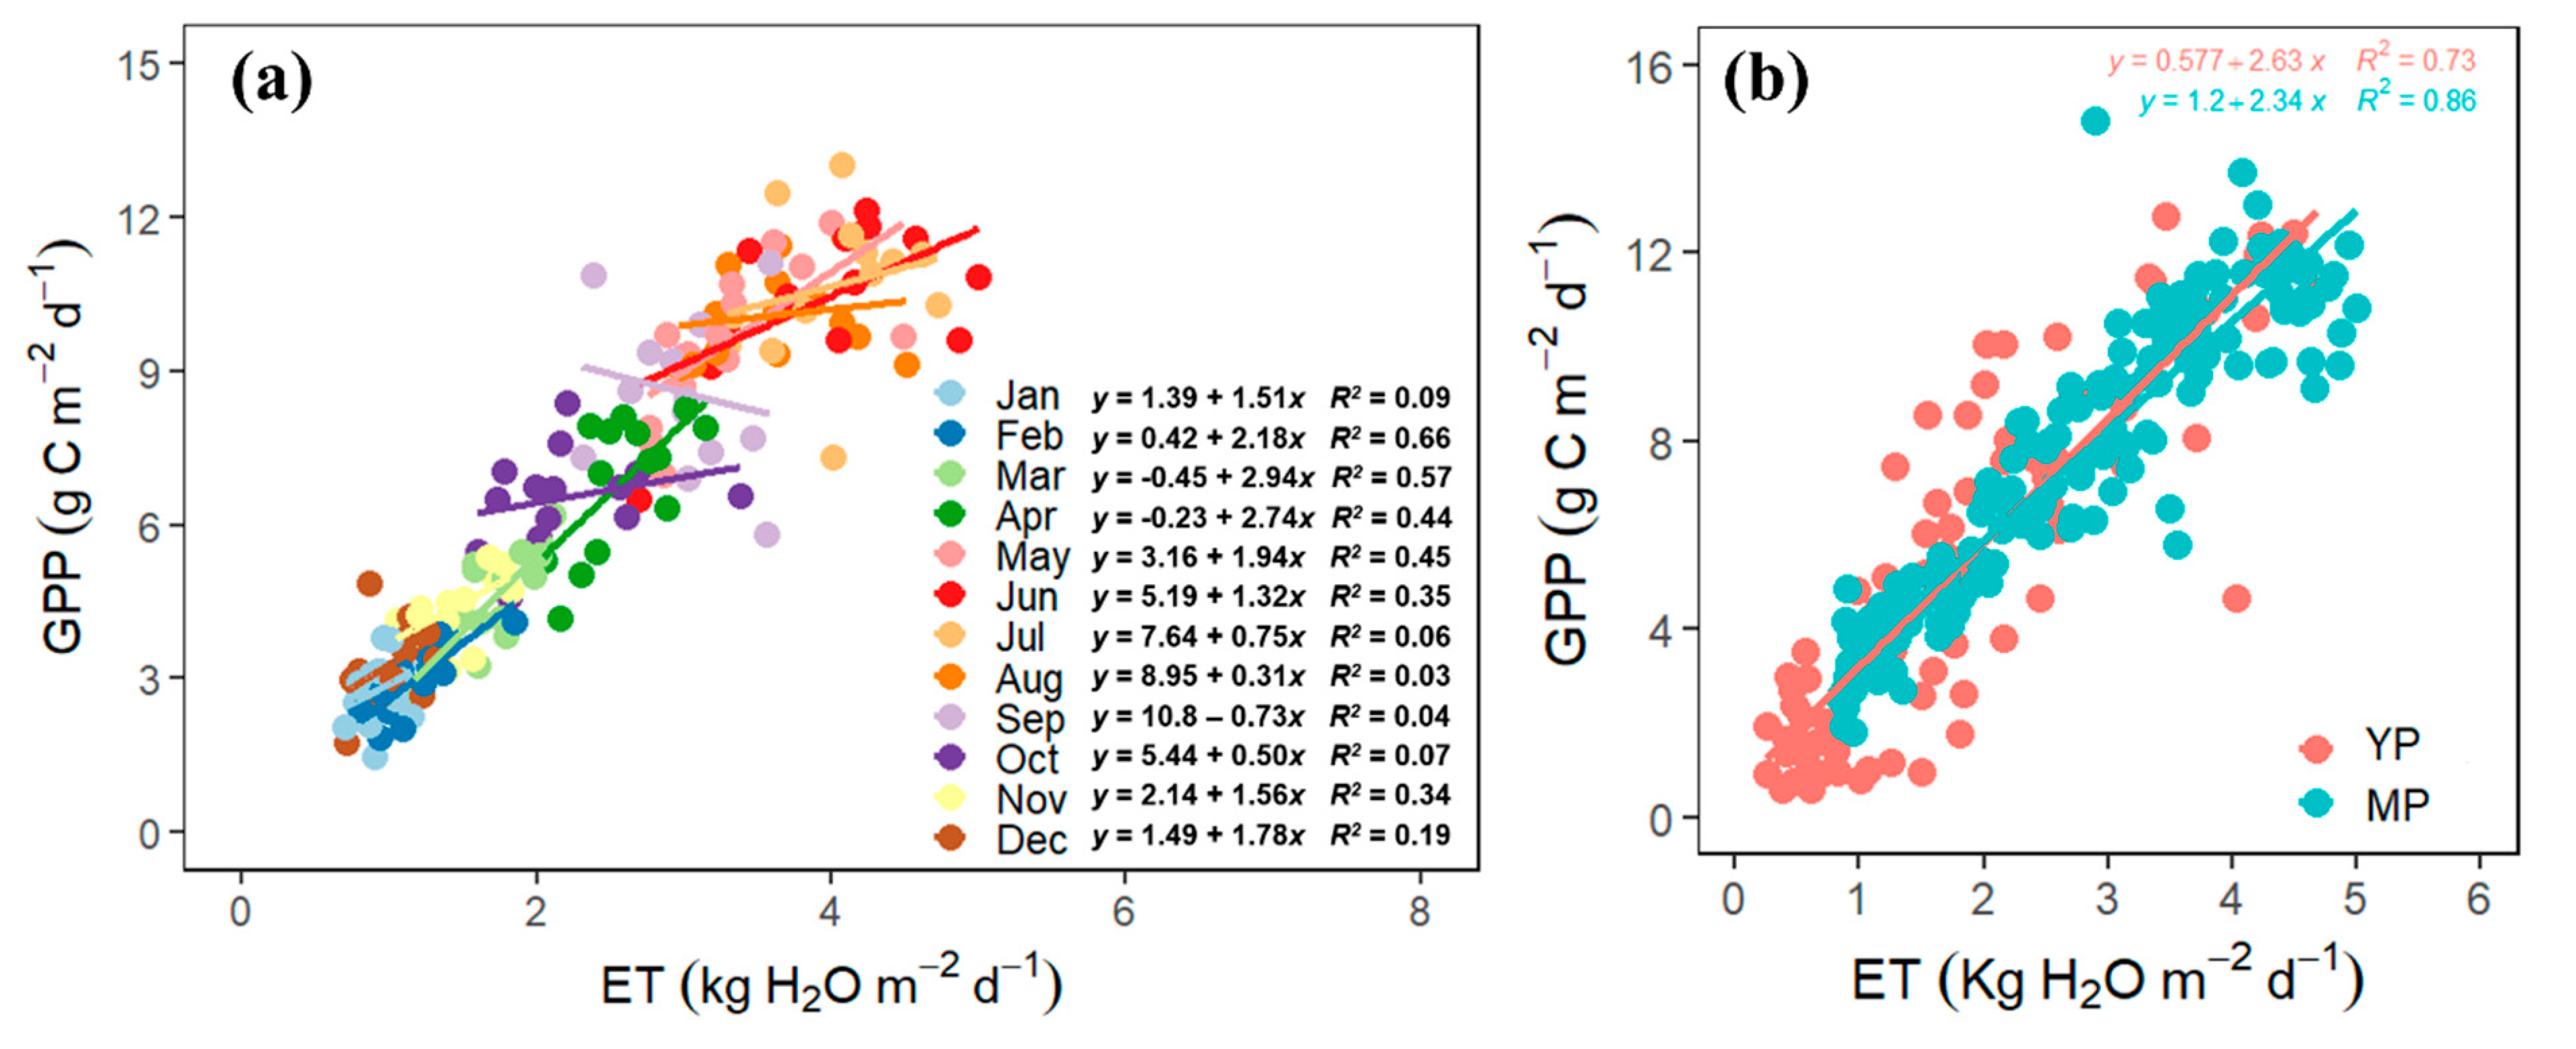
3.5. The Coupling of GPP and ET

Overall, GPP and ET were tightly coupled (R2 = 0.86), although the coupling was greater at MP (R2 = 0.86) than YP (R2 = 0.73, Figure 6b). The coupling was more robust during the non-growing season (R2= 0.19 − R2 = 0.57), but it was slightly decoupled during the growing season (maximum ~R2 = 0.35, Figure 6a).

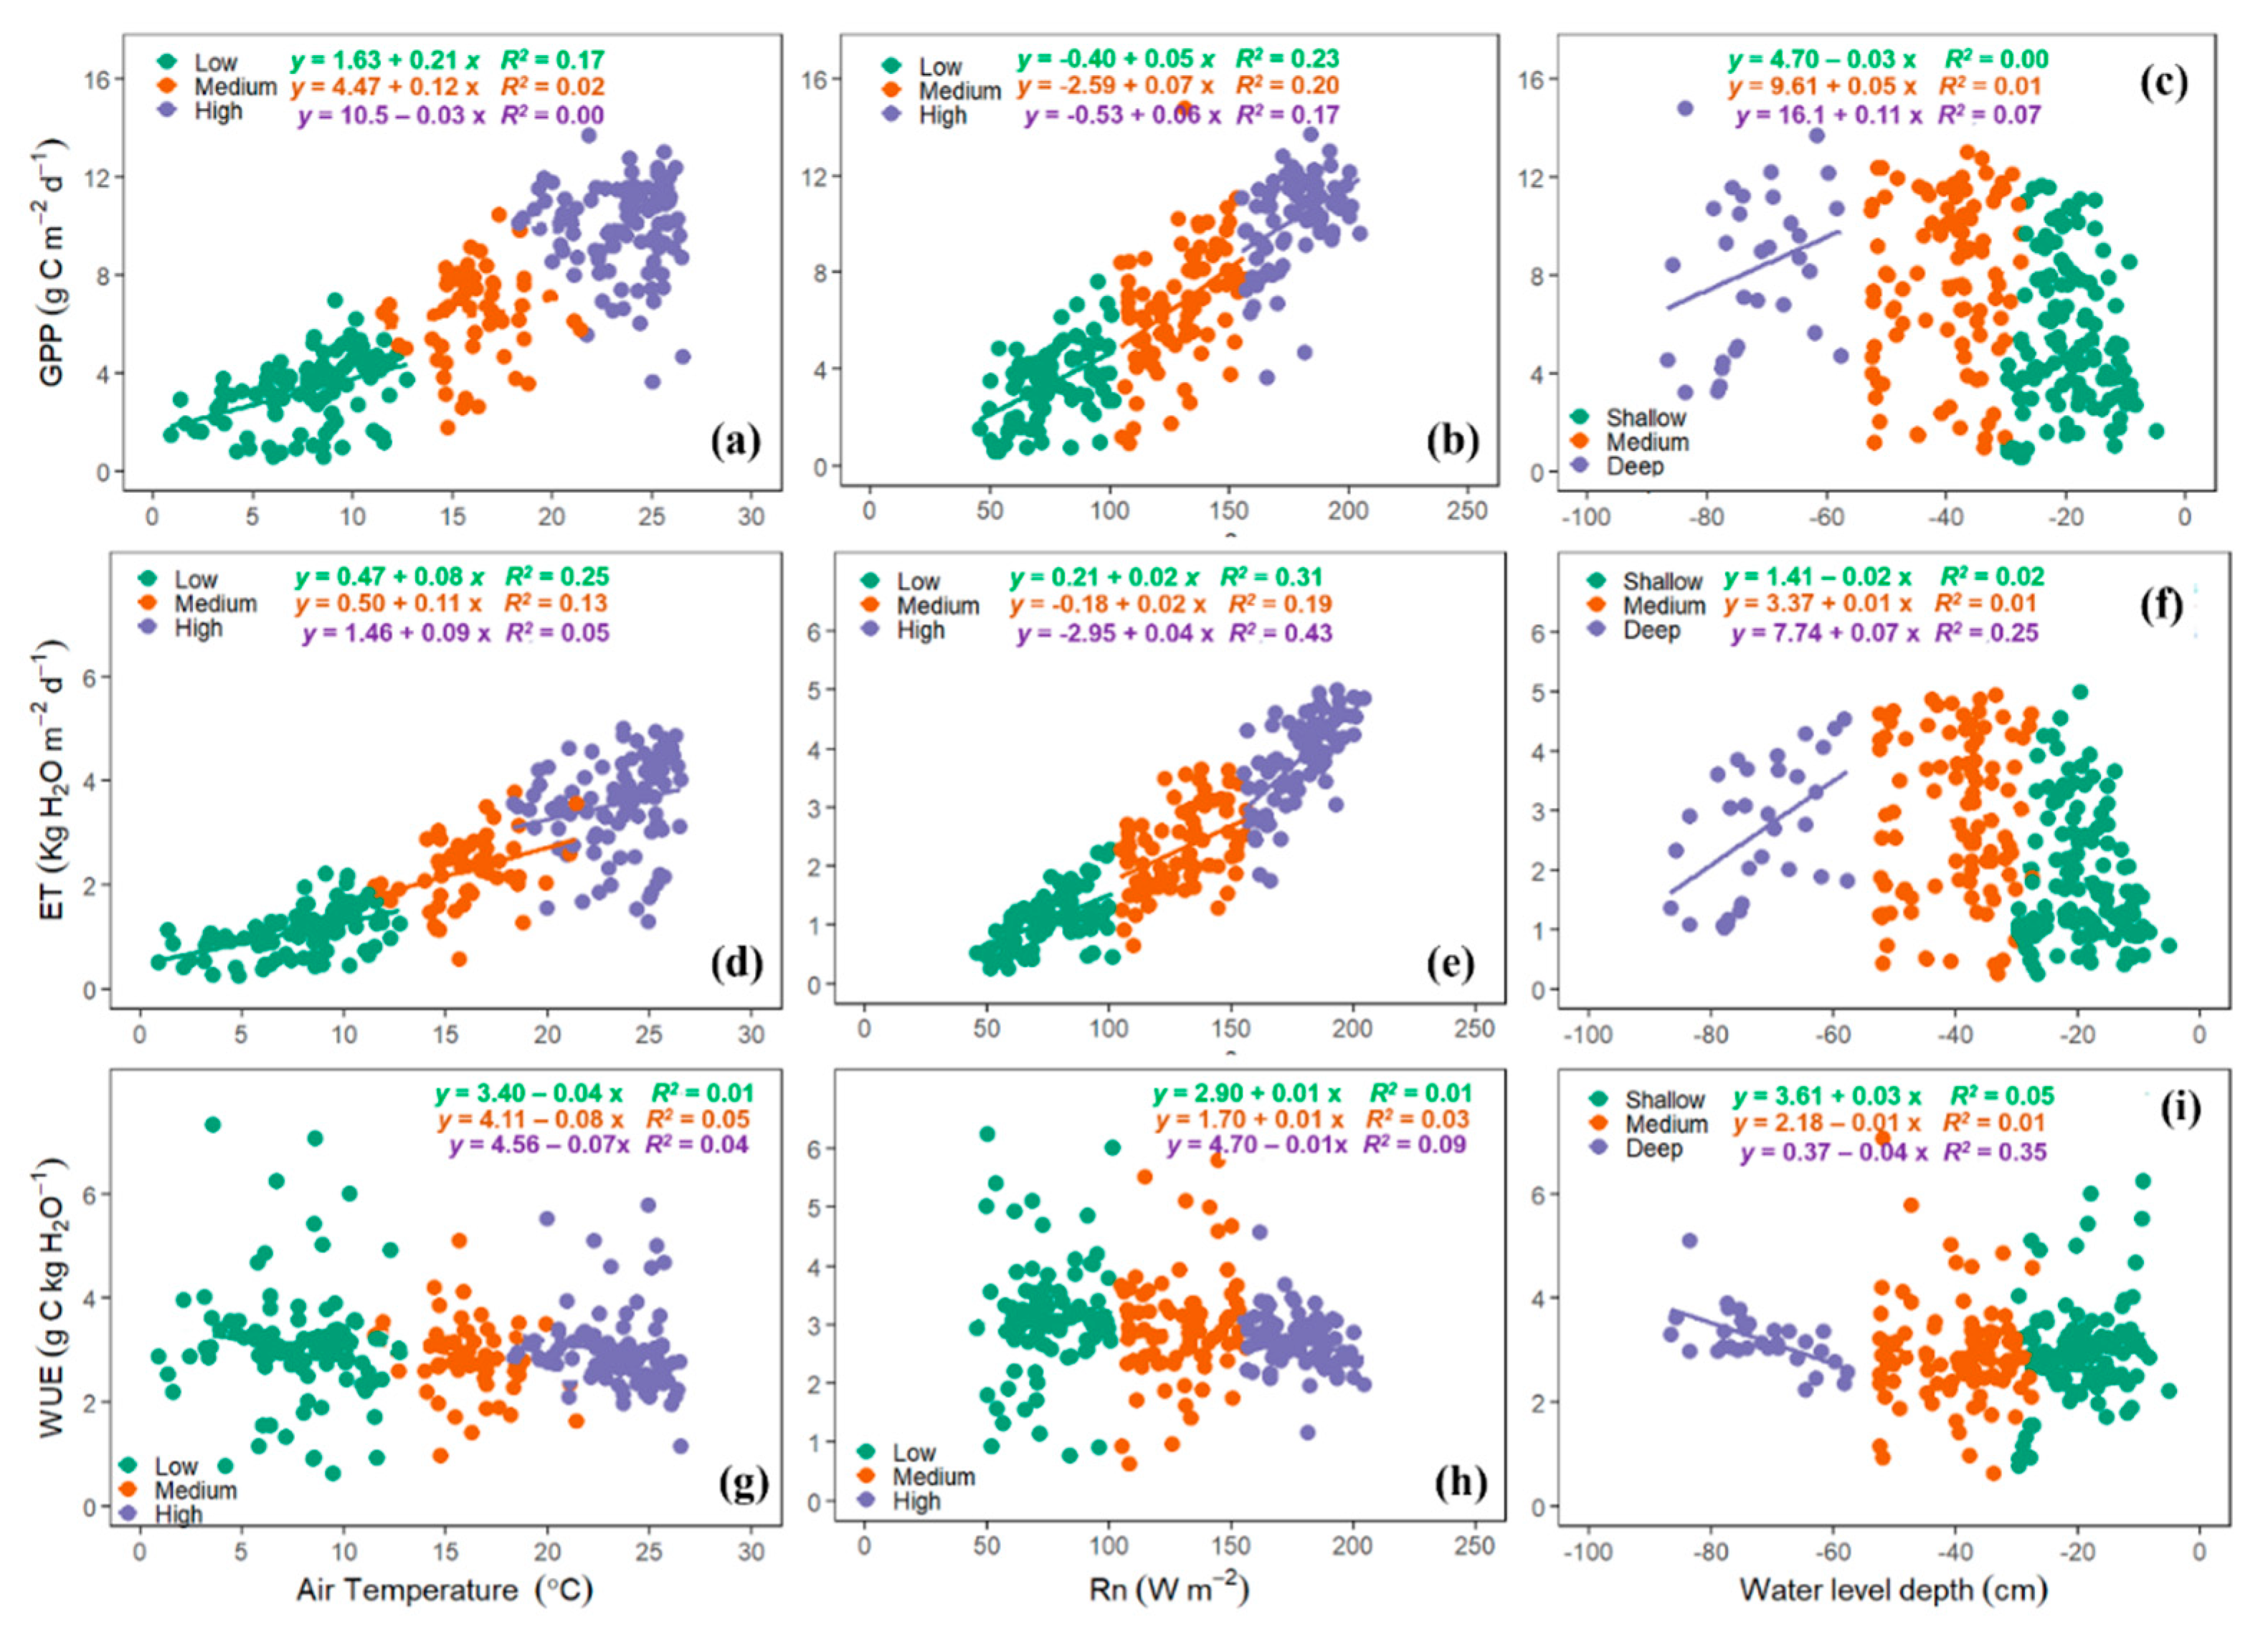
3.6. Environmental Effects on ET, GPP, and WUE

Net radiation (Rn) significantly affected GPP and ET across stand age with R2 = 0.74 and R2 = 0.82, respectively (Figure 7). A high cluster Rn (150 Wm–2 to 250 Wm–2) affected ET more (R2 = 0.43) than the low (R2 = 0.31) or medium (R2 = 0.19) cluster Rn. However, Rn did not significantly affect WUE (p > 0.05). The overall effect of air temperature on GPP and ET over time was strong (R2 = 0.71 and R2 = 0.72, respectively). However, GPP and ET were more sensitive to low temperatures, ranging from 0 to 12 °C, than the higher air temperatures up to 28 °C. Meanwhile, WUE was not affected by air temperature at any time (Figure 7). Overall, the groundwater depth did not significantly affect GPP, ET, or WUE (Figure 7).

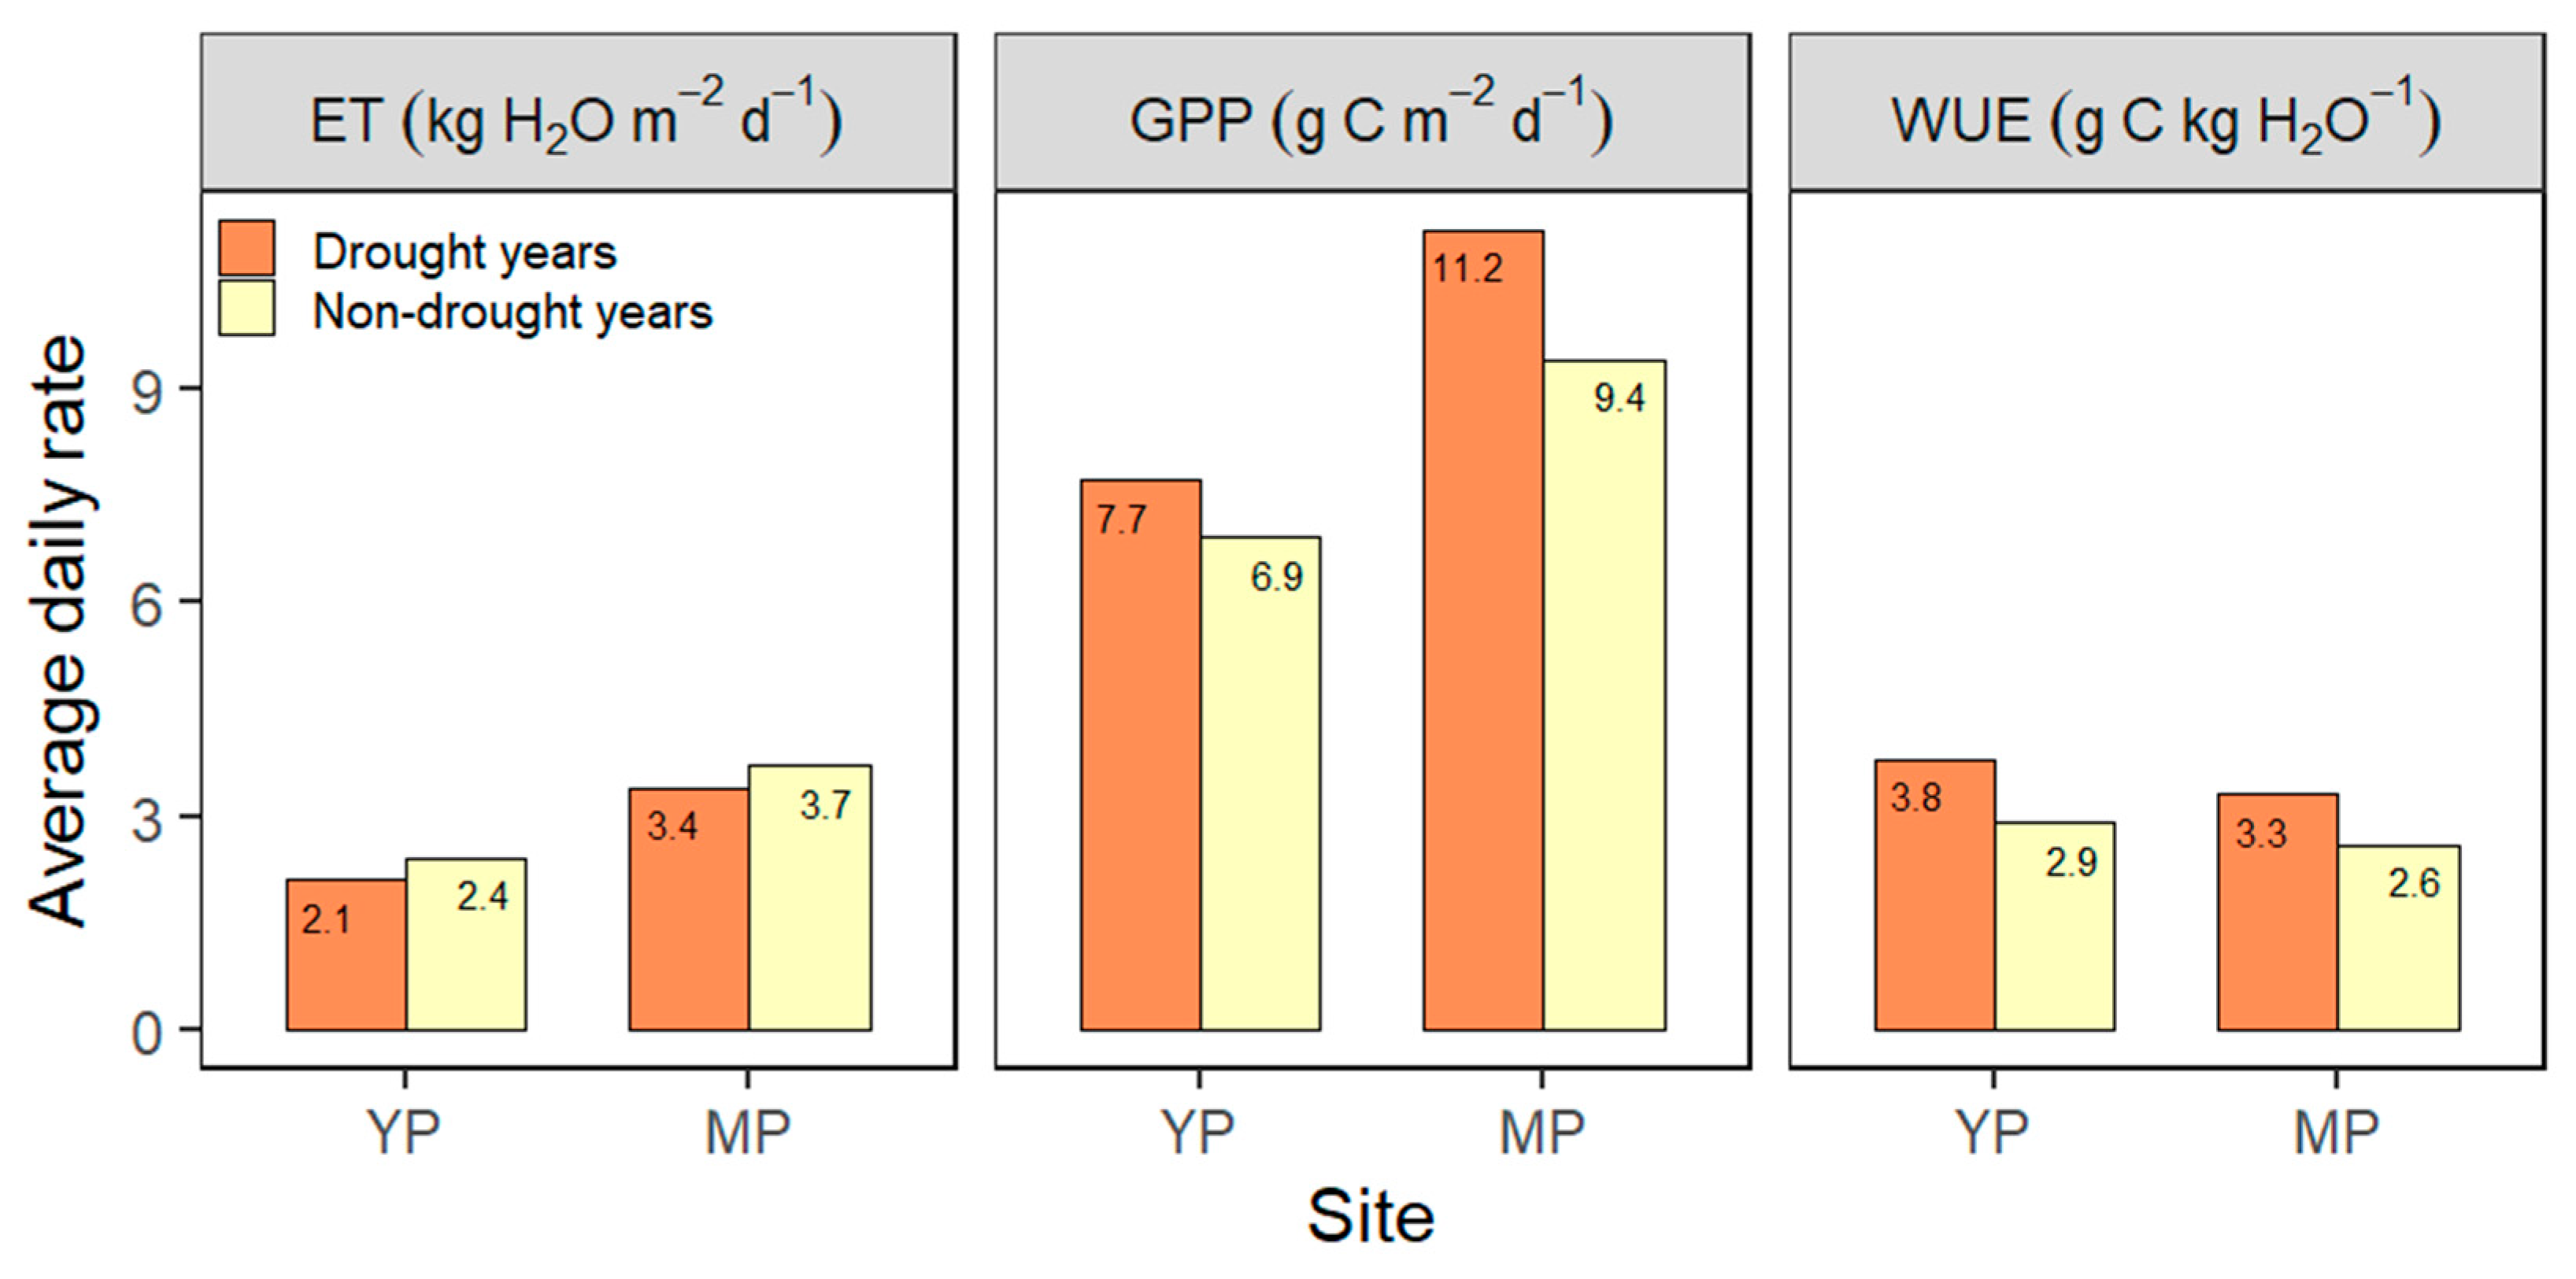
3.7. Drought Effects on GPP, ET, and WUE

The extreme dry periods occurring in 2007/2008 had been previously reported [37,45,46]. We observed a 19% increase in GPP at MP during the drought, whereas YP had a 11% increase. However, we found a decrease in ET at YP (i.e., 19%) and MP (i.e., 7%), and thereby a higher WUE by 27–32% at YP and MP, respectively during the drought (Figure 8). These inverse responses of GPP and ET during the extreme dry period indicate a decoupling of ET and GPP during drought.

4. Discussion

4.1. Inter-Annual Variation in GPP, ET, and WUE

Several studies have reported a seasonal variation in GPP and ET [18]. However, less literature is available for inter-annual variations in GPP and ET [59], especially over an extended period. Changes in GPP accelerated during the early growth of the stand in the recently harvested YP, in contrast to MP. Clearcutting removed the forest cover causing a low post-harvest GPP at YP in comparison with MP. The GPP at MP was always higher than at YP due in part to the recovery of the leaf area, 15 years after a harvest [46]. A thinning operation in 2009 at MP decreased leaf area index (LAI) [37], but interestingly GPP in this study appears to have been robust to this change. This could have been due to high leaf level physiology rates under higher light, water, and nutrient availability to the remaining trees (after thinning) that compensated for the loss of leaf area. Our result supports our hypothesis that GPP at the MP site would be higher than at the YP site. However, the inter-annual rate of the increase in GPP slowed when the stand attained canopy closure, confirming the notion that GPP is at its fastest rate when the trees are young but will tend to plateau before it later declines as the stand matures [30].
Annual ET at our sites ranged from 1.23 kg H2O m−2 d−1 to 2.92 kg H2O m−2 d−1, consistent with a range of ET reported for the southeastern US (1.33 to 4.12 kg H2O m−2 d−1 [34,43,47,60,61,62,63,64]). Other hydrological study sites worldwide observed an annual ET of 0.76 to 2.81 kg H2O m−2 d−1 [8,34,65,66,67,68,69]. The small inter-annual variability in annual ET at our sites must have been due to deeper roots and a shallow groundwater table in the coastal loblolly pine ecosystems [70] although ET at the MP site was higher than at the YP site supporting our hypothesis.
Literature reporting long-term scaled WUE is scarce, making a comparison to other studies difficult. It was reported that a decline in WUE has been observed in the Northern Amazonian forest since the 1950s due to an increasing atmospheric CO2 concentration [71]. However, this decreasing trend in WUE did not occur in our study. Since the ecosystem-scale WUE results from the integrated mean leaf-level WUE [8], interspecific variation in vegetation response to these changes in CO2 concentrations over the years may explain why we did not observe a decreasing pattern of WUE at our sites. The observed inter-annual variability in WUE in our study indicated that, even though the annual ET and GPP responded to similar environmental drivers, the extent of their responses did not vary much among years except when exposed to severe climate conditions.

4.2. Seasonal Variation in GPP, ET, and WUE

We found a general trend toward higher GPP at both YP and MP during the growing season compared to the non-growing season. The GPP responses were consistent with previous observations [72] and recent modeling studies [73,74], confirming that climatic conditions during the growing season favor the ecosystem photosynthetic activity, even with a slight reduction in soil water availability. This growing season pattern may be explained by the effect of greater incoming radiation and higher temperature, which stimulate leaf area production during the dry growing period [75], favoring greater CO2 assimilation rates [76]. At these times of high net radiation, the large amount of radiative forcing induced a high evaporative demand and, thus, high ET rates [18,19], consistent with our hypothesis. The seasonal dynamics of phenological changes also suggested a possible mechanism for high GPP and ET during the growing season, where leaf area peaked during mid-summer. Additionally, water uptake from deeper soil layers helped prevent photosynthesis from declining during the growing season [77].
Seasonal WUE behaved differently from that of GPP and ET. Seasonal variation in WUE is complicated and challenging to examine because WUE is a trade-off between water loss and carbon gain, and involves both biotic and abiotic drivers. This complexity suggests that wetland forest ecosystems have distinct seasonal carbon and water fluxes affected by local environmental conditions which vary intra-annually, in addition to differences in forest types and soil water dynamics. This complexity makes it difficult to calibrate WUE in ecosystem models for wetland forests.

4.3. Age Effects on GPP, ET, and WUE

A strong correlation between GPP and ET with stand age in our study was consistent with other studies [78,79,80,81]. The increasing trend in GPP with age in YP, that stabilized thereafter, was pointed out by Aguilos et al., 2020 [46]. Productivity was expected to stabilize with minimal fluctuations with age in more mature forests, considering that nutrients are immobilized within the plant biomass [82].
Our study showed that ET across the chronosequence increases with time commensurate with GPP increases. Therefore, the positive ET–stand age relationship implied that if plantations are maintained across the landscape in different age classes simultaneously, variations in depths of the water table would be reduced leading to small effects of drought on plant water availability. Meanwhile, WUE was not affected by age (p > 0.05), which does not support our hypothesis of a strong age-dependency of WUE.

4.4. GPP–ET Coupling

The strong ET–GPP coupling in both YP and MP can be related to changes in LAI with age. Other studies, including our previous report, found post-disturbance LAI recovery until 10–15 years of age. Thereafter, LAI slowly stabilized as the stand matured [37,83]. LAI can, therefore, be one of the primary components in the GPP and ET dynamics. A stronger ET–GPP coupling at MP than at YP occurred because MP had higher LAI [37] and less water stress due to mature/deeper root systems. However, there was a more significant reduction in ET at YP than in GPP, resulting in a slight decoupling in the ET–GPP relationship.

4.5. The Chronosequence

Previous studies have often used the chronosequence approach due to limited time and resources [31,32]. We agree that it might be hard to determine if different age sites have had a similar growth trajectory [33]. In addition, there was an age gap of a few years in our study, as it was challenging to obtain sites that can form a complete series within the rotation cycle. Despite these constraints, chronosequence studies are still valuable in examining the temporal dynamics of forest functions across multiple timescales. Such studies are especially useful when they are of the same species composition and similar site conditions, and if forests with different ages follow similar growth trajectory [33]. Our chronosequence study sites were near to each other, with common management regimes. Therefore, the sites experienced more or less the same climatic conditions, hydrology, and belowground resource availability, with a similar species composition, making them ideal sites for chronosequence studies.

4.6. Environmental Controls on GPP, ET, and WUE

Sustained light availability of high intensity, especially during the growing season, results in high photosynthesis [22,46,60,64] and ET [34,36,37,63,84], corresponding to a greater leaf area [28]. Air temperature is also one of the key drivers of GPP [22,85] and ET [8,37]. ET was at its peak during the growing season but declined during the non-growing season, suggesting that changes in seasonal climate conditions negatively affected ET. However, the effect of light and temperature on GPP and ET across clustered light/temperature levels was low. Soil type [86], water storage capacity [87], the timing of soil water recharge [88], and other factors such as LAI, stomatal conductance, and other environmental drivers are crucial in GPP and ET processes [89,90,91,92].
Net radiation and air temperature did not significantly explain the variability of WUE across ages. This finding indicated that in a future warmer climate, with increasing CO2 concentration and higher solar energy [93], wetland forests may adjust control over carbon and water fluxes, and water use may become less efficient. However, the influence of net radiation and air temperature on WUE was weak. The control of soil water could only affect WUE when the groundwater table depth was very low (i.e., −50 to −80 cm). However, the amount of variance explained was only 35%. This result indicated that soil water availability had less impact on WUE even during extreme climate anomalies. One plausible explanation of the low response of WUE to climate is that biological controls may have a more significant influence over that of climate. These plant-centered processes may include leaf phenological changes, plant structural attributes, pests and diseases, among others [18,59,94,95,96]. Further investigation into these biological mechanisms is needed to examine their potential contribution to WUE.
Little variations in WUE during drought implies that even if the processes involved in CO2 and H2O fluxes varied individually, they converge towards relatively stable water use efficiency. This finding has significant implications for ecosystem modeling because it suggests that WUE can be modeled using a constant value (e.g., coefficient) despite the large variability in GPP, ET, and climate.

4.7. Drought Effects on GPP, ET, and WUE

Our study sites had a high groundwater table common to most lower coastal plain areas. They were capable of providing sufficient water for evapotranspiration. However, the years 2007 and 2008 were extremely dry. During these years, the depth of the groundwater table fell below 50 to 80 cm below the soil surface [43,46,48,70]. During the 2007/2008 drought period, ET was reduced due to a reduced canopy interception brought about by low precipitation [45]. However, other studies have reported greater actual ET during drought [97,98] due to increased available energy and a vapor pressure deficit. It appears that the increased atmospheric demand did not overcome the decreased precipitation and water supply during drought at our study sites.
The decline in ET at YP was higher compared to MP during the drought periods. This result is consistent with a coastal study reporting that drought had significantly affected young stands [81]. Low leaf biomass/LAI, shallow root systems, and a reduction in plant hydraulic conductivity may have induced drought-related reduction in transpiration [47]. Clearly, drought affected young plantations more than matured plantations, which supports our hypothesis. Reductions in tree interception, plant transpiration, and soil evaporation may have slightly reduced ET during drought at the MP site. Hydraulic redistribution due to deep roots may have supplied sufficient soil water to the upper soil layers, thus, sustaining ET at the MP site during the drought [38].
An increase in GPP with reduced soil water content during the drought indicates that the impact of low soil water availability was less compared to the significant effect of light and temperature on GPP. A previous study at the site reported that the drought effect was overshadowed by higher LAI and light availability [48]. At sites with high groundwater tables, rainfall-induced soil anoxia limits decomposition and nutrient mineralization [46], thereby limiting GPP, and, thus, drier conditions may enhance root function and carbon gain. Additionally, soil characteristics at our sites (a mix of porous organic matter and sand) allowed the production of deep roots and the exploitation of a greater soil volume [38]. As a consequence, large water potential gradients existed within the soil–root–plant continuum; thus, triggering the redistribution of water via roots from deep and wet soil to shallow and dry soil. This phenomenon likely mitigated the effect of soil drying and positively influenced carbon assimilation [38]. Higher GPP in YP during drought may have been due to efficient root systems that can withstand extreme dry conditions, keeping fine roots hydrated for longer period of time. The ability of these roots to keep roots hydrated over a longer period delayed the drying of the upper soil surfaces [37,38,47].
In our study, drought induced higher WUE which supports our hypothesis. This enhancement in WUE was due to an increase in GPP and a decline in ET. This is inconsistent with a study [45] where a similar rise in evapotranspiration was not accompanied by an increase in productivity. Our result of an enhancement in WUE due to a larger decline in ET than an increase in GPP was also found in a long-term drought experiment [99]. However, other studies (e.g., drought-prone subtropical and semi-arid/sub-humid ecosystems) reported lower WUE during drought [57,100]. The asynchronous response of GPP and ET during drought suggests that decoupling between carbon and water cycles in this wetland ecosystem occurred due in part to the differential forcing of biotic (e.g., stomatal responses) and abiotic (e.g., surface water evaporation) components of the system. This result does not support our hypothesis of a tight coupling between GPP and ET during drought and is not consistent with the strong GPP–ET coupling reported in other studies [6,23,99,100].
Although ecosystem productivity and evapotranspiration responded to the same key climate drivers in our study, their responses differed during drought years. Productivity can be affected less during drought as stomatal closure triggers a stronger down-regulation of leaf water loss than of carbon assimilation [101]. Moreover, transpiration is closely related to stomatal conductance, while photosynthesis is affected by various other factors and does not respond linearly to variations in stomatal conductance [102]. Different responses of evapotranspiration and photosynthesis to drought suggests the complexity for ecosystem models to accurately simulate these processes.

5. Conclusions

WUE represents a measure of trade-offs between carbon and water fluxes at the ecosystem level. Our study enriches the scarce literature on the long-term inter-annual and seasonal variability of GPP, ET, and WUE in a plantation forest ecosystem. The absence of distinct seasonal and inter-annual patterns in WUE for a mature stand (age > 10) under normal climate conditions, confirms that carbon and water cycles are tightly coupled. Although the processes involved in CO2 and H2O fluxes varied individually, they converged towards a relatively stable water use efficiency as the pine plantation matured. A stable WUE suggests that the pine ecosystem productivity can be readily predicted from ET and vice versa.
The historic extreme drought events in 2007/2008 affected little of pine plantation WUE. Pine plantations on the coastal plain were effective in coping with low soil water availability for carbon gain under periodical drought. A different sensitivity of ET and GPP to drought should be properly considered in developing ecosystem models. Our study presents aspects of improving ecosystem models to understand better the trade-off between the carbon absorbed and water released in vegetation–climate–hydrology feedback loops.

Author Contributions

Conceptualization, M.A. and G.S.; methodology, M.A. and G.S.; software, M.A., P.P. and B.M.; validation, G.S., P.P. and B.M.; formal analysis, M.A. and G.S.; investigation, M.G., P.P., K.J.M. and B.M.; resources, A.N. and J.K.; data curation, M.A., P.P., K.J.M. and B.M.; writing–original draft preparation, M.A. and G.S.; writing–review and editing, G.S., J.-C.D., S.M., M.G. and J.K.; visualization, M.A. and G.S.; supervision, A.N. and J.K.; project administration, A.N., G.S., S.M. and J.K.; funding acquisition, A.N., J.K., S.M. and G.S. All authors have read and agreed to the published version of the manuscript.

Funding

Primary funding was provided by the USDA NIFA (Multi-agency A.5 Carbon Cycle Science Program) award 2014-67003-22068. Additional funding was provided by the DOE NICCR award 08-SC-NICCR-1072, the USDA Forest Service award 13-JV-11330110-081, and the DOE LBNL award DE-AC02-05CH11231. We are grateful to Weyerhaeuser NR Company for the long-term access to the managed loblolly pine plantations and others in-kind support.

Institutional Review Board Statement

Not applicable.

Conflicts of Interest

The authors declare no conflict of interest.

References

  1. Beer, C.; Ciais, P.; Reichstein, M.; Baldocchi, D.; Law, B.; Papale, D.; Soussana, J.-F.; Ammann, C.; Buchmann, N.; Frank, D.; et al. Temporal and among-site variability of inherent water use efficiency at the ecosystem level. Glob. Biogeochem. Cycles 2009, 23. [Google Scholar] [CrossRef]
  2. Keenan, T.F.; Hollinger, D.Y.; Bohrer, G.; Dragoni, D.; Munger, J.W.; Schmid, H.P.; Richardson, A.D. Increase in forest water-use efficiency as atmospheric carbon dioxide concentrations rise. Nat. Cell Biol. 2013, 499, 324–327. [Google Scholar] [CrossRef]
  3. Bonal, D.; Burban, B.; Stahl, C.; Wagner, F.; Herault, B. The response of tropical rainforests to drought—Lessons from recent research and future prospects. Ann. For. Sci. 2016, 73, 27–44. [Google Scholar] [CrossRef] [Green Version]
  4. Kuglitsch, F.G.; Reichstein, M.; Beer, C.; Carrara, A.; Ceulemans, R.; Granier, A.; Janssens, I.A.; Koestner, B.; Lindroth, A.; Loustau, D.; et al. Characterisation of ecosystem water-use efficiency of european forests from eddy covariance measurements. Biogeosciences Discuss. 2008, 5, 4481–4519. [Google Scholar] [CrossRef] [Green Version]
  5. Niu, S.; Wu, M.; Han, Y.; Xia, J.; Li, L.; Wan, S. Water-mediated responses of ecosystem carbon fluxes to climatic change in a temperate steppe. New Phytol. 2008, 177, 209–219. [Google Scholar] [CrossRef] [PubMed]
  6. Huang, M.; Piao, S.; Sun, Y.; Ciais, P.; Cheng, L.; Mao, J.; Poulter, B.; Shi, X.; Zeng, Z.; Wang, Y. Change in terrestrial ecosystem water-use efficiency over the last three decades. Glob. Chang. Biol. 2015, 21, 2366–2378. [Google Scholar] [CrossRef]
  7. Xie, J.; Chen, J.; Sun, G.; Zha, T.; Yang, B.; Chu, H.; Liu, J.; Wan, S.; Zhou, C.; Ma, H.; et al. Ten-year variability in ecosystem water use efficiency in an oak-dominated temperate forest under a warming climate. Agric. For. Meteorol. 2016, 218, 209–217. [Google Scholar] [CrossRef]
  8. Aguilos, M.; Stahl, C.; Burban, B.; Herault, B.; Courtois, E.; Coste, S.; Wagner, F.; Ziegler, C.; Takagi, K.; Bonal, D. Interannual and Seasonal Variations in Ecosystem Transpiration and Water Use Efficiency in a Tropical Rainforest. Forests 2018, 10, 14. [Google Scholar] [CrossRef] [Green Version]
  9. Lloyd, J.; Shibistova, O.; Zolotoukhine, D.; Kolle, O.; Arneth, A.; Wirth, C.; Styles, J.M.; Tchebakova, N.M.; Schulze, E.-D. Seasonal and annual variations in the photosynthetic productivity and carbon balance of a central Siberian pine forest. Tellus B Chem. Phys. Meteorol. 2002, 54, 590–610. [Google Scholar] [CrossRef]
  10. Arneth, A.; Veenendaal, E.M.; Best, C.; Timmermans, W.; Kolle, O.; Montagnani, L.; Shibistova, O. Water use strategies and ecosystem-atmosphere exchange of CO2 in two highly seasonal environments. Biogeosciences 2006, 3, 421–437. [Google Scholar] [CrossRef] [Green Version]
  11. Zhang, Y.; Song, C.; Sun, G.; Band, L.E.; McNulty, S.; Noormets, A.; Zhang, Q.; Zhang, Z. Development of a coupled carbon and water model for estimating global gross primary productivity and evapotranspiration based on eddy flux and remote sensing data. Agric. For. Meteorol. 2016, 223, 116–131. [Google Scholar] [CrossRef] [Green Version]
  12. Tan, Z.; Zhang, Y.P.; Deng, X.B.; Song, Q.H.; Liu, W.J.; Deng, Y.; Tang, J.W.; Liao, Z.Y.; Zhao, J.F.; Yang, L.Y. Interannual and seasonal variability of water use efficiency in a tropical rainforest: Results from a 9 year eddy flux time series. J. Geophys. Res. Atmos. 2014, 120, 464–479. [Google Scholar] [CrossRef]
  13. Yang, S.; Zhang, J.; Han, J.; Wang, J.; Zhang, S.; Bai, Y.; Cao, D.; Xun, L.; Zheng, M.; Chen, H.; et al. Evaluating global ecosystem water use efficiency response to drought based on multi-model analysis. Sci. Total Environ. 2021, 778, 146356. [Google Scholar] [CrossRef] [PubMed]
  14. Yang, S.; Zhang, J.; Zhang, S.; Wang, J.; Bai, Y.; Yao, F.; Guo, H. The potential of remote sensing-based models on global water-use efficiency estimation: An evaluation and intercomparison of an ecosystem model (BESS) and algorithm (MODIS) using site level and upscaled eddy covariance data. Agric. For. Meteorol. 2020, 287, 107959. [Google Scholar] [CrossRef]
  15. Wei, J.; Chen, Y.; Gu, Q.; Jiang, C.; Ma, M.; Song, L.; Tang, X. Potential of the remotely-derived products in monitoring ecosystem water use efficiency across grasslands in Northern China. Int. J. Remote Sens. 2019, 40, 6203–6223. [Google Scholar] [CrossRef]
  16. Jiang, C.; Ryu, Y. Multi-scale evaluation of global gross primary productivity and evapotranspiration products derived from Breathing Earth System Simulator (BESS). Remote Sens. Environ. 2016, 186, 528–547. [Google Scholar] [CrossRef]
  17. Hutyra, L.R.; Munger, J.W.; Saleska, S.R.; Gottlieb, E.; Daube, B.C.; Dunn, A.L.; Amaral, D.F.; de Camargo, P.B.; Wofsy, S.C. Seasonal controls on the exchange of carbon and water in an Amazonian rain forest. J. Geophys. Res. Space Phys. 2007, 112, 1–16. [Google Scholar] [CrossRef]
  18. Costa, M.H.; Biajoli, M.C.; Sanches, L.; Malhado, A.; Hutyra, L.R.; Da Rocha, H.R.; Aguiar, R.G.; De Araújo, A.C. Atmospheric versus vegetation controls of Amazonian tropical rain forest evapotranspiration: Are the wet and seasonally dry rain forests any different? J. Geophys. Res. Space Phys. 2010, 115. [Google Scholar] [CrossRef]
  19. Christoffersen, B.O.; Restrepo-Coupe, N.; Arain, M.A.; Baker, I.T.; Cestaro, B.P.; Ciais, P.; Fisher, J.; Galbraith, D.; Guan, X.; Gulden, L.; et al. Mechanisms of water supply and vegetation demand govern the seasonality and magnitude of evapotranspiration in Amazonia and Cerrado. Agric. For. Meteorol. 2014, 191, 33–50. [Google Scholar] [CrossRef]
  20. Malhi, Y. The productivity, metabolism and carbon cycle of tropical forest vegetation. J. Ecol. 2011, 100, 65–75. [Google Scholar] [CrossRef]
  21. Brando, P.M.; Goetz, S.; Baccini, A.; Nepstad, D.C.; Beck, P.S.A.; Christman, M.C. Seasonal and interannual variability of climate and vegetation indices across the Amazon. Proc. Natl. Acad. Sci. USA 2010, 107, 14685–14690. [Google Scholar] [CrossRef] [PubMed] [Green Version]
  22. Aguilos, M.; Herault, B.; Burban, B.; Wagner, F.H.; Bonal, D. What drives long-term variations in carbon flux and balance in a tropical rainforest in French Guiana? Agric. For. Meteorol. 2018, 253–254, 114–123. [Google Scholar] [CrossRef]
  23. Brienen, R.J.W.; Wanek, W.; Hietz, P. Stable carbon isotopes in tree rings indicate improved water use efficiency and drought responses of a tropical dry forest tree species. Trees 2010, 25, 103–113. [Google Scholar] [CrossRef] [Green Version]
  24. Yu, G.; Zhang, L.-M.; Sun, X.-M.; Fu, Y.-L.; Wen, X.-F.; Wang, Q.-F.; Li, S.-G.; Ren, C.-Y.; Song, X.; Liu, Y.-F.; et al. Environmental controls over carbon exchange of three forest ecosystems in eastern China. Glob. Chang. Biol. 2008, 14, 2555–2571. [Google Scholar] [CrossRef]
  25. IPCC. Climate Change 2013: The Physical Science Basis: Working Group; Cambridge University Press: Cambridge, UK; New York, NY, USA, 2013; Volume 5, ISBN 9781107661820. [Google Scholar]
  26. Álvarez-Miranda, E.; Garcia-Gonzalo, J.; Ulloa-Fierro, F.; Weintraub, A.; Barreiro, S. A multicriteria optimization model for sustainable forest management under climate change uncertainty: An application in Portugal. Eur. J. Oper. Res. 2018, 269, 79–98. [Google Scholar] [CrossRef]
  27. Desai, A.R.; Richardson, A.D.; Moffat, A.M.; Kattge, J.; Hollinger, D.Y.; Barr, A.; Falge, E.; Noormets, A.; Papale, D.; Reichstein, M.; et al. Cross-site evaluation of eddy covariance GPP and RE decomposition techniques. Agric. For. Meteorol. 2008, 148, 821–838. [Google Scholar] [CrossRef]
  28. Mkhabela, M.; Amiro, B.; Barr, A.; Black, T.; Hawthorne, I.; Kidston, J.; McCaughey, J.; Orchansky, A.; Nesic, Z.; Sass, A.; et al. Comparison of carbon dynamics and water use efficiency following fire and harvesting in Canadian boreal forests. Agric. For. Meteorol. 2009, 149, 783–794. [Google Scholar] [CrossRef]
  29. King, J.S.; Albaugh, T.J.; Allen, H.; Kress, L.W. Stand-level allometry in Pinus taeda as affected by irrigation and fertilization. Tree Physiol. 1999, 19, 769–778. [Google Scholar] [CrossRef] [Green Version]
  30. Pregitzer, K.S.; Euskirchen, E.S. Carbon cycling and storage in world forests: Biome patterns related to forest age. Glob. Chang. Biol. 2004, 10, 2052–2077. [Google Scholar] [CrossRef]
  31. Amiro, B.D.; Barr, A.; Black, T.A.; Bracho, R.; Brown, M.; Chen, J.; Clark, K.L.; Davis, K.J.; Desai, A.; Dore, S.; et al. Ecosystem carbon dioxide fluxes after disturbance in forests of North America. J. Geophys. Res. Space Phys. 2010, 115. [Google Scholar] [CrossRef]
  32. Goulden, M.L.; McMillan, A.; Winston, G.C.; Rocha, A.V.; Manies, K.L.; Harden, J.W.; Bond-Lamberty, B. Patterns of NPP, GPP, respiration, and NEP during boreal forest succession. Glob. Chang. Biol. 2011, 17, 855–871. [Google Scholar] [CrossRef] [Green Version]
  33. Walker, L.R.; Wardle, D.; Bardgett, R.D.; Clarkson, B.D. The use of chronosequences in studies of ecological succession and soil development. J. Ecol. 2010, 98, 725–736. [Google Scholar] [CrossRef]
  34. Wilson, K.B.; Baldocchi, D.D. Seasonal and interannual variability of energy fluxes over a broadleaved temperate deciduous forest in North America. Agric. For. Meteorol. 2000, 100, 1–18. [Google Scholar] [CrossRef]
  35. Baldocchi, D.; Falge, E.; Gu, L.; Olson, R.; Hollinger, D.; Running, S.; Anthony, P.; Bernhofer, C.; Davis, K.; Evans, R.; et al. Fluxnet: A New Tool to Study the Temporal and Spatial Variability of ecosystem-scale Carbon Dioxide, Water Vapor, and Energy Flux Densities. Bull. Am. Meteorol. Soc. 2001, 82, 2415–2434. [Google Scholar] [CrossRef]
  36. Lee, J.-E.; Frankenberg, C.; van der Tol, C.; Berry, A.J.; Guanter, L.; Boyce, C.K.; Fisher, J.; Morrow, E.; Worden, J.R.; Asefi, S.; et al. Forest productivity and water stress in Amazonia: Observations from GOSAT chlorophyll fluorescence. Proc. R. Soc. B Boil. Sci. 2013, 280, 20130171. [Google Scholar] [CrossRef] [PubMed] [Green Version]
  37. Aguilos, M.; Sun, G.; Noormets, A.; Domec, J.-C.; McNulty, S.; Gavazzi, M.; Minick, K.; Mitra, B.; Prajapati, P.; Yang, Y.; et al. Effects of land-use change and drought on decadal evapotranspiration and water balance of natural and managed forested wetlands along the southeastern US lower coastal plain. Agric. For. Meteorol. 2021, 303, 108381. [Google Scholar] [CrossRef]
  38. Domec, J.-C.; King, J.S.; Noormets, A.; Treasure, E.; Gavazzi, M.J.; Sun, G.; McNulty, S. Hydraulic redistribution of soil water by roots affects whole-stand evapotranspiration and net ecosystem carbon exchange. New Phytol. 2010, 187, 171–183. [Google Scholar] [CrossRef] [PubMed]
  39. Miao, G.; Noormets, A.; Domec, J.-C.; Fuentes, M.; Trettin, C.C.; Sun, G.; McNulty, S.; King, J.S. Hydrology and microtopography control carbon dynamics in wetlands: Implications in partitioning ecosystem respiration in a coastal plain forested wetland. Agric. For. Meteorol. 2017, 247, 343–355. [Google Scholar] [CrossRef]
  40. Minick, K.J.; Kelley, A.M.; Miao, G.; Li, X.; Noormets, A.; Mitra, B.; King, J.S. Microtopography Alters Hydrology, Phenol Oxidase Activity and Nutrient Availability in Organic Soils of a Coastal Freshwater Forested Wetland. Wetlands 2018, 39, 263–273. [Google Scholar] [CrossRef]
  41. Mitra, B.; Miao, G.; Minick, K.; McNulty, S.G.; Sun, G.; Gavazzi, M.; King, J.S.; Noormets, A. Disentangling the Effects of Temperature, Moisture, and Substrate Availability on Soil CO 2 Efflux. J. Geophys. Res. Biogeosciences 2019, 124, 2060–2075. [Google Scholar] [CrossRef]
  42. Noormets, A.; McNulty, S.; Domec, J.-C.; Gavazzi, M.; Sun, G.; King, J.S. The role of harvest residue in rotation cycle carbon balance in loblolly pine plantations. Respiration partitioning approach. Glob. Chang. Biol. 2012, 18, 3186–3201. [Google Scholar] [CrossRef]
  43. Sun, G.; Noormets, A.; Gavazzi, M.; McNulty, S.; Chen, J.; Domec, J.-C.; King, J.; Amatya, D.; Skaggs, R. Energy and water balance of two contrasting loblolly pine plantations on the lower coastal plain of North Carolina, USA. For. Ecol. Manag. 2010, 259, 1299–1310. [Google Scholar] [CrossRef]
  44. Diggs, J. Simulation of Nitrogen and Hydrology Loading of Forested Fields in Eastern North Carolina Using DRAINMOD-N. II. Masters’ Thesis, North Carolina State University, Raleigh, NC, USA, 2004. [Google Scholar]
  45. Domec, J.-C.; King, J.S.; Ward, E.; Oishi, A.C.; Palmroth, S.; Radecki, A.; Bell, D.; Miao, G.; Gavazzi, M.; Johnson, D.; et al. Conversion of natural forests to managed forest plantations decreases tree resistance to prolonged droughts. For. Ecol. Manag. 2015, 355, 58–71. [Google Scholar] [CrossRef] [Green Version]
  46. Aguilos, M.; Mitra, B.; Noormets, A.; Minick, K.; Prajapati, P.; Gavazzi, M.; Sun, G.; McNulty, S.; Li, X.; Domec, J.-C.; et al. Long-term carbon flux and balance in managed and natural coastal forested wetlands of the Southeastern USA. Agric. For. Meteorol. 2020, 288, 108022. [Google Scholar] [CrossRef]
  47. Domec, J.-C.; Ogee, J.; Noormets, A.; Jouangy, J.; Gavazzi, M.; Treasure, E.; Sun, G.; McNulty, S.G.; King, J.S. Interactive effects of nocturnal transpiration and climate change on the root hydraulic redistribution and carbon and water budgets of southern United States pine plantations. Tree Physiol. 2012, 32, 707–723. [Google Scholar] [CrossRef] [PubMed] [Green Version]
  48. Noormets, A.; Gavazzi, M.J.; McNulty, S.; Domec, J.-C.; Sun, G.; King, J.S.; Chen, J. Response of carbon fluxes to drought in a coastal plain loblolly pine forest. Glob. Chang. Biol. 2009, 16, 272–287. [Google Scholar] [CrossRef]
  49. Sun, G.; Caldwell, P.; Noormets, A.; McNulty, S.G.; Cohen, E.; Myers, J.M.; Domec, J.-C.; Treasure, E.; Mu, Q.; Xiao, J.; et al. Upscaling key ecosystem functions across the conterminous United States by a water-centric ecosystem model. J. Geophys. Res. Space Phys. 2011, 116, 1–16. [Google Scholar] [CrossRef]
  50. Liu, X.; Sun, G.; Mitra, B.; Noormets, A.; Gavazzi, M.J.; Domec, J.-C.; Hallema, D.; Li, J.; Fang, Y.; King, J.S.; et al. Drought and thinning have limited impacts on evapotranspiration in a managed pine plantation on the southeastern United States coastal plain. Agric. For. Meteorol. 2018, 262, 14–23. [Google Scholar] [CrossRef]
  51. Vickers, D.; Mahrt, L. Quality control and flux sampling problems for tower and aircraft data. J. Atmos. Ocean. Technol. 1997, 14, 512–526. [Google Scholar] [CrossRef]
  52. Wilczak, J.M.; Oncley, S.P.; Stage, S.A. Sonic Anemometer Tilt Correction Algorithms. Boundary-Layer Meteorol. 2001, 99, 127–150. [Google Scholar] [CrossRef]
  53. Webb, E.; Pearman, G.R. Correction of flux measurements for density effects due to heat and water vapour transfer. Quart. J. R. Met. Soc. 1980, 106, 85–100. [Google Scholar] [CrossRef]
  54. Ibrom, A.; Dellwik, E.; Flyvbjerg, H.; Jensen, N.O.; Pilegaard, K. Strong low-pass filtering effects on water vapour flux measurements with closed-path eddy correlation systems. Agric. For. Meteorol. 2007, 147, 140–156. [Google Scholar] [CrossRef]
  55. Moncrieff, J.; Clement, R.; Finnigan, J.; Meyers, T. Averaging, Detrending, and Filtering of Eddy Covariance Time Series. In Atmospheric and Oceanographic Sciences Library; Springer Science and Business Media LLC: Berlin/Heidelberg, Germany, 2006; pp. 7–31. [Google Scholar]
  56. Dekker, S.C.; Groenendijk, M.; Booth, B.B.B.; Huntingford, C.; Cox, P.M. Spatial and temporal variations in plant water-use efficiency inferred from tree-ring, eddy covariance and atmospheric observations. Earth Syst. Dyn. 2016, 7, 525–533. [Google Scholar] [CrossRef] [Green Version]
  57. Yang, Y.; Guan, H.; Batelaan, O.; McVicar, T.; Long, D.; Piao, S.; Liang, W.; Liu, B.; Jin, Z.; Simmons, C.T. Contrasting responses of water use efficiency to drought across global terrestrial ecosystems. Sci. Rep. 2016, 6, 23284. [Google Scholar] [CrossRef] [PubMed] [Green Version]
  58. Granier, A.; Bréda, N.; Biron, P.; Villette, S. A lumped water balance model to evaluate duration and intensity of drought constraints in forest stands. Ecol. Model. 1999, 116, 269–283. [Google Scholar] [CrossRef]
  59. von Randow, C.; Zeri, M.; Restrepo-Coupe, N.; Muza, M.N.; de Gonçalves, L.G.G.; Costa, M.H.; Araujo, A.C.; Manzi, A.O.; da Rocha, H.R.; Saleska, S.R.; et al. Inter-annual variability of carbon and water fluxes in Amazonian forest, Cerrado and pasture sites, as simulated by terrestrial biosphere models. Agric. For. Meteorol. 2013, 182–183, 145–155. [Google Scholar] [CrossRef]
  60. Bracho, R.; Powell, T.L.; Dore, S.; Li, J.; Hinkle, C.R.; Drake, B.G. Environmental and biological controls on water and energy exchange in Florida scrub oak and pine flatwoods ecosystems. J. Geophys. Res. Space Phys. 2008, 113, 1–13. [Google Scholar] [CrossRef] [Green Version]
  61. Ford, C.R.; Hubbard, R.; Kloeppel, B.D.; Vose, J.M. A comparison of sap flux-based evapotranspiration estimates with catchment-scale water balance. Agric. For. Meteorol. 2007, 145, 176–185. [Google Scholar] [CrossRef]
  62. Oishi, A.C.; Oren, R.; Novick, K.A.; Palmroth, S.; Katul, G. Interannual Invariability of Forest Evapotranspiration and Its Consequence to Water Flow Downstream. Ecosystems 2010, 13, 421–436. [Google Scholar] [CrossRef]
  63. Rao, L.Y.; Sun, G.; Ford, C.R.; Vose, J.M. Modeling potential Evapotranspiration of two forested watersheds in the Southern Appalachians. Am. Soc. Agric. Biol. Eng. 2011, 54, 2067–2078. [Google Scholar]
  64. Sun, G.; McNulty, S.; Amatya, D.; Skaggs, R.; Swift, L.; Shepard, J.; Riekerk, H. A comparison of the watershed hydrology of coastal forested wetlands and the mountainous uplands in the Southern US. J. Hydrol. 2002, 263, 92–104. [Google Scholar] [CrossRef]
  65. Brümmer, C.; Black, T.A.; Jassal, R.S.; Grant, N.J.; Spittlehouse, D.L.; Chen, B.; Nesic, Z.; Amiro, B.D.; Arain, M.A.; Barr, A.; et al. How climate and vegetation type influence evapotranspiration and water use efficiency in Canadian forest, peatland and grassland ecosystems. Agric. For. Meteorol. 2012, 153, 14–30. [Google Scholar] [CrossRef]
  66. Humphreys, E.; Black, T.; Ethier, G.; Drewitt, G.; Spittlehouse, D.; Jork, E.-M.; Nesic, Z.; Livingston, N. Annual and seasonal variability of sensible and latent heat fluxes above a coastal Douglas-fir forest, British Columbia, Canada. Agric. For. Meteorol. 2003, 115, 109–125. [Google Scholar] [CrossRef]
  67. Li, X.; Fu, H.; Guo, D.; Li, X.; Wan, C. Partitioning soil respiration and assessing the carbon balance in a Setaria italica (L.) Beauv. Cropland on the Loess Plateau, Northern China. Soil Biol. Biochem. 2010, 42, 337–346. [Google Scholar] [CrossRef]
  68. Tang, Y.; Wen, X.; Sun, X.; Zhang, X.; Wang, H. The limiting effect of deep soilwater on evapotranspiration of a subtropical coniferous plantation subjected to seasonal drought. Adv. Atmos. Sci. 2014, 31, 385–395. [Google Scholar] [CrossRef]
  69. Vourlitis, G.L.; Nogueira, J.D.S.; Lobo, F.D.A.; Pinto, O.B. Variations in evapotranspiration and climate for an Amazonian semi-deciduous forest over seasonal, annual, and El Niño cycles. Int. J. Biometeorol. 2015, 59, 217–230. [Google Scholar] [CrossRef] [PubMed]
  70. Domec, J.-C.; Sun, G.; Noormets, A.; Gavazzi, M.J.; Treasure, E.A.; Cohen, E.; Swenson, J.J.; McNulty, S.; King, J.S. A Comparison of Three Methods to Estimate Evapotranspiration in Two Contrasting Loblolly Pine Plantations: Age-Related Changes in Water Use and Drought Sensitivity of Evapotranspiration Components. For. Sci. 2012, 58, 497–512. [Google Scholar] [CrossRef]
  71. Bonal, D.; Ponton, S.; LE Thiec, D.; Richard, B.; Ningre, N.; Herault, B.; Ogee, J.; Gonzalez, S.; Pignal, M.; Sabatier, D.; et al. Leaf functional response to increasing atmospheric CO2 concentrations over the last century in two northern Amazonian tree species: A historical δ13C and δ18O approach using herbarium samples. Plant Cell Environ. 2011, 34, 1332–1344. [Google Scholar] [CrossRef] [PubMed]
  72. Zeri, M.; Sá, L.D.A.; Manzi, A.O.; Araújo, A.C.; Aguiar, R.G.; Von Randow, C.; Sampaio, G.; Cardoso, F.L.; Nobre, C.A. Variability of Carbon and Water Fluxes Following Climate Extremes over a Tropical Forest in Southwestern Amazonia. PLoS ONE 2014, 9, e88130. [Google Scholar] [CrossRef] [Green Version]
  73. Verbeeck, H.; Peylin, P.; Bacour, C.; Bonal, D.; Steppe, K.; Ciais, P. Seasonal patterns of CO2fluxes in Amazon forests: Fusion of eddy covariance data and the ORCHIDEE model. J. Geophys. Res. Space Phys. 2011, 116. [Google Scholar] [CrossRef] [Green Version]
  74. Rowland, L.; Hill, T.C.; Stahl, C.; Siebicke, L.; Burban, B.; Zaragoza-Castells, J.; Ponton, S.; Bonal, D.; Meir, P.; Williams, M. Evidence for strong seasonality in the carbon storage and carbon use efficiency of an Amazonian forest. Glob. Chang. Biol. 2014, 20, 979–991. [Google Scholar] [CrossRef] [Green Version]
  75. Wagner, F.H.; Rossi, V.; Baraloto, C.; Bonal, D.; Stahl, C.; Herault, B. Are Commonly Measured Functional Traits Involved in Tropical Tree Responses to Climate? Int. J. Ecol. 2014, 2014, 1–10. [Google Scholar] [CrossRef] [Green Version]
  76. Restrepo-Coupe, N.; da Rocha, H.R.; Hutyra, L.R.; da Araujo, A.C.; Borma, L.S.; Christoffersen, B.; Cabral, O.M.; de Camargo, P.B.; Cardoso, F.L.; da Costa, A.C.L.; et al. What drives the seasonality of photosynthesis across the Amazon basin? A cross-site analysis of eddy flux tower measurements from the Brasil flux network. Agric. For. Meteorol. 2013, 182–183, 128–144. [Google Scholar] [CrossRef] [Green Version]
  77. Stahl, C.; Burban, B.; Wagner, F.; Goret, J.-Y.; Bompy, F.; Bonal, D. Influence of Seasonal Variations in Soil Water Availability on Gas Exchange of Tropical Canopy Trees. Biotropica 2012, 45, 155–164. [Google Scholar] [CrossRef]
  78. Ryan, M.; Binkley, D.; Fownes, J.H.; Giardina, C.P.; Senock, R.S. An Experimental Test of the Causes of Forest Growth Decline With Stand Age. Ecol. Monogr. 2004, 74, 393–414. [Google Scholar] [CrossRef] [Green Version]
  79. Schwalm, C.R.; Black, T.A.; Morgenstern, K.; Humphreys, E.R. A method for deriving net primary productivity and component respiratory fluxes from tower-based eddy covariance data: A case study using a 17-year data record from a Douglas-fir chronosequence. Glob. Chang. Biol. 2007, 13, 370–385. [Google Scholar] [CrossRef]
  80. Jagodziński, A.M.; Kałucka, I. Age-related changes in leaf area index of young Scots pine stands. Dendrobiology 2008, 59, 57–65. [Google Scholar]
  81. Yang, Y.; Anderson, M.; Gao, F.; Hain, C.; Noormets, A.; Sun, G.; Wynne, R.; Thomas, V.; Sun, L. Investigating impacts of drought and disturbance on evapotranspiration over a forested landscape in North Carolina, USA using high spatiotemporal resolution remotely sensed data. Remote Sens. Environ. 2020, 238, 111018. [Google Scholar] [CrossRef]
  82. Zona, D.; Oechel, W.; Peterson, K.M.; Clements, R.J.; Paw, K.T.; Ustin, S. Characterization of the carbon fluxes of a vegetated drained lake basin chronosequence on the Alaskan Arctic Coastal Plain. Glob. Chang. Biol. 2009, 16, 1870–1882. [Google Scholar] [CrossRef]
  83. McMichael, C.E.; Hope, A.S.; Roberts, D.A.; Anaya, M.R. Post-fire recovery of leaf area index in California chaparral: A remote sensing-chronosequence approach. Int. J. Remote Sens. 2004, 25, 4743–4760. [Google Scholar] [CrossRef]
  84. da Costa, A.C.L.; Rowland, L.; Oliveira, R.S.; Oliveira, A.A.R.; Binks, O.J.; Salmon, Y.; Vasconcelos, S.S.; Junior, J.A.S.; Ferreira, L.V.; Poyatos, R.; et al. Stand dynamics modulate water cycling and mortality risk in droughted tropical forest. Glob. Chang. Biol. 2018, 24, 249–258. [Google Scholar] [CrossRef] [PubMed] [Green Version]
  85. Aguilos, M.; Takagi, K.; Liang, N.; Ueyama, M.; Fukuzawa, K.; Nomura, M.; Kishida, O.; Fukazawa, T.; Takahashi, H.; Kotsuka, C.; et al. Dynamics of ecosystem carbon balance recovering from a clear-cutting in a cool-temperate forest. Agric. For. Meteorol. 2014, 197, 26–39. [Google Scholar] [CrossRef] [Green Version]
  86. Wang, T.; Istanbulluoglu, E.; Lenters, J.; Scott, D. On the role of groundwater and soil texture in the regional water balance: An investigation of the Nebraska Sand Hills, USA. Water Resour. Res. 2009, 45, 1–13. [Google Scholar] [CrossRef] [Green Version]
  87. Milly, P.C.D. Climate, soil water storage, and the average annual water balance. Water Resour. Res. 1994, 30, 2143–2156. [Google Scholar] [CrossRef]
  88. Potter, N.J.; Zhang, L.; Milly, P.C.D.; McMahon, T.; Jakeman, A. Effects of rainfall seasonality and soil moisture capacity on mean annual water balance for Australian catchments. Water Resour. Res. 2005, 41, 1–11. [Google Scholar] [CrossRef] [Green Version]
  89. Budyko, M.I. Climate and Life; Academic Press: New York, NY, USA, 1974. [Google Scholar]
  90. Tor-Ngern, P.; Oren, R.; Palmroth, S.; Novick, K.; Oishi, A.; Linder, S.; Ottosson-Löfvenius, M.; Näsholm, T. Water balance of pine forests: Synthesis of new and published results. Agric. For. Meteorol. 2018, 259, 107–117. [Google Scholar] [CrossRef]
  91. Qiu, L.; Wu, Y.; Yu, M.; Shi, Z.; Yin, X.; Song, Y.; Sun, K. Contributions of vegetation restoration and climate change to spatiotemporal variation in the energy budget in the loess plateau of china. Ecol. Indic. 2021, 127, 107780. [Google Scholar] [CrossRef]
  92. Qiu, L.; Wu, Y.; Shi, Z.; Chen, Y.; Zhao, F. Quantifying the Responses of Evapotranspiration and Its Components to Vegetation Restoration and Climate Change on the Loess Plateau of China. Remote Sens. 2021, 13, 2358. [Google Scholar] [CrossRef]
  93. Duffy, P.B.; Brando, P.; Asner, G.P.; Field, C.B. Projections of future meteorological drought and wet periods in the Amazon. Proc. Natl. Acad. Sci. USA 2015, 112, 13172–13177. [Google Scholar] [CrossRef] [Green Version]
  94. Wagner, F.; Rossi, V.; Stahl, C.; Bonal, D.; Herault, B. Water Availability Is the Main Climate Driver of Neotropical Tree Growth. PLoS ONE 2012, 7, e34074. [Google Scholar] [CrossRef]
  95. Van der Molen, M.K.; Dolman, A.J.; Ciais, P.; Eglin, T.; Gobron, N.; Law, B.E.; Meir, P.; Peters, W.; Phillips, O.L.; Reichstein, M.; et al. Drought and ecosystem carbon cycling. Agric. For. Meteorol. 2011, 151, 765–773. [Google Scholar] [CrossRef]
  96. Allen, C.D.; Macalady, A.K.; Chenchouni, H.; Bachelet, D.; McDowell, N.; Vennetier, M.; Kitzberger, T.; Rigling, A.; Breshears, D.D.; Hogg, E.; et al. A global overview of drought and heat-induced tree mortality reveals emerging climate change risks for forests. For. Ecol. Manag. 2010, 259, 660–684. [Google Scholar] [CrossRef] [Green Version]
  97. Da Rocha, H.R.; Manzi, A.O.; Cabral, O.M.; Miller, S.D.; Goulden, M.; Saleska, S.R.; R.-Coupe, N.; Wofsy, S.C.; Borma, L.S.; Artaxo, P.; et al. Patterns of water and heat flux across a biome gradient from tropical forest to savanna in Brazil. J. Geophys. Res. Space Phys. 2009, 114. [Google Scholar] [CrossRef]
  98. Kim, Y.; Knox, R.G.; Longo, M.; Medvigy, D.; Hutyra, L.R.; Pyle, E.H.; Wofsy, S.C.; Bras, R.L.; Moorcroft, P.R. Seasonal carbon dynamics and water fluxes in an Amazon rainforest. Glob. Chang. Biol. 2012, 18, 1322–1334. [Google Scholar] [CrossRef]
  99. Fisher, R.A.; Williams, M.; Da Costa, A.L.; Malhi, Y.; Da Costa, R.F.; Almeida, S.; Meir, P. The response of an Eastern Amazonian rain forest to drought stress: Results and modelling analyses from a throughfall exclusion experiment. Glob. Chang. Biol. 2007, 13, 2361–2378. [Google Scholar] [CrossRef]
  100. Yu, G.; Song, X.; Wang, Q.; Liu, Y.; Guan, D.; Yan, J.; Sun, X.; Zhang, L.; Wen, X. Water-use efficiency of forest ecosystems in eastern China and its relations to climatic variables. New Phytol. 2008, 177, 927–937. [Google Scholar] [CrossRef]
  101. Maréchaux, I.; Bonal, D.; Bartlett, M.K.; Burban, B.; Coste, S.; Courtois, E.A.; Dulormne, M.; Goret, J.-Y.; Mira, E.; Mirabel, A.; et al. Dry-season decline in tree sapflux is correlated with leaf turgor loss point in a tropical rainforest. Funct. Ecol. 2018, 32, 2285–2297. [Google Scholar] [CrossRef]
  102. Chaves, M.M.; Marôco, J.; Pereira, J. Understanding plant responses to drought—From genes to the whole plant. Funct. Plant Biol. 2003, 30, 239–264. [Google Scholar] [CrossRef]
Figure 1. Map showing the location of YP and MP flux towers established in North Carolina, USA.
Forests 12 01123 g001
Figure 2. Interannual and seasonal trends in climate variables along the chronosequence sites (YP and MP). Different color lines indicate stand age. Different color circles represent monthly data each year.
Forests 12 01123 g002
Figure 3. Inter-annual variation in (a) evapotranspiration (ET), (b) gross primary productivity (GPP), and (c) water use efficiency (WUE) at different ages of the chronosequence (YP and MP). Monthly data were used in the analysis.
Forests 12 01123 g003
Figure 4. Seasonal trend in (a) evapotranspiration (ET), (b) gross primary productivity (GPP), and (c) water use efficiency (WUE) across different age levels of the chronosequence sites (YP and MP) based on monthly smoothed values for each year. Each year was assigned with different color. Smooth curve is represented by colored line and colored circles represent monthly data for each year.
Forests 12 01123 g004
Figure 5. Regression curves between stand age and (a) evapotranspiration (ET), (b) gross primary productivity (GPP), and (c) water use efficiency (WUE) at YP and MP. Annual ET, GPP, and WUE were represented by circles colored according to site.
Forests 12 01123 g005
Figure 6. Panel (a) is the relationship between evapotranspiration (ET) and gross primary productivity (GPP) across all years in YP and MP with season as a factor. Panel (b) is the ET–GPP relationships across the entire period with site as a factor. Each circle indicates the monthly ET and GPP colors according to month (panel a) and site (panel b). The color line indicates the regression line.
Forests 12 01123 g006
Figure 7. Relationship of clustered air temperature and net radiation (low, medium, high) and water table depth (shallow, medium, deep) on (ac) evapotranspiration (ET), (df) gross primary productivity (GPP), and (gi) water use efficiency (WUE) across all years at YP and MP combined. Each circle indicates the monthly ET, GPP, and WUE colors according to the cluster for each variable. The color line indicates the regression line for each cluster variable.
Forests 12 01123 g007
Figure 8. Daily average evapotranspiration (ET), gross primary productivity (GPP), and water use efficiency (WUE) at YP and MP. Daily values during the growing season (April–September) were averaged during 2007 and 2008 (drought years) and the rest of the years (non-drought years). Colored bars represent the drought and non-drought periods.
Forests 12 01123 g008
Publisher’s Note: MDPI stays neutral with regard to jurisdictional claims in published maps and institutional affiliations.

