Article

Habitat-Related Differences in Winter Presence and Spring–Summer Activity of Roe Deer in Warsaw

1
Department of Forest Zoology and Wildlife Management, Institute of Forest Sciences, Warsaw University of Life Sciences, Nowoursynowska 159, 02-776 Warsaw, Poland
2
Central Laboratory for Environmental Analysis—CentLab, Institute of Environmental Protection—National Research Institute, Krucza 5/11D, 00-548 Warsaw, Poland
3
Department of Forest Ecology, Forest Research Institute, Sękocin Stary, Braci Leśnej 3, 05-090 Raszyn, Poland
4
Department of Forest Management Planning, Dendrometry and Forest Economics, Institute of Forest Sciences, Warsaw University of Life Sciences—SGGW, Nowoursynowska 159, 02-776 Warsaw, Poland
*
Author to whom correspondence should be addressed.
Submission received: 28 June 2021 / Revised: 16 July 2021 / Accepted: 19 July 2021 / Published: 22 July 2021

Abstract

:
Preliminary research conducted in Warsaw in the 1970s and 2000s showed that roe deer (Capreolus capreolus) stayed in forest habitat and avoided anthropogenic areas. Activity and exploration patterns of animals are shaped by indices of anthropogenic disturbances, elevated in large cities. The aims of the study were (1) to compare the presence of roe deer in natural and anthropogenic habitats of Warsaw during three periods: 1976–1978, 2005–2008 and 2017–2021, based on snow tracking on transect routes (681.2 km in total), and (2) to describe the presence and activity of roe deer in relation to human disturbances in selected urban forests in its reproductive period (March–August), based on camera trap survey (2019–2020, 859 observations, 5317 trap-days in total). The number of tracks was higher in natural habitat during all three periods, with the highest value in 2017–2021 (9.85/km/24 h). The peak of roe deer activity was recorded at dusk, and it changed with moon phases between spring and summer. Landscape connectivity and level of light pollution did not affect the activity pattern of roe deer. Our research showed that roe deer inhabiting urban areas avoided human presence by using well-covered habitats and being active in periods when the level of human disturbance was lower.

1. Introduction

Urbanization is considered a global threat to biodiversity [1]. The development of urban areas has increased worldwide over the last 30 years, and is expected to triple between 2000 and 2030, with an increase of world urban population to nearly 5 billion by that time [2]. Urban areas are characterized by high human density, large areas of impervious surfaces and built infrastructure [1,3,4,5,6]. That causes profound and ongoing changes in environment, i.e., abiotic environmental conditions (e.g., pollution) and to landscape structure [7]. Urban-associated landscape changes result mainly in habitat loss, fragmentation and reduced size and connectivity of landscape patches [8,9,10,11,12]. By limiting the movement of most species, the richness of biodiversity declines in the dense core of built-up urban areas [13].
In the present world, areas of undisturbed wilderness are rapidly decreasing, compelling wild mammals to integrate into urban environments. In recent decades, the number of studies on wildlife functioning in urban areas has rapidly increased, most of them concerning mesopredators (e.g., red fox Vulpes vulpes, badger Meles meles, stone marten Martes foina) [14,15,16,17], rather than ungulates (with the exception of wild boar Sus scrofa) [18]. Some research showed that human presence and activities accumulating in urban areas result in disturbances perceived by animals as analogous to the presence of natural predators [19,20,21], or can even exceed the effect of predation risk [22]. To deal with anthropogenic stressors, animals may shift their activity to more sheltered habitats, darker nights or become more nocturnal [23,24]. On the other hand, some of the papers showed that animals maintain their natural rhythms [25].
One of the most numerous ungulates in Poland is the roe deer Capreolus capreolus, whose population increased extensively in recent decades [26]. Roe deer, like other ungulates, inhabits mainly woodland and open habitats, often utilizing the ecotone between forests and agricultural areas [27,28,29]. However due to overabundant population in natural habitats, roe deer can inhabit suboptimal, human-transformed landscape [30,31]. Roe deer has recently been observed in urban areas, inhabiting mainly suburbs [31,32], where higher share of well-covered habitats enables roe deer to hide from human and human-related predators, i.e., dogs (Canis familiaris) [8].
Snow tracking conducted in Warsaw in the 1970s showed the presence of roe deer only in urban forests, especially in peripheral zones of the city, while the snow tracking data from the 2000s showed incidental presence of roe deer in anthropogenic habitat (urban parks), closer to the city center (Goszczyński J., unpubl. data). This suggests a possible gradual increase of roe deer in suboptimal, human-modified habitats, despite high sensitivity to human disturbances. Therefore, the aims of the research were (1) to compare the presence and abundance of roe deer in natural and anthropogenic habitats, based on historical (Goszczyński J., unpubl. data) and present snow tracking data collected along transect routes in various habitats in Warsaw; and (2) to describe changes in the presence and activity of roe deer in relation to human disturbances in selected urban forests, as the most often selected habitat. We hypothesized that in the last few years the abundance of roe deer in the anthropogenic habitat has increased. Nevertheless, urban forests remain the main habitat for roe deer, so with high level of human disturbances in urban forests, roe deer will have to adapt behaviorally to avoid contact with human and human-related predators. This will be shown by (1) observing higher daily activities at nights because human activity is then lowest, (2) higher activity patterns during dark nights compared to bright nights using moon phases and (3) observing a lower frequency of occurrence in forest complexes with higher level of light pollution.

2. Materials and Methods
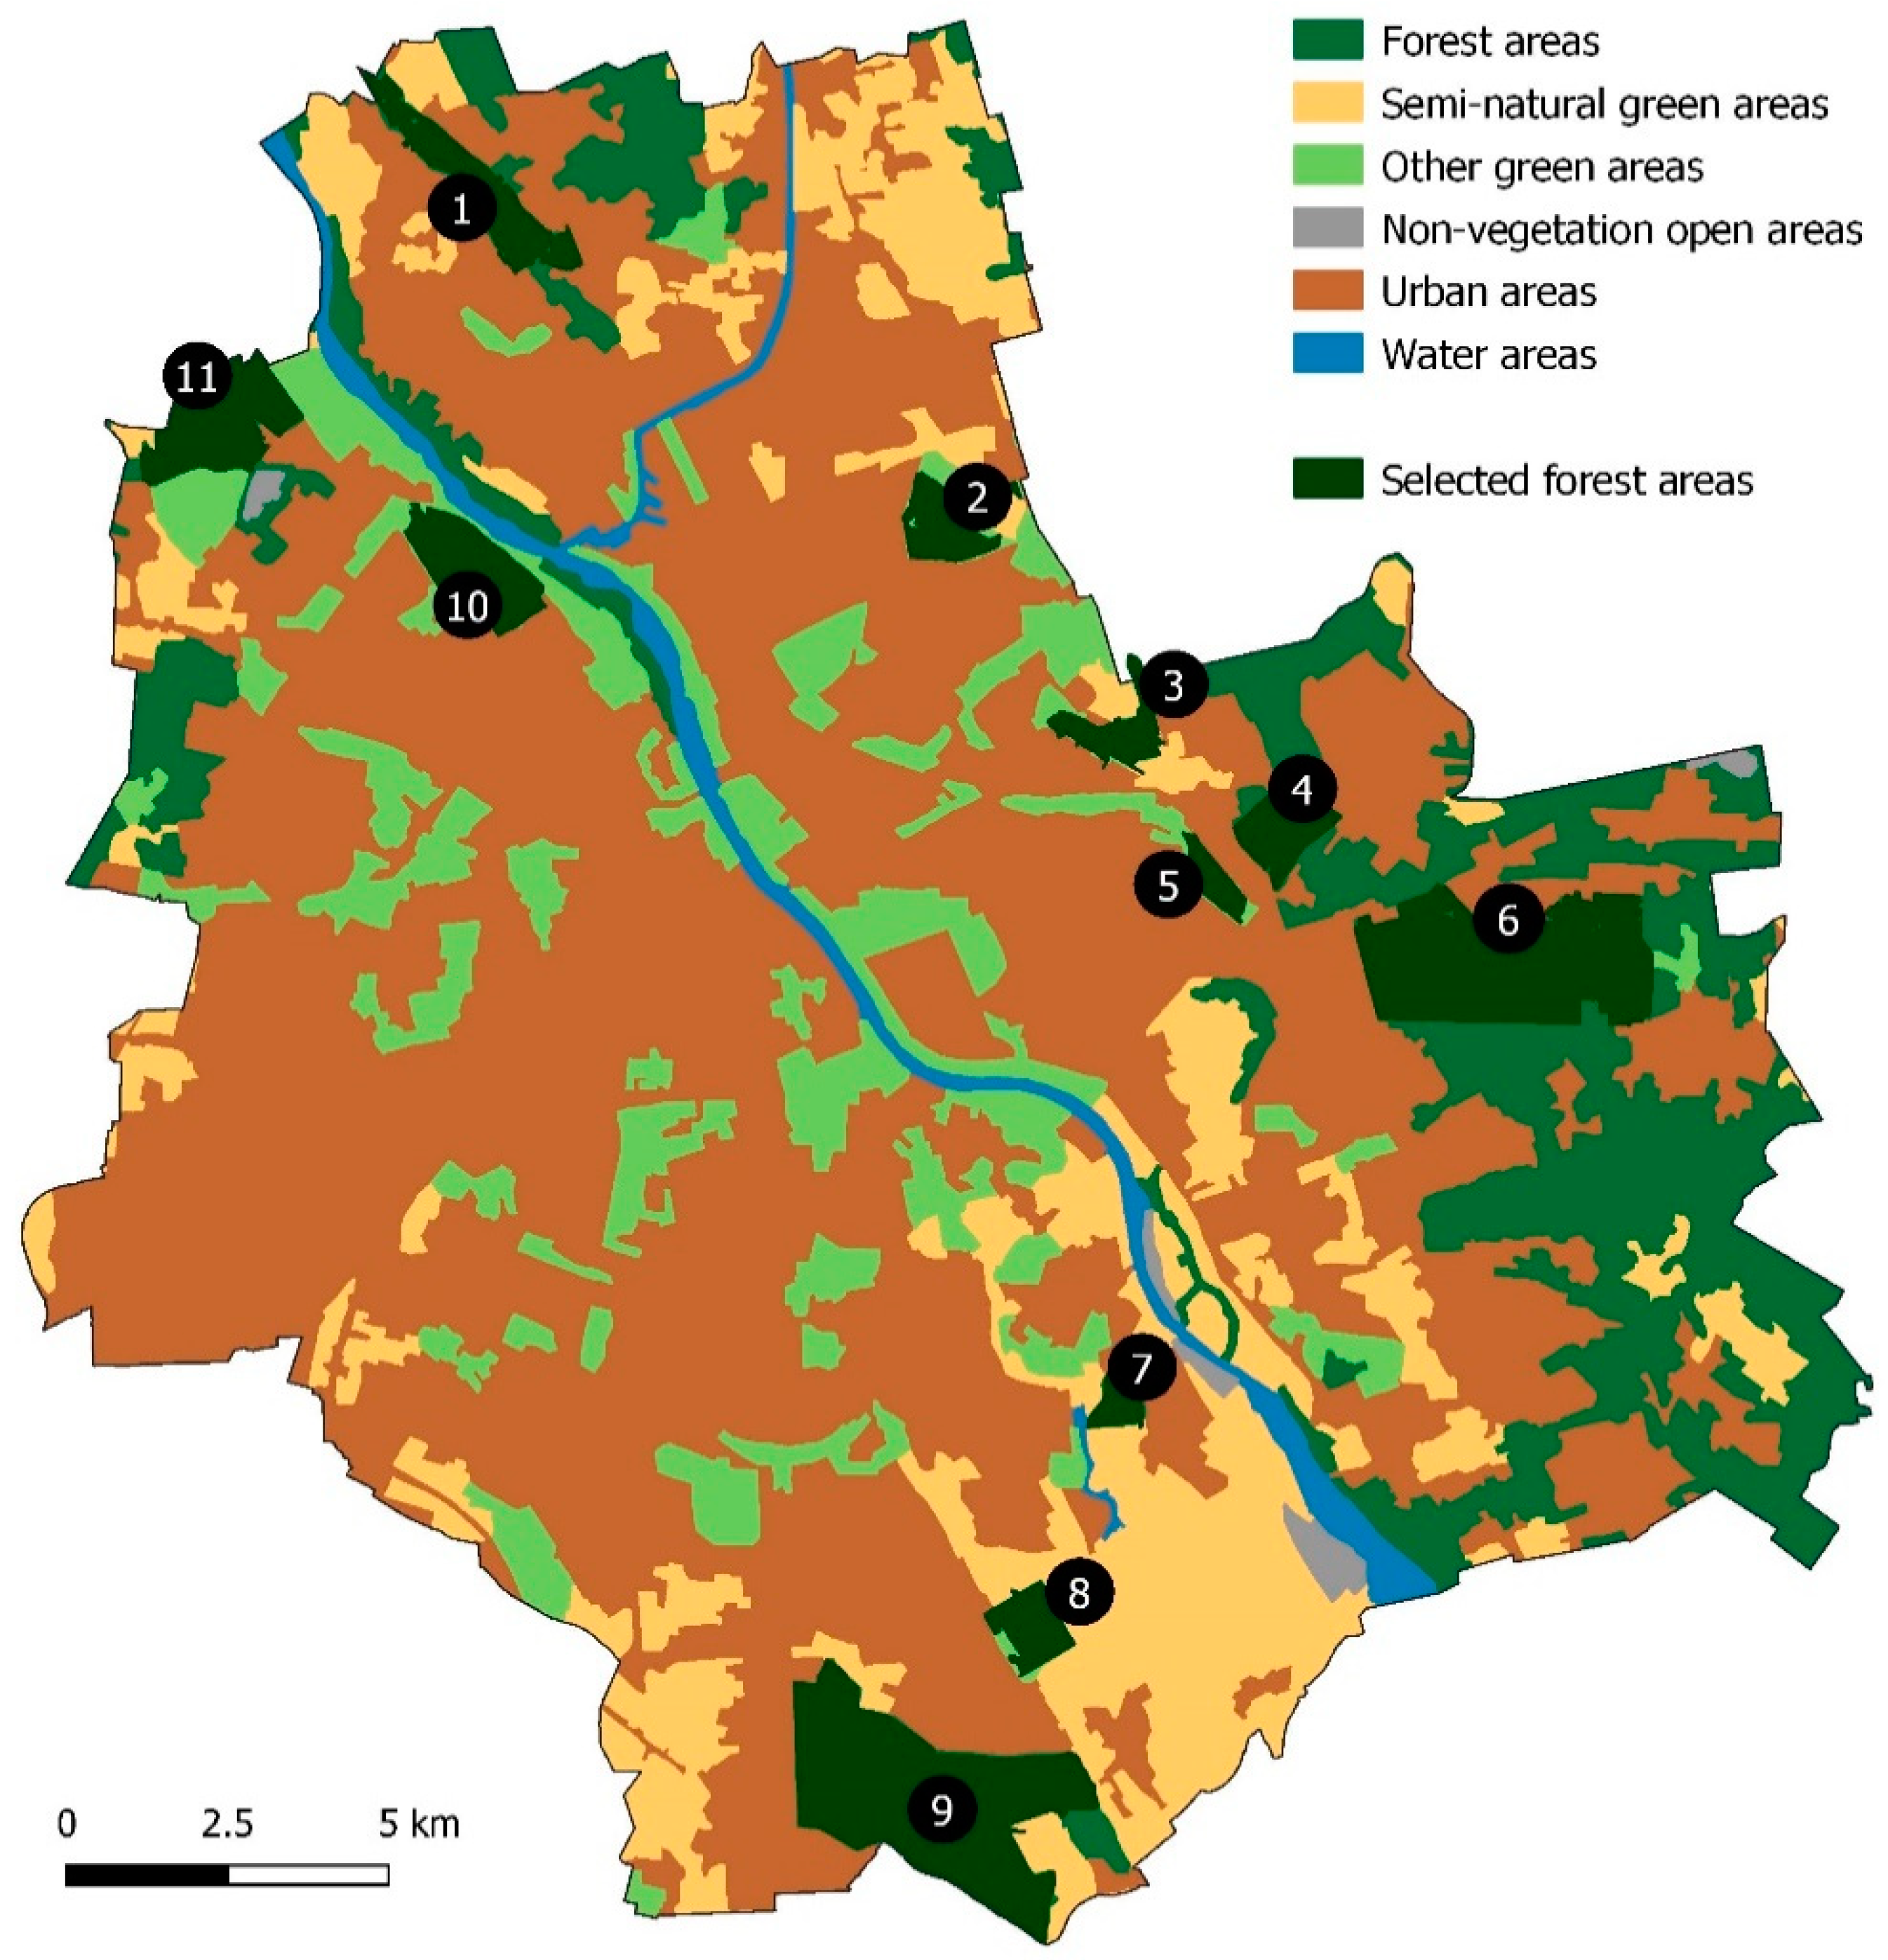
2.1. Study Area

Warsaw (52°13′47″ N, 21°00′42″ E), the capital of Poland, is the largest (517 km2) and most populous (3437 inhabitants/km2) city in the country [33]. It is situated at an altitude of 113 m above sea level in a temperate zone, with an annual rainfall of about 500 mm and an average temperature of 7.7 °C [34]. The Vistula River flows throughout Warsaw and divides city into two parts. Warsaw is characterized by a high proportion of green areas [33,35]: urban forests, parks, botanical and zoological gardens, squares, cemeteries, allotments, home gardens, residential and roadside vegetation, and natural riparian forests (Nature 2000 protected). Urban forests constitute ca. 15% of the city area. Urban forests are located mainly in peripheral districts of the city.

2.2. Data Collection

We used present and historical snow tracking data on transect routes to describe the temporal changes in the roe deer abundance in different habitats in Warsaw. Snow tracking was conducted during three different periods: (1) 1976–1978 (two winter seasons) done by Professor J. Goszczyński (unpubl. data), (2) 2005–2008 (three winter seasons) and (3) 2017–2021 (four winter seasons). Snow tracking was conducted in winter months (December to February) when the snow cover depth exceeded 1 cm. The number of tracks was noted per 100 m of tracking route. Snow footprints were easily trampled in areas with high dog and human activity, so we started snow tracking as early as 12 h after the snowfall (but only if it stopped snowing in the afternoon at the latest). Simultaneously, snow tracking was done up to two days after snowfall in areas less penetrated by humans. In all cases, the number of snow registered tracks was recalculated per 24 h after a snowfall.
Tracking routes were distributed randomly throughout Warsaw, in different types of habitats (e.g., forests, agriculture areas, urban parks and cemeteries, built-up areas). The length of transect routes differed between habitats. For further calculations we distinguished only between two types of habitats—natural (forests and open areas) and anthropogenic (urban area, other green areas: e.g., cemeteries, parks). In total, 681.2 km of snow tracking on transect routes was done (Table 1). Results of snow tracking allowed for showing the relative index of abundance of roe deer in natural and anthropogenic habitats in Warsaw, defined as number of tracks/1 km of transect routes/24 h.
To determine the activity patterns of roe deer, we used camera traps set randomly in selected urban forests (Figure 1) in spring and summer of 2019 and 2020, assuming that urban forests are the main habitat of roe deer. Moreover, setting camera traps in open areas, urban parks and cemeteries, or built-up areas may result in their theft or damage.
Camera traps were located in eleven different forest areas, six on the northeastern side of Warsaw (on the right bank of the Vistula River) (Henryków and Dąbrówka Forest Park, Bródno Forest Park, Utrata Forest, Sobieski Forest, Olszynka Grochowska Nature Reserve and Kawęczyn Nature Reserve), and five on the west bank of Vistula River (Młociny Forest, Bielany Forest, Morysin Nature Reserve, Natolin Forest Nature Reserve, Kabaty Forest Nature Reserve). The forest complexes investigated differed in size (45–917 ha) (Table A1). During the exposition period, the camera trap was regularly inspected at 1–1.5 month intervals. During the inspection, the batteries and memory card were changed, and the camera trap locations were changed to minimize the risk of recording the same individuals.
We used several types of camera traps (Reconyx HyperFire: PC90, PC800, PC850, PC900, RECONYX, Inc., Holmen, WI, USA; Ltl Acorn 6210 MC, Zhuhai Ltl Acorn Electronics Co., Ltd., Zhuhai, Guangdong, China; Browning Spec Ops Advantage, Browning Trail Cameras, Morgan, UT, USA) that differed slightly in the way of records acquisition. Reconyx camera traps took a series of three photos, at one-second interval, while Acorn and Browning devices took a single photo at one-second interval. The camera traps were set on trees, 30 cm above the ground to register adult and juvenile individuals of roe deer. We did not use any attractant to lure animals.
Camera traps were set in 27 (2019) and 34 (2020) locations in February and disassembled mostly late summer/early autumn. For the analysis, we used data from March to August, i.e., roe deer reproductive period (as defined by implantation in females, antler growth through roe bucks territorialism to rut) [37]. In total, data for 5317 camera trap-days were collected.
We recorded each roe deer appearing in the images without distinguishing between individuals. A new observation was considered if a minimum of 15 min elapsed between subsequent photos or series of photos showing an animal/animals. This rule was abandoned only when an animal in the photo was different in age, sex, body condition and antler development, indicating clearly that the animal in the photo was a different individual than the one previously registered. A group of different individuals appearing in one picture or a series of pictures was also recorded as a single observation. Camera traps recorded date of the observation, time (24 h record) in Central European Time (CET), and a moon phase.
We analyzed activity of roe deer in months, seasons (spring: March–May, summer: June–August) and within the 24 h period. We used the time of sunrise and sunset for Warsaw in the years 2019–2020 [38] converted to CET and defined diurnal period as the time between sunrise and sunset, and night as the time between 1 h after sunset and 1 h before sunrise. We defined the crepuscular periods as one hour before sunrise (dawn) and one hour after sunset (dusk) [39]. We analyzed the activity of roe deer in eight moon phases: new moon, waxing crescent, first quarter, waxing gibbous, full moon, waning gibbous, last quarter and waning crescent. As the moonlight may influence the behavior of prey species, we divided moon phases into dark (new moon, waning crescent, waxing crescent) and bright nights (full moon, waning gibbous, waxing gibbous). The activity of roe deer in moon phases and in dark and bright nights was analyzed for nocturnal period (time of a day when there was no sunlight: dawn, dusk and night) [40].
Finally, we analyzed the impact of human disturbances, defined as light pollution and landscape fragmentation, on roe deer frequency of occurrence (defined as N observations per 100 camera trap days for a given forest complex) in urban forests under study. To investigate influence of human disturbances on roe deer occurrence, we adopted level of light pollution based on Visible Infrared Imaging Radiometer Suite (VIIRS) after [41] for localization of each camera trap and averaged the values for each forest complex (Table A2). We assumed that landscape connectivity is provided by green spaces in the city: wooded areas, shrubs and green open spaces (arable lands and remaining green spaces). Therefore, we analyzed the level of isolation of urban forests under study. We set a 250 m buffer zone around each forest, in which the shares of forest areas, semi-natural green areas (arable land, pastures, heterogeneous agricultural areas, shrub and/or herbaceous associations), other green areas (artificial, non-agricultural vegetated areas, permanent crops), non-vegetation open areas (open spaces with little or no vegetation, mine, dump and construction sites), urban areas (urban fabric, industrial, commercial and transport units) and waters (water bodies) were calculated (Table A3). The information and data on topographic objects were taken from CORINE Land Cover published in 2021 [36], which presented the biophysical characteristic of Earth [42]. All maps and GIS analyses were carried out in QGIS v3.10.

2.3. Statistical Analysis

All data processing, calculations and statistical analyses were performed in MS Excel spreadsheet and PAST4.03 software [43]. For observed relationships and differences, we assumed p = 0.05 as their significance level. Prior to the analysis, distribution of the given variable was tested for its normality with the Shapiro–Wilk test.
Density of roe deer tracks was compared using Kruskal–Wallis test followed by U Mann–Whitney post hoc comparisons. Distributions of number of roe deer observations in subsequent months in March–August period or in seasons (spring: March–May, summer: June–August) were compared using the chi-square test. The same procedure was applied for frequency of occurrence of roe deer in parts of the day or during the moon phases. To compare the activity of roe deer during the day, we calculated mean occurrence per hour of a given part of a day.
Mean number of observations of roe deer per 100 trap-days calculated for each forest complex was correlated with light pollution and share of forest areas, other green areas, other open areas, semi-natural green areas, urban areas and water in 250 m buffer zones around a given forest complex. For those analyses, Pearson correlation coefficient was used.

3. Results

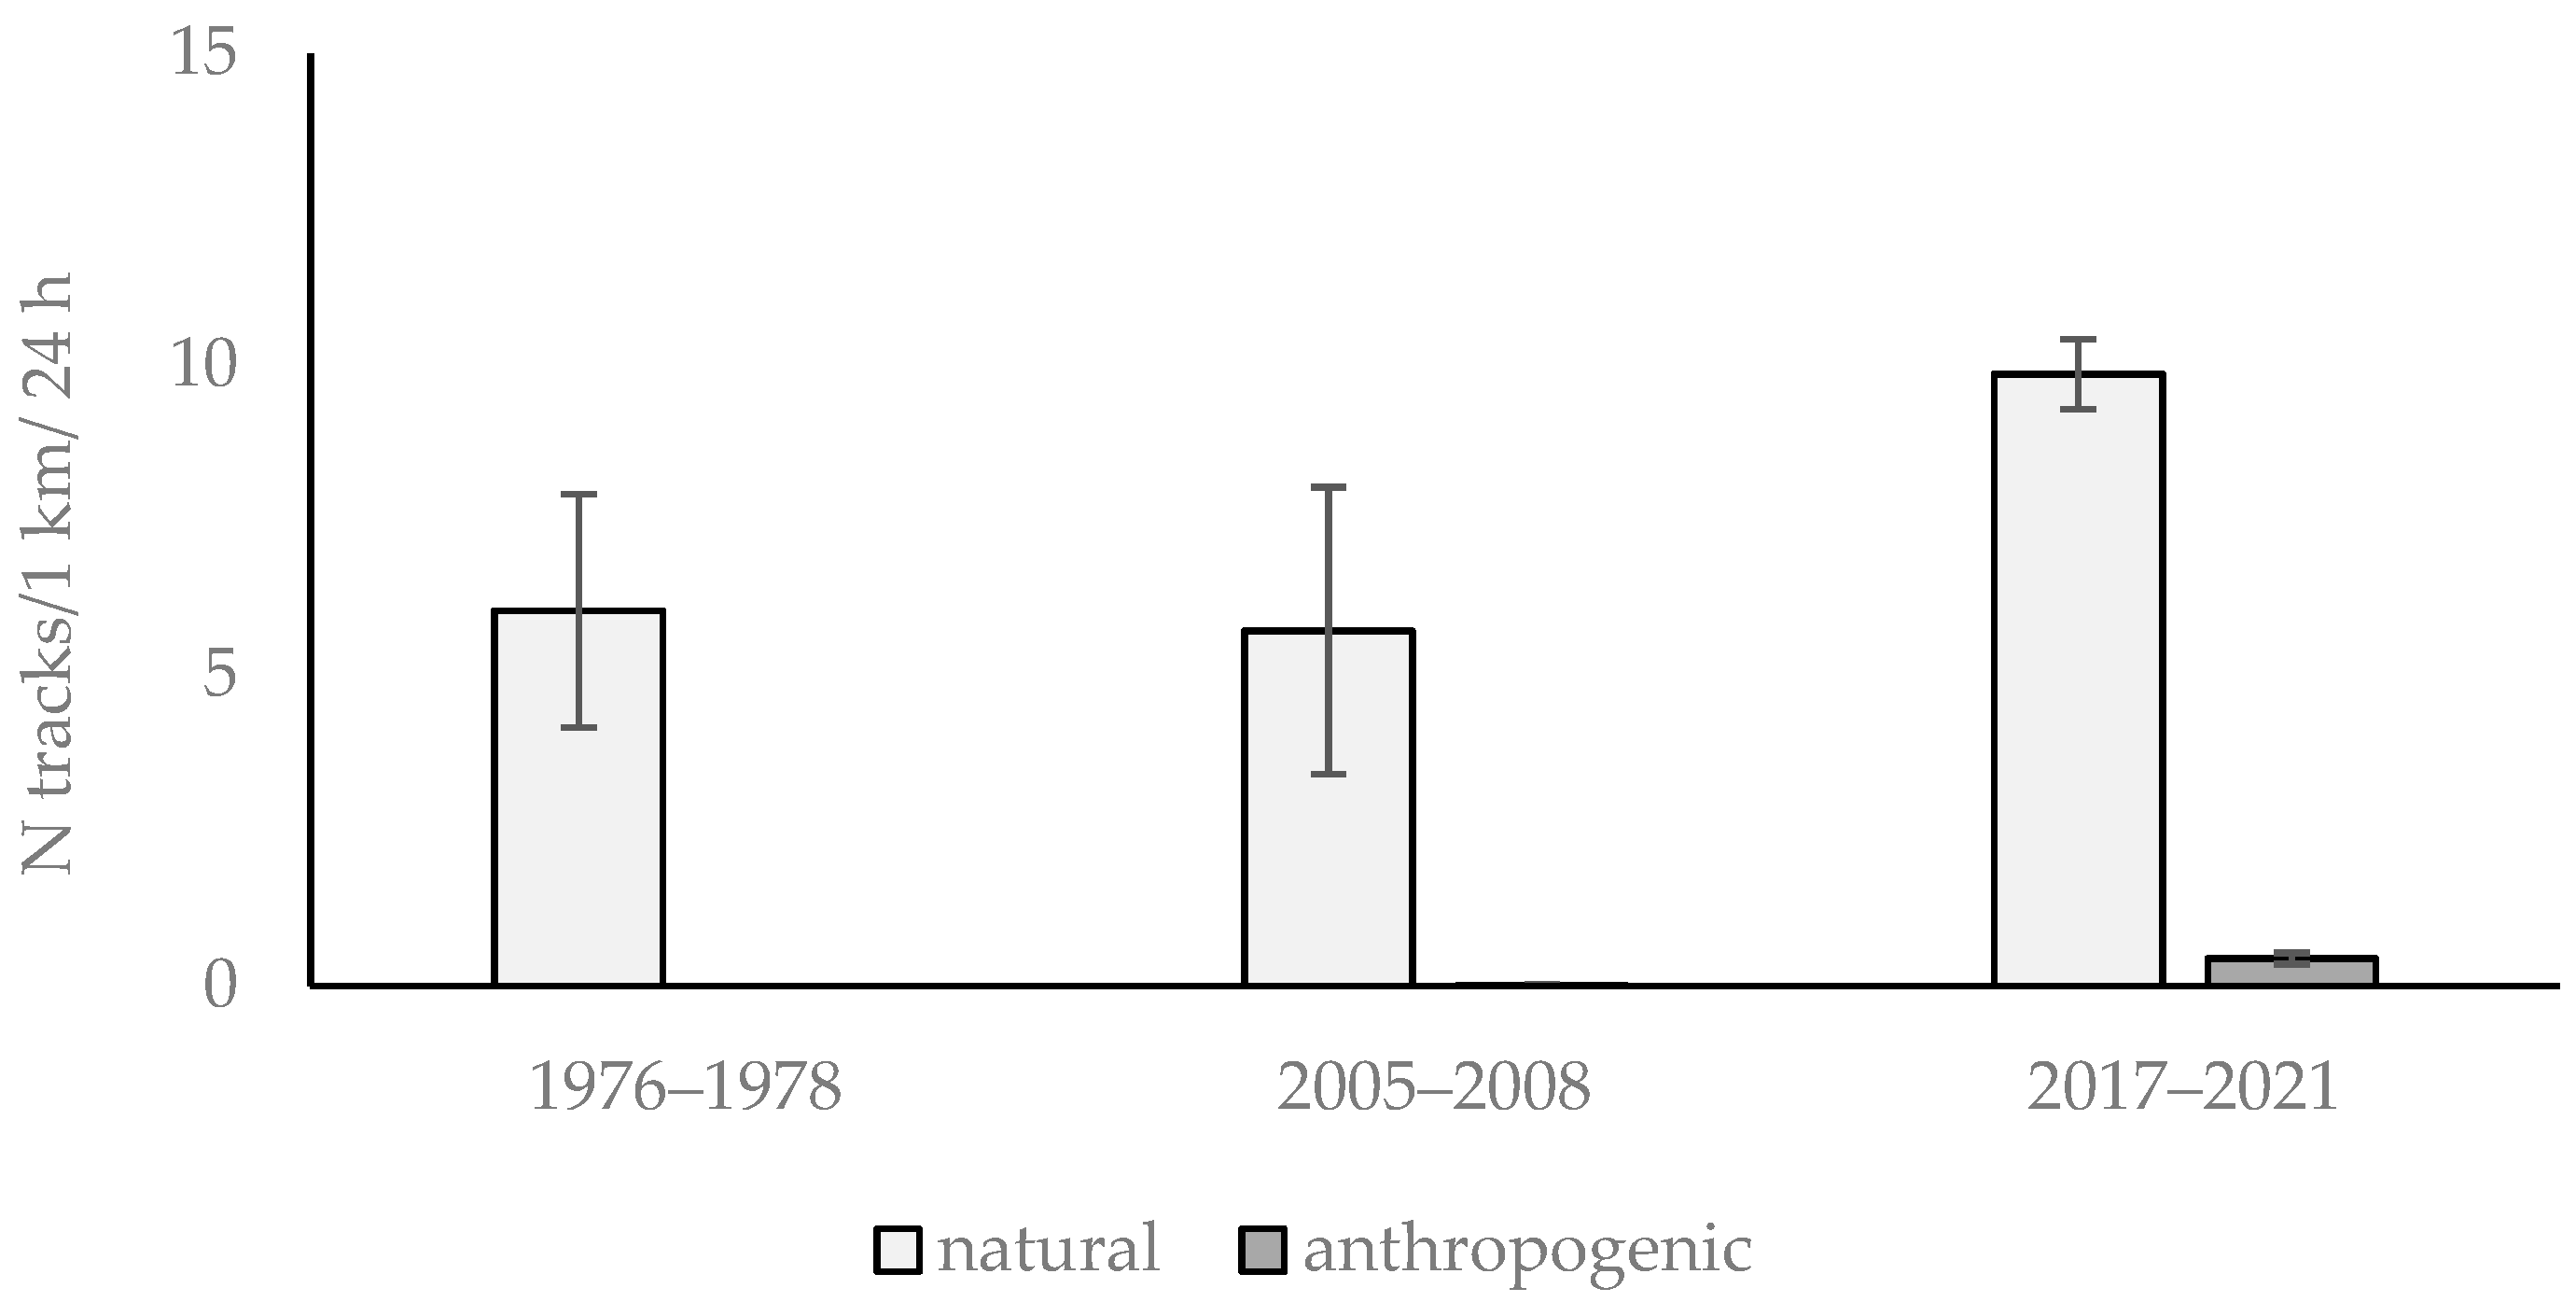
3.1. Abundance of Roe Deer in Different Habitats of Warsaw Using Snow Tracking Data

The highest density of roe deer tracks (9.85/km/24 h) was recorded in natural habitats in the third period of research (2017–2021), while no roe deer were observed in anthropogenic habitat in the first period (1976–1978) (Figure 2). In general, natural habitats were characterized by a significantly higher density of roe deer tracks (U= 1,541,653, p < 0.001) for all analyzed periods. Various periods were characterized by significantly different roe deer abundance (H = 32.39, p < 0.001). Significant differences were found between the density of roe deer tracks in 1976–1978 and 2005–2008 (U = 633,900, p < 0.001) and between 2005–2008 and 2017–2021 (U = 16,600, p < 0.001).

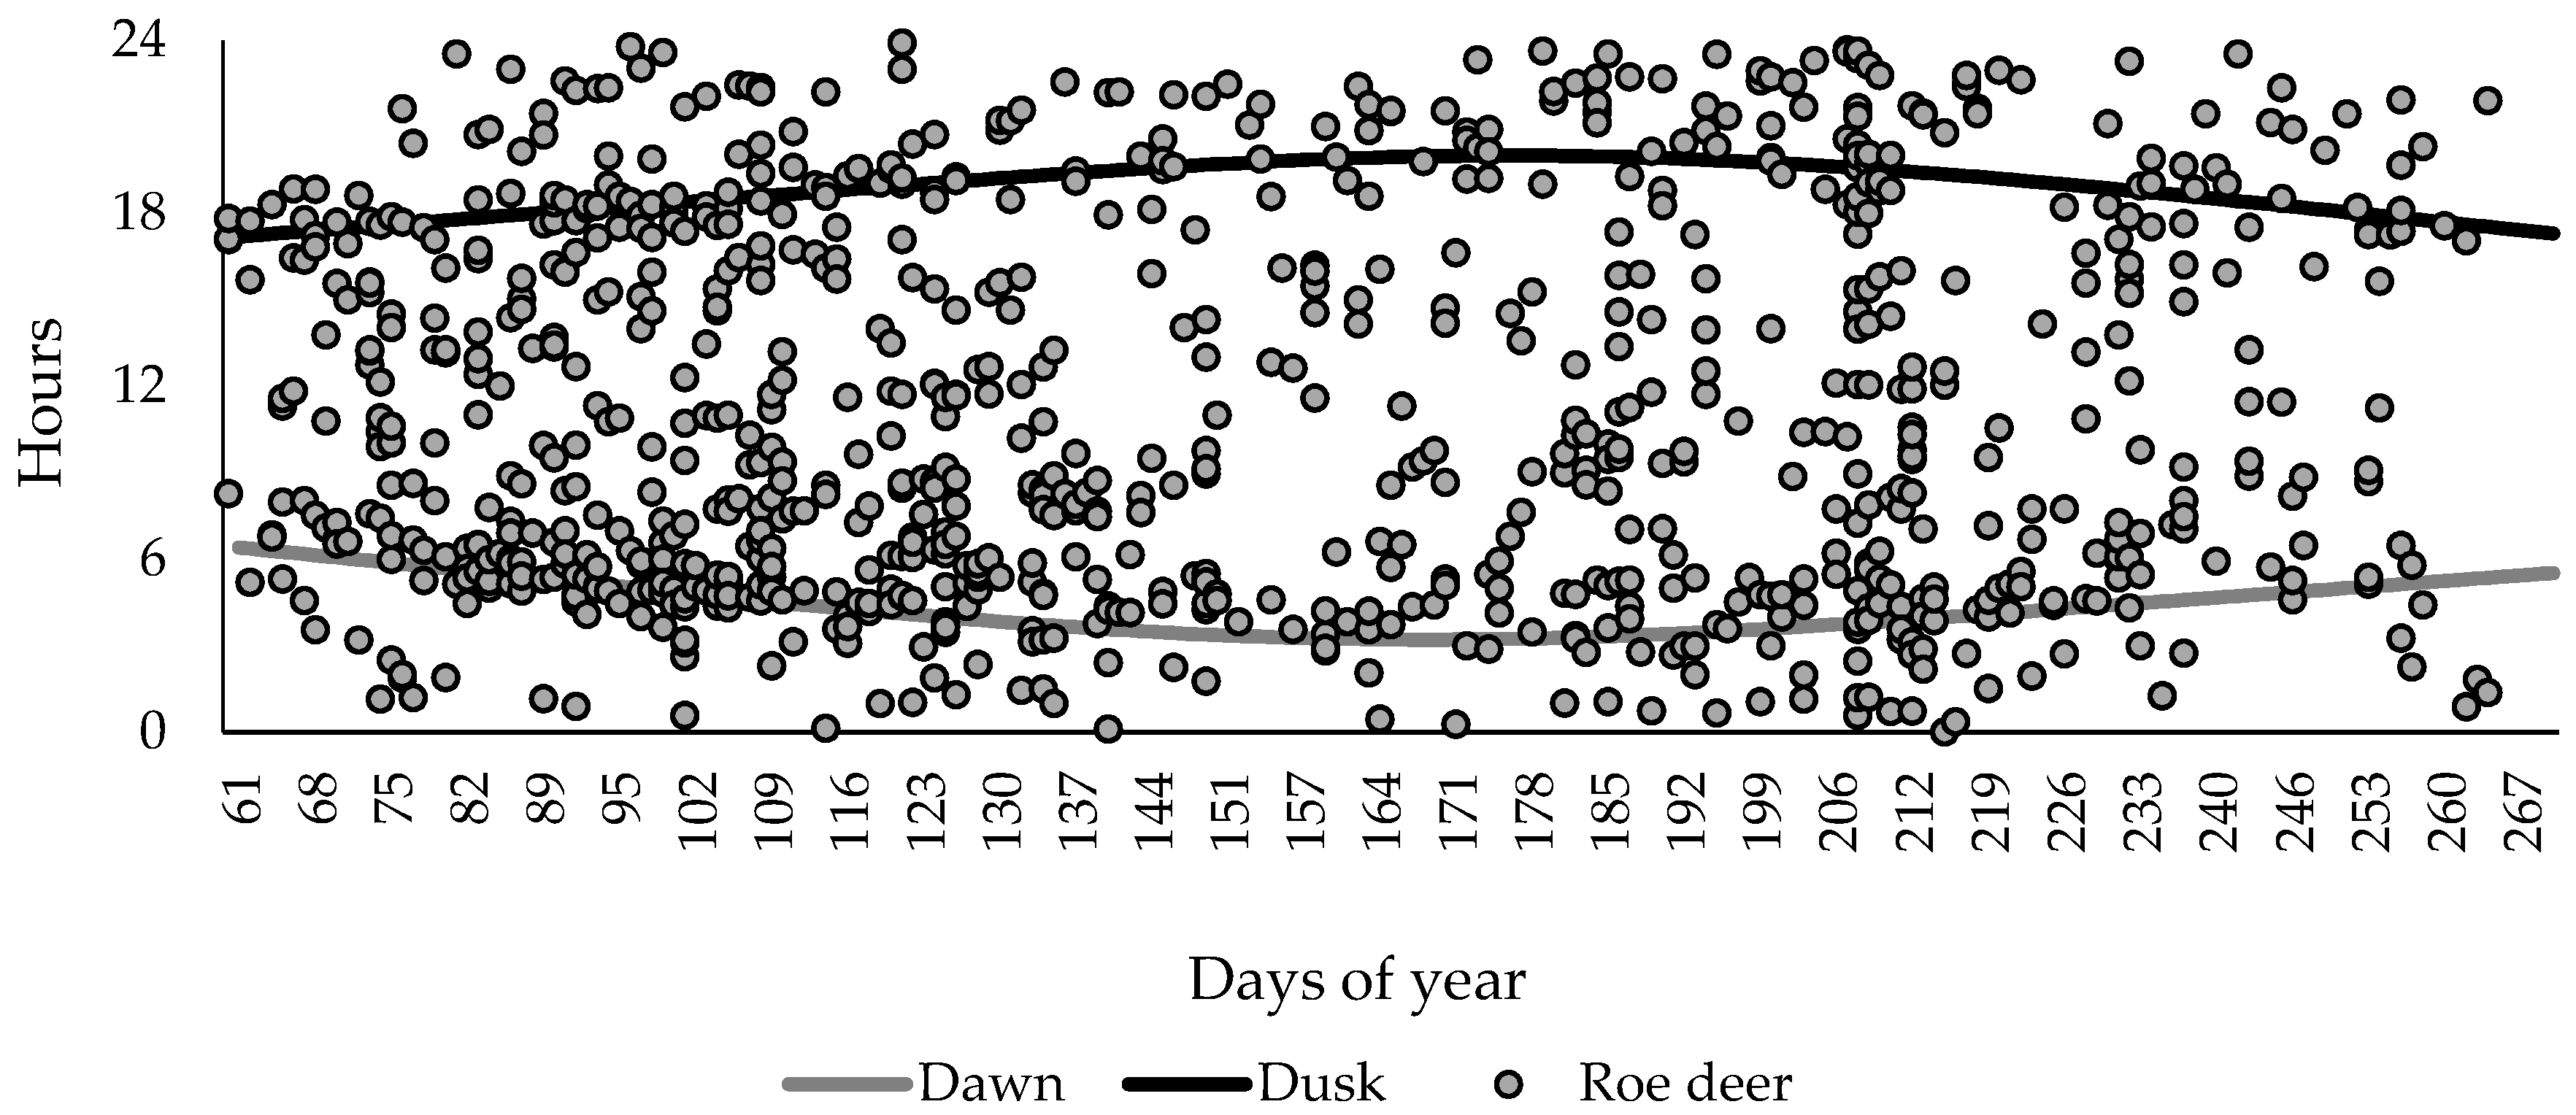
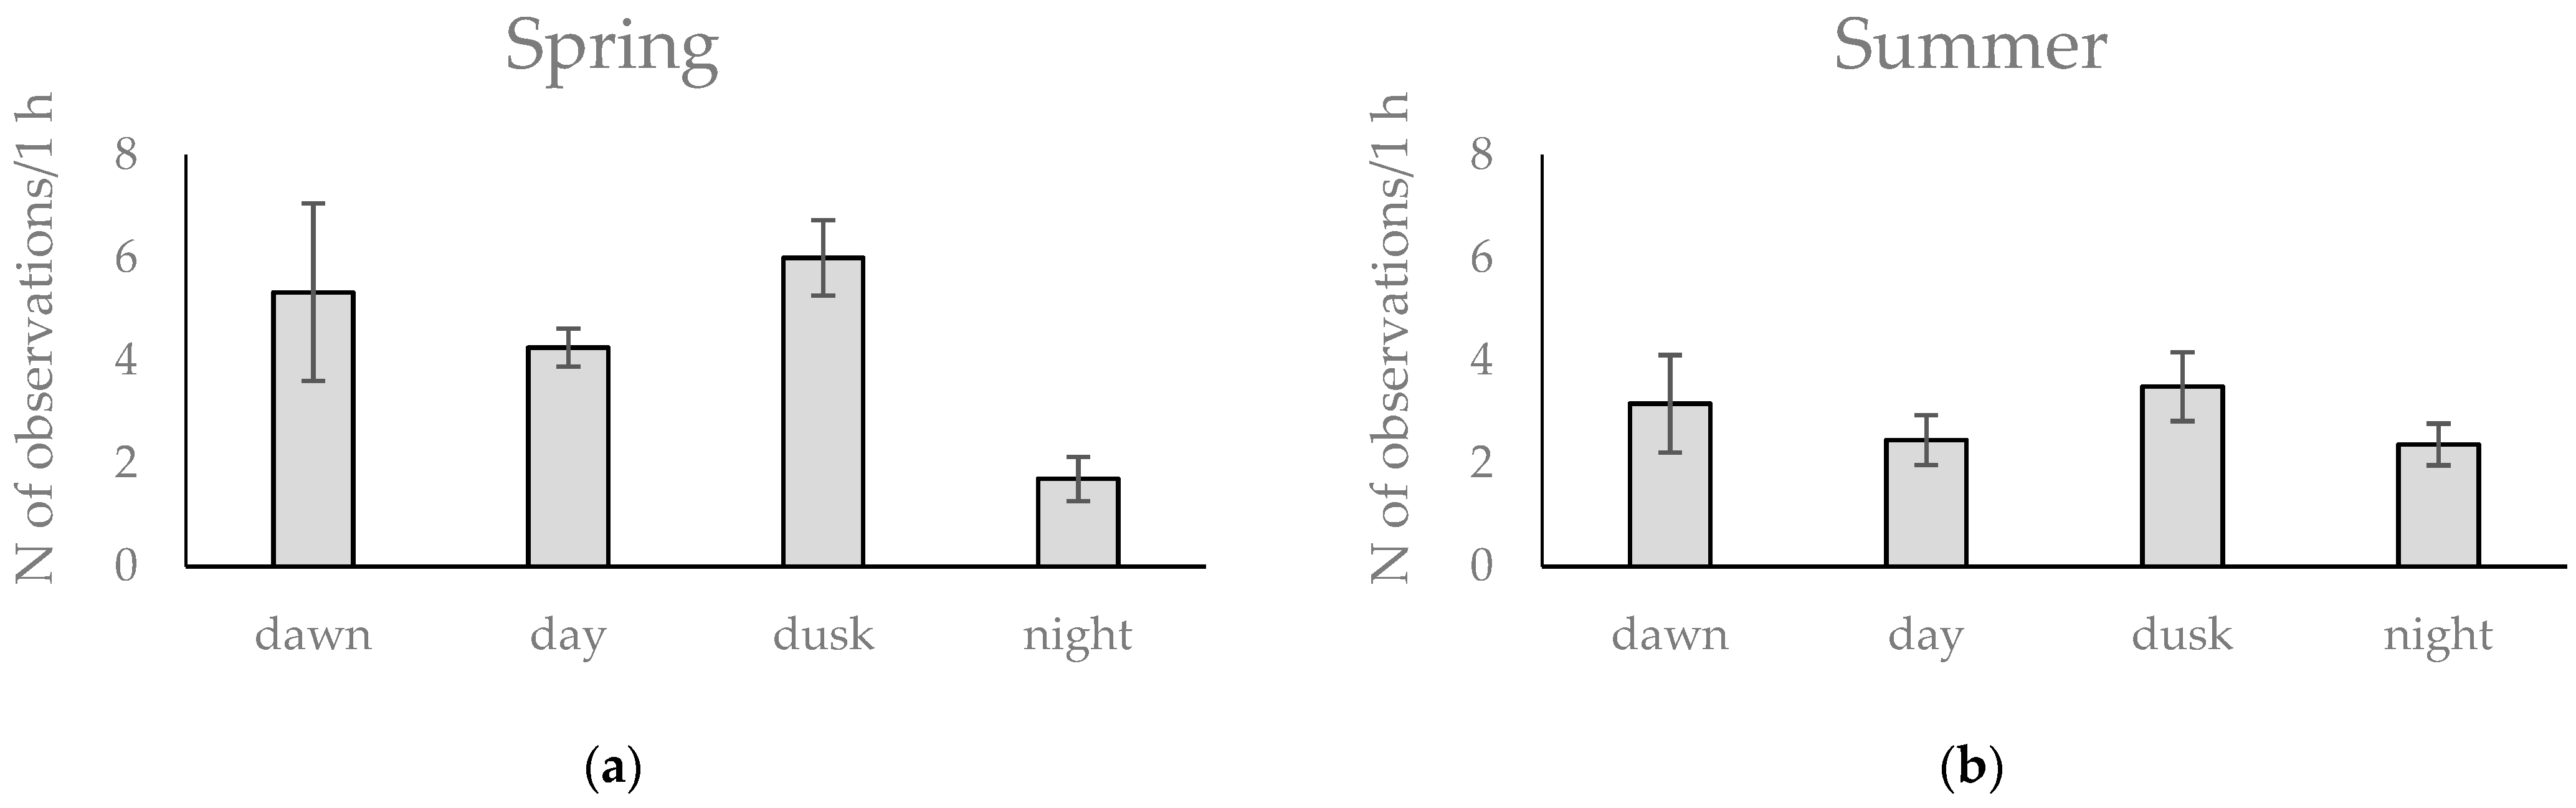
3.2. Activity Patterns of Roe Deer in Warsaw Urban Forests Using Camera Traps Data

In total, 859 observations of roe deer were recorded in forest complexes in Warsaw during March–August for the years 2019–2020 (442 in year 2019 and 417 in 2020). There were no significant differences between the number of observations in 2019 and 2020 (χ2 = 0.72, df = 1, p > 0.05). The total number of observations was not uniformly distributed among analyzed months (χ2 = 47.6, df = 11, p < 0.001) and seasons (χ2 = 22.5, df = 1, p < 0.001) with 23% of observations in April (58% observations recorded in spring) and 10% in June. Most of the observations were recorded during the day-time (67.8% of all recorded observations) (Figure 3).
Mean number of roe deer observations per one hour did not differ between parts of the day in spring and summer (χ2 = 1.18, df = 3, p > 0.05). The majority of the observations were noted in crepuscular time of day in spring (dawn—5.3/h, dusk—6.0/h) and summer (dawn—3.2/h, dusk—3.5/h). The lowest values were noted for nights, while in summer the numbers of observation per 1 h of day and night were similar (2.5 and 2.4 observations/h, respectively) (Figure 4). Roe deer activity during day or night was not significantly correlated with the length of day or night (r = −0.50, p = 0.12 and r = 0.09, p = 0.80, respectively).
In general, the frequency of observations in moon phases did not differ during nocturnal (night, dawn, dusk) periods (χ2 = 11.5, df = 7, p = 0.119), but the number of roe deer observations in certain moon phases differed between spring and summer (χ2 = 14.60, df = 7, p = 0.042) (Figure 5). The frequency of nocturnal observations at bright and dark nights was similar (51.3% and 48.7%, respectively, n = 227, χ2 = 0.13, df = 1, p = 0.721).
Mean numbers of roe deer recorded by individual trap per 100 trap-days were not related to the level of light pollution assigned to a given forest complex (r = 0.007, p = 0.839). Furthermore, in the case of studied forest complexes, we found no significant relationship between mean number of recorded animals per 100 trap-days and any of the analyzed parameters describing the impact of human disturbances on roe deer occurrence (Table A4).

4. Discussion

Ungulates are characterized by high behavioral plasticity, which allows them to inhabit heavily human-modified areas, including cities [44,45]. In these habitats, human disturbances are often considered to be analogous to predation risk [19]. This may lead to shifts in temporal and spatial activity patterns of animals [46,47], and an increase in their vigilance levels [48] or flight distances [49]. In line with the assumptions presented in the introduction, we found that human disturbances affected abundance and activity patterns of roe deer in urban areas of Warsaw. Abundance of this species was highest in more sheltered habitats (urban forests). Roe deer activity pattern varied depending on the time of day and moon phases.
Our study, based on snow tracking, showed that winter abundance of roe deer in Warsaw was highest in natural habitats (forests and open, mostly agricultural areas) in every period of research (1976–1978, 2005–2008 and 2017–2021). Ciach and Fröhlich [44] showed that winter occurrence of roe deer in urban areas was correlated with presence of open areas, providing high-quality food resources for roe deer during this season [27,50]. In turn, wooded areas provide effective camouflage for this species [23], not only in winter but all year round, therefore, roe deer may seek shelter here from humans (see [25]). Moreover, animals may buffer human disturbances by adjusting their activity in time and space [24]; in addition, roe deer may shift from open to more wooded habitats, staying hidden in forest refuges during the day, and foraging in open areas at night [23,48].
Our research showed that roe deer tracks were noticed in anthropogenic types of habitat more often in 2017–2021 than in previous study periods. This might be linked to change in various habitat types of Warsaw since 1970s, including an increasing share of built-up surfaces. Roe deer from an overabundant population inhabiting natural areas may be pushed into human-modified landscape [30]. Resulting from a high level of behavioral plasticity (e.g., [51]), roe deer can live in cities [44]. For the last two decades, Warsaw has gone through dynamic development process, which caused a decrease in the share of natural habitats. As a result, during migration or daily activities, roe deer may be forced to leave its natural habitat (forest and open areas) and penetrate more human-transformed areas. Moreover, the Vistula River flows throughout the entire city, an important ecological corridor for mammalian species, but this may also enable animals to penetrate city areas far from the source habitats, i.e., the forests [17].
Disturbance caused by humans affects selection of habitats by animals [52,53,54]. Proximity to trails, roads or buildings (which are associated with increased human activity), leads to avoidance of such areas [23,55]. Nevertheless, our research showed that the frequency of camera trap survey-based occurrence of roe deer in spring–summer and in certain urban forests in Warsaw was not linked to land cover around forest complexes. This is in line with findings of other studies, which claimed that human disturbances may have no significant effect on roe deer space use or vigilance, when density of human infrastructures is very high [25,48]. Urban landscape is highly heterogeneous with patches of optimal habitats surrounded by a matrix of human-transformed habitats, which most will be of low utility for the species. It may be assumed that relatively natural areas will be used by roe deer if only they offer food and shelter, and may be reached by migrating individuals. Distances from one patch of habitat to another are rather small, so with high population density in source habitats (forests located at the borders of the city and in larger suburban forests) most urban forests will be assumingly reached and inhabited.
Daily activity of animals can vary, depending on many conditions, including predation risk [56,57]. Most often, observed adjustment to living in anthropogenic landscape is shifting activity to periods of lower detectability [58]. Such shifts relate to patterns of daily activity, and influence of moon phases. In natural habitats with predators present, bimodal activity pattern is typical for roe deer [45,55,56]. Animals, living in close proximity to humans, may become more nocturnal to avoid high-risk periods, since humans are mostly active during the day [58]. Indeed, such activity pattern was observed for roe deer under human disturbance [23,45,55]. Our study showed very low activity of roe deer in urban forests during nights in the seasons that were investigated. On the one hand, this result might be linked to chosen methods. The effectiveness of camera traps during dark night hours might be lower than during day and crepuscular parts of day. On the other hand, human activity in urban areas is greatest during daylight hours [58], and despite the amicable spring and summer weather, it ends at dusk. Our results showed that activity pattern of roe deer in Warsaw was bimodal, connected with crepuscular periods of day and the higher peak occurring during dusk. Moreover, the activity of roe deer in different parts of day did not differ between spring and summer, while other authors showed monthly changes in distribution of roe deer activity in reproductive period (March–August) in natural habitat. According to Krop-Benesch et al. [37], the March and May activity of roe deer was higher at dusk, while in June–August higher activity level was observed at dawn.
Moon phases may influence animal behavior (e.g., [59]), including predator–prey interactions [60,61]. Animals being prey for predatory species shift their activity to darker nights and darker moon phases [62]. There is lack of consistency whether roe deer reacts to moonlight intensity; however, some research showed no influence of moon phases on roe deer activity [56]. Our research showed that moon phases influenced roe deer activity in urban forests of Warsaw, with the highest value obtained for waxing gibbous, one phase before the full moon, when the moonlight increases. Our findings concur with Kurt [63], who showed that roe deer may be more active during bright nights.
Even in urban areas, roe deer preferred natural to anthropogenic habitats, which was confirmed by our study that started in the 1970s in Warsaw. Roe deer inhabited mainly urban forests, which provided shelter from human disturbances, and allowed animals to be active with increasing moonlight and possibility to be detected. In turn, during the day, roe deer shifted its activity to times when the presence of humans and dogs in urban forest decreased.

5. Conclusions

Urbanization has led to severe habitat fragmentation and loss, and has brought humans and wildlife in close proximity, affecting both. In a highly heterogeneous and often hostile urban matrix, roe deer inhabits green, wooded areas, which offer shelter and exploits surrounding open spaces for feeding. Indeed, in Warsaw, winter abundance indices of roe deer snow tracks were the highest in natural habitats during all three periods of research. We found no specific spatial characteristics that would influence frequency of occurrence of roe deer within urban forests. This suggests that urban forest is a sufficient refuge regardless its surroundings and points to maintained ecological connectivity within urban matrix. Nevertheless, our research showed that roe deer inhabiting urban area avoided human presence, first by using well-covered habitats but also shifting its temporal activity. It reduced activity during the time when humans were more active, but at the same time its nocturnal (including dawn and dusk) activity was higher with increasing moonlight intensity (waxing gibbous) in the summer season. Overall, the study showed considerable plasticity of the species, which adapted to human-transformed landscape and exploited most suitable habitats, while its behavior altered to avoid human disturbance.

Author Contributions

Conceptualization, K.D.J.; methodology, K.D.J., M.J., S.B. and D.K.-G.; formal analysis, S.B., K.D.J.; investigation, K.D.J., M.J. and K.S.; resources, J.G. and M.J.; data curation, K.D.J. and M.J.; writing—original draft preparation, K.D.J., M.J., S.B. and D.K.-G.; writing—review and editing, K.D.J., M.J. and D.K.-G.; visualization, K.S. and K.D.J.; supervision, K.D.J. and D.K.-G.; project administration, K.D.J. All authors have read and agreed to the published version of the manuscript.

Funding

The article was financed by the Polish Ministry of Science and Higher Education within funds of the Institute of Forest Sciences, Warsaw University of Life Sciences (WULS), for scientific research.

Data Availability Statement

Data available on request.

Conflicts of Interest

The authors declare no conflict of interest.

Appendix A

Table A1. Characterization of urban forests where the camera traps were distributed in urban forests of Warsaw in the years 2019–2020.
Number of Urban ForestUrban ForestForest Area (ha)Number of LocationLatitudeLongitudeDates of Camera Trap Exposition
1Henryków i Dąbrówka Forest Park201.37152°20.349′ N20°58.256′ E02.03.–27.06.2019
252°20.362′ N20°58.209′ E02.03.–06.05.2019
20.04.–13.07.2020
352°21.086′ N20°57.385′ E02.03.–01.05.2019
17.06.–29.09.2019
25.02.–04.04.2020
452°20.268′ N20°58.275′ E07.03.–20.04.2020
2Bródno Forest Park139.00152°17.909′ N21°04.015′ E24.02.–20.05.2020
252°18.037′ N21°03.924′ E02.03.–07.05.2019
24.02.–14.07.2020
352°18.156′ N21°03.787′ E02.03.–07.05.2019
3Utrata Forest102.90152°16.057′ N21°06.698′ E05.03.–04.06.2019
4Kawęczyn Nature Reserve123.18152°15,249′ N21°08,733′ E05.03.–12.03.2019
23.02.–21.04.2020
252°15,242′ N21°08,285′ E10.03.–21.04.2020
5Olszynka Grochowska Nature Reserve58.91152°14.896′ N21°07.301′ E18.03.–30.05.2019
18.06.–22.07.2019
252°14.873′ N21°07.328′ E12.05.–13.10.2020
6Sobieski Forest765.75152°13.756′ N21°10.215′ E09.03.–01.06.2019
18.02.–07.07.2020
252°13.746′ N21°10.163′ E09.03.–07.05.2019
21.04.–07.07.2020
352°14.020′ N21°09.664′ E01.03.–17.07.2019
452°13.941′ N21°10.550′ E07.05.–04.10.2019
18.02.–03.03.2020
552°13.599′ N21°10.388′ E18.02.–01.03.2020
652°13.744′ N21°10.214′ E08.03.–21.04.2020
7Morysin Nature Reserve45.04152°10.508′ N21°06.134′ E09.03.–25.04.2019
15.07.–05.09.2019
09.02.–23.02.2020
14.09.–22.10.2020
252°10.529′ N21°06.117′ E29.02.–11.05.2020
8Natolin Forest Nature Reserve104.16152°08.459′ N21°05.092′ E11.03.–14.05.2019
22.07.–31.12.2019
10.02.–29.06.2020
252°08.611′ N21°04.223′ E27.02.–11.03.2019
29.04.–11.06.2019
09.03.–22.04.2020
352°08.421′ N21°05.018′ E29.04.–22.07.2019
452°08.379′ N21°05.206′ E05.06.–07.07.2020
9Kabaty Nature Reserve918.27152°06.985′ N21°03.229′ E03.03.–27.04.2020
252°07.455′ N21°03.054′ E26.02.–11.04.2019
18.05.–01.09.2019
27.04.–24.10.2020
352°07.753′ N21°02.823′ E04.03.–11.03.2019
19.05.–08.07.2019
452°08.007′ N21°02.185′ E11.03.–07.04.2019
08.07.–15.08.2019
552°07.305′ N21°05.380′ E17.03.–31.12.2019
07.01.–08.05.2020
652°07.493′ N21°02.105′ E26.02.–04.03.2019
752°07.592′ N21°03.118′ E26.02.–17.06.2019
08.07.–28.09.2019
03.03.–24.10.2020
852°06.916′ N21°03.231′ E09.06.–24.10.2020
952°07.550′ N21°02.105′ E14.03.–19.05.2019
24.04.–26.10.2020
1052°07.567′ N21°01.944′ E19.05.–28.09.2019
24.04.–08.06.2020
1152°06.878′ N21°02.499′ E09.03.–24.04.2020
1252°07.384′ N21°05.316′ E09.03.–24.04.2020
1352°06.842′ N21°02.806′ E09.03.–24.04.2020
1452°06.912′ N21°02.416′ E24.04.–09.06.2020
10Bielany Forest196.07152°17.349′ N20°58.057′ E10.03.–22.09.2020
11Młociny (Nowa Warszawa) Forest293.64152°18.864′ N20°54.201′ E02.03.–18.06.2019
02.03.–10.03.2020
252°19.114′ N20°54.025′ E02.03.–06.05.2019

Appendix B

Table A2. Mean light pollution level (based on Visible Infrared Imaging Radiometer Suite (VIIRS)) for each urban forest in Warsaw in the years 2019–2020.
Urban ForestLevel of Light Pollution
Henryków i Dąbrówka Forest Park10.45
Bródno Forest Park16.38
Utrata Forest16.00
Kawęczyn Nature Reserve12.63
Olszynka Grochowska Nature Reserve9.88
Sobieski Forest24.64
Morysin Nature Reserve6.37
Natolin Forest Nature Reserve15.22
Kabaty Nature Reserve5.23
Bielany Forest17.18
Henryków i Dąbrówka Forest Park10.45

Appendix C

Table A3. Spatial parameters levels describing landscape connectivity for urban forests in Warsaw in the years 2019–2020.
Urban Forest% Share in 250 m Buffer of **
Forest AreasSemi-Natural Green AreasOther Green AreasNon-Vegetation Open AreasUrban AreasWater
Henryków i Dąbrówka Forest Park19.57.0--73.5-
Bródno Forest Park-15.525.3-59.2-
Utrata Forest-25.920.9-53.2-
Kawęczyn Nature Reserve40.9---59.1-
Olszynka Grochowska Nature Reserve--21.0-79.0-
Sobieski Forest49.4-1.3-49.3-
Morysin Nature Reserve5.639.81.6-41.811.2
Natolin Forest Nature Reserve-52.316.2-31.4-
Kabaty Nature Reserve8.734.5--56.8-
Bielany Forest1.8-37.4-48.812.0
Młociny (Nowa Warszawa) Forest23.29.429.81.935.6-
** dashes in cells indicate lack of area type in a buffer zone.

Appendix D

Table A4. Pearson correlation coefficients between selected environmental parameters describing landscape connectivity with occurrence of roe deer (mean frequency of occurrence per 100 trap-days) in urban forests of Warsaw as recorded by camera traps in the years 2019–2020.
AnalysisParameterrp
share (%) in 250 m buffer around urban forestsForest areas0.130.71
Semi-natural green areas0.340.31
Other green areas−0.430.19
Non-vegetation open areas−0.440.18
Urban areas−0.020.95
Water−0.220.52

References

  1. McKinney, M.L. Urbanization as a major cause of biotic homogenization. Biol. Conserv. 2006, 127, 247–260. [Google Scholar] [CrossRef]
  2. Seto, K.C.; Güneralp, B.; Hutyra, L.R. Global forecasts of urban expansion to 2030 and direct impacts on biodiversity and carbon pools. Proc. Natl. Acad. Sci. USA 2012, 109, 16083–16088. [Google Scholar] [CrossRef] [Green Version]
  3. Prugh, L.R.; Hodges, K.E.; Sinclair, A.R.E.; Brashares, J.S. Effect of habitat area and isolation on fragmented animal populations. Proc. Natl. Acad. Sci. USA 2008, 105, 20770–20775. [Google Scholar] [CrossRef] [PubMed] [Green Version]
  4. McDonnell, M.J.; Hahs, A.K. The use of gradient analysis studies in advancing our understanding of the ecology of urbanizing landscapes: Current status and future directions. Landsc. Ecol. 2008, 23, 1143–1155. [Google Scholar] [CrossRef]
  5. Pickett, S.T.A.; Cadenasso, M.L.; Grove, J.M.; Boone, C.G.; Groffman, P.M.; Irwin, E.; Kaushal, S.S.; Marshall, V.; McGrath, B.P.; Nilon, C.H.; et al. Urban ecological systems: Scientific foundations and a decade of progress. J. Environ. Manag. 2011, 92, 331–362. [Google Scholar] [CrossRef] [PubMed]
  6. Forman, R.T. Urban Ecology: Science of Cities; Cambridge University Press: New York, NY, USA, 2014. [Google Scholar]
  7. Parris, K.M. Ecology of Urban Environments; Wiley-Blackwell: Chichester, UK, 2016. [Google Scholar]
  8. Hewison, A.J.M.; Vincent, J.P.; Joachim, J.; Angibault, J.M.; Cargnelutti, B.; Cibien, C. The effects of woodland fragmentation and human activity on roe deer distribution in agricultural landscapes. Can. J. Zool. 2001, 79, 679–689. [Google Scholar] [CrossRef]
  9. Acevedo, P.; Delibes-Mateos, M.; Escudero, M.A.; Vicente, J.; Marco, J.; Gortazar, C. Environmental constraints in the colonization sequence of roe deer (Capreolus capreolus Linnaeus, 1758) across the Iberian Mountains, Spain. J. Biogeogr. 2005, 32, 1671–1680. [Google Scholar] [CrossRef]
  10. Syphard, A.D.; Clarke, K.C.; Franklin, J.; Regan, H.M.; McGinnis, M. Forecasts of habitat loss and fragmentation due to urban growth are sensitive to source of input data. J. Environ. Manag. 2011, 92, 1882–1893. [Google Scholar] [CrossRef]
  11. Scolozzi, R.; Geneletti, D. A multi-scale qualitative approach to assess the impact of urbanization on natural habitats and their connectivity. Environ. Impact Assess. Rev. 2012, 36, 9–22. [Google Scholar] [CrossRef]
  12. van Strien, M.J.; Grêt-Regamey, A. How is habitat connectivity affected by settlement and road network configurations? Results from simulating coupled habitat and human networks. Ecol. Model. 2016, 342, 186–198. [Google Scholar] [CrossRef] [Green Version]
  13. van Strien, M.J.; Slager, C.T.J.; de Vries, B.; Gret-Regamey, A. An improved neutral landscape model for re-creating real landscapes and generating landscape series for spatial ecological simulations. Ecol. Evol. 2016, 6, 3808–3821. [Google Scholar] [CrossRef] [Green Version]
  14. Baker, P.J.; Dowding, C.V.; Molony, S.E.; White, P.C.L.; Harris, S. Activity patterns of urban red foxes (Vulpes vulpes) reduce the risk of traffic-induced mortality. Behav. Ecol. 2007, 35, 716–724. [Google Scholar] [CrossRef] [Green Version]
  15. Harris, S. Ecology of Urban Badger Meles meles: Distribution in Britain and Habitat Selection, Persecution, Food and Damage in the City of Bristol. Biol. Conserv. 1984, 28, 349–375. [Google Scholar] [CrossRef]
  16. Herr, J.; Schley, L.; Roper, T.J. Socio-spatial organization of urban stone martens. J. Zool. 2009, 277, 54–62. [Google Scholar] [CrossRef]
  17. Jackowiak, M.; Gryz, J.; Jasińska, K.; Brach, M.; Bolibok, L.; Kowal, P.; Krauze-Gryz, D. Colonization of Warsaw by the red fox Vulpes vulpes in the years 1976–2019. Sci. Rep. 2021, 11, 13931. [Google Scholar] [CrossRef]
  18. Csókás, A.; Schally, G.; Szabó, L.; Csányi, S.; Kovács, F.; Heltai, M. Space use of wild boar (Sus Scrofa) in Budapest: Are they resident or transient city dwellers? Biol. Futur. 2020, 71, 39–51. [Google Scholar] [CrossRef] [Green Version]
  19. Frid, A.; Dill, L.M. Human-caused disturbance stimuli as a form of predation risk. Conserv. Ecol. 2002, 6, 11. [Google Scholar] [CrossRef]
  20. Rich, C.; Longcore, T. Ecological Consequences of Artificial Night Lighting; Island Press: London, UK, 2006. [Google Scholar]
  21. LaPoint, S.; Balkenhol, N.; Hale, J.; Sadler, J.; van der Ree, R. Ecological connectivity research in urban areas. Funct. Ecol. 2015, 29, 868–878. [Google Scholar] [CrossRef]
  22. Ciuti, S.; Northrup, J.M.; Muhly, T.B.; Simi, S.; Musiani, M.; Pitt, J.A.; Boyce, M.S. Effects of humans on behaviour of wildlife exceed those of natural predators in a landscape of fear. PLoS ONE 2012, 7, e50611. [Google Scholar]
  23. Bonnot, N.; Morellet, N.; Verheyden, H. Habitat use under predation risk: Hunting, roads and human dwellings influence the spatial behavior of roe deer. Eur. J. Wildl. Res. 2013, 59, 185–193. [Google Scholar] [CrossRef]
  24. Bonnot, N.; Morellet, N.; Hewison, A.J.M.; Martin, J.-L.; Benhamou, S.; Chamaillé-Jammes, S. Black-tailed deer (Odocoileus hemionus sitkensis) adjust habitat selection and activity rhythm to the absence of predators. Can. J. Zool. 2016, 94, 385–394. [Google Scholar] [CrossRef]
  25. Wevers, J.; Fattebert, J.; Casaer, J.; Artois, T.; Beenaerts, N. Trading fear for food in the Anthropocene: How ungulates cope with human disturbance in a multi-use, suburban ecosystem. Sci. Total Environ. 2020, 741, 140369. [Google Scholar] [CrossRef] [PubMed]
  26. Bragina, E.V.; Ives, A.R.; Pidgeon, A.M.; Balčiauskas, L.; Csányi, S.; Khoyetskyy, P.; Radeloff, V.C. Wildlife population changes across Eastern Europe after the collapse of socialism. Front. Ecol. Environ. 2018, 16, 77–81. [Google Scholar] [CrossRef] [Green Version]
  27. Putman, R.J. Foraging by roe deer in agricultural areas and impact on arable crops. J. Appl. Ecol. 1986, 23, 91–99. [Google Scholar] [CrossRef]
  28. McLoughlin, P.D.; Gaillard, J.-M.; Boyce, M.S.; Bonenfant, C.; Messier, F.; Duncan, P.; Delorme, D.; Van Moorter, B.; Saïd, S.; Klein, F. Lifetime reproductive success and composition of the home range in a large herbivore. Ecology 2007, 88, 3192–3201. [Google Scholar] [CrossRef]
  29. Panzacchi, M.; Linnell, J.D.C.; Odden, M.; Odden, J.; Andersen, R. Habitat and roe deer fawn vulnerability to red fox predation. J. Anim. Ecol. 2009, 78, 1124–1133. [Google Scholar] [CrossRef]
  30. Tinoco Torres, R.; Carvahlo, J.C.; Panzacchi, M.; Linnell, J.D.C.; Fonseca, C. Comparative use of forest habitats by roe deer and moose in a human-modified landscape in southeastern Norway during winter. Ecol. Res. 2011, 26, 781–789. [Google Scholar] [CrossRef]
  31. Loro, M.; Ortega, E.; Arce, R.M.; Geneletti, D. Assessing landscape resistance to Roe deer dispersal using fuzzy set theory and multicriteria analysis: A case study in Central Spain. Landsc. Ecol. Eng. 2016, 12, 41–60. [Google Scholar] [CrossRef] [Green Version]
  32. McCarthy, A.; Baker, A.; Rotherham, I. Urban-fringe deer management issues—A South Yorkshire case study. Br. Wildl. 1996, 8, 12–19. [Google Scholar]
  33. Statistics Poland. Statistical Yearbook of Warsaw; Zakład Wydawnictw Statystycznych: Warsaw, Poland, 2019. [Google Scholar]
  34. Climate-data.org. Available online: https://pl.climate-data.org/europa/polska/masovian-voivodeship/warszawa-4560/ (accessed on 29 October 2020).
  35. Luniak, M.; Kozłowski, P.; Nowicki, W. Magpie Pica pica in Warsaw—Abundance, distribution and changes in its population. Acta Ornithol. 1997, 32, 77–86. [Google Scholar]
  36. Büttner, G.; Kosztra, B.; Maucha, G.; Pataki, R.; Kleeschulte, S.; Hazeu, G.; Vittek, M.; Schröder, C.; Littkopf, A. Copernicus Land Monitoring Service CORINE Land Cover. User Manual. Copernicus Land Monitoring Service (CLMS). 2021. Available online: https://land.copernicus.eu/user-corner/technical-library/clc-product-user-manual?fbclid=IwAR2ZURZU-H1l5J45FSSZfGKSSHlp2AB0-i50pImfEB20ZR2iEUmFHvua7uc (accessed on 25 June 2021).
  37. Krop-Benesch, A.; Berger, A.; Hofer, H.; Heurich, M. Long-term measurement of roe deer (Capreolus capreolus) (Mammalia: Cervidae) activity using two-axis accelerometers in GPS-collars. Ital. J. Zool. 2013, 80, 69–81. [Google Scholar] [CrossRef] [Green Version]
  38. Dateandtime.info. Available online: https://dateandtime.info/pl/citysunrisesunset.php?id=756135&month=8&year=2019 (accessed on 29 October 2020).
  39. Caravaggi, A.; Gatta, M.; Vallely, M.; Hogg, K.; Freeman, M.; Fadaei, E.; Dick, J.T.A.; Montgomery, W.I.; Reid, N.; Tosh, D.G. Seasonal and predator-prey effects on circadian activity of free-ranging mammals revealed by camera traps. Peer J. 2018, 6, e5827. [Google Scholar] [CrossRef]
  40. Corsini, M.T.; Lovari, S.; Sonnino, S. Temporal activity patterns of crested porcupines Hystvix cvistata. J. Zool. 1995, 236, 43–54. [Google Scholar] [CrossRef]
  41. lightpollutionmap.info. Available online: https://www.lightpollutionmap.info/#zoom=4.00&lat=45.8720&lon=14.5470&layers=B0FFFFFTFFFFFFFFFF (accessed on 23 June 2021).
  42. Bielecka, E.; Jenerowicz, A. Intellectual structure of CORINE Land Cover research applications in Web of Science: A Europe-wide review. Remote Sens. 2019, 11, 2017. [Google Scholar] [CrossRef] [Green Version]
  43. Hammer, Ø.; Harper, D.A.T.; Ryan, P.D. PAST: Paleontological statistics software package for education and data analysis. Palaeontol. Electron. 2001, 4, 4. [Google Scholar]
  44. Ciach, M.; Fröhlich, A. Ungulates in the city: Light pollution and open habitats predict the probability of roe deer occurring in an urban environment. Urban Ecosyst. 2019, 22, 513–523. [Google Scholar] [CrossRef] [Green Version]
  45. Bonnot, N.C.; Couriot, O.; Berger, A.; Cagnacci, F.; Ciuti, S.; de Groeve, J.E.; Gehr, B.; Heurich, M.; Kjellander, P.; Kröschel, M.; et al. Fear of the dark? Contrasting impacts of humans versus lynx on diel activity of roe deer across Europe. J. Anim. Ecol. 2020, 89, 132–145. [Google Scholar] [CrossRef]
  46. Laundré, J.W.; Hernández, L.; Altendorf, K.B. Wolves, elk, and bison: Reestablishing the "landscape of fear" in Yellowstone National Park, U.S.A. Can. J. Zool. 2001, 79, 1401–1409. [Google Scholar] [CrossRef]
  47. Laundré, J.W.; Hernández, L.; Ripple, W.J. The landscape of fear: Ecological implications of being afraid. Open Ecol. J. 2010, 3, 1–7. [Google Scholar] [CrossRef] [Green Version]
  48. Benhaiem, S.; Delon, M.; Lourtet, B.; Cargnelutti, B.; Aulagnier, S.; Hewison, A.J.M.; Morellet, N.; Verheyden, H. Hunting increases vigilance levels in roe deer and modifies feeding site selection. Anim. Behav. 2008, 76, 611–618. [Google Scholar] [CrossRef]
  49. Bonnot, N.C.; Hewison, A.J.M.; Morellet, N.; Gaillard, J.-M.; Debeffe, L.; Couriot, O.; Cargnelutti, B.; Chaval, Y.; Lourtet, B.; Kjellander, P.; et al. Stick or twist: Roe deer adjust their flight behaviour to the perceived trade-off between risk and reward. Anim. Behav. 2017, 124, 35–46. [Google Scholar] [CrossRef]
  50. Mysterud, A.; Lian, L.-B.; Hjermann, D.Ø. Scale-dependent trade-offs in foraging by European roe deer (Capreolus capreolus) during winter. Can. J. Zool. 1999, 77, 1486–1493. [Google Scholar] [CrossRef] [Green Version]
  51. Jepsen, J.U.; Topping, C.J. Modelling roe deer (Capreolus capreolus) in a gradient of forest fragmentation: Behavioural plasticity and choice of cover. Can. J. Zool. 2004, 82, 1528–1541. [Google Scholar] [CrossRef]
  52. Lone, K.; Loe, L.E.; Gobakken, T.; Linnell, J.D.C.; Odden, J.; Remmen, J.; Mysterud, A. Living and dying in a multi-predator landscape of fear: Roe deer are squeezed by contrasting pattern of predation risk imposed by lynx and humans. Oikos 2014, 123, 641–651. [Google Scholar] [CrossRef]
  53. Kays, R.; Crofoot, M.C.; Jetz, W.; Wikelski, M. Terrestrial animal tracking as an eye on life and planet. Science 2015, 348, aaa2478. [Google Scholar] [CrossRef] [PubMed] [Green Version]
  54. Larson, C.L.; Reed, S.E.; Merenlender, A.M.; Crooks, K.R. Effects of recreation on animals revealed as widespread through a global systematic review. PLoS ONE 2016, 11, e0167259. [Google Scholar] [CrossRef] [Green Version]
  55. Oberosler, V.; Groff, C.; Iemma, A.; Pedrini, P.; Rovero, F. The influence of human disturbance on occupancy and activity patterns of mammals in the Italian Alps from systematic camera trapping. Mamm. Biol. 2017, 87, 50–61. [Google Scholar] [CrossRef]
  56. Pagon, N.; Grignolio, S.; Pipia, A.; Bongi, P.; Bertolucci, C.; Apollonio, M. Seasonal variation of activity patterns in roe deer in a temperate forested area. Chronobiol. Int. 2013, 30, 772–785. [Google Scholar] [CrossRef] [PubMed]
  57. Sönnichsen, L.; Bokje, M.; Marchal, J.; Hofer, H.; Jędrzejewska, B.; Kramer-Schadt, S.; Ortmann, S. Behavioural responses of european Roe deer to temporal variation in predation risk. Ethology 2013, 199, 233–243. [Google Scholar] [CrossRef]
  58. Ditchkoff, S.S.; Saalfeld, S.T.; Gibson, C.J. Animal behavior in urban ecosystems: Modifications due to human-induced stress. Urban Ecosyst. 2006, 9, 5–12. [Google Scholar] [CrossRef]
  59. Kotler, B.P.; Brown, J.; Mukherjee, S.; Berger-Tal, O.; Bouskila, A. Moonlight avoidance in gerbils reveals a sophisticated interplay among time allocation, vigilance and state-dependent foraging. Proc. R. Soc. B 2010, 277, 1469–1474. [Google Scholar] [CrossRef] [PubMed] [Green Version]
  60. Griffin, P.C.; Griffin, S.C.; Waroquiers, C.; Mills, L.S. Mortality by moonlight: Predation risk and the snowshoe hare. Behav. Ecol. 2005, 16, 938–944. [Google Scholar] [CrossRef] [Green Version]
  61. Haddock, J.K.; Threlfall, C.G.; Law, B.; Hochuli, D.F. Light pollution at the urban forest edge negatively impacts insectivorous bats. Biol. Conserv. 2019, 236, 17–28. [Google Scholar] [CrossRef]
  62. Prough, L.R.; Golden, C.D. Does moonlight increase predation risk? Meta-analysis reveals divergent responses of nocturnal mammals to lunar cycles. J. Anim. Ecol. 2014, 83, 504–514. [Google Scholar] [CrossRef] [PubMed]
  63. Kurt, F. Das Reh in der Kulturlandschaft: Sozialverhalten und Ökologie eines Anpassers Roe Deer in the Cultural Landscape: Social Behavior and Ecology of an Adaptor; Verlag Paul Parey: Hamburg/Berlin, Germany, 1991. [Google Scholar]
Figure 1. Distribution of urban forests in Warsaw where camera traps were set in the years 2019–2020 to study roe deer activity patterns. The numbers show selected forest areas: 1. Henryków and Dąbrówka Forest Park, 2. Bródno Forest Park, 3. Utrata Forest, 4. Kawęczyn Nature Reserve, 5. Olszynka Grochowska Nature Reserve, 6. Sobieski Forest (incl. Jan III Sobieski Nature Reserve), 7. Morysin Nature Reserve, 8. Natolin Forest Nature Reserve, 9. Kabaty Forest Nature Reserve, 10. Bielany Forest and 11. Młociny Forest. Types of land cover were taken from CORINE Land Cover [36]. Six types of land cover were distinguished: forest areas (all natural wooded areas), semi-natural green areas (arable land, pastures, heterogeneous agricultural areas, shrub and/or herbaceous associations), other green areas (artificial, non-agricultural vegetated areas and permanent crops), non-vegetation open areas (open spaces with little or no vegetation, mine, dump and construction sites), urban areas (urban fabric, industrial, commercial and transport units) and waters (water bodies).
Forests 12 00970 g001
Figure 2. Mean (+SE) number of roe deer tracks in two different types of habitats in Warsaw as recorded by snow tracking along transect routes in the three study periods: 1976–1978, 2005–2008, 2017–2021.
Forests 12 00970 g002
Figure 3. Temporal pattern of roe deer activity in a reproductive period (March–August) in urban forests of Warsaw in the years 2019–2020. Each dot refers to one case of roe deer presence recoded by a camera trap.
Forests 12 00970 g003
Figure 4. Mean (+SE) number of roe deer camera-trap observations per one hour during different parts of the day during (a) spring (March–May) and (b) summer (June–August) in urban forests of Warsaw in years 2019–2020.
Forests 12 00970 g004
Figure 5. Number (+SE) of roe deer camera-trap observations in different moon phases during spring (March–May) and summer (June–August) in urban forests of Warsaw in years 2019–2020.
Forests 12 00970 g005
Table 1. The length of snow tracking transect routes to determine roe deer abundance in natural and anthropogenic habitats of Warsaw during three research periods (1976–1978, 2005–2008, 2017–2021).
Research PeriodLength of Transect Routes in Habitats [km]
NaturalAnthropogenic
1976–197896.279.5
2005–200839.0180.8
2017–2021146.0139.7
in total281.2400.0
Publisher’s Note: MDPI stays neutral with regard to jurisdictional claims in published maps and institutional affiliations.

