
Physiological and Transcriptome Responses to Elevated CO2 Concentration in Populus
by
 , , ,
, , ,
Tae-Lim Kim
1 ,
,
Hoyong Chung
2,
Karpagam Veerappan
2,
Wi Young Lee
1,
Danbe Park
1 and
Hyemin Lim
1,* 1
Forest Bioresources Department, National Institute of Forest Science, Suwon-si 16631, Gyeonggi-do, Korea
2
3BIGS CO. LTD., 156 Gwanggyo-ro, Yeongtong-gu, Suwon-si 16506, Gyeonggi-do, Korea
*
Author to whom correspondence should be addressed.
Forests 2021, 12(8), 980; https://0-doi-org.brum.beds.ac.uk/10.3390/f12080980
Submission received: 30 March 2021
/
Revised: 3 July 2021
/
Accepted: 21 July 2021
/
Published: 23 July 2021
(This article belongs to the Special Issue Impacts of Climate Change on Tree Physiology and Responses of Forest Ecosystems)
Abstract
:Global climate change is heavily affected by an increase in CO2. As one of several efforts to cope with this, research on poplar, a representative, fast growing, and model organism in plants, is actively underway. The effects of elevated atmospheric CO2 on the metabolism, growth, and transcriptome of poplar were investigated to predict productivity in an environment where CO2 concentrations are increasing. Poplar trees were grown at ambient (400 ppm) or elevated CO2 concentrations (1.4× ambient, 560 ppm, and 1.8× ambient, 720 ppm) for 16 weeks in open-top chambers (OTCs). We analyzed the differences in the transcriptomes of Populus alba × Populus glandulosa clone “Clivus” and Populus euramericana clone “I-476” using high-throughput sequencing techniques and elucidated the functions of the differentially expressed genes (DEGs) using various functional annotation methods. About 272,355 contigs and 207,063 unigenes were obtained from transcriptome assembly with the Trinity assembly package. Common DEGs were identified which were consistently regulated in both the elevated CO2 concentrations. In Clivus 29, common DEGs were found, and most of these correspond to cell wall proteins, especially hydroxyproline-rich glycoproteins (HRGP), or related to fatty acid metabolism. Concomitantly, in I-476, 25 were identified, and they were related to heat shock protein (HSP) chaperone family, photosynthesis, nitrogen metabolism, and carbon metabolism. In addition, carbohydrate contents, including starch and total soluble sugar, were significantly increased in response to elevated CO2. These data should be useful for future gene discovery, molecular studies, and tree improvement strategies for the upcoming increased-CO2 environments.
1. Introduction
The CO2 concentration in the atmosphere is rapidly increasing due to industrialization and deforestation, causing global warming and abnormal weather conditions. The reduction in the CO2 concentration in the atmosphere through photosynthesis highlights the importance of forests (IPCC, 2013). According to the IPCC Fourth Assessment Report (IPCC 2007), the atmospheric CO2 concentration will increase from 389 ppm in 2005 to 550–700 ppm by 2050 and to 650–1200 ppm by 2100, which will cause global warming of 1.1–6.4 °C by the end of this century [1]. The concentration of CO2 in the atmosphere directly determines the ratio of plant photosynthesis, and indirectly affects plant productivity and fitness, and thus could serve as a form of selective pressure, though there is little evidence to support this contention. Carbon dioxide is a major component in photosynthesis that converts solar energy into energy stored in carbohydrates, thereby controlling plant yield. An elevated CO2 concentration raises the photosynthetic rate and plant’s net production or biomass [2], but a rising temperature increases the ratio of photorespiratory loss of carbon to photosynthetic gain, thereby having an opposite effect [3]. The increase in the concentration of atmospheric CO2 is likely to have a significant effect on the photosynthesis, metabolism, and development of plants [4,5]. In plants, increased primary carbon sources accelerate their metabolism and growth, especially when other growth sources are abundant [6,7].
Populus is a significant model for studying the effects of abiotic stresses on trees. In addition, Populus is now recognized as a model tree [8], enabling genomic resources to be deployed to answer questions of ecological and evolutionary significance on plant response and adaptation to climate change. The Populus species is an excellent model for examining drought stress responses, which affect not only survival but also biomass accumulation [9,10]. Additionally, Populus is an economically important wood tree, and in recent years, there has been increasing interest in studying its genotype, transcriptome and drought response mechanisms [11,12]. Populus is the internationally accepted model system for physiological and molecular studies in woody plants, in part due to the availability of the complete genome sequence of Populus trichocarpa [13]. The availability of the poplar genome plays an important role in understanding the molecular processes of growth, metabolism, and stress responses to environmental changes. The Populus alba × Populus glandulosa “Clivus” clone is a hybrid species made by NIFoS (National Institute of Forest Science) in Korea. It is a good resource for genetic engineering as it is sterile [14]. The Populus euramericana “I-476” clone is an interspecific hybrid produced from the cross of Populus nigra and Populus deltoides. Many P. euramericana clones have been commercialized, used in forestry production, and to promote ecosystem stability [15].
Next-generation sequencing technologies have been used to elucidate the molecular bases of poplar physiological and developmental mechanisms [16,17], and the responses of the Populus transcriptome to both biotic and abiotic stresses [18,19,20]. In particular, RNA-Seq analysis have been an important breakthrough for sensitive, quantitative, annotation-independent, and high-throughput analyses [21].
We aimed to study physiological and transcriptional changes in poplar trees grown under ambient (400 ppm) and elevated (560 and 720 ppm) atmospheric CO2, and the physiological parameters are correlated with changes in transcript abundance.
2. Materials and Methods
2.1. Plant Materials and Growth Conditions
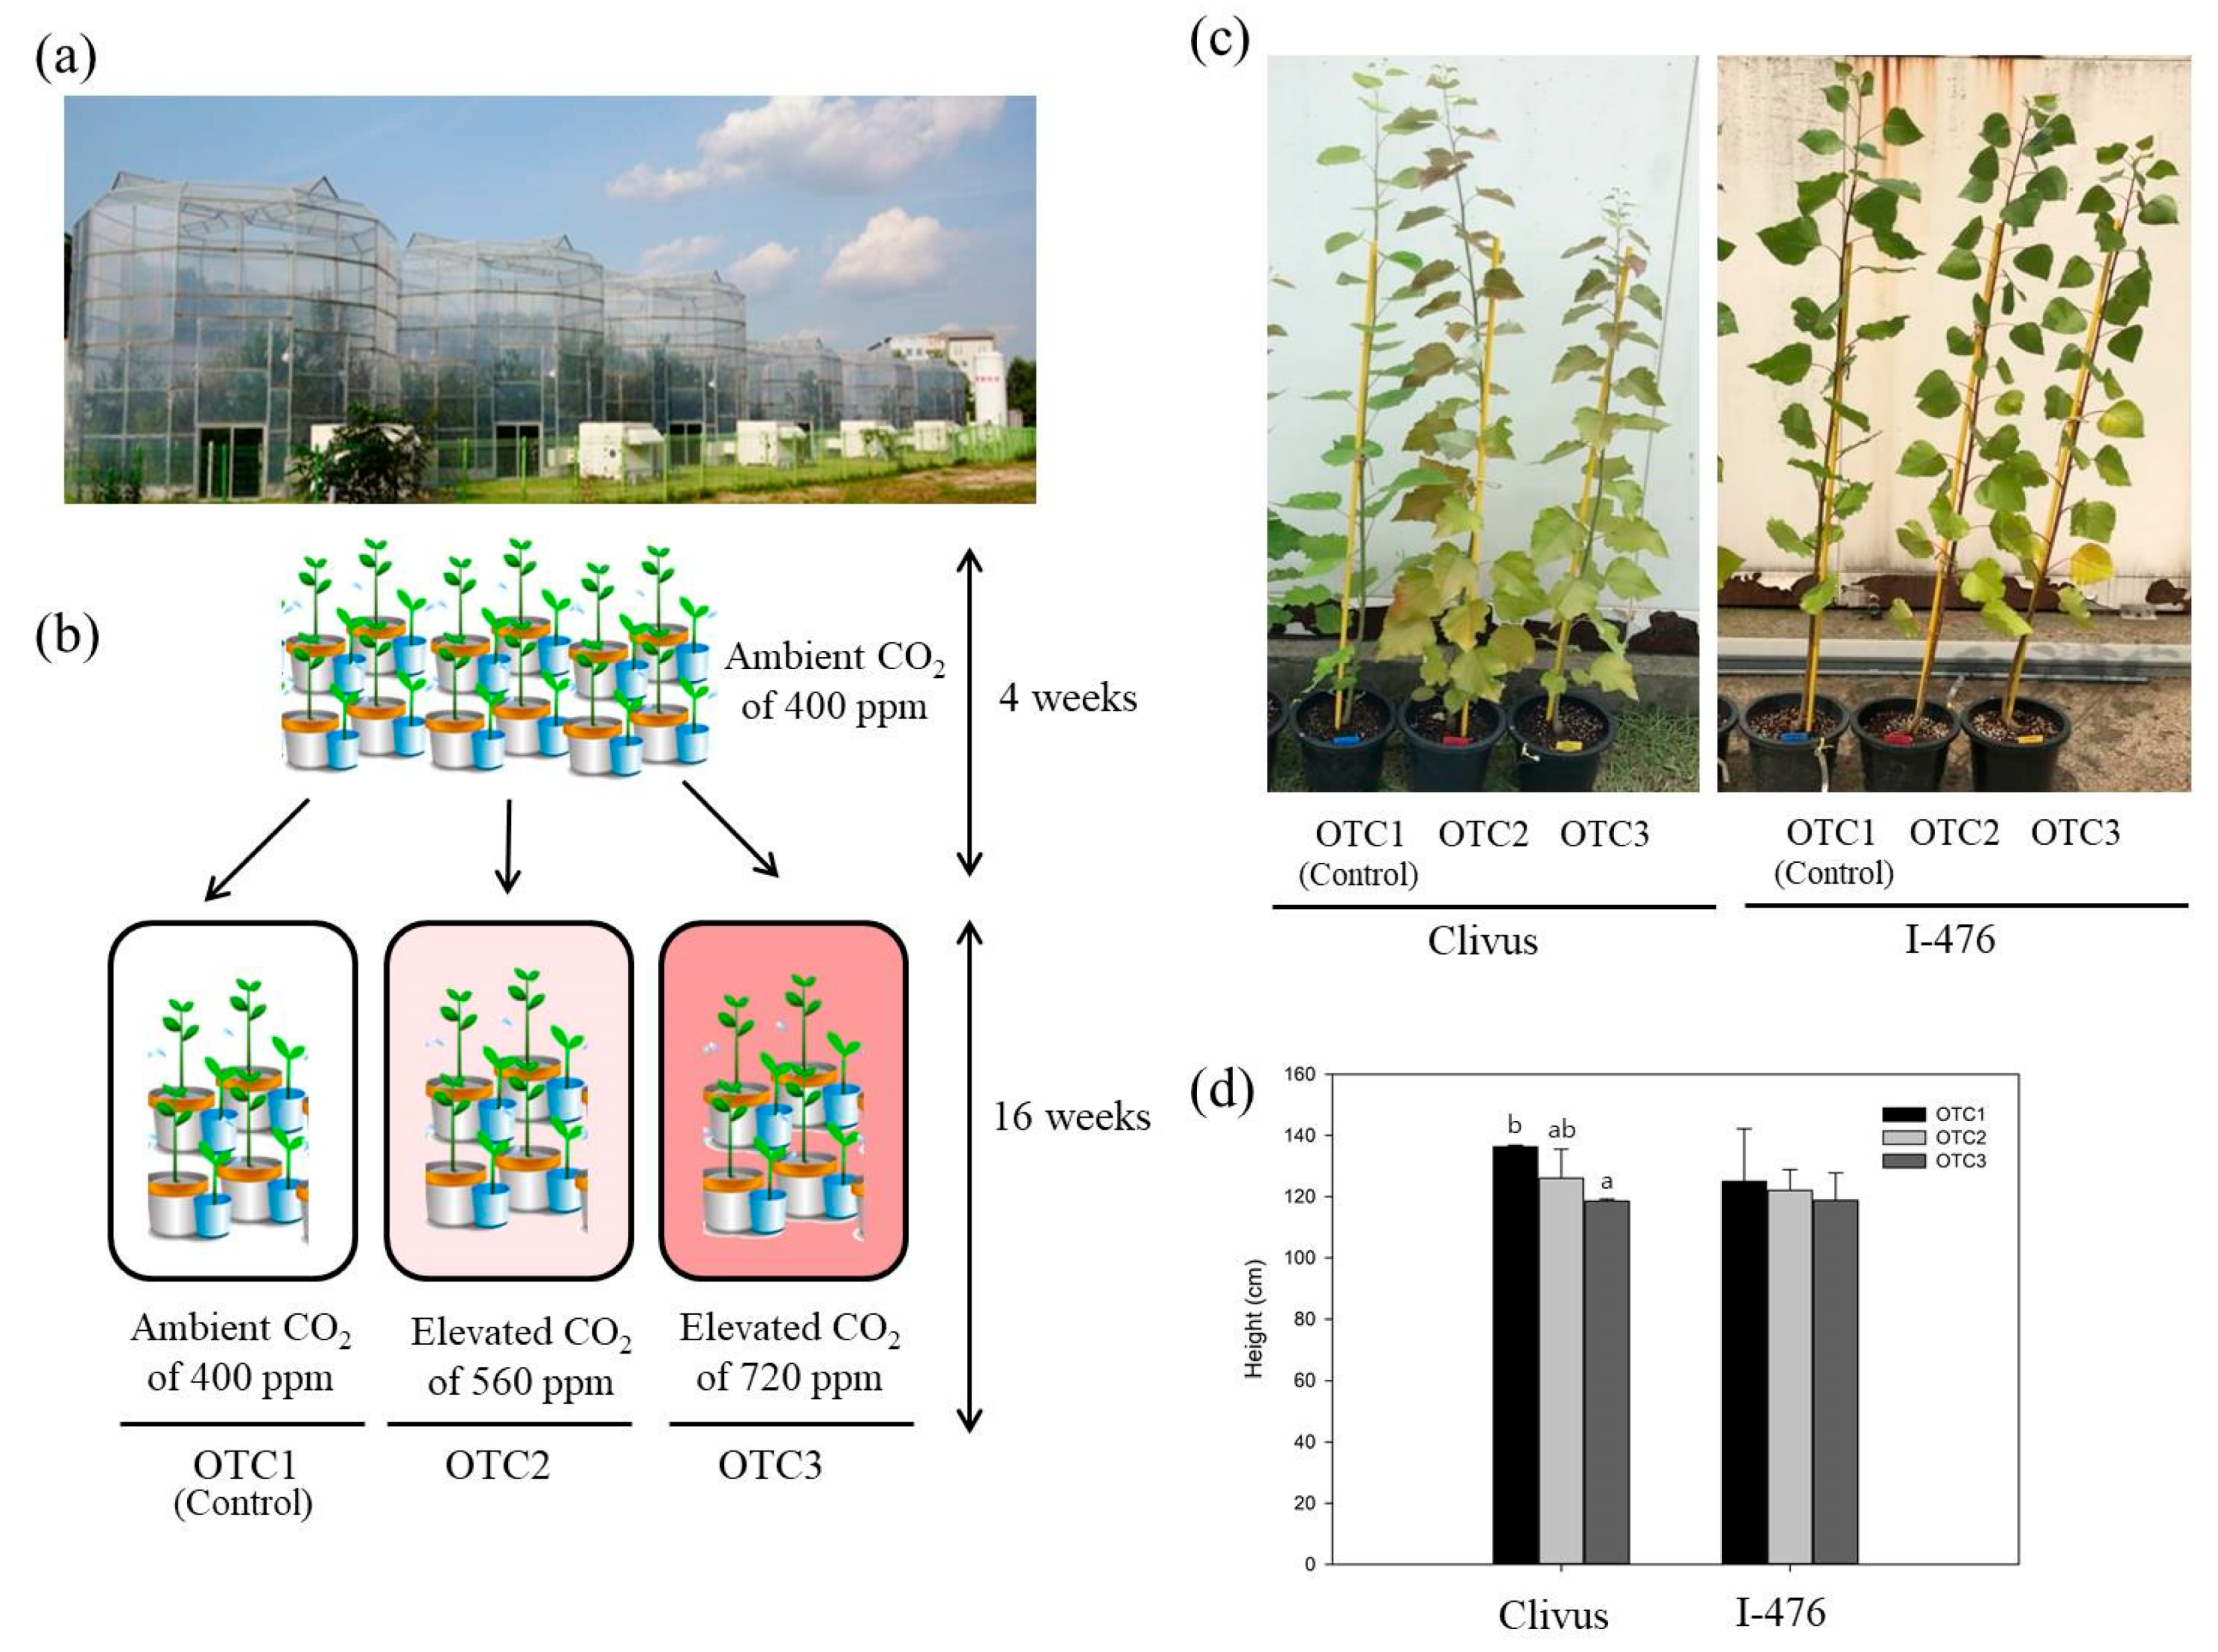
Poplar seedlings (Populus alba × Populus glandulosa hybrid “Clivus” clone and Populus euramericana “I-476” clone) were grown in pots containing appropriate soil moisture in the open-top chambers (OTCs) system (Figure 1). These Populus clones were used as solitary maternal plants. Rooted cuttings from these maternal Populus clones were cultivated in pots in a greenhouse for 4 weeks for acclimation and then transferred to OTCs. Ten plants were grown and 8 plants were used in the experiments. The experiment was conducted for 16 weeks in the National Institute of Forest Science in Suwon, Korea (37°15′04″ N, 136°57′59″ E), under natural environmental conditions [22]. Three treatment levels of CO2 concentration were applied to the OTCs: ambient (×1.0, ~400 ppm), ×1.4 (~560 ppm), and ×1.8 (~720 ppm). Although the air temperature inside was 1.2–2.0 °C higher than that of the outside, the temperature differences among the OTCs were less than 0.2 °C.
2.2. Measurement of the Chlorophyll Content
The chlorophyll content was determined according to the method of Sibley et al. (1996) [23]. From all treatments, 0.1 g fresh samples were taken in triplicate, homogenized thoroughly with dimethyl formamide (DMF) and centrifuged at 14,000× g for 10 min at 4 °C. The supernatant was used as the chlorophyll source. The chlorophyll levels were determined by reading the supernatant absorbances at 647 nm and 664 nm with a Biospectrometer (Eppendorf, Hamburg, Germany). The chlorophyll contents and their means were calculated as follows for each plant and treatment:
- Chlorophyll a = 12.7A664 − 2.79A647.
- Chlorophyll b = 20.7A647 − 4.62A664.
- Carotenoids = (1000A470 − 1.82Chl a − 85.02Chl b)/198.
(A, absorbance; pigment concentration in mg/g fresh weight (FW)).
2.3. Extraction and Measurement of Starch and Soluble Sugar
To extract metabolites, approximately 0.1 g poplar leaves from the plants grown for 16 weeks were ground in liquid nitrogen to a fine powder, and then the pulverized tissues were extracted twice with 80% (v/v) ethanol at 80 °C. To analyze starch content, the resulting sediments from aqueous ethanol extractions were re-suspended in distilled H2O and enzymatically digested to glucose according to the method described by Walters et al. (2004) [24]. The sugar concentrations were determined enzymatically by a method described by Stitt et al. (1989) [25] using a Biospectrometer (Eppendorf, Hamburg, Germany).
Total soluble sugars were extracted from leaf tissues by 80% ethanol by a modified method of Irigoyen et al. (1992) [26] as follows. After fresh weight determination, the leaves were homogenized by grinding in liquid nitrogen with mortar and pestle. Then, 2 mL of 80% (v/v) ethanol was added and the sample was vortexed for 1 h. After centrifugation at 14,000× g for 10 min, the supernatant was collected. The supernatants were added with chloroform and completely mixed. After centrifugation at 14,000× g for 10 min, 50 μL of supernatant was reacted with 4.95 mL of freshly prepared anthrone reagent (500 mg anthrone + 50 mL 72% H2SO4) at 100 °C for 15 min. After cooling on ice, the total soluble sugar content was determined at 620 nm by a Biospectrometer (Eppendorf, Hamburg, Germany) using glucose as the standard.
2.4. Measurement of Malondialdehyde (MDA), Proline and H2O2
From each treatment, approximately 0.1 g of poplar leaves were harvested in triplicate and extracted with a buffer consisting of 20% TCA (w/v) and 0.5% thiobarbituric acid (TBA) (w/v), followed by warming at 95 °C for 30 min. The reaction was terminated by placing the mixture on ice for 30 min and then centrifuging it at 14,000× g for 10 min. The absorbance of the supernatant was read at 532 nm using a Biospectrometer (Eppendorf, Hamburg, Germany). The MDA content was derived according to the method of Heath and Packer (1968) [27].
Proline was extracted from a sample of 0.5 g fresh leaf samples in 3% (w/v) aqueous sulfosalicylic acid and estimated using the ninhydrin reagent according to the method of Bates et al. (1973) [28]. The absorbance of the fraction with toluene separated from the liquid phase was read at a wavelength of 520 nm. Proline concentration was determined using a calibration curve and expressed as mmol proline g−1 FW.
Hydrogen peroxide was measured spectrophotometrically after reaction with KI. The reaction mixture consisted of 0.5 mL 0.1% trichloroacetic acid (TCA), leaf extract supernatant, 0.5 mL of 100 mM K-phosphate buffer and 2 mL reagent (1M KI w/v in fresh distilled H2O). The blank probe consisted of 0.1% TCA, K-phosphate buffer, and KI reagent in the absence of leaf extract. The reaction was developed for 1 h in darkness and absorbance was measured at 390 nm. The amount of hydrogen peroxide was calculated using a standard curve prepared with known concentrations of H2O2 [29].
2.5. RNA Isolation, Library Preparation and qRT-PCR Analysis
Samples obtained from the leaves of eight plants in each CO2 treatment were frozen in liquid nitrogen, grinded, and stored at −80 °C. RNAs from 8 plants for each treatment were extracted, and equal amounts of RNA were pooled to obtain single RNA samples; RNA pools were used for RNA sequencing. cDNAs for qRT-PCR were synthesized from all 48 samples. Total RNA was isolated using a RNeasy plant mini kit (Qiagen, Hilden, Germany). Approximately 2 μg of RNA from each tissue was used to construct cDNA libraries for sequencing according to the Illumina TruSeq RNA Sample Preparation protocol. In short, the workflow included isolation of poly-adenylated RNA molecules using poly-T oligo-attached magnetic beads, enzymatic RNA fragmentation, cDNA synthesis, ligation of bar-coded adapters, and PCR amplification. The libraries were sequenced using an Illumina HiSeq 4000 platform with 101 paired-end sequences at the Macrogen (Korea).
For real-time quantitative RT-PCR analysis, first-strand cDNA was synthesized from 1 μg of DNase-treated total RNA using RNA to cDNA EcoDryTM Premix (TaKaRa, Shiga, Japan). All reactions were performed using the IQtm SYBR Green Supermix (BIO-RAD, Hercules, CA, USA) and carried out in a CFX96 Touch Real-Time PCR Detection System (BIO-RAD, Hercules, CA, USA) according to the manufacturers’ instructions. The gene-specific primers used for the quantitative RT-PCR were found in Supplementary Table S1. The reaction cycle was: 1 cycle of 95 °C for 30 s, followed by 40 cycles of 95 °C for 5 s, and 60 °C for 34 s. Relative quantification was performed to calculate expression levels of target genes in different treatments using the 2−ΔΔCt methods [30]. In the reaction plate, each sample was measured in triplicate. The expression level of ACTIN1 was used for the normalization of quantitative real-time PCR results [31].
2.6. RNA Sequencing Analysis
The sequenced raw reads from Populus young leaf tissues were processed with the following RNA sequencing pipeline. The quality of the RNA-Seq reads from all of the six tissues was checked using FastQC. The Trimmomatic software (v0.0.14) was used to process raw reads to remove adaptor sequences and low quality reads [32]. The obtained high quality reads were mapped into Populus alba reference genome (GCA_005239225.1_ ASM523922v1_genomic.fna) from NCBI (https://0-www-ncbi-nlm-nih-gov.brum.beds.ac.uk/genome/13203, accessed on 15 January 2020) using Hisat2 [33]. Further, SAMtools was implemented to convert SAM files from BAM files [34]. Then, we used Feature Counts [35] to estimate the uniquely mapped gene counts by using Populus alba genome annotation (GCA_005239225.1_ASM523922v1_ genomic.gff).
2.7. Differentially Expressed Gene (DEG) Analysis
The generated gene count files from each Populus tissue (Clivus_OTC1 (C_01), Clivus_OTC2 (C_02), Clivus_OTC3 (C_03), I-476_OTC1 (I_01), I-476_OTC2 (I_02), and I-476_OTC3 (I_03)) were used for differential expression genes analysis using DEseq2 version 1.20 package in R analysis environment [36]. Further, Fisher’s exact test and likelihood ratio test methods were implemented to perform differential expression analysis of digital gene expression data following a binomial distribution. This experiment lacks biological replicates and log2 fold change ≥2 was used as a threshold to identify the DEGs. Further, only DEGs with a gene symbol were considered for downstream analysis. Common DEGs in both clones from all comparison (400 vs. 560, 400 vs. 720, and 560 vs. 720) were extracted using Venny 2.1.0 for further understanding.
2.8. Annotation of DEGs
The Omicsbox (Blast2GO) program (Biobam, Purchased version, Valencia, Spain) was used to perform functional annotation analysis. In detail, we performed a BLASTx program-based homology search for the Populus alba gene sequences against the Arabidopsis protein database (NCBI Arabidopsis protein sequences https://ftp.ncbi.nlm.nih.gov/genomes/all/GCF/000/001/735/GCF_000001735.4_TAIR10.1/GCF_000001735.4_TAIR10.1_protein.faa.gz, accessed on 3 February 2020) using a cutoff E-value < 10−5 and a maximum number of allowed hits were fixed at 10 per query. The alignment results with the smallest E-value were considered to select best top hits. Further, GO (Gene Ontology) terms were identified for all genes which are associated from BLASTx (NCBI, https://blast.ncbi.nlm.nih.gov/, accessed on 11 February 2021) search results with Omicsbox (Biobam, Spain, https://www.biobam.com/omicsbox/, accessed on 11 February 2021) and WEGO (Web Gene Ontology Annotation Plot) (http://wego.genomics.cn, accessed on 4 October 2020) used for plotting [37]. The corresponding Arabidopsis gene symbol, along with DEG specific fold values, were used to perform gene set enrichment analysis by WebGestalt (http://www.webgestalt.org/, accessed on 2 May 2020) [38]. Cluster analysis was performed using ClustVis (https://biit.cs.ut.ee/clustvis/, accessed on 11 February 2021) [39].
2.9. Statistical Analysis
Analyses were carried out using a one-way ANOVA with multiple comparisons using Dunnett’s T3 or Tukey’s HSD. p-values < 0.05 were considered significant. Values are presented as means with SD.
3. Results
3.1. Growth and Physiological Changes in Response to Elevated CO2
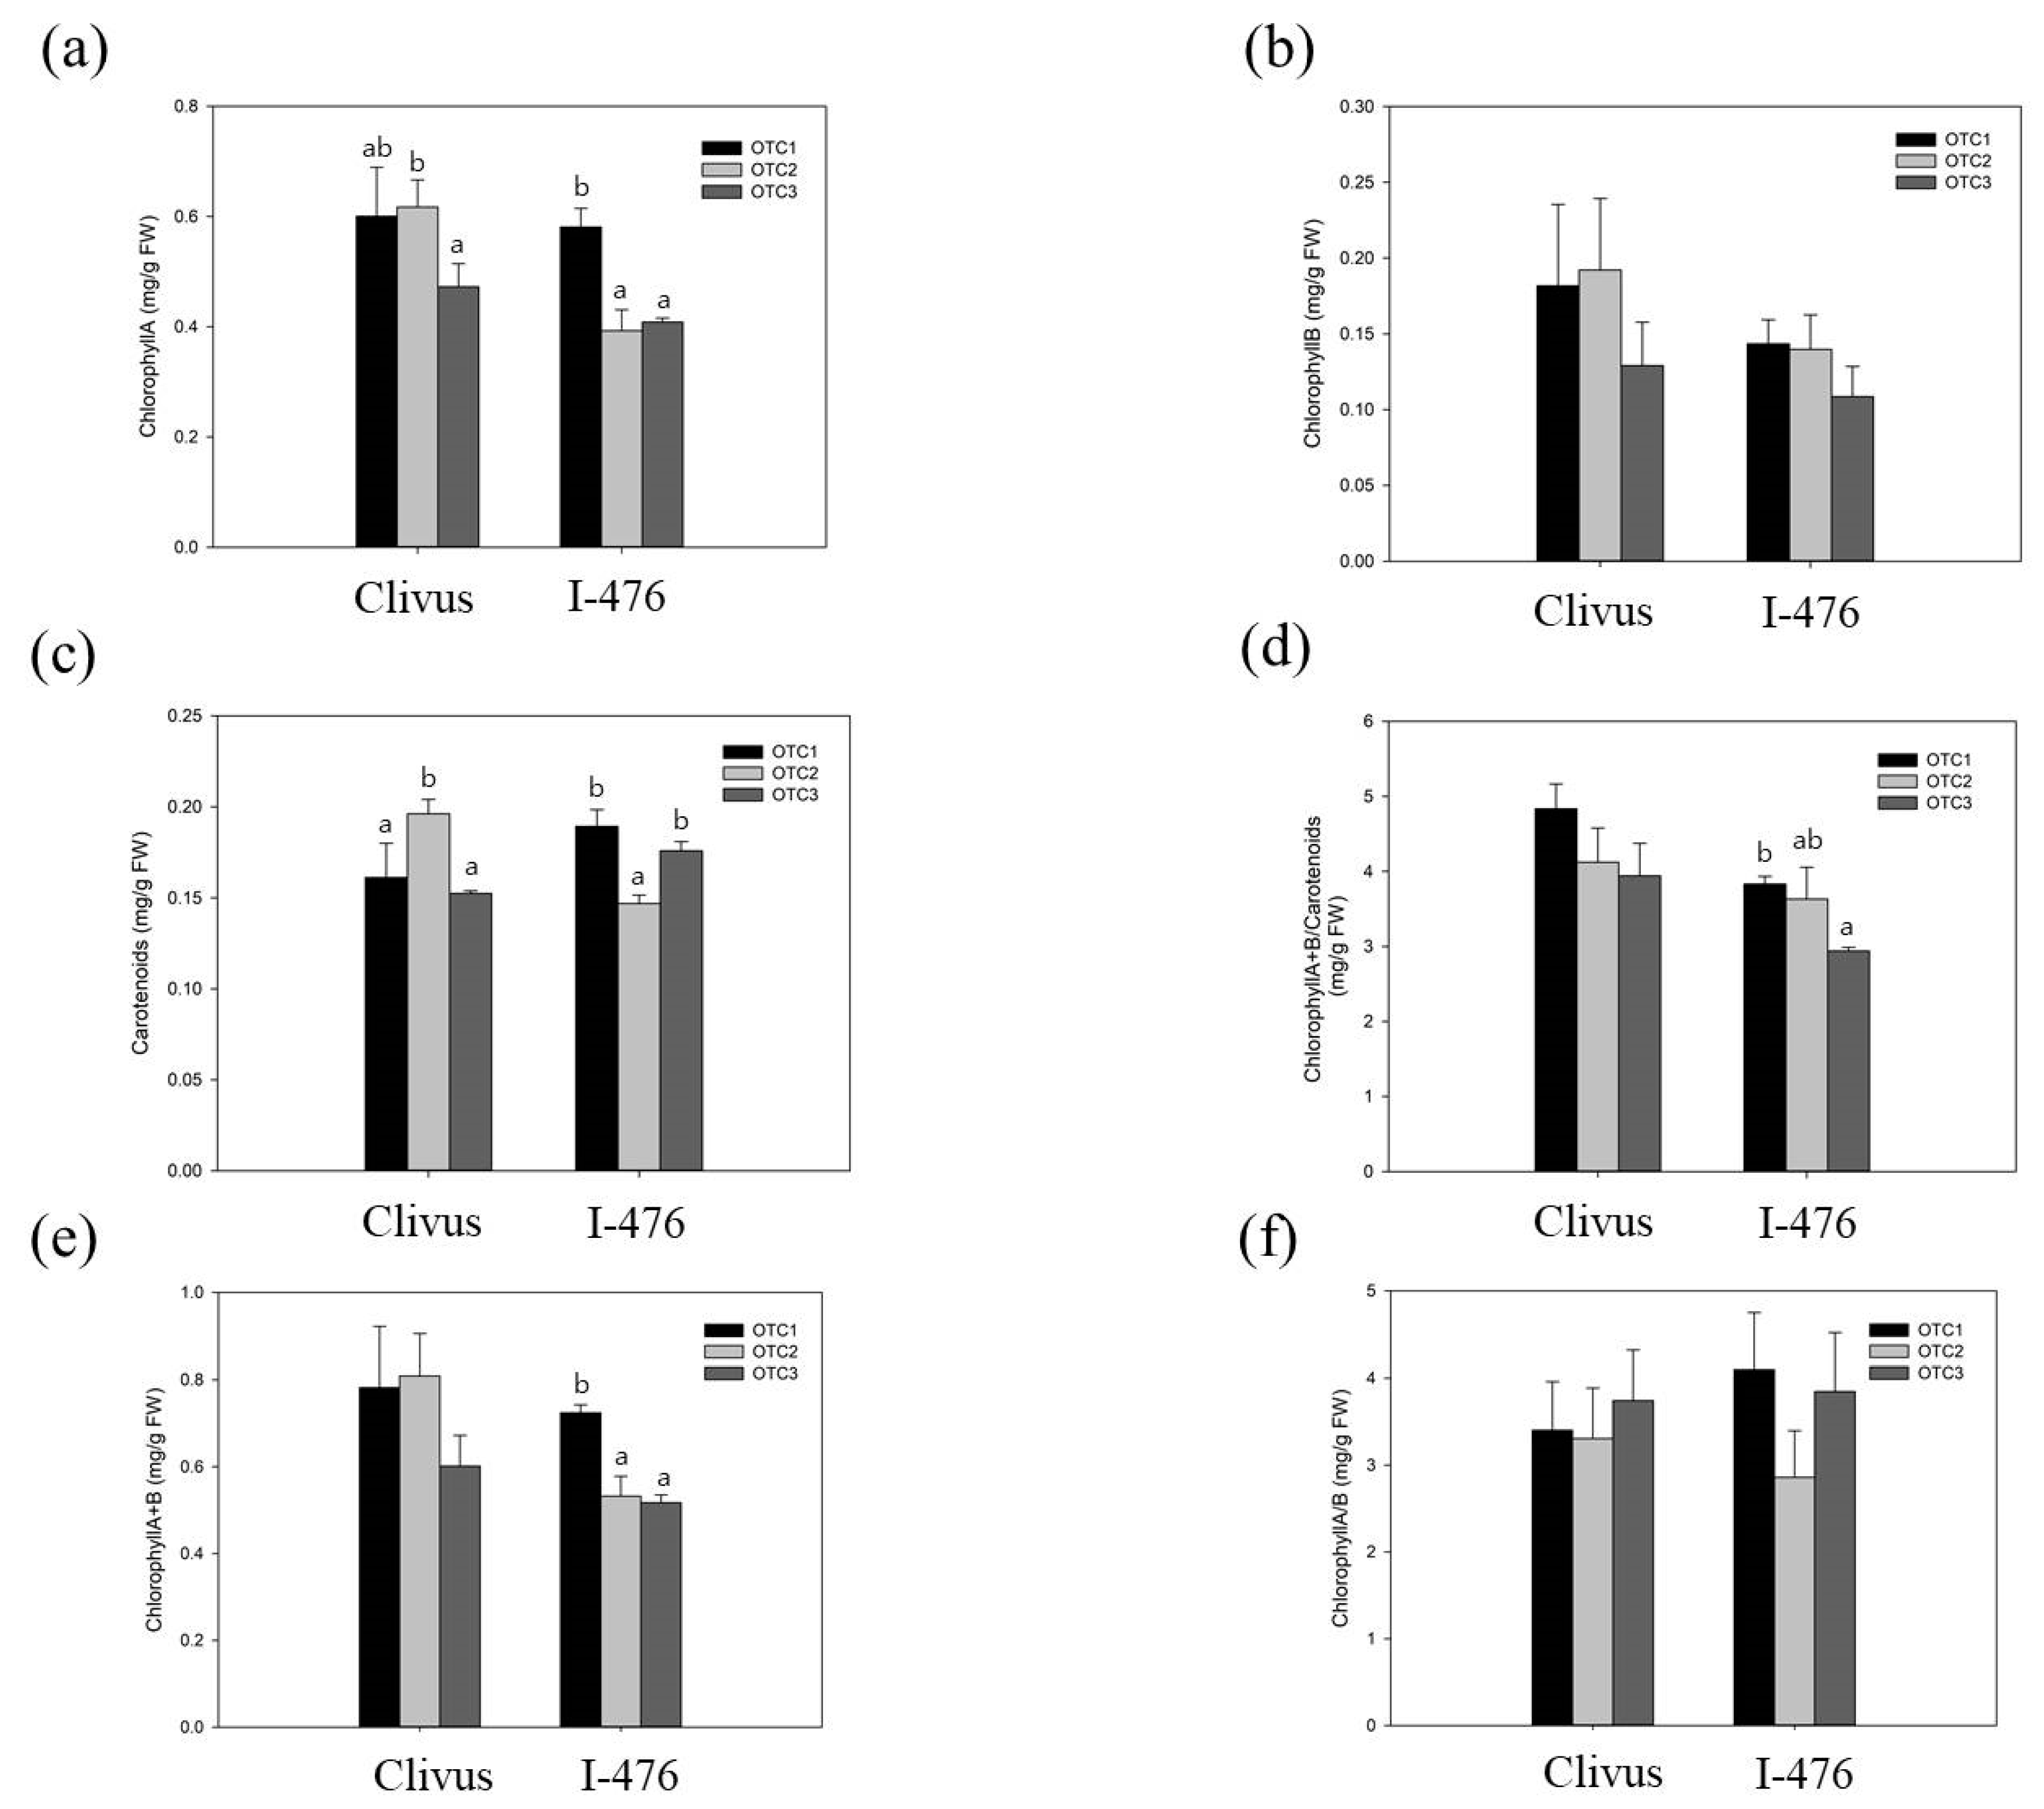
We observed the phenotypes and measured the physiological changes of the two poplars’ leaves at the seedling stage. The height of the Clivus grown with an elevated CO2 level of 720 ppm was significantly reduced as a response to elevated CO2 (Figure 1). However, except this instance, there were no significant physiological differences observed between ambient or elevated CO2 poplar plants. The leaves’ chlorophyll content was correlated with photosynthetic activity, and the chlorophyll levels were affected by elevated CO2. The chlorophyll A content of I-476 poplar was significantly reduced at elevated CO2 levels (560 and 720 ppm). Furthermore, in I-476, reduced chlorophyll: carotenoid content was also observed at elevated CO2 (720 ppm) compared to the controls (Figure 2). In addition, the total chlorophyll content of I-476 poplar was also significantly reduced at elevated CO2 levels. In both Clivus and I-476, there was a change in carotenoids at an elevated CO2 level of 560 ppm. Except for the above-mentioned changes, we found no significant changes in the levels of photosynthetic pigments in poplar grown in any CO2 conditions.
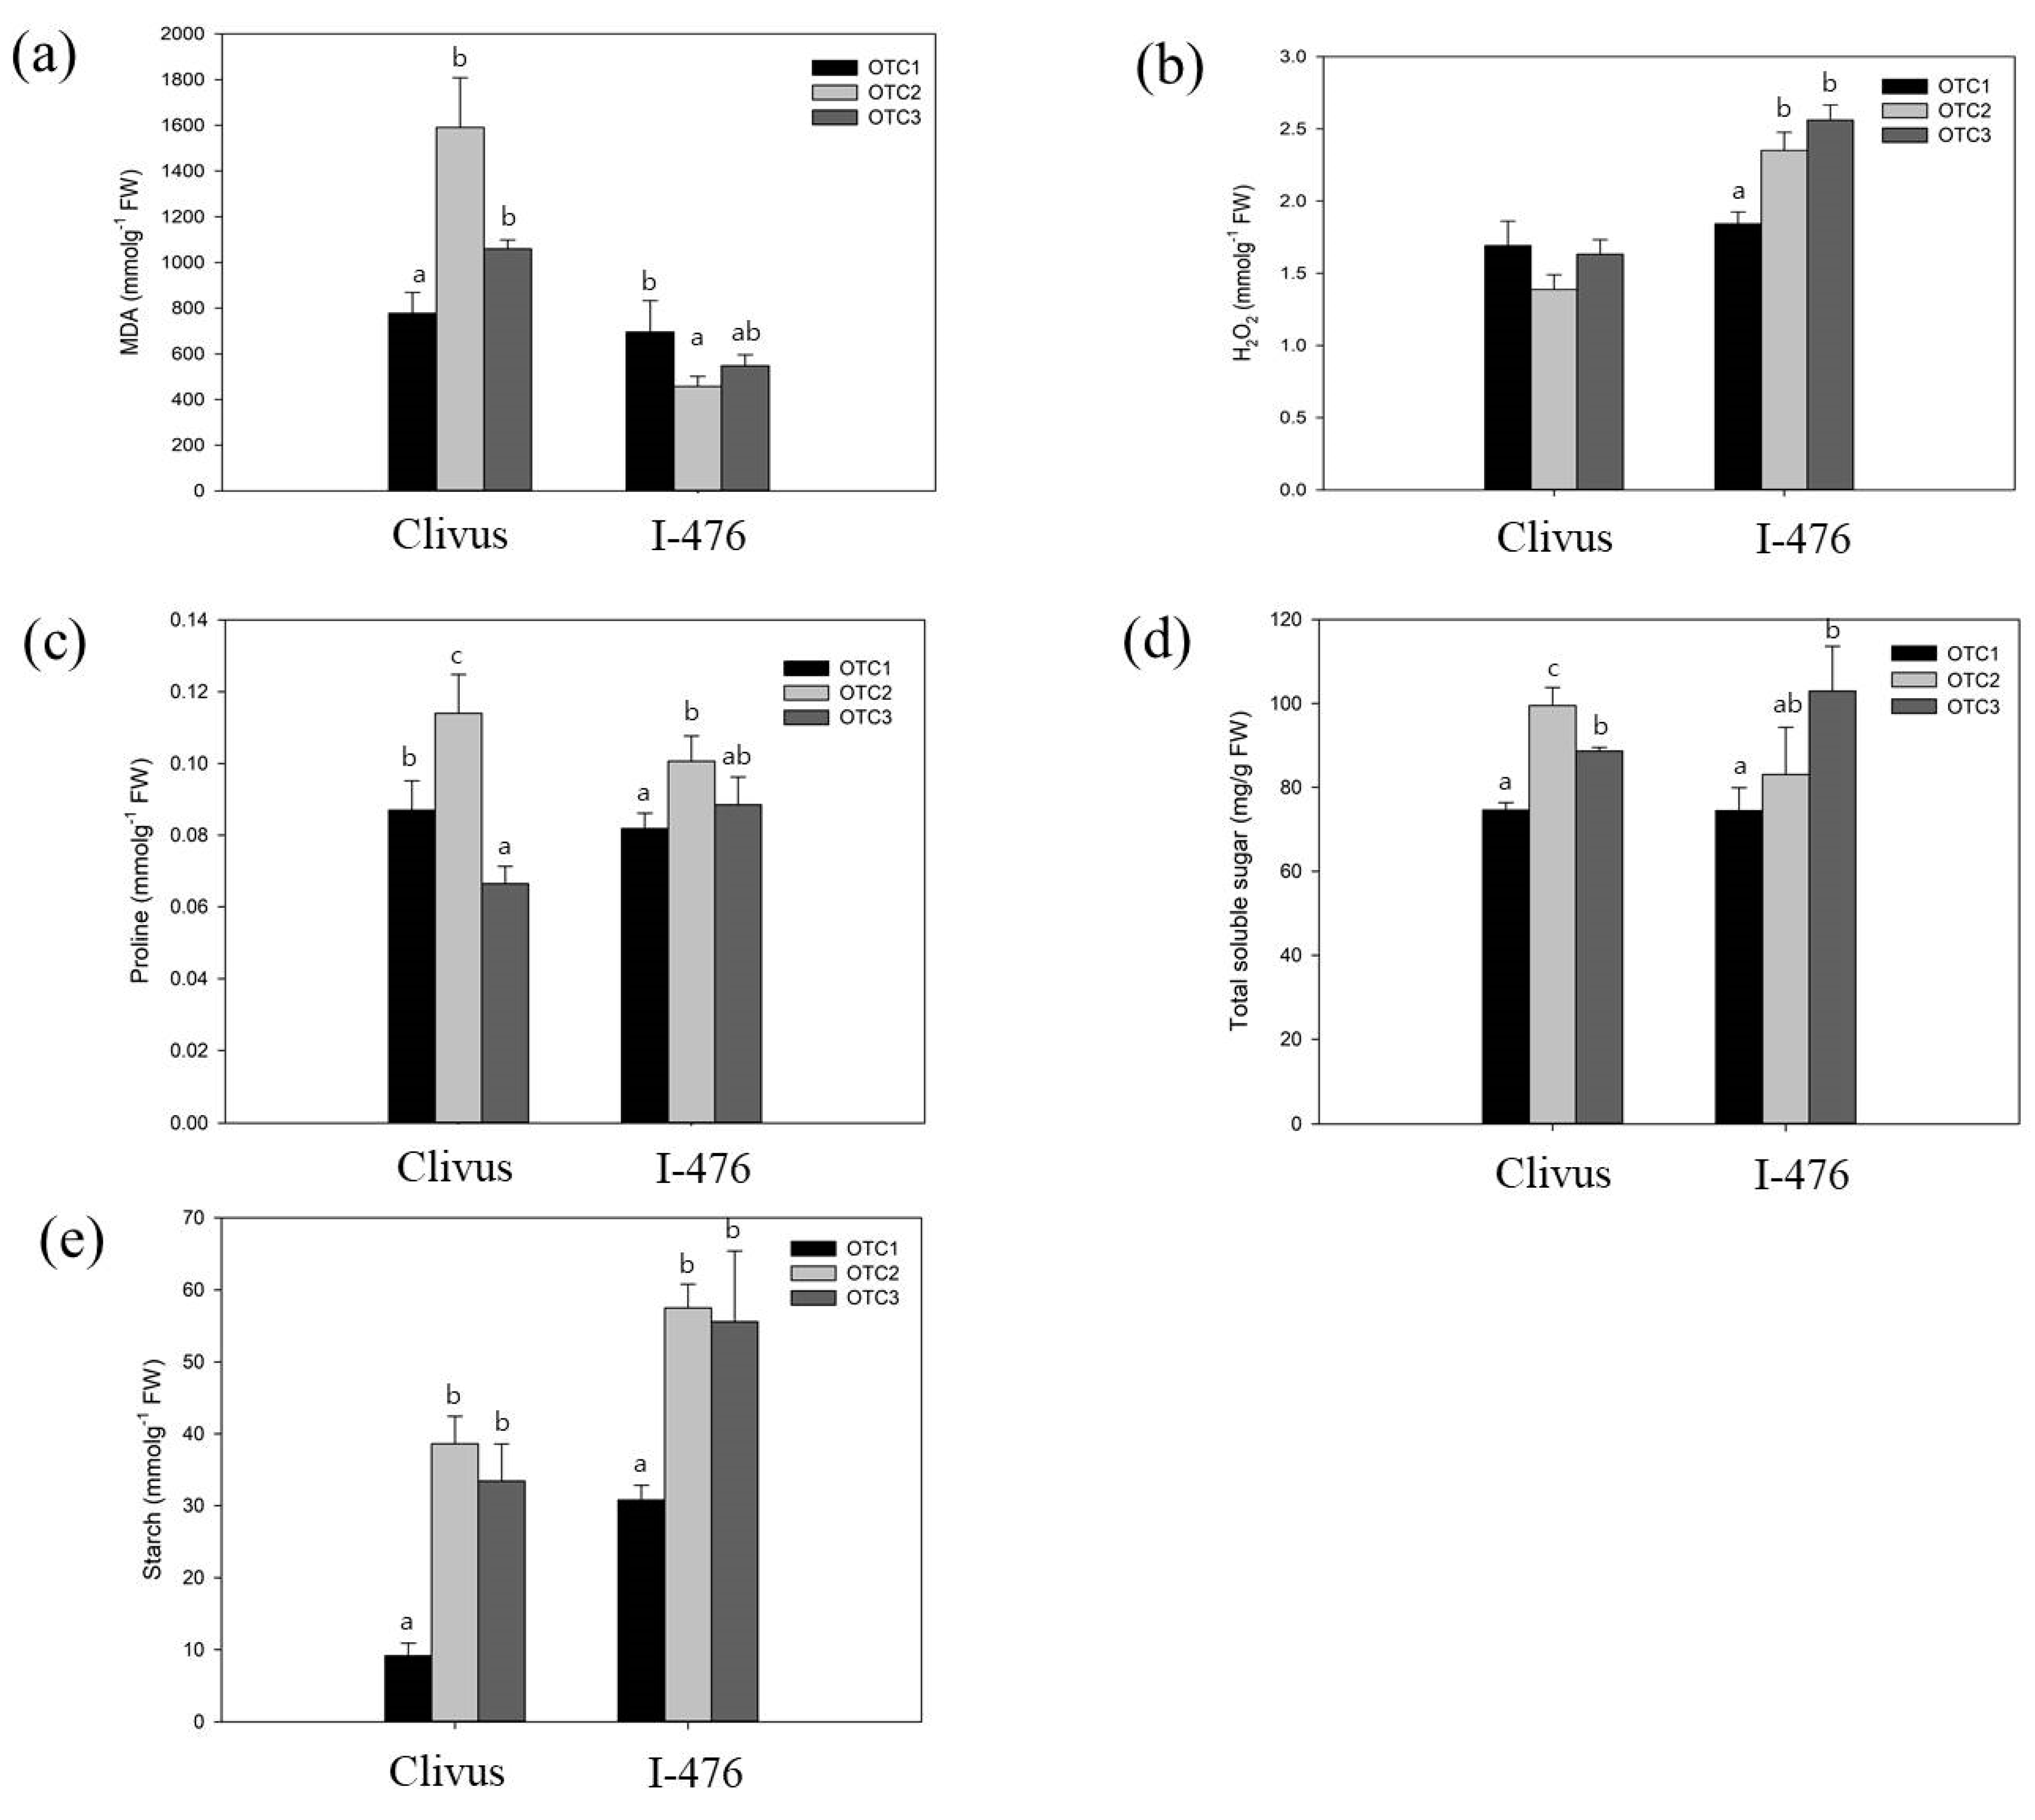
To investigate the effects of elevated CO2 on the carbon metabolism and stress-responsive elements, the MDA, H2O2, proline, and soluble sugar contents were examined. The MDA content was measured to determine the degree of tissue damage caused by stress [40]. The change in H2O2 content is a good indicator of the state of the ability to remove free radicals in oxidation stress [40]. Elevated CO2 increased the concentrations of MDA, proline, total soluble sugar, and starch in leaves of the Clivus, but did not alter the concentration of H2O2. In contrast, elevated CO2 significantly increased the concentration of H2O2, proline, total soluble sugar, and starch in leaves of the I-476. Only the level of MDA at 520 ppm decreased in I-476. In particular, elevated CO2 tended to increase the concentration of starch in both the Clivus and I-476 (Figure 3).
3.2. RNA Sequencing Analysis
RNA-Seq analysis was performed in order to study the differential gene expression patterns exerted in response to elevated CO2 treatments in two poplar species (Clivus and I-476). After the adapter trimming and quality check, the clean reads were mapped to the reference genome Populus alba. The mapping percentage varied significantly between the species; Clivus (P. alba × P. glandulosa hybrid) showed higher percentage matching than the I-476 (P. euramericana), as expected. The detailed report on raw read number, data in GB, clean read number and clean read rate for each comparison are detailed in Table 1. The quality score, Q30 clean base rate, was approximately 94% in all comparisons (Table 1).
3.3. Differentially Expressed Genes (DEGs)
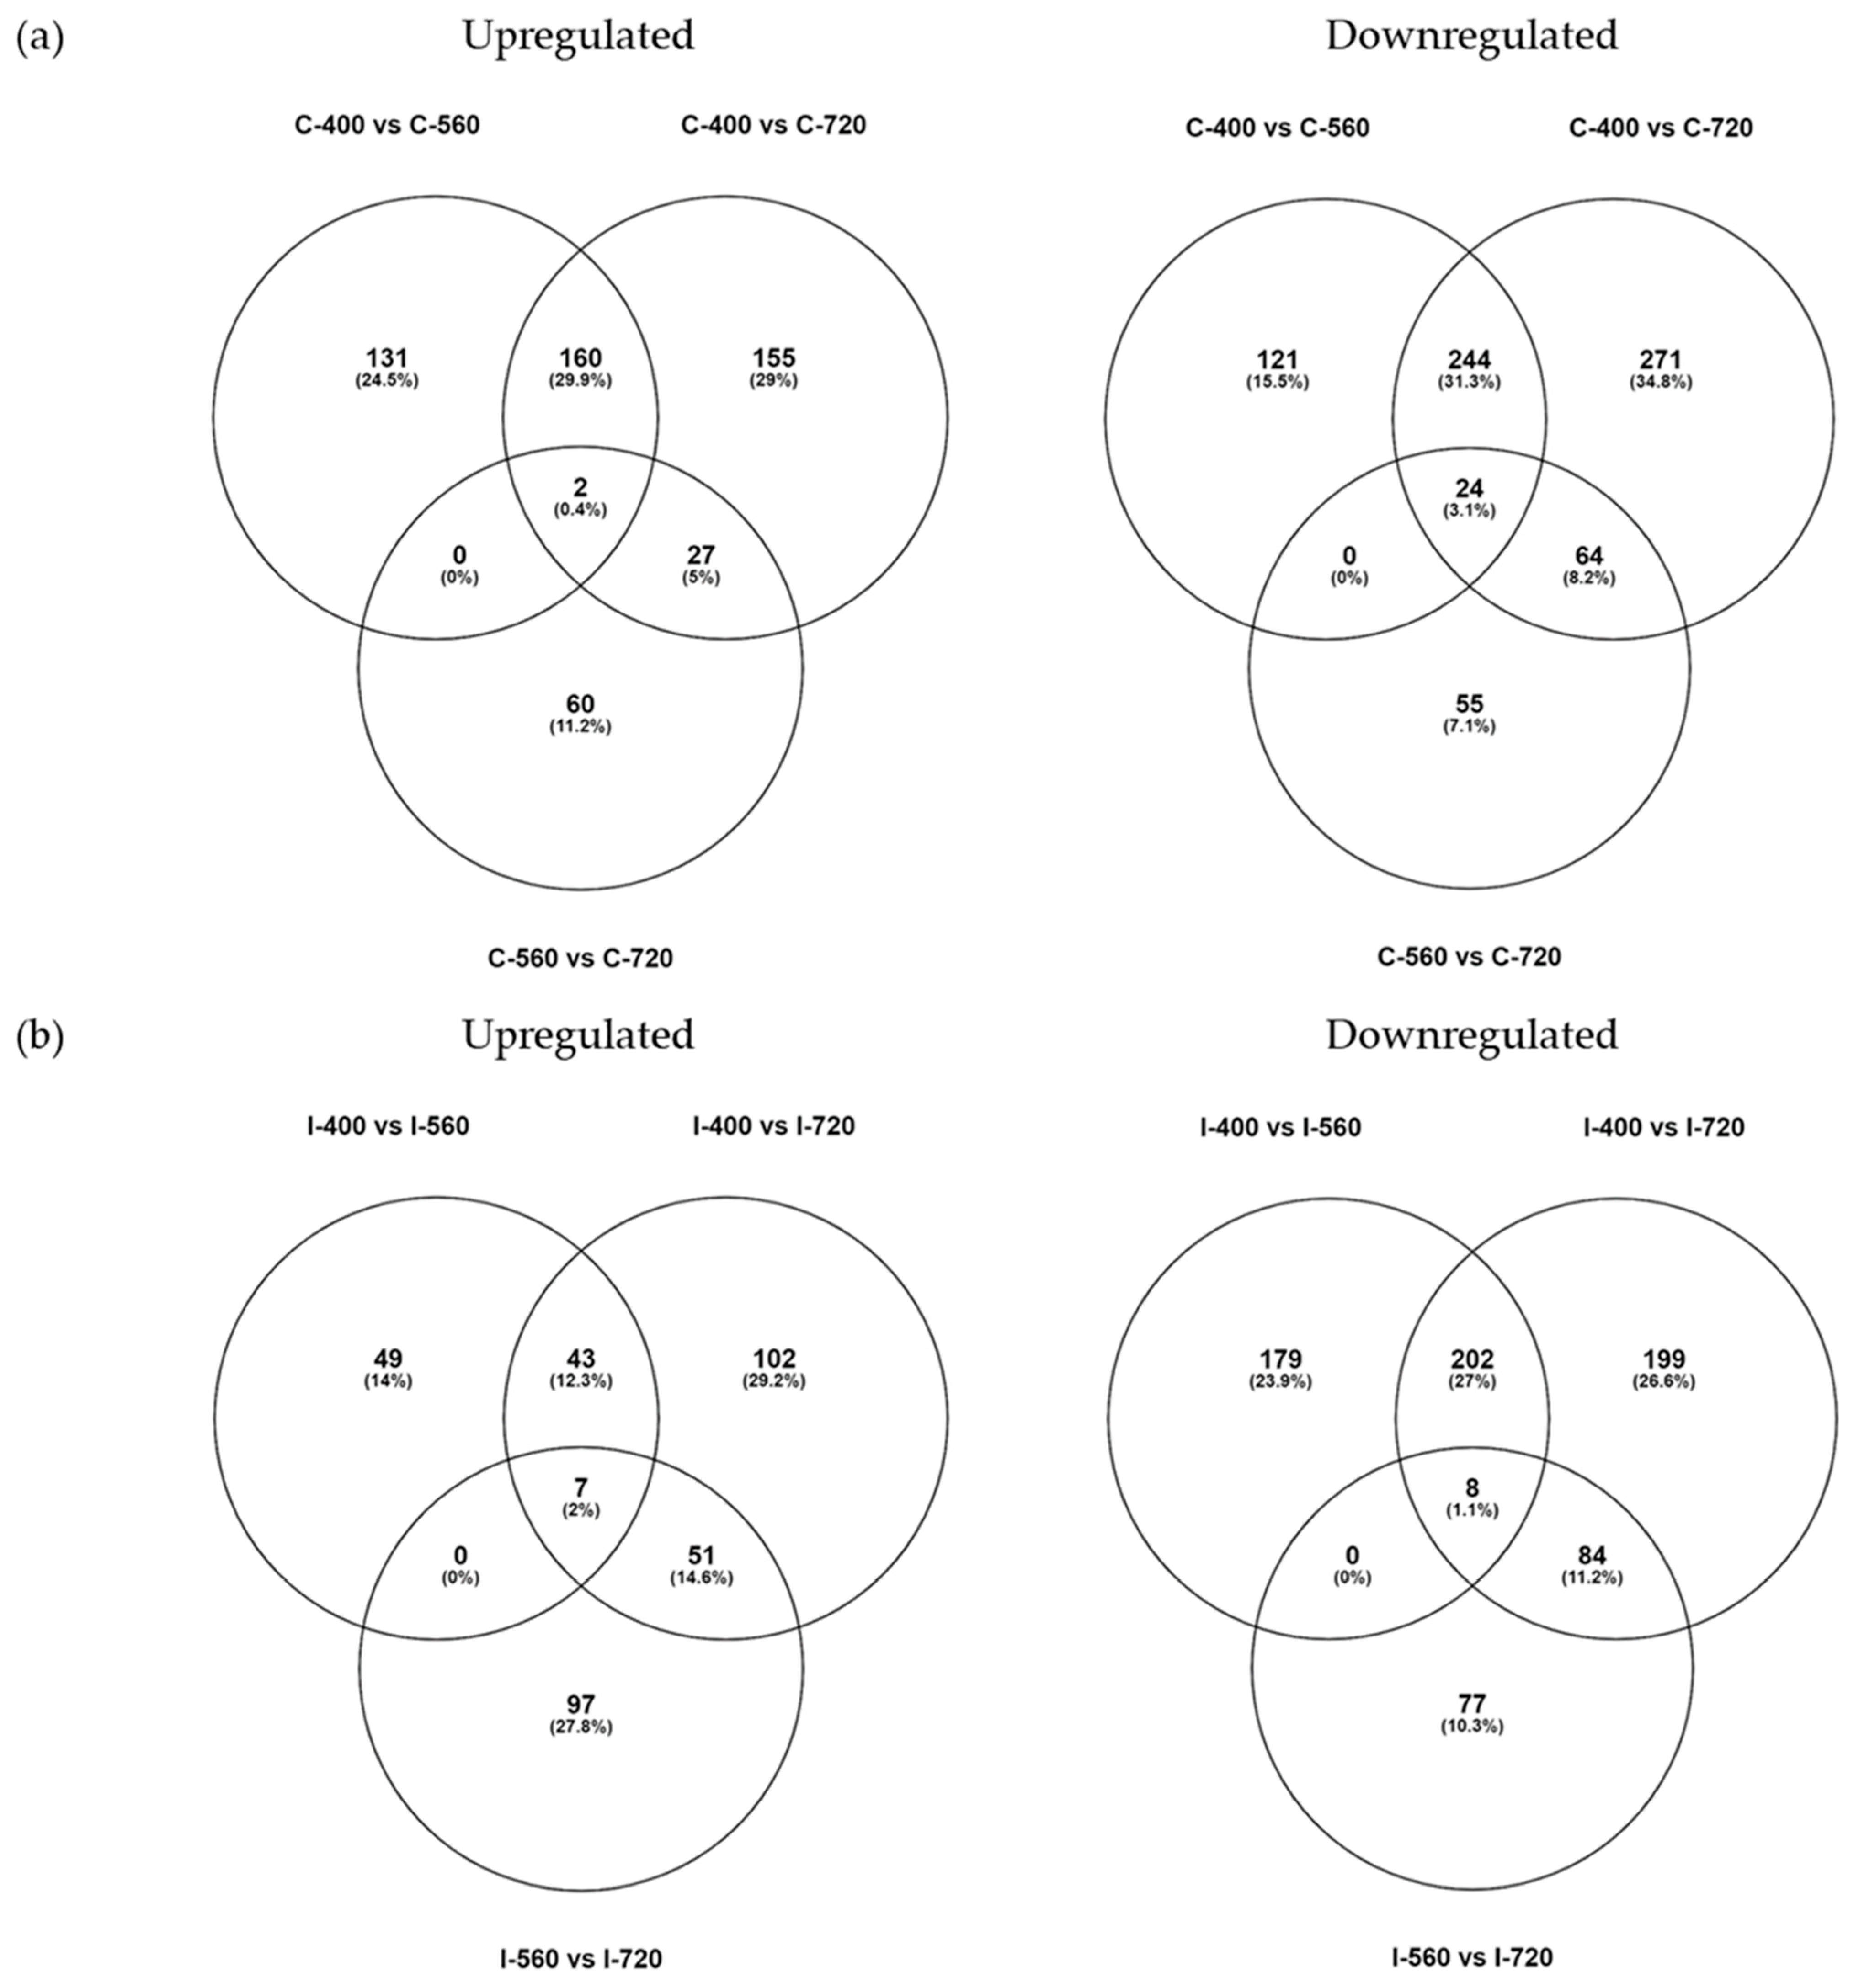
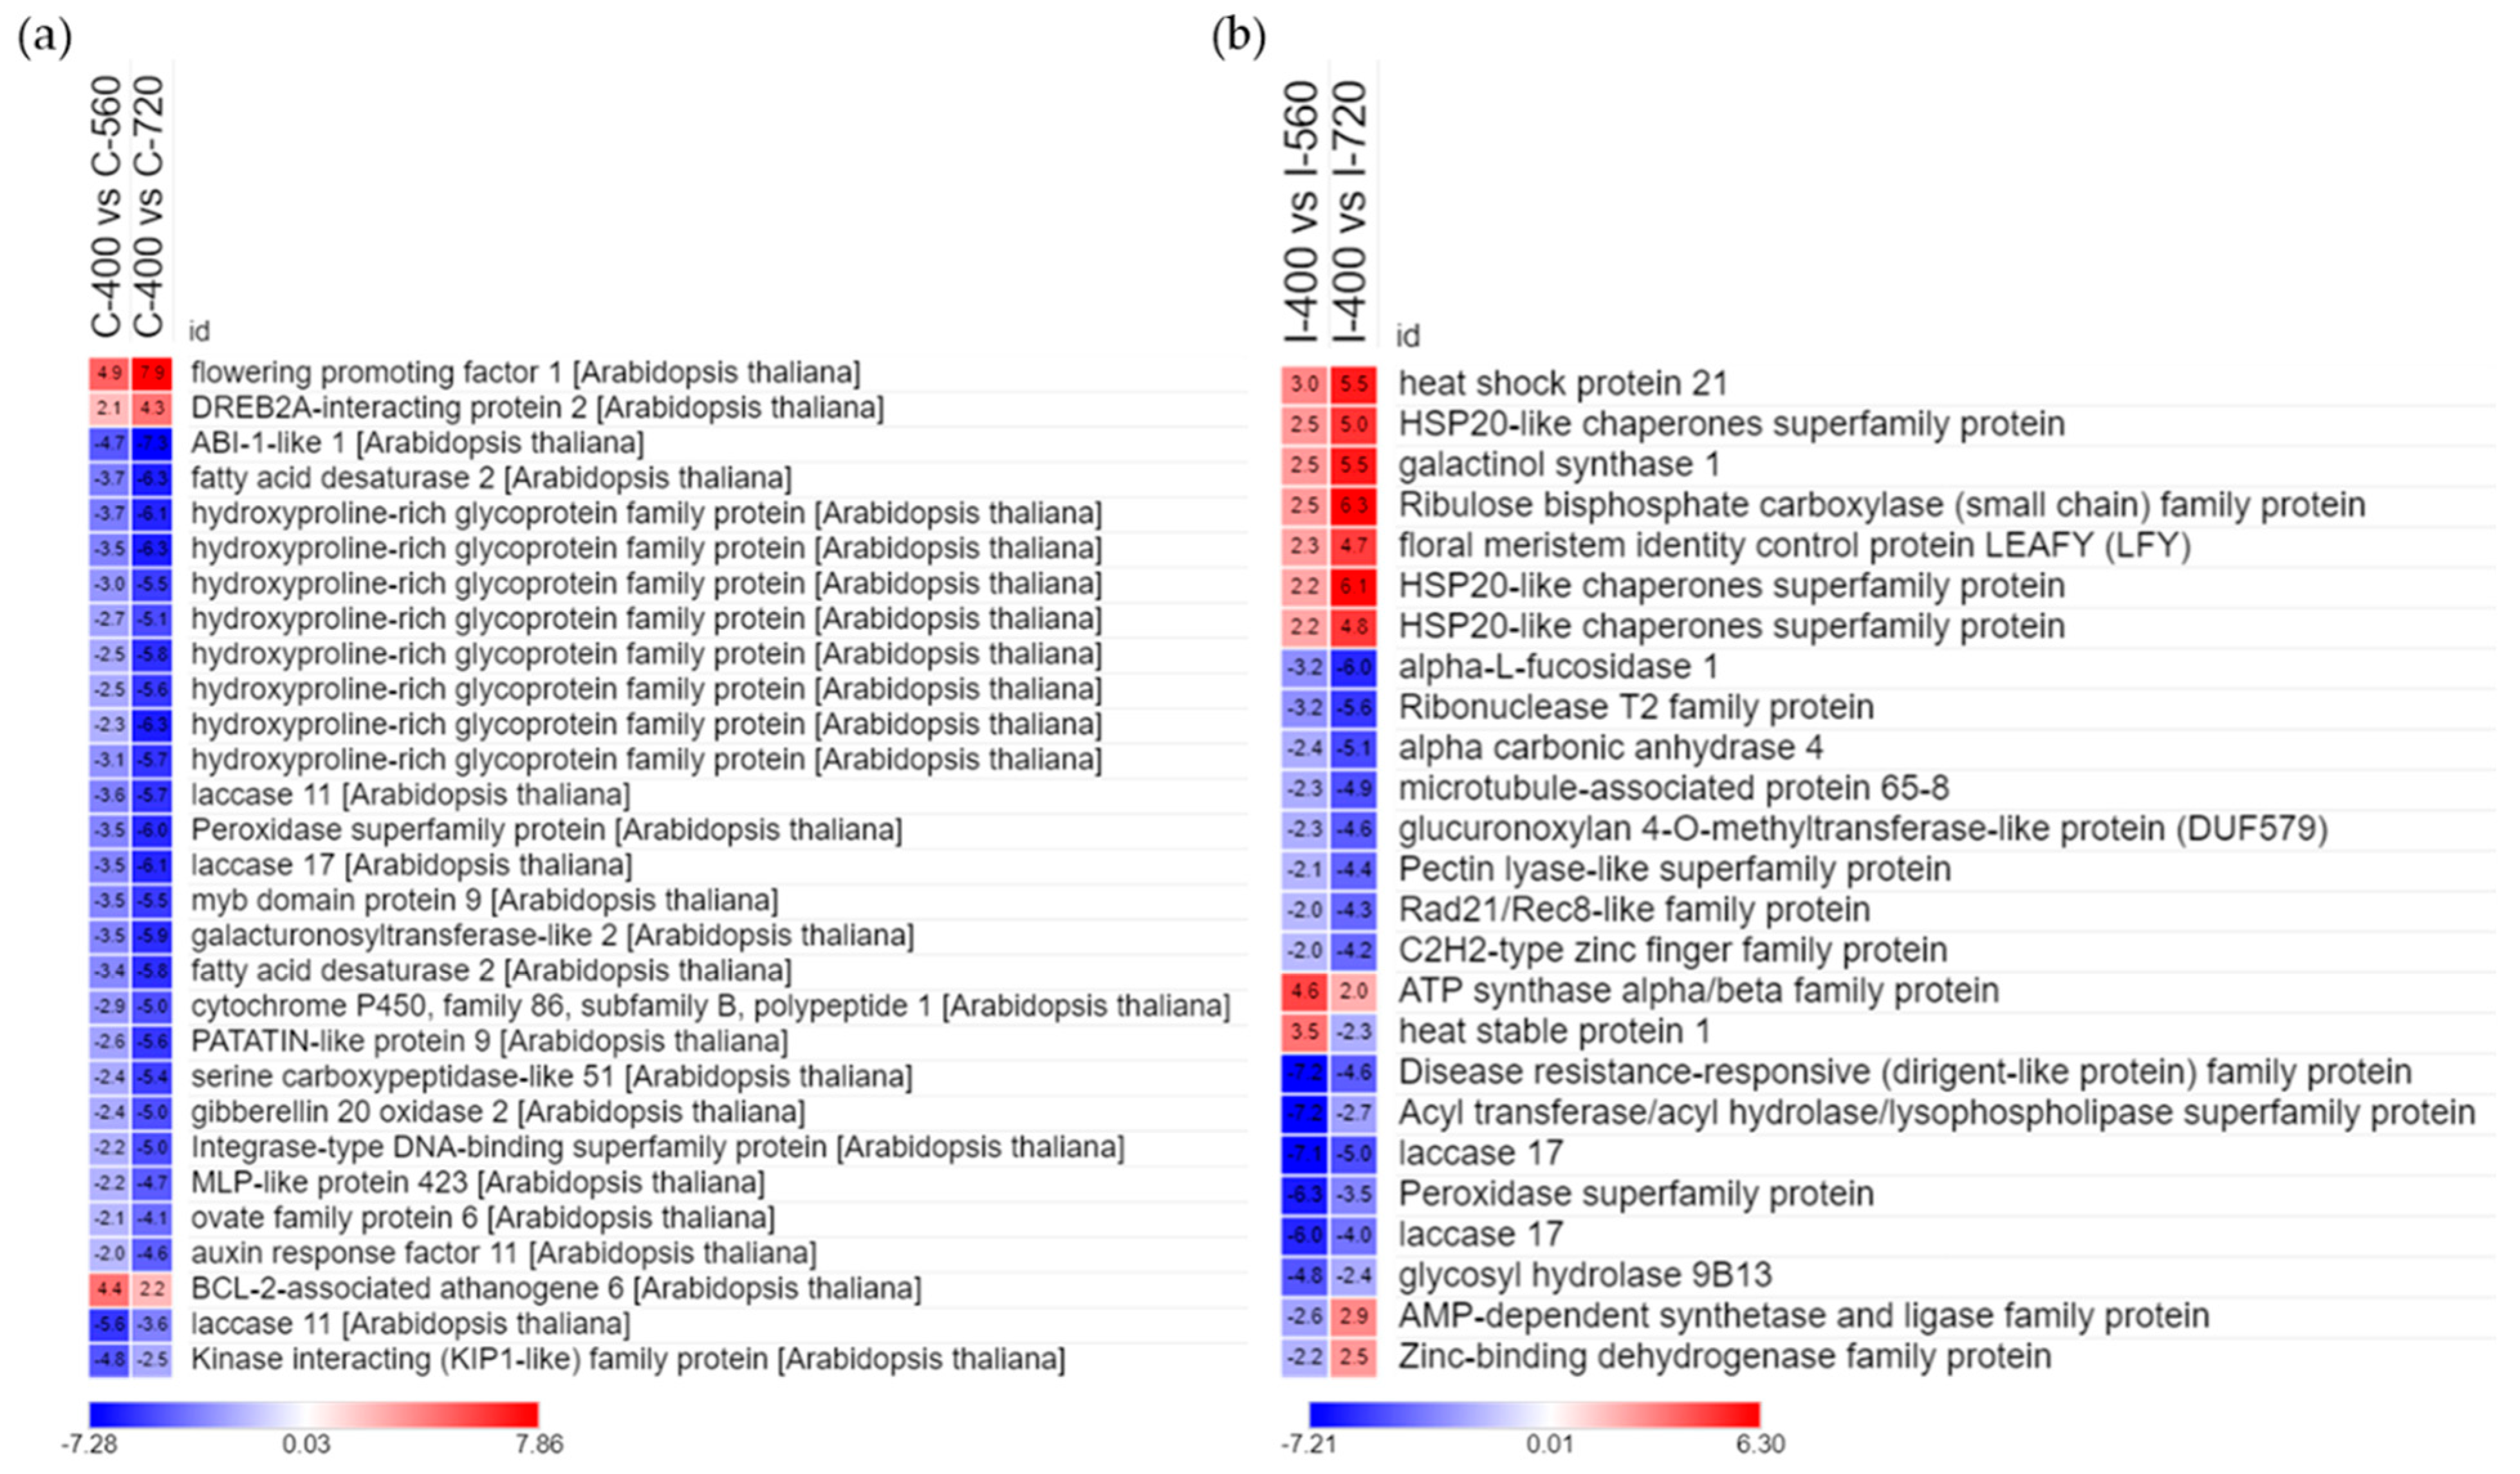
The DEG analysis was used as an exploratory data to identify the genes responsive to elevated CO2 treatment (Supplementary Figures S1 and S2). Elevated CO2 treatment displayed a change in expressed genes in both the clones (Figure 4). Clivus clone showed a greater number of DEGs than I-476 in all comparisons (400 vs. 560, 400 vs. 720, and 560 vs. 720). The higher percentage of mapping observed in Clivus clone to Populus alba reference genome might be the reason for the distinct number of DEGs observed between clones. DEGs that were consistently expressed genes in both elevated CO2 treatment could be candidate responsive genes for elevated CO2 treatment in poplar clones. Therefore, we extracted common DEGs from all comparisons. A total of 29 common genes were observed in Clivus, of which two were upregulated and 24 downregulated (Figure 4). Most of these DEGs belong to the cell wall protein family, especially hydroxyproline-rich glycoproteins (HRGP) [41,42], and the fatty acid metabolism pathway (Figure 5a). HRGP are proline-rich cell wall proteins that have a wide range of functions in signal transduction cascades, such as plant development and stress tolerance. As observed in Figure 5a, the last three genes showed increased or decreased expression in comparison 400 vs. 560, while increasing the CO2 concentration (400 vs. 720) did not show concomitant increase or decrease. Similarly, in I-476, there were seven genes upregulated and eight genes downregulated in both the elevated CO2 treatment compared to ambient CO2 concentration, and the last 10 genes showed varied expression pattern when CO2 increased. Common DEGs obtained in the I-476 clone belonged to the HSP chaperone family and metabolic pathways, especially photosynthesis, nitrogen metabolism, and carbon metabolism (Figure 5b).
3.4. Functional Classification of Two Populus Species
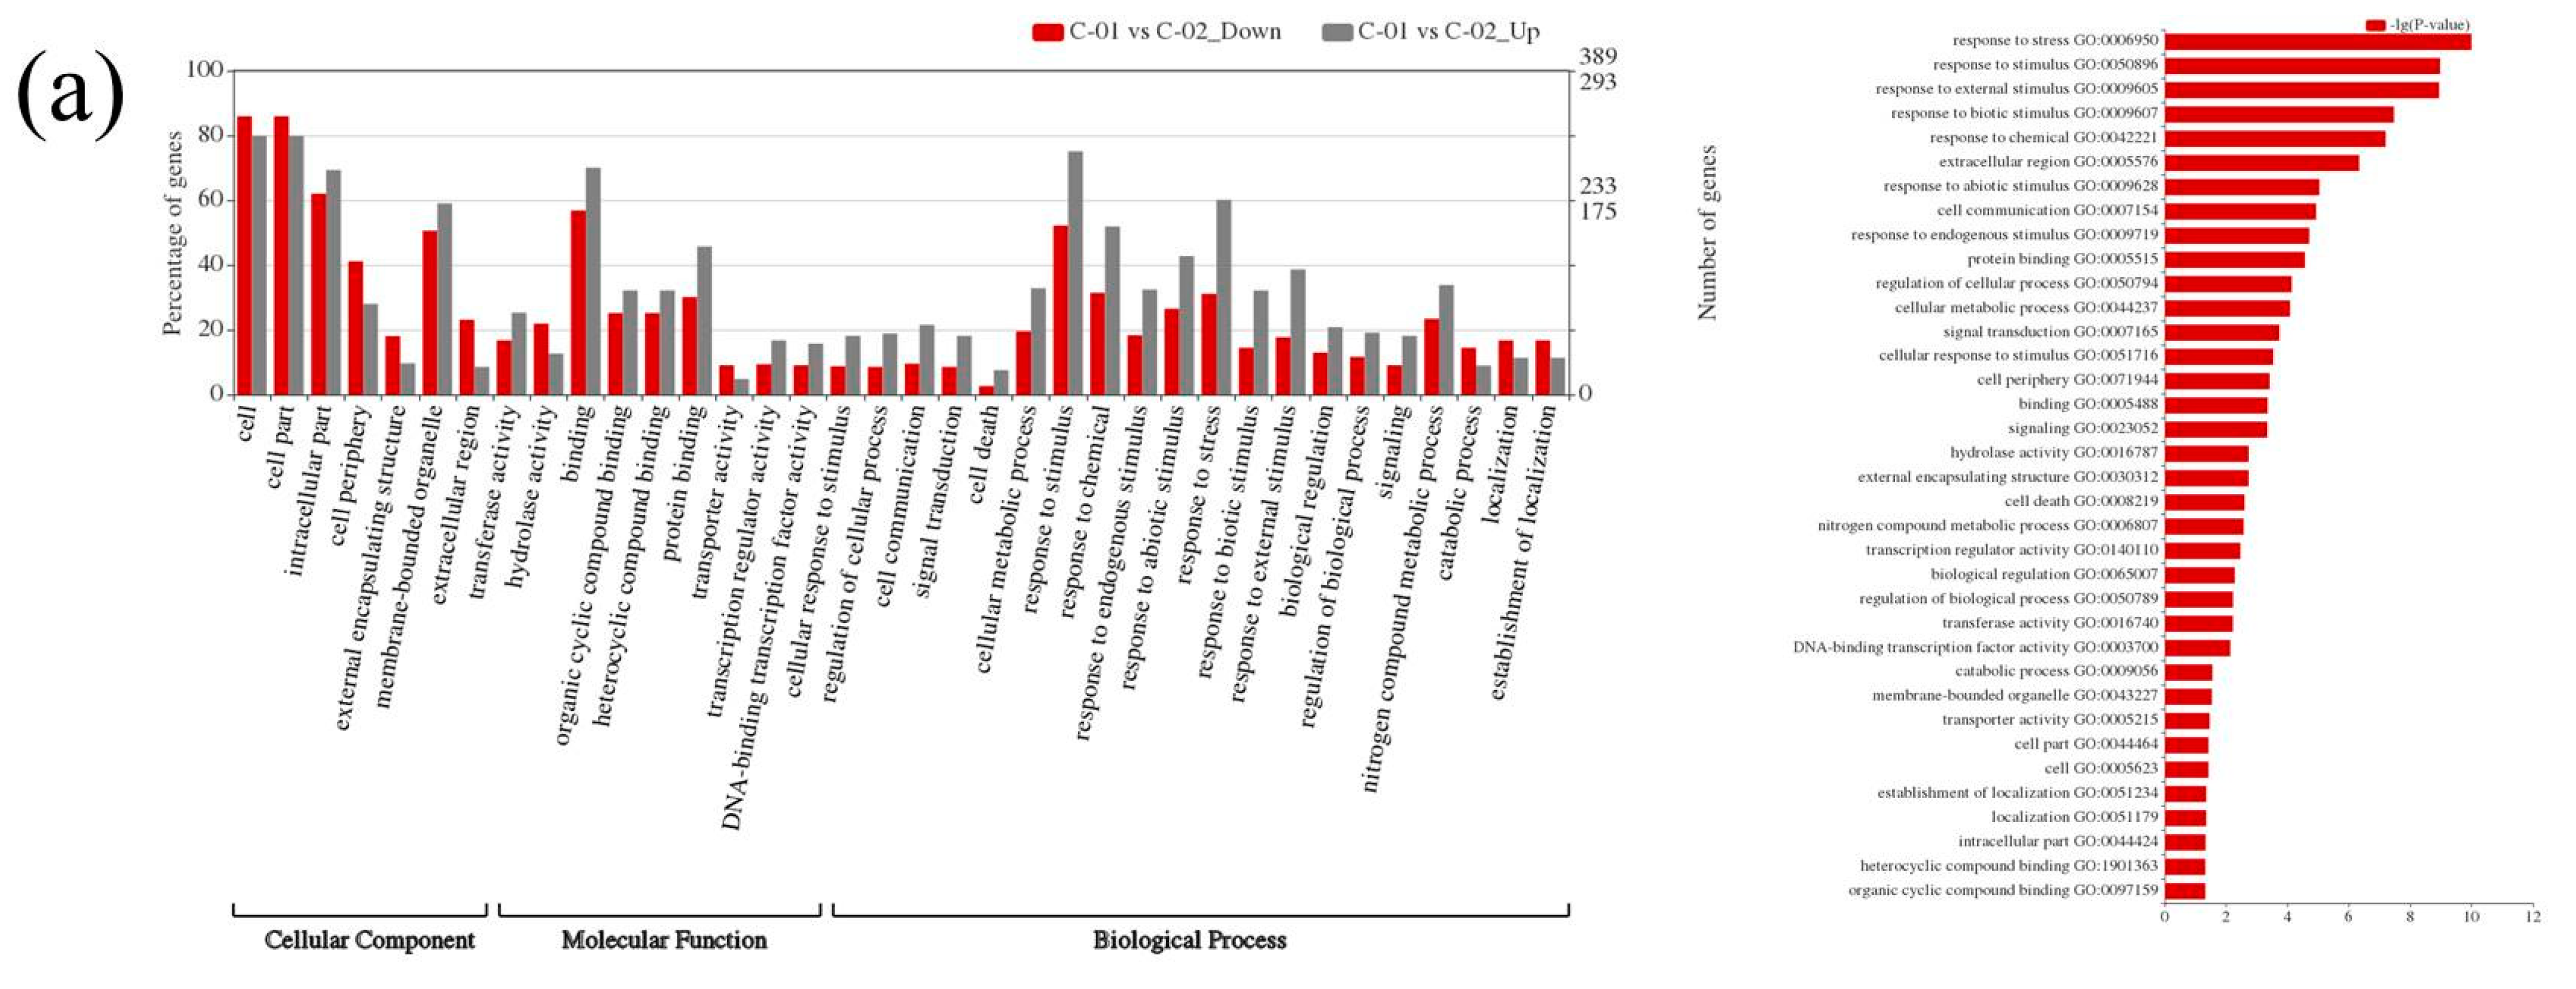
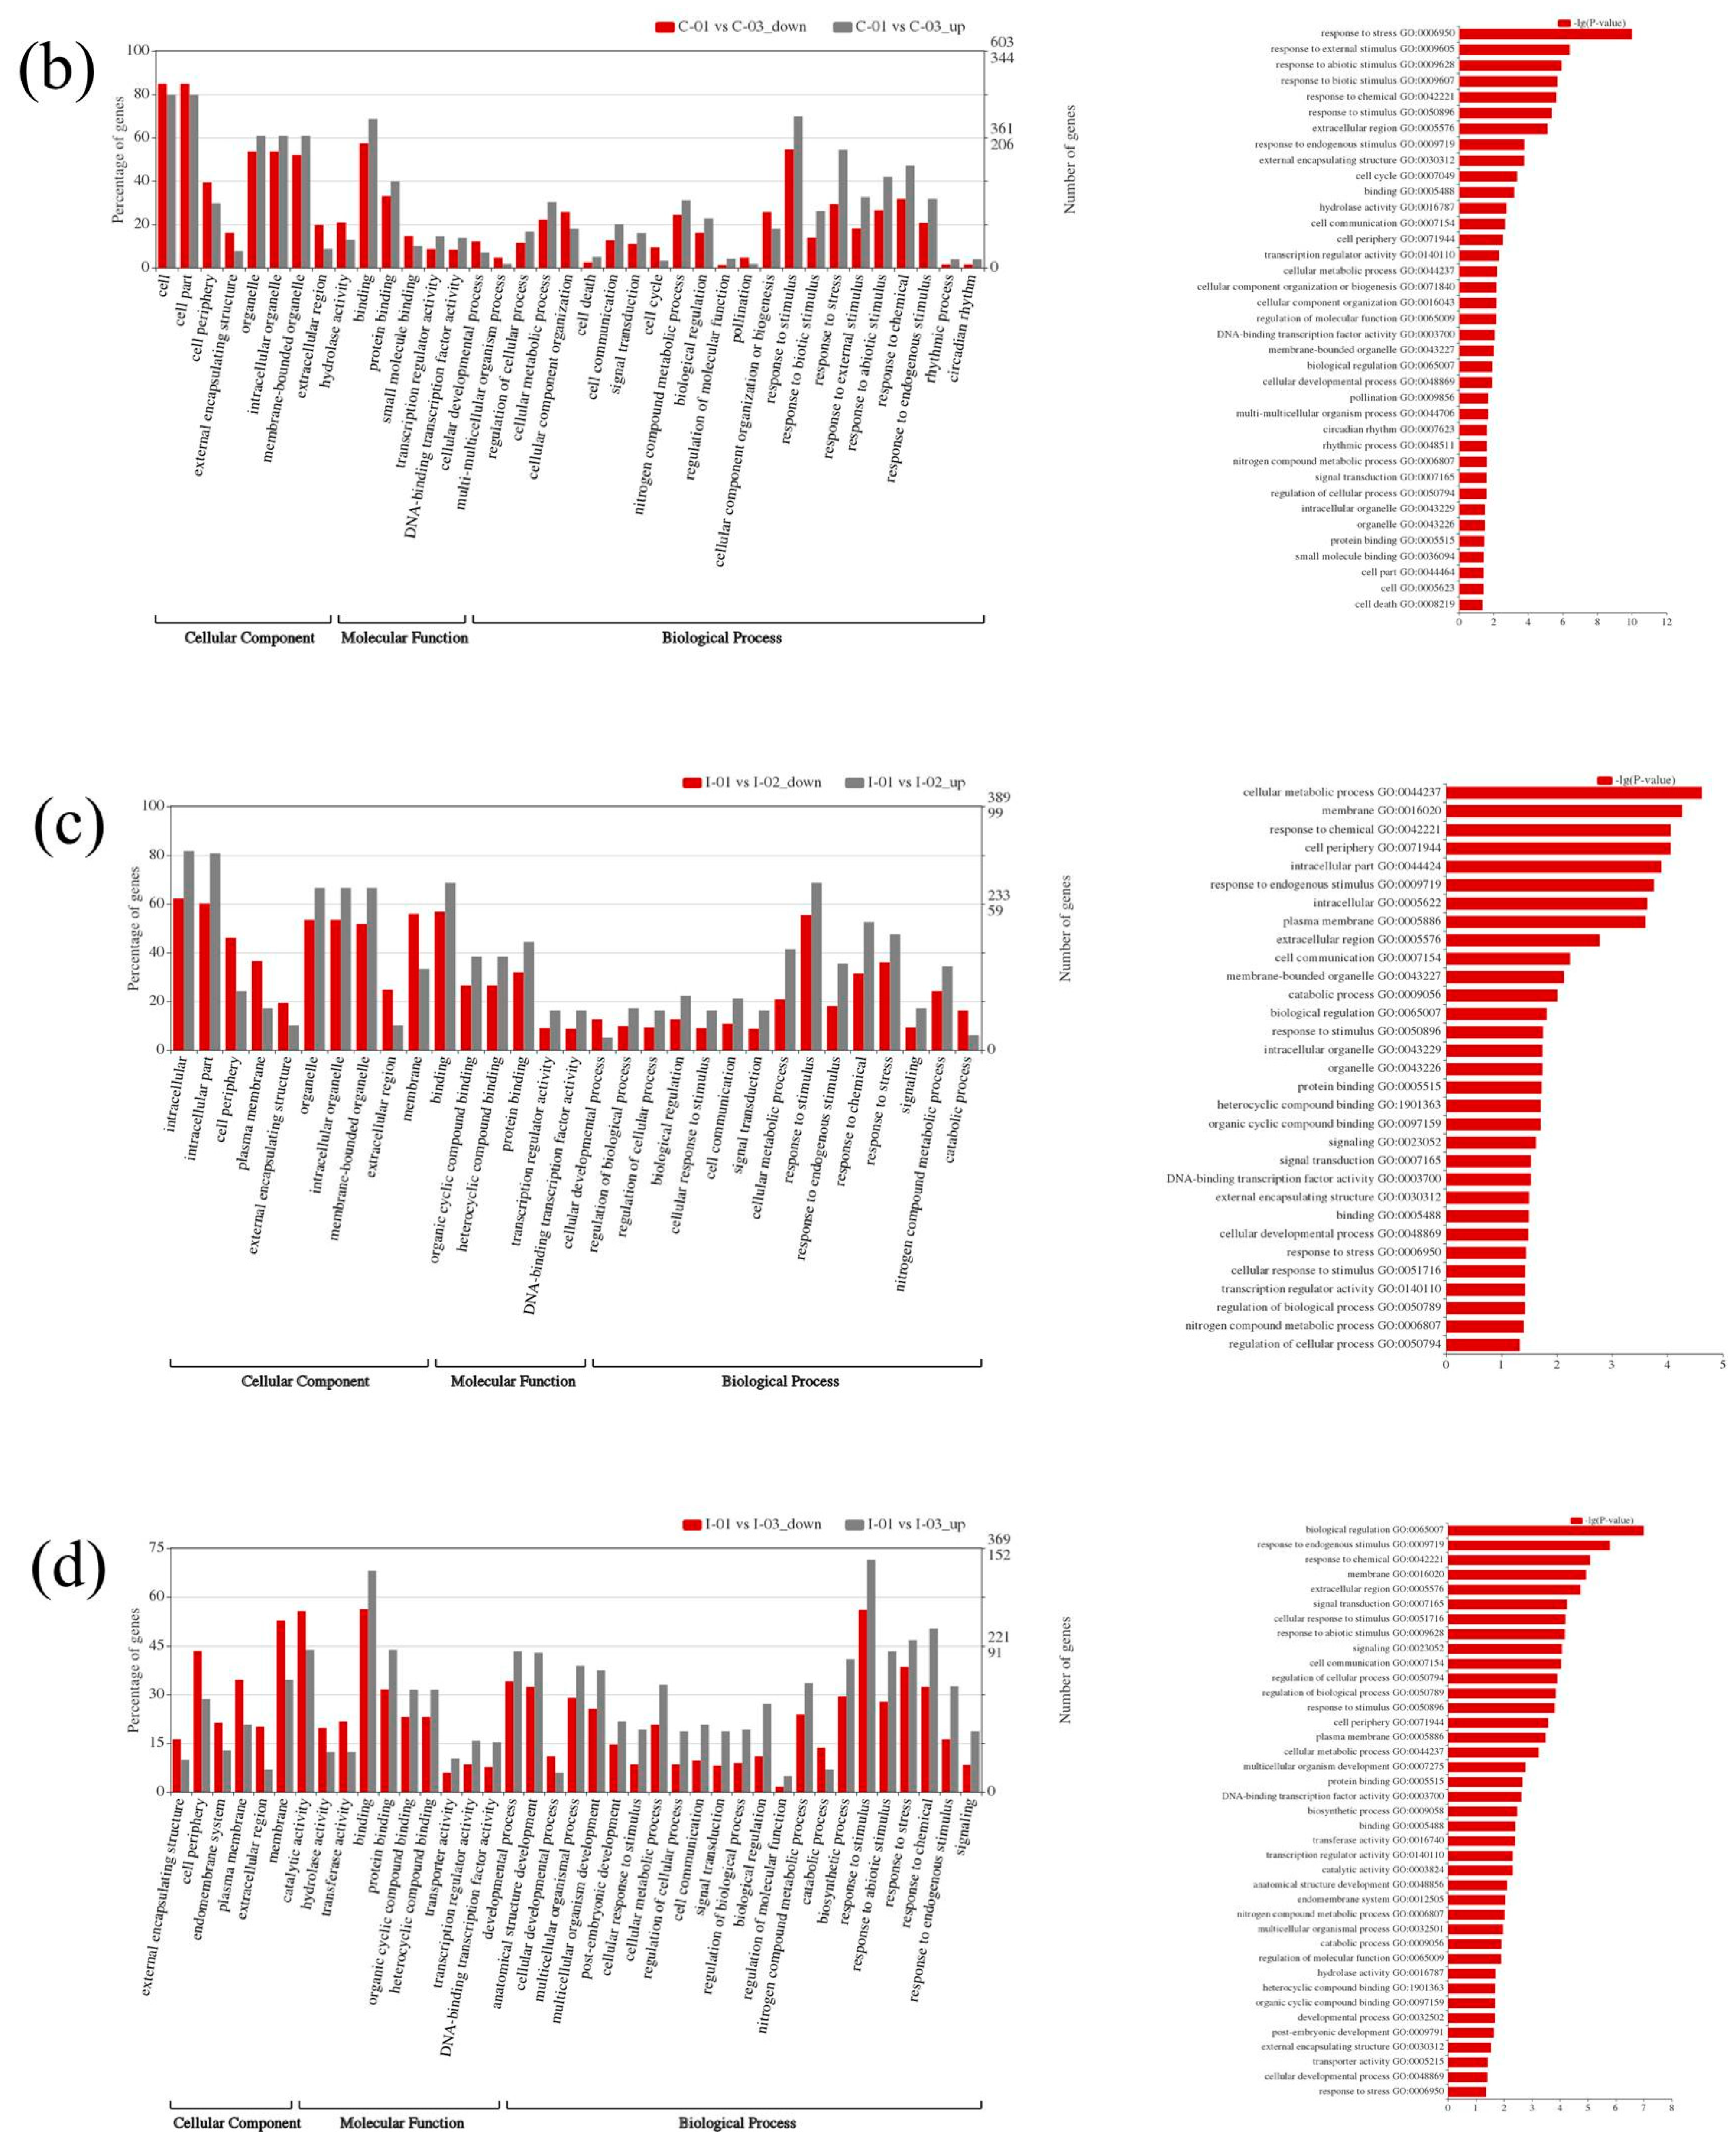
The GO study displayed a similar pattern of enrichment in both the poplar species. Under the biological process categories, the greater number of DEGs falls under response to stress, responsive to stimulus and external stimulus sub-classes. The CO2 treatment has triggered the responsive stimulus in the leaves to a greater extent, which was well observed in GO enrichment analysis (Figure 6). Additionally, HGRP and other membrane-associated DEGs found in elevated CO2 treated leaves correlated with the plant response in protecting its cell wall.
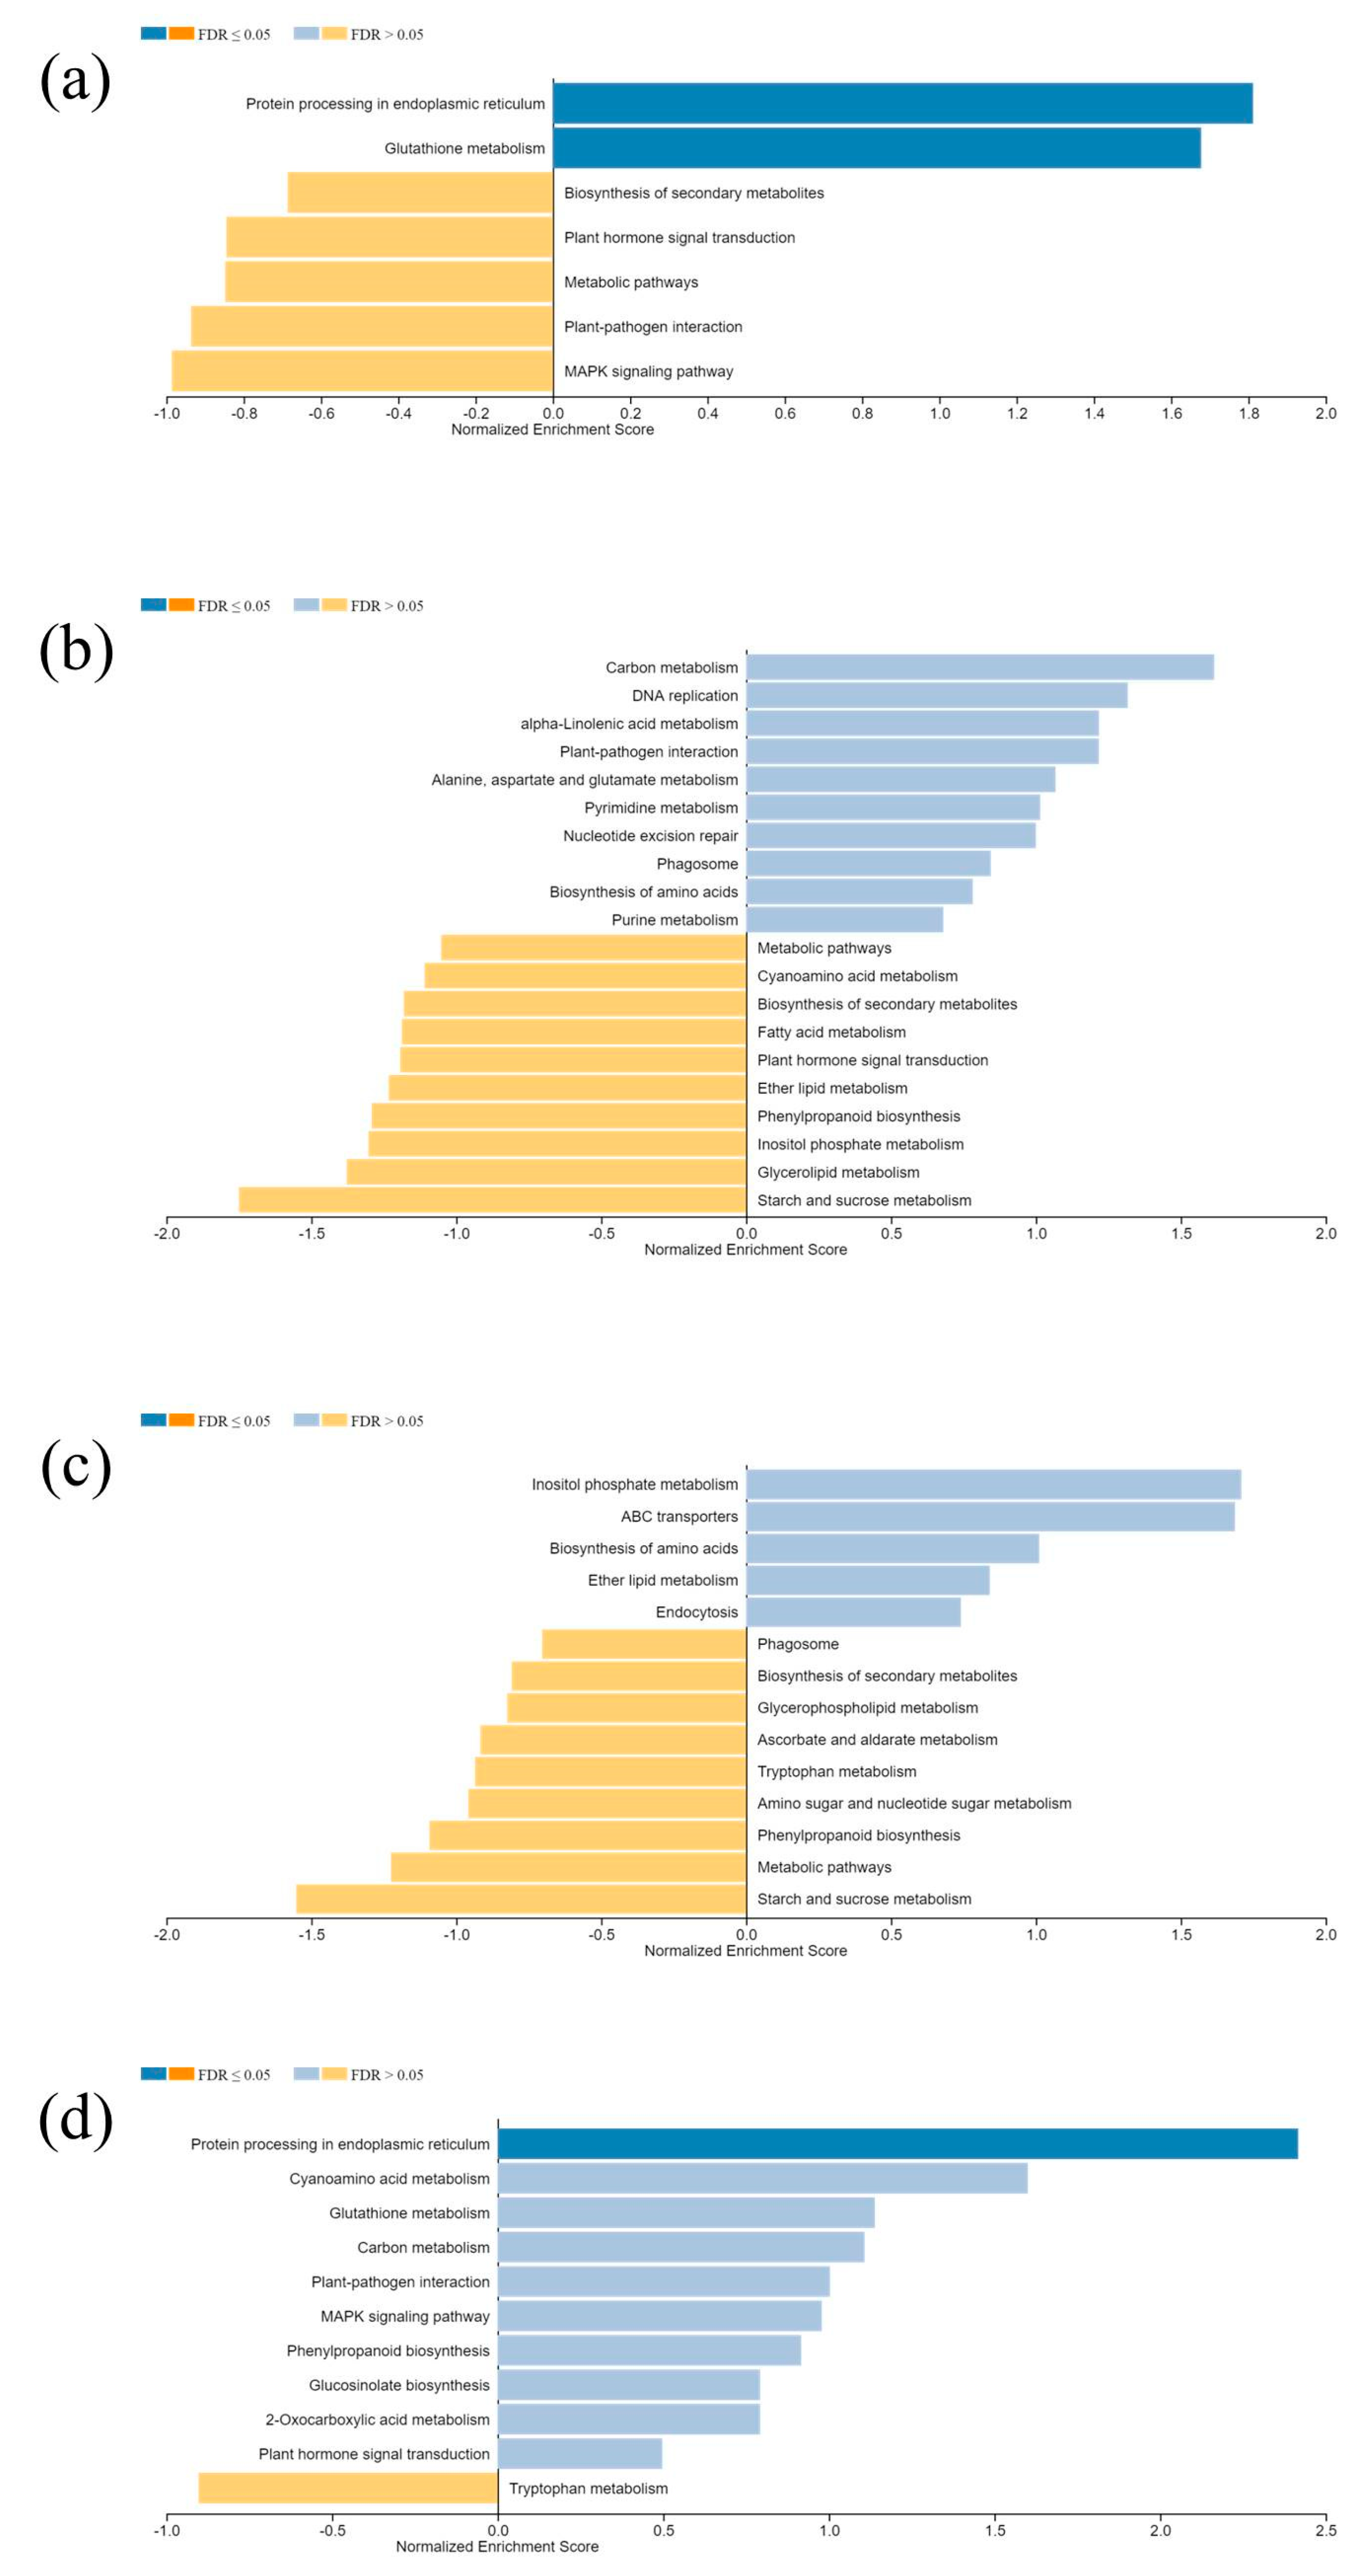
The KEGG enrichment analysis on DEGs resulted in unanimity pathways in all comparisons, irrespective of species differentiation. Carbon metabolism, starch sucrose metabolism, glutathione metabolism, and fatty acid metabolism are the most common enriched pathways in top 10 lists (Figure 7).
3.5. Validation of RNA-Seq Results by qRT-PCR
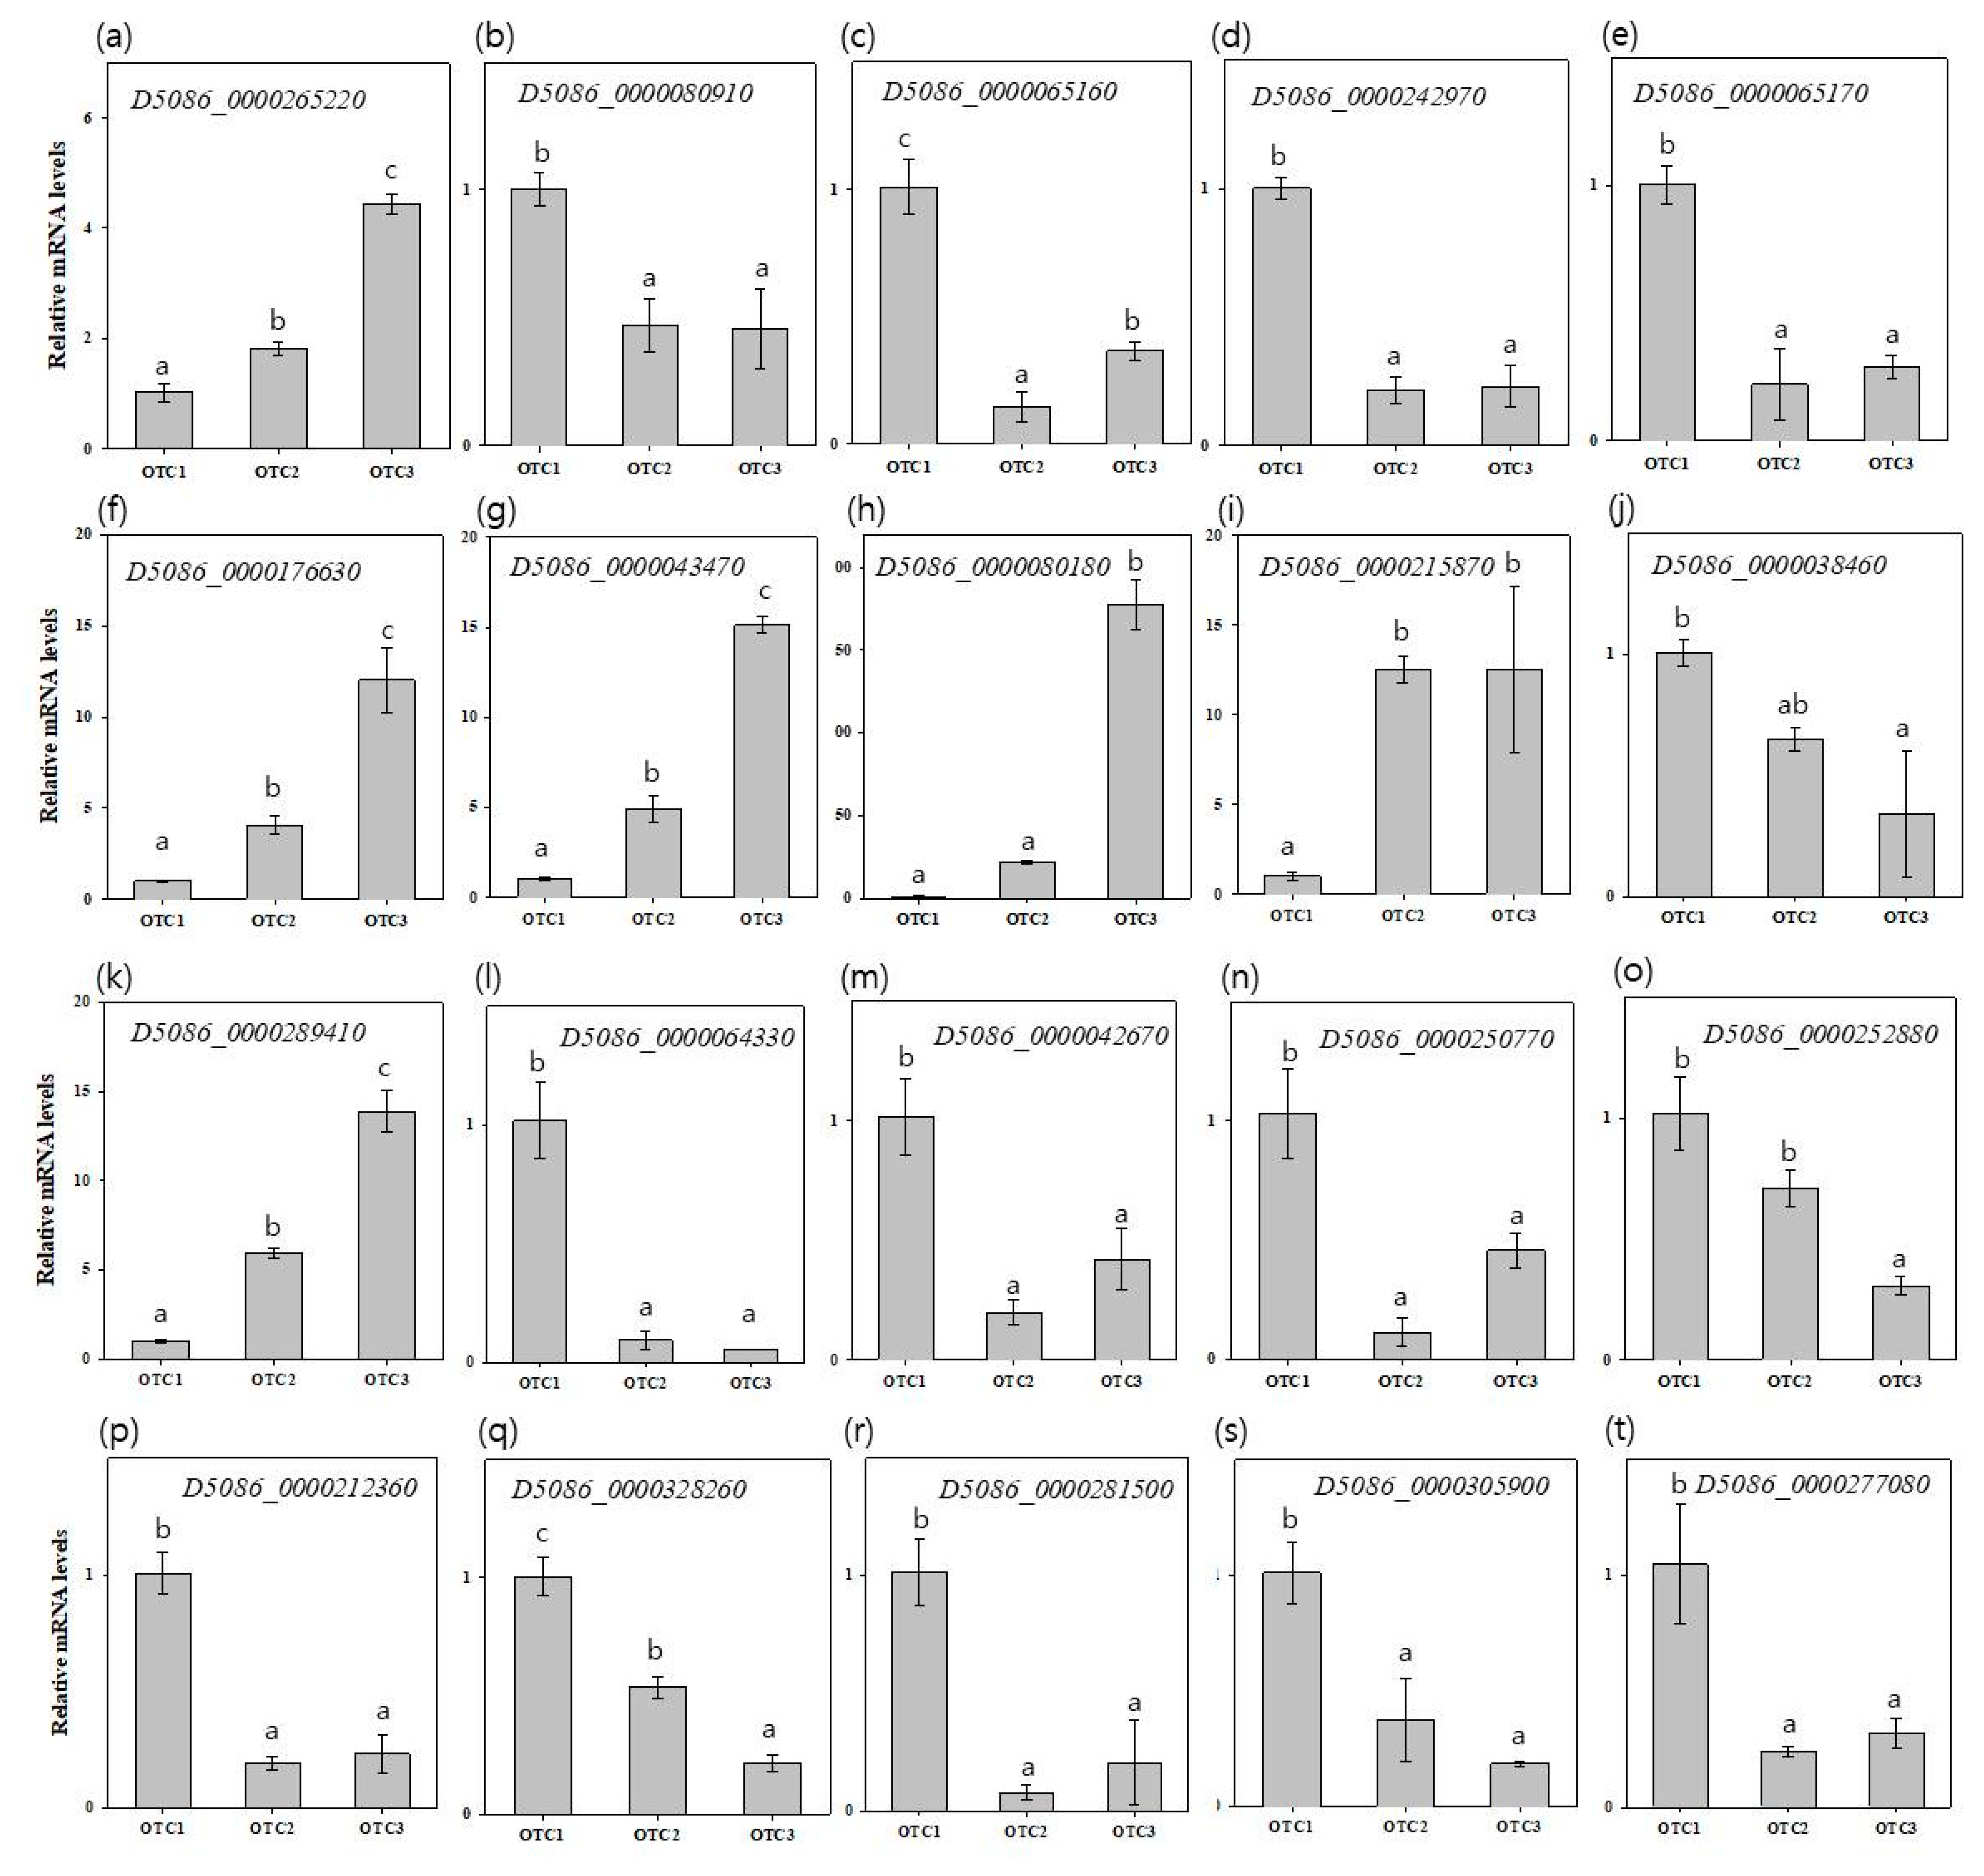
We performed a qRT-PCR for the top 10 most significant DEGs, including D5086_0000265220, D5086_0000080910, D5086_0000065160, D5086_0000242970, D5086_0000065170, D5086_0000289410, D5086_0000064330, D5086_0000042670, D5086_0000250770 and D5086_0000252880 in Clivus (Figure 8a–e,k–o); and D5086_0000176630, D5086_0000043470, D5086_0000080180, D5086_0000215870, D5086_0000038460, D5086_0000212360, D5086_0000328260, D5086_0000281500, D5086_0000305900, and D5086_0000277080 in I-476 (Figure 8f–j,p–t). To verify the differences in gene expression among OTC1, OTC2, and OTC3, 20 genes were selected for qRT-PCR. In qRT-PCR assay, most of the genes showed similar expression patterns as were observed in RNA-Seq data. We found that common DEGs, D5086_0000080910, D5086_0000065160, D5086_0000242970, and D5086_0000065170, were downregulated, while D5086_0000265220 was upregulated in Clivus species in both OTC2 and OTC3 compared with OTC1. The common DEGs of I-476, except the upregulated D5086_0000038460, D5086_0000176630, D5086_0000043470, D5086_0000080180, and D5086_0000215870, were all downregulated in both OTC2 and OTC3 compared with OTC1. We analyzed the sucrose related genes of in both Clivus and I-476; compared with OTC1, both OTC2 and OTC3 showed upregulation of DEGs D5086_0000064330, D5086_0000042670, D5086_0000250770, and D5086_0000252880, whereas D5086_0000289410 was downregulated in Clivus. In the case of I-476, D5086_0000212360, D5086_0000328260, D5086_0000281500, D5086_0000305900, and D5086_0000277080 were downregulated in both OTC2 and OTC3 compared with OTC1. Among the above results, the decreased expression levels of D5086_0000042670 and D5086_000305900 in OTC2 and OTC3 were opposite to each other when compared with RNA-Seq data.
4. Discussion
As a rapid increase in CO2 is expected within decades, studies on the reaction of plants to high concentrations of CO2 have been steadily progressing. As the initial growing environmental conditions of the seedlings are very important for development and survival, a response study to high concentrations of CO2 was conducted. The physiological response of poplar to elevated CO2 varies greatly depending on the species, growth period, additional nutrients, and temperature [7,43,44,45,46]. We observed changes in Clivus and I-476 poplar seedlings in OTCs without any additional factor intervention. However, OTCs have an intrinsic constraint in that the temperature (by 1.2–2 °C) is higher than outside due to their limited airflow. Growth deterioration due to spatial constraints of OTCs did not affect growth at the seedling level. Under these conditions, only Clivus clone at an elevated CO2 level of 720 ppm showed a decrease in growth (Figure 1). In the previous study, impaired plant growth was observed after long-term exposure to a high CO2 concentration and insufficient nitrogen by altering the primary metabolism [47].
Previous studies have shown that the chlorophyll content may decrease or increase in response to changes in the external environment [48]. In our result, it was confirmed that levels of chlorophyll A and carotenoids showed significant changes (Figure 2). It has been reported that the content of chlorophyll is highly correlated with the concentration of CO2 in the atmosphere and the photosynthetic ability [49,50]. An elevated CO2 concentration initially increases the photosynthetic rates of plants, but over time, the rate of photosynthesis is reduced due to the feedback of photosynthetic products and reduction in Rubisco content [51]. Referring to the above, our result showed that treatment with a high concentration of CO2 for 16 weeks passed the initial stage and reached the mid-term or long-term reaction. In particular, a decrease in chlorophyll A, which is involved in carbon fixation, is suggested by the feedback of accumulated soluble sugar and starch [50,52]. In a recent report, it was shown that in Populus grown at high CO2 concentrations, the content of carotenoids slightly decreased or remained unchanged [53]. This was in accordance with the reduction in the level of carotenoids in our experiment (Figure 2). The nitrogen content of the leaves can decrease and photosynthetic products do not move to the sink organs and accumulate as starch, reducing the rate of photosynthesis [51]. This photosynthetic acclimation is also consistent with the large increase in starch content at elevated CO2 concentrations in our results (Figure 3). In addition, we observed a decrease in the expression of glycosyl hydrolase genes, which is related to the degradation of starch, and is also consistent with the result of increasing starch content [51,54]. It is well known that an increase in the soluble sugar content in cells inhibits photosynthetic genes [45,55]. In both Clivus and I-476 seedlings we found an increase in the soluble sugar at elevated CO2 concentrations, and this was associated with a decrease in the level of chlorophyll A in both poplars (Figure 2 and Figure 3). The presence of many DEGs in sucrose and starch metabolic pathways and the related physiological changes observed have confirmed the influential changes in carbon partitioning affecting metabolic changes in poplar under high CO2 concentration.
Plants grown at elevated CO2 concentrations have been reported to be more tolerant to drought stress, as stomata can be kept small due to high CO2 pressure [43]. We confirmed that the overall level of proline increased at elevated CO2, which is thought to be helpful in improving drought tolerance by affecting the intracellular osmotic pressure regulation of proline (Figure 3). In this study, Clivus showed greater changes in carbon partitioning and stress indicators than I-476. These observations shown in Clivus were operating more pronouncedly at mildly (520 ppm) elevated CO2 concentrations. As reported previously, H2O2 is produced primarily by plant cells during photosynthesis and photorespiration, and affected by environmental stresses [31]. In our results, on the contrary, in I-476, H2O2 was increased even though photosynthetic pigment was decreased at an elevated CO2 concentration. The alterations in the stress-related indicators at elevated CO2 concentrations might be involved in overlapping stress and elevated CO2 regulatory networks [56].
Here, we have studied the genetic response to elevated CO2 on two poplar clones. The transcriptome profiling of poplar clones in elevated CO2 was utilized as an exploratory data to find the gene response pattern. Due to the lack of statistical testing, transcriptome data from this study has been interpreted with caution. We extracted common DEGs in both clones that are responsive for the elevated CO2 treatments. The common DEGs from Clivus pooled mainly in HGRP and fatty acid metabolism, whereas for I-476 they were mainly HSPs and from diverse metabolic pathways. This correlates with the experimental data, where in Clivus there is increased MDA production, reflecting the transcriptome analysis showing more DEGs related to fatty acid metabolism. Lesser DEGs related to MDA production were seen in I-476, which explains the lower MDA levels in this clone (Figure 4). The HGRP-related DEGs correlates with the free sugar and proline increase at elevated CO2 in Clivus [57]. Small HSP maintain ROS homeostasis and cooperate with other stress-related genes in response to diverse biotic and abiotic stresses to protect plant cells and tissues [58]. In I-476, DEG analysis showed an evident HSP chaperone-based defense mechanism involving scavenging of H2O2. By treating changes in CO2 concentration, the stress indicators such as MDA, proline, H2O2, and expression of HSP-related genes were changed. In Clivus and I-476, elevated CO2 concentrations significantly decreased the expression of sucrose synthase (SUS) genes. This reduction in expression level is related to the fact that the regulation of photosynthetic amount was due to photosynthetic acclimation and influenced the synthesis of sucrose, the first product of photosynthesis. The plant glycogenin-like starch initiation protein (PGSIP)-like gene’s expression was also decreased in both Clivus and I-476. This seems to suggest that the decrease in starch synthesis genes is related to the reduction in photosynthetic pigments and feedback regulation of accumulated starch in leaves. Although, the transcriptome analysis throws light on increased CO2 concentration induced gene expression changes in these poplar clones, the absence of biological replicates in transcriptome analysis warrants further studies for increased specificity.
5. Conclusions
To summarize, our results present a transcriptome dataset and physiological analysis, which contributes to the understanding of gene expression profiling in response to elevated CO2. By comparing the transcriptome data of three different concentrations of CO2, we found that many DEGs were identified as unique to Clivus and I-476. In addition, this study presented significant physiological alterations with respect to chlorophyll A and carotenoids. Additionally, we reported alterations in starch and soluble sugar. Several synthesis and degradation-related sucrose and starch genes showed altered expression dynamics in our transcriptome and qRT-PCR analysis. The transcriptome data and physiological response of poplars at elevated CO2 presented here could serve as a resource for further research on poplar trees in different CO2 environments.
Supplementary Materials
The following are available online at https://0-www-mdpi-com.brum.beds.ac.uk/article/10.3390/f12080980/s1, Figure S1: MA plot of DEGs, Figure S2: Volcano plot of DEGs, Table S1: Primer of qRT-PCR in Clivus and I-476.
Author Contributions
Conceptualization, H.L. and T.-L.K.; methodology, H.L.; software, H.C.; validation, T.-L.K. and D.P.; formal analysis, K.V.; investigation, T.-L.K.; resources, W.Y.L.; data curation, H.C.; writing—Original draft preparation, T.-L.K.; writing—Review and editing, H.L.; visualization, T.-L.K.; and supervision, H.L. All authors have read and agreed to the published version of the manuscript.
Funding
This research received no external funding.
Data Availability Statement
Data is contained within the article or Supplementary Materials.
Conflicts of Interest
The authors declare no conflict of interest.
References
- Solomon, S.; Qin, D.; Manning, M.; Chen, Z.; Marquis, M.; Averyt, K.; Tignor, M.; Miller, H. IPCC Fourth Assessment Report (AR4). In Climate Change; IPCC: Geneva, Switzerland, 2007; pp. 133–171. [Google Scholar]
- Leakey, A.D.; Ainsworth, E.A.; Bernacchi, C.J.; Rogers, A.; Long, S.P.; Ort, D.R. Elevated CO2 effects on plant carbon, nitrogen, and water relations: Six important lessons from FACE. J. Exp. Bot. 2009, 60, 2859–2876. [Google Scholar] [CrossRef] [PubMed]
- Long, S. Modification of the response of photosynthetic productivity to rising temperature by atmospheric CO2 concentrations: Has its importance been underestimated? Plant Cell Environ. 1991, 14, 729–739. [Google Scholar] [CrossRef]
- Ainsworth, E.A.; Long, S.P. What have we learned from 15 years of free-air CO2 enrichment (FACE)? A meta-analytic review of the responses of photosynthesis, canopy properties and plant production to rising CO2. New Phytol. 2005, 165, 351–372. [Google Scholar] [CrossRef]
- Nowak, R.S.; Ellsworth, D.S.; Smith, S.D. Functional responses of plants to elevated atmospheric CO2—Do photosynthetic and productivity data from FACE experiments support early predictions? New Phytol. 2004, 162, 253–280. [Google Scholar] [CrossRef] [Green Version]
- Körner, C. Plant CO2 responses: An issue of definition, time and resource supply. New Phytol. 2006, 172, 393–411. [Google Scholar] [CrossRef]
- Lindroth, R.L. Impacts of elevated atmospheric CO2 and O3 on forests: Phytochemistry, trophic interactions, and ecosystem dynamics. J. Chem. Ecol. 2010, 36, 2–21. [Google Scholar] [CrossRef]
- Jansson, S.; Douglas, C.J. Populus: A model system for plant biology. Annu. Rev. Plant Biol. 2007, 58, 435–458. [Google Scholar] [CrossRef]
- Marron, N.; Delay, D.; Petit, J.-M.; Dreyer, E.; Kahlem, G.; Delmotte, F.M.; Brignolas, F. Physiological traits of two Populus × euramericana clones, Luisa Avanzo and Dorskamp, during a water stress and re-watering cycle. Tree Physiol. 2002, 22, 849–858. [Google Scholar] [CrossRef] [Green Version]
- Monclus, R.; Dreyer, E.; Villar, M.; Delmotte, F.M.; Delay, D.; Petit, J.M.; Barbaroux, C.; Le Thiec, D.; Bréchet, C.; Brignolas, F. Impact of drought on productivity and water use efficiency in 29 genotypes of Populus deltoides × Populus nigra. New Phytol. 2006, 169, 765–777. [Google Scholar] [CrossRef]
- Caruso, A.; Chefdor, F.; Carpin, S.; Depierreux, C.; Delmotte, F.M.; Kahlem, G.; Morabito, D. Physiological characterization and identification of genes differentially expressed in response to drought induced by PEG 6000 in Populus canadensis leaves. J. Plant Physiol. 2008, 165, 932–941. [Google Scholar] [CrossRef]
- Song, Y.; Wang, Z.; Bo, W.; Ren, Y.; Zhang, Z.; Zhang, D. Transcriptional profiling by cDNA-AFLP analysis showed differential transcript abundance in response to water stress in Populus hopeiensis. BMC Genom. 2012, 13, 1–18. [Google Scholar] [CrossRef] [Green Version]
- Tuskan, G.A.; Difazio, S.; Jansson, S.; Bohlmann, J.; Grigoriev, I.; Hellsten, U.; Putnam, N.; Ralph, S.; Rombauts, S.; Salamov, A. The genome of black cottonwood, Populus trichocarpa (Torr. & Gray). Science 2006, 313, 1596–1604. [Google Scholar] [PubMed] [Green Version]
- Park, J.; Kim, Y.; Xi, H.; Kwon, W.; Kwon, M. The complete chloroplast and mitochondrial genomes of Hyunsasi tree, Populus alba × Populus glandulosa (Salicaceae). Mitochondrial DNA Part B 2019, 4, 2521–2522. [Google Scholar] [CrossRef] [PubMed] [Green Version]
- Cui, H.-Y.; Lee, H.-S.; Oh, C.-Y.; Han, S.-H.; Lee, K.-J.; Lee, H.-J.; Kang, K.-S.; Park, S.-Y. High-frequency regeneration by stem disc culture in selected clones of Populus euramericana. J. Plant Biotechnol. 2014, 41, 236–241. [Google Scholar] [CrossRef] [Green Version]
- Dharmawardhana, P.; Brunner, A.M.; Strauss, S.H. Genome-wide transcriptome analysis of the transition from primary to secondary stem development in Populus trichocarpa. BMC Genom. 2010, 11, 1–19. [Google Scholar] [CrossRef] [PubMed] [Green Version]
- Schrader, J.; Nilsson, J.; Mellerowicz, E.; Berglund, A.; Nilsson, P.; Hertzberg, M.; Sandberg, G. A high-resolution transcript profile across the wood-forming meristem of poplar identifies potential regulators of cambial stem cell identity. Plant Cell 2004, 16, 2278–2292. [Google Scholar] [CrossRef] [PubMed] [Green Version]
- Berta, M.; Giovannelli, A.; Sebastiani, F.; Camussi, A.; Racchi, M. Transcriptome changes in the cambial region of poplar (Populus alba L.) in response to water deficit. Plant Biol. 2010, 12, 341–354. [Google Scholar] [CrossRef]
- Chen, S.; Jiang, J.; Li, H.; Liu, G. The salt-responsive transcriptome of Populus simonii × Populus nigra via DGE. Gene 2012, 504, 203–212. [Google Scholar] [CrossRef]
- Ralph, S.G.; Chun, H.J.E.; Cooper, D.; Kirkpatrick, R.; Kolosova, N.; Gunter, L.; Tuskan, G.A.; Douglas, C.J.; Holt, R.A.; Jones, S.J. Analysis of 4,664 high-quality sequence-finished poplar full-length cDNA clones and their utility for the discovery of genes responding to insect feeding. BMC Genom. 2008, 9, 1–18. [Google Scholar] [CrossRef] [Green Version]
- Metzker, M.L. Sequencing technologies—The next generation. Nat. Rev. Genet. 2010, 11, 31–46. [Google Scholar] [CrossRef] [Green Version]
- Lee, J.-C.; Kim, D.-H.; Kim, G.-N.; Kim, P.-G.; Han, S.-H. Long-term Climate Change Research Facility for Trees: CO2-Enriched Open Top Chamber System. Korean J. Agric. For. Meteorol. 2012, 14, 19–27. [Google Scholar] [CrossRef] [Green Version]
- Sibley, J.L.; Eakes, D.J.; Gilliam, C.H.; Keever, G.J.; Dozier, W.A.; Himelrick, D.G. Foliar SPAD-502 m values, nitrogen levels, and extractable chlorophyll for red maple selections. HortScience 1996, 31, 468–470. [Google Scholar] [CrossRef] [Green Version]
- Walters, R.G.; Ibrahim, D.G.; Horton, P.; Kruger, N.J. A mutant of Arabidopsis lacking the triose-phosphate/phosphate translocator reveals metabolic regulation of starch breakdown in the light. Plant Physiol. 2004, 135, 891–906. [Google Scholar] [CrossRef] [PubMed] [Green Version]
- Stitt, M.; Lilley, R.M.; Gerhardt, R.; Heldt, H.W. [32] Metabolite levels in specific cells and subcellular compartments of plant leaves. Methods Enzymol. 1989, 174, 518–552. [Google Scholar]
- Irigoyen, J.; Einerich, D.; Sánchez-Díaz, M. Water stress induced changes in concentrations of proline and total soluble sugars in nodulated alfalfa (Medicago sativd) plants. Physiol. Plant. 1992, 84, 55–60. [Google Scholar] [CrossRef]
- Heath, R.L.; Packer, L. Photoperoxidation in isolated chloroplasts: I. Kinetics and stoichiometry of fatty acid peroxidation. Arch. Biochem. Biophys. 1968, 125, 189–198. [Google Scholar] [CrossRef]
- Bates, L.S.; Waldren, R.P.; Teare, I. Rapid determination of free proline for water-stress studies. Plant Soil 1973, 39, 205–207. [Google Scholar] [CrossRef]
- Alexieva, V.; Sergiev, I.; Mapelli, S.; Karanov, E. The effect of drought and ultraviolet radiation on growth and stress markers in pea and wheat. Plant Cell Environ. 2001, 24, 1337–1344. [Google Scholar] [CrossRef]
- Livak, K.J.; Schmittgen, T.D. Analysis of relative gene expression data using real-time quantitative PCR and the 2−ΔΔCT method. Methods 2001, 25, 402–408. [Google Scholar] [CrossRef] [PubMed]
- Zhang, W.; Chu, Y.; Ding, C.; Zhang, B.; Huang, Q.; Hu, Z.; Huang, R.; Tian, Y.; Su, X. Transcriptome sequencing of transgenic poplar (Populus × euramericana ’Guariento’) expressing multiple resistance genes. BMC Genet. 2014, 15, S7. [Google Scholar] [CrossRef] [PubMed] [Green Version]
- Bolger, A.M.; Lohse, M.; Usadel, B. Trimmomatic: A flexible trimmer for Illumina sequence data. Bioinformatics 2014, 30, 2114–2120. [Google Scholar] [CrossRef] [PubMed] [Green Version]
- Kim, D.; Paggi, J.M.; Park, C.; Bennett, C.; Salzberg, S.L. Graph-based genome alignment and genotyping with HISAT2 and HISAT-genotype. Nat. Biotechnol. 2019, 37, 907–915. [Google Scholar] [CrossRef] [PubMed]
- Li, H.; Handsaker, B.; Wysoker, A.; Fennell, T.; Ruan, J.; Homer, N.; Marth, G.; Abecasis, G.; Durbin, R. The sequence alignment/map format and SAMtools. Bioinformatics 2009, 25, 2078–2079. [Google Scholar] [CrossRef] [Green Version]
- Liao, Y.; Smyth, G.K.; Shi, W. featureCounts: An efficient general purpose program for assigning sequence reads to genomic features. Bioinformatics 2014, 30, 923–930. [Google Scholar] [CrossRef] [PubMed] [Green Version]
- Love, M.I.; Huber, W.; Anders, S. Moderated estimation of fold change and dispersion for RNA-seq data with DESeq2. Genome Biol. 2014, 15, 1–21. [Google Scholar] [CrossRef] [Green Version]
- Ye, J.; Zhang, Y.; Cui, H.; Liu, J.; Wu, Y.; Cheng, Y.; Xu, H.; Huang, X.; Li, S.; Zhou, A. WEGO 2.0: A web tool for analyzing and plotting GO annotations, 2018 update. Nucleic Acids Res. 2018, 46, W71–W75. [Google Scholar] [CrossRef] [PubMed]
- Liao, Y.; Wang, J.; Jaehnig, E.J.; Shi, Z.; Zhang, B. WebGestalt 2019: Gene set analysis toolkit with revamped UIs and APIs. Nucleic Acids Res. 2019, 47, W199–W205. [Google Scholar] [CrossRef] [Green Version]
- Metsalu, T.; Vilo, J. ClustVis: A web tool for visualizing clustering of multivariate data using Principal Component Analysis and heatmap. Nucleic Acids Res. 2015, 43, W566–W570. [Google Scholar] [CrossRef]
- Kim, J.-S.; Shim, I.-S.; Kim, M.-J. Physiological response of Chinese cabbage to salt stress. Hortic. Sci. Technol. 2010, 28, 343–352. [Google Scholar]
- Kavi Kishor, P.B.; Hima Kumari, P.; Sunita, M.; Sreenivasulu, N. Role of proline in cell wall synthesis and plant development and its implications in plant ontogeny. Front. Plant Sci. 2015, 6, 544. [Google Scholar] [CrossRef] [Green Version]
- Showalter, A.M.; Keppler, B.D.; Liu, X.; Lichtenberg, J.; Welch, L.R. Bioinformatic identification and analysis of hydroxyproline-rich glycoproteins in Populus trichocarpa. BMC Plant Biol. 2016, 16, 1–34. [Google Scholar] [CrossRef] [Green Version]
- Calfapietra, C.; Tulva, I.; Eensalu, E.; Perez, M.; De Angelis, P.; Scarascia-Mugnozza, G.; Kull, O. Canopy profiles of photosynthetic parameters under elevated CO2 and N fertilization in a poplar plantation. Environ. Pollut. 2005, 137, 525–535. [Google Scholar] [CrossRef]
- Dickson, R.; Coleman, M.D.; Riemenschneider, D.; Isebrands, J.; Hogan, G.; Karnosky, D. Growth of five hybrid poplar genotypes exposed to interacting elevated CO2 and O3. Can. J. For. Res. 1998, 28, 1706–1716. [Google Scholar] [CrossRef]
- Ceulemans, R.; Taylor, G.; Bosac, C.; Wilkins, D.; Besford, R. Photosynthetic acclimation to elevated CO2 in poplar grown in glasshouse cabinets or in open top chambers depends on duration of exposure. J. Exp. Bot. 1997, 48, 1681–1689. [Google Scholar] [CrossRef]
- Marinari, S.; Calfapietra, C.; De Angelis, P.; Mugnozza, G.S.; Grego, S. Impact of elevated CO2 and nitrogen fertilization on foliar elemental composition in a short rotation poplar plantation. Environ. Pollut. 2007, 147, 507–515. [Google Scholar] [CrossRef] [PubMed]
- Takatani, N.; Ito, T.; Kiba, T.; Mori, M.; Miyamoto, T.; Maeda, S.-I.; Omata, T. Effects of high CO2 on growth and metabolism of Arabidopsis seedlings during growth with a constantly limited supply of nitrogen. Plant Cell Physiol. 2014, 55, 281–292. [Google Scholar] [CrossRef] [PubMed] [Green Version]
- Zhao, C.; Liu, Q. Growth and photosynthetic responses of two coniferous species to experimental warming and nitrogen fertilization. Can. J. For. Res. 2009, 39, 1–11. [Google Scholar] [CrossRef]
- Terashima, I.; Evans, J.R. Effects of light and nitrogen nutrition on the organization of the photosynthetic apparatus in spinach. Plant Cell Physiol. 1988, 29, 143–155. [Google Scholar]
- Hikosaka, K.; Terashima, I. A model of the acclimation of photosynthesis in the leaves of C3 plants to sun and shade with respect to nitrogen use. Plant Cell Environ. 1995, 18, 605–618. [Google Scholar] [CrossRef]
- Davey, P.; Olcer, H.; Zakhleniuk, O.; Bernacchi, C.; Calfapietra, C.; Long, S.; Raines, C. Can fast-growing plantation trees escape biochemical down-regulation of photosynthesis when grown throughout their complete production cycle in the open air under elevated carbon dioxide? Plant Cell Environ. 2006, 29, 1235–1244. [Google Scholar] [CrossRef] [PubMed]
- Evans, J.R. Partitioning of nitrogen between and within leaves grown under different irradiances. Funct. Plant Biol. 1989, 16, 533–548. [Google Scholar] [CrossRef]
- Lee, S.; Oh, C.-Y.; Han, S.-H.; Kim, K.W.; Kim, P.-G. Photosynthetic Responses of Populus alba× glandulosa to Elevated CO2 Concentration and Air Temperature. Korean J. Agric. For. Meteorol. 2014, 16, 22–28. [Google Scholar] [CrossRef] [Green Version]
- Tallis, M.; Lin, Y.; Rogers, A.; Zhang, J.; Street, N.; Miglietta, F.; Karnosky, D.; De Angelis, P.; Calfapietra, C.; Taylor, G. The transcriptome of Populus in elevated CO2 reveals increased anthocyanin biosynthesis during delayed autumnal senescence. New Phytol. 2010, 186, 415–428. [Google Scholar] [CrossRef] [PubMed] [Green Version]
- Nie, G.; Hendrix, D.L.; Webber, A.N.; Kimball, B.A.; Long, S.P. Increased accumulation of carbohydrates and decreased photosynthetic gene transcript levels in wheat grown at an elevated CO2 concentration in the field. Plant Physiol. 1995, 108, 975–983. [Google Scholar] [CrossRef] [PubMed] [Green Version]
- Palit, P.; Ghosh, R.; Tolani, P.; Tarafdar, A.; Chitikineni, A.; Bajaj, P.; Sharma, M.; Kudapa, H.; Varshney, R.K. Molecular and Physiological Alterations in Chickpea under Elevated CO2 Concentrations. Plant Cell Physiol. 2020, 61, 1449–1463. [Google Scholar] [CrossRef]
- Abdel-Nasser, L.; Abdel-Aal, A. Effect of elevated CO2 and drought on proline metabolism and growth of safflower (Carthamus mareoticus L.) seedlings without improving water status. Pak. J. Biol. Sci. 2002, 5, 523–528. [Google Scholar]
- Yer, E.N.; Baloglu, M.C.; Ziplar, U.T.; Ayan, S.; Unver, T. Drought-responsive Hsp70 gene analysis in populus at genome-wide level. Plant Mol. Biol. Rep. 2016, 34, 483–500. [Google Scholar] [CrossRef]
Figure 1.
A schematic representation of the experimental design and the phenotypes of poplar clones. (a) A photograph of the whole open-top chambers (OTCs) facility. (b) The conceptual model. (c,d) The effects of elevated CO2 on the shoot growth of the poplar Clivus and I-476 clones. The values are the means ± SDs (n = 10) Different lowercase letters indicate significant differences (Tukey’s HSD, p < 0.05 for (d)).

Figure 2.
Effects of CO2 treatment on photosynthetic pigments in poplar clones. (a) Chlorophyll A. (b) Chlorophyll B. (c) Carotenoids. (d) Total chlorophyll/carotenoids. (e) Total chlorophyll. (f) Chlorophyll A/B. Values are means ± SDs of three independent measurements. Different lowercase letters indicate significant differences (Tukey’s HSD, p < 0.05 for (a,c,e); and Welch’s ANOVA with Dunnett’s T3, p < 0.05 for (d)).

Figure 3.
Effects of CO2 treatment on the metabolites and carbohydrate contents. (a) MDA. (b) H2O2. (c) Proline. (d) Total soluble sugar. (e) Starch. Different lowercase letters indicate significant differences (Tukey’s HSD, p < 0.05 for I-476 in (a–e); and the same for Clivus, except Welch’s ANOVA with Dunnett’s T3, p < 0.05 for Clivus in (a)).

Figure 4.
Comparison of differentially expressed genes. (a) Clivus (Populus alba × P. glandulosa, a poplar clone hybrid); and (b) I-476 (Populus euramericana). Upregulated-log2 fold change (≥2); Downregulated-log2 fold change (≤−2). Each species was treated with three different concentrations of CO2. C-400, Clivus CO2 400 ppm; C-560, Clivus CO2 560 ppm; C-720, Clivus CO2 720 ppm; I-400, I-476 CO2 400 ppm; I-560, I-476 CO2 560 ppm; I-720, I-476 CO2 720 ppm.

Figure 5.
Heat map showing the gene expression pattern of common DEGs in (a) Clivus and (b) I-476. Corresponding log2 fold change is displayed inside the box. Each species was treated with three different concentrations of CO2. C-400, Clivus CO2 400 ppm; C-560, Clivus CO2 560 ppm; C-720, Clivus CO2 720 ppm; I-400, I-476 CO2 400 ppm; I-560, I-476 CO2 560 ppm; I-720, I-476 CO2 720 ppm.

Figure 6.
Gene Ontology (GO) enrichment analysis of DEGs. (a,b) Clivus; (c,d) I-476. Grey and red represent the upregulated and downregulated DEGs, respectively.
Figure 6.
Gene Ontology (GO) enrichment analysis of DEGs. (a,b) Clivus; (c,d) I-476. Grey and red represent the upregulated and downregulated DEGs, respectively.


Figure 7.
KEGG pathway enrichment analysis. (a,b) Clivus; (c,d), I-476.

Figure 8.
Validation of differential expressions of 20 genes by quantitative real-time PCR (qRT-PCR). qRT-PCR analysis data for the top 10 most significantly differentially expressed genes (DEGs) in Clivus and I-476, respectively. qRT-PCR data were analyzed using the 2−ΔΔCt method with Actin1 gene as an internal control. Three biological replicates were performed for each sample. Error bars show mean standard error (n = 3). (a–e) Common Clivus genes; (f–j) common I-476 genes; (k–o) sucrose genes of Clivus; and (p–t) sucrose genes of I-476. Different lowercase letters indicate significant differences. (a, DREB2A-interacting protein 2/E3 ubiquitin protein ligase DRIP2-like; b, ABI-1-like 1/probable protein ABIL5; c, fatty acid desaturase 2/delta(12)-acyl-lipid-desaturase-like; d, myb domain protein 9/transcription factor MYB53-like; e, fatty acid desaturase 2/delta(12)-acyl-lipid-desaturase-like; f, HSP20-like chaperones superfamily protein/23.6 kDa heat shock protein, mitochondrial-like; g, galactinol synthase 1/galactinol synthase 2-like; h, Ribulose bisphosphate carboxylase (small chain) family/ribulose bisphosphate carboxylase small chain clone 512-like protein; i, HSP20-like chaperones superfamily protein/22.0 kDa class IV heat shock protein-like; j, glucuronoxylan 4-O-methyltransferase-like protein (DUF579); k, Glycogen/starch synthases, ADP-glucose type; l, glycosyl hydrolase 9C3; m, glycosyl hydrolase 9B13; n, glycosyl hydrolase 9B18; o, Glycosyl hydrolases family 31 protein; p, glycosyl hydrolase 9C3; q, Glycosyl hydrolase superfamily protein; r, plant glycogenin-like starch initiation protein 1; s, Glycosyl hydrolase superfamily protein; and t, plant glycogenin-like starch initiation protein 3) (Tukey’s HSD, p < 0.05 for (e,f,h,i,k,l,r,t); and Welch’s ANOVA with Dunnett’s T, p < 0.05 for (a–d,g,m–q,s).


Table 1.
A summary of the RNA sequencing results.
| Features | C-O1 | C-O2 | C-O3 | I-O1 | I-O2 | I-O3 |
|---|---|---|---|---|---|---|
| Raw Reads Number | 106,478,531 | 105,000,000 | 104,645,041 | 100,369,331 | 106,750,088 | 105,451,387 |
| Data in GB | 21.5 | 21.14 | 21.13 | 20.27 | 21.56 | 21.3 |
| Clean Reads Number | 103,924,392 | 102,000,000 | 101,893,091 | 97,491,907 | 103,843,061 | 102,166,668 |
| Clean Reads Rate | 97.60% | 97.58% | 97.37% | 97.13% | 97.27% | 96.88% |
| Low-quality Reads | 2.39% | 2.41% | 2.62% | 2.86% | 2.72% | 3.11% |
| Total bases | 10,750,000,000 | 10,600,000,000 | 10,570,000,000 | 10,137,302,431 | 10,781,758,888 | 10,650,590,087 |
| Clean Q30 Bases | 10,180,000,000 | 10,000,000,000 | 9,903,000,000 | 9,545,026,030 | 10,202,693,412 | 10,386,382,963 |
| Clean Q30 Bases Rate | 94.65% | 94.69% | 93.69% | 94.15% | 94.62% | 93.91% |
| GC % | 44 | 44 | 44 | 44 | 45 | 45 |
| Unique Mapped reads | 85,670,611 | 82,924,836 | 83,342,372 | 54,226,551 | 56,729,089 | 55,987,647 |
| Unique Mapped ratio % | 82.44% | 81.17% | 81.79% | 55.62% | 54.63% | 54.80% |
| Multi-mapped reads | 3,199,788 | 3,259,580 | 3,332,247 | 2,258,383 | 2,721,419 | 2,661,064 |
| Multi-mapped reads ratio % | 3.08% | 3.19% | 3.27% | 2.32% | 2.62% | 2.60% |
| Overall Alignment with Reference Genome | 91.08% | 89.87% | 90.70% | 70.41% | 69.56% | 70.04% |
Publisher’s Note: MDPI stays neutral with regard to jurisdictional claims in published maps and institutional affiliations. |
© 2021 by the authors. Licensee MDPI, Basel, Switzerland. This article is an open access article distributed under the terms and conditions of the Creative Commons Attribution (CC BY) license (https://creativecommons.org/licenses/by/4.0/).
Share and Cite
MDPI and ACS Style
Kim, T.-L.; Chung, H.; Veerappan, K.; Lee, W.Y.; Park, D.; Lim, H. Physiological and Transcriptome Responses to Elevated CO2 Concentration in Populus. Forests 2021, 12, 980. https://0-doi-org.brum.beds.ac.uk/10.3390/f12080980
AMA Style
Kim T-L, Chung H, Veerappan K, Lee WY, Park D, Lim H. Physiological and Transcriptome Responses to Elevated CO2 Concentration in Populus. Forests. 2021; 12(8):980. https://0-doi-org.brum.beds.ac.uk/10.3390/f12080980
Chicago/Turabian StyleKim, Tae-Lim, Hoyong Chung, Karpagam Veerappan, Wi Young Lee, Danbe Park, and Hyemin Lim. 2021. "Physiological and Transcriptome Responses to Elevated CO2 Concentration in Populus" Forests 12, no. 8: 980. https://0-doi-org.brum.beds.ac.uk/10.3390/f12080980
Note that from the first issue of 2016, this journal uses article numbers instead of page numbers. See further details here.