Article

Effects of Randomized Management on the Forest Distribution Patterns of Larix kaempferi Plantation in Xiaolongshan, Gansu Province, China

1
Research Institute of Forestry, Chinese Academy of Forestry, Key Laboratory of Tree Breeding and Cultivation of National Forestry and Grassland Administration, Beijing 100091, China
2
Xiaolongshan Research Institute of Forestry of Gansu Province, Tianshui 741000, China
*
Author to whom correspondence should be addressed.
Submission received: 17 May 2021 / Revised: 13 July 2021 / Accepted: 20 July 2021 / Published: 24 July 2021
(This article belongs to the Section Forest Inventory, Modeling and Remote Sensing)

Abstract

:
Patterns of tree distribution are an important attribute of forest structure and directly affect the health and stability of forest ecosystems. This paper studied the effects of forest management on the forest distribution pattern of Larix kaempferi plantations with an aim to improve the quality of the spatial structure of plantations by providing scientific grounds for near-nature distribution pattern adjustment. We set up 15 long-term positioning and monitoring plots of 20 m × 20 m of L. kaempferi plantations in Xiaolongshan, Gansu Province, China, based on the Clark and Evans index, and applied the structure analysis method of the neighboring tree relationship to determine the standard angle of the uniform angle index of regularly distributed plantation forests. The changes in forest distribution patterns were compared before and after randomized management (R1 (dumbbell-shaped random unit), R2 (torch-shaped random unit) and R1:R2 = 1:2 models) and underlayer tending and unmanaged control (CK). The results showed that (1) Under different management modes, the distribution patterns obtained by the Clark and Evans index and the mean values of the uniform angle index were entirely the same; all stand patterns were evenly distributed. (2) Regardless of randomized management or underlayer tending, the number of trees in the even distribution was the largest, accounting for more than 40%. (3) The mean values of the uniform angle index of most stands increased obviously after randomized management, among which the R1 and R2 stands showed an upward trend, while the R1:R2 = 1:2 stands showed a slight decrease. However, the mean values of the uniform angle index of the stands with underlayer management showed a decreasing trend. (4) The proportion of random trees in most stands increased significantly after randomized management, increasing by 1%~19% compared with that before adjustment, while the proportion of random trees in the underlayer tending treatment decreased by 2%~10%. Our results suggest that (1) The method based on the modified uniform angle index standard angle could effectively improve the accuracy of the distribution pattern of individual trees in plantation forests and further improve the accuracy of the overall stand pattern quantitatively. (2) Randomized management significantly increased the proportion of random trees in the stands, which accelerated the evolution of the forest distribution pattern of the L. kaempferi plantation to a random distribution.

1. Introduction

With the global decrease in natural forest resources, plantations play an increasingly important role in alleviating the contradiction between the supply and demand of wood, increasing forestry-related incomes and protecting the natural environment [1,2]. However, there are many problems in artificial forests, such as single stand structure, low biodiversity, decline in soil quality, and the frequent occurrence of forest diseases and insect pests, which seriously affect the comprehensive functions of the forest [3,4]. Many scientific studies have shown that forests functions depend to a large extent on whether the spatial structure of forests is reasonable [5,6,7]. With the conversion of the forest management concept from wood production to ecological construction in China [8], the goal of forest management emphasizes the cultivation or maintenance of healthy, stable, high-quality, and efficient forest spatial structures [9]. The stand spatial structure refers to the distribution pattern of individual trees in horizontal space and the spatial arrangement of their attributes [10], which is an important attribute of forest ecosystems. It affects the competition among trees, their spatial ecological niche, and then determines whether forest functions can be maximized [11,12]. Tree distribution patterns are an important aspect of stand spatial structure and reflect the comprehensive effects of the biological characteristics of the population itself, intraspecies and interspecific competition, and the environmental conditions of the community (such as competitiveness, soil, climate, and topography) on long temporal and spatial scales [13,14,15,16,17]. Therefore, the study or adjustment of tree distribution patterns has become the basis for the study or adjustment of community spatial behavior; however, there are few reports on operational techniques for the adjustment of spatial patterns in plantations.
After years of research on the interpretation of forest spatial structure based on the relationship between neighboring trees, Hui et al. (2019) [18] systematically proposed a creative theory and technology of forest management—structure-based forest management. This approach takes the natural forest spatial structure without disturbance or that slightly disturbed by human activities as the template. According to the natural growth and succession process of the forest, it is a method for sustainable forest management that guides the optimization of forest stand structure through stand spatial structure parameters, in which the uniform angle index of spatial structure parameters has been widely used in the analysis of forest spatial patterns [12,19,20,21]. This parameter describes the uniformity of neighboring trees surrounding the reference tree by judging and counting whether the included angle formed by the reference tree and its neighboring trees is greater than the standard angle. The horizontal distribution pattern of trees can be obtained without precision distance measurements or accurate angle measurements, making it a simpler approach than traditional spatial analysis methods such as the sample method [22] or distance analysis method [23]. Most importantly, the uniform angle index has unique advantages in guiding spatial structure adjustment. The study on the structure of natural forests based on uniform angle index distribution shows that the number of trees in a random distribution microenvironment in natural forests is more than 50% and can usually can be divided into two types, R1 (dumbbell-shaped random unit) and R2 (torch-shaped random unit) (Figure 1), with a similar proportion (R1:R2 = 1:2), and it has nothing to do with forest distribution zone, tree species, or forest type [24,25]. However, due to regular planting in existing plantations, almost all individual trees exist in an evenly distributed environment. The same spatial distribution pattern will inevitably lead to severe competition between the aboveground and root systems of neighboring trees, thereby affecting the utilization efficiency of limiting resources such as soil, water, fertilizer, and light, which in turn affect the productivity of forest stands. Therefore, building more random units (random structural units) based on understanding the characteristics of the distribution pattern of stable natural forest trees, imitating the natural forest structure, and adjusting the distribution pattern of plantations will be essential for optimizing the spatial structure of plantations.
Larix kaempferi is nationally distributed in the central mountainous area of Honshu Island, Japan. Since it was introduced into China at the end of the 19th century, it has become the main afforestation tree species for short-period pulpwood and construction materials in temperate, warm temperate, and northern subtropical high mountains due to its characteristics of early rapid growth, strong adaptability, high yield, and good quality. Therefore, it is of great significance to actively explore the changes in the spatial structure of L. kaempferi plantations under natural conditions for early management and later adjustment. However, the earlier studies on L. kaempferi have mainly focused on its growth characteristics [26], genetic improvement [27], canopy characteristics [28], understory regeneration [29], wood properties [30], biomass and carbon storage [31,32], soil physical and chemical properties [33], soil enzyme activities [34], and soil microorganisms [35]. The optimal spatial structure for L. kaempferi stands is still very limited, especially because the structure-based forest management theory has not yet been used to guide the pattern adjustment of existing L. kaempferi plantations. Therefore, this study used an L. kaempferi plantation at the Liziyuan Forest Farm of Xiaolongshan, Gansu Province, China. In view of trees with a diameter greater than or equal to the average diameter, and good stem shape, based on the last results of the study on the spatial structure of natural forests mentioned above, pattern adjustment (randomized management) was carried out to form a random unit as the goal of thinning [36]. This research analyzed the influence of different randomized management models on the distribution pattern of L. kaempferi plantations to provide a scientific basis for cultivating healthy, stable, high-quality, and efficient L. kaempferi plantations.

2. Research Methods

2.1. Clark and Evans Index

The Clark and Evans (1954) [37] index, RCE, is one of the oldest and mostly widely used methods of determining spatial pattern type. This index compares the mean of observed distances, r ¯ , between any point of the point pattern and its first nearest neighbor with the mean distance in a Poisson point process (complete spatial randomness), E r . The formula for this calculation follows (Equation (1)):
  R C E = r ¯ E r   where   E r = 1 2 · N A
where N and A are the number of trees and its area, respectively. RCE < 1 indicates a tendency towards an aggregated spatial pattern, whilst RCE > 1 indicates a tendency towards a uniform spatial pattern. When mean observed distance and mean Poisson distance are roughly the same, RCE ≈ 1, indicating a random spatial pattern.

2.2. Stand Spatial Structure Parameter: Uniform Angle Index (W)

The spatial relations of each reference tree (i) and its n nearest neighbors in a stand constitute the most basic spatial structural unit. This study used the uniform angle index (W) to analyze the uniformity of the adjacent trees surrounding a reference tree. This value is defined as the proportion of the angle αij formed by any two nearest adjacent neighbors that are smaller than the expected angle (standard angle, α0 is 72° in natural forest) (Equation (2)) [38]. The value ranges from 0 to 1, and the smaller the value, the more even the neighboring trees are distributed around the reference tree; otherwise, they are more clustered. The specific classification is shown in Table 1. The formula for this calculation follows:
W i = 1 n j = 1 n Z i j ,   where   Z i j = { 1 if   α i j   angle   is   small   than   α 0   0     otherwise                   
The calculation formula of the uniform angle index mean value follows (Equation (3)):
W ¯ = 1 N i N W i
where Wi is the uniform angle index of the ith reference tree, W ¯ is the uniform angle index of the stand, n is the number of neighboring trees of a reference tree, N is the number of trees in the forest, i is any reference tree, and j is the nearest neighboring tree of reference tree i. The stand distribution pattern is a random distribution if the mean values of W ¯ belong to the confidence interval (0.475, 0.517), otherwise, it is classified as an aggregated distribution ( W ¯ > 0.517) or uniform distribution ( W ¯ < 0.475).
The different values of the uniform angle index (Wi) represent the distribution of the four neighboring trees surrounding reference tree i. The five values of Wi (0, 0.25, 0.5, 0.75, and 1) correspond to the distribution patterns of different neighbors of a reference tree (highly even, even, random, clustered, and highly clustered). For convenience, we named the small pattern formed by the reference tree and its nearest four neighbors the structure unit. Therefore, when Wi = 0 or 0.25, it is called an even tree, the corresponding structure is called an even structure unit, analogous to a uniform spatial pattern at intertree scales; when Wi = 0.5, it is called a random tree, the corresponding structure is called random structure unit; and when Wi = 0.75 or 1, it is called a cluster tree, and the corresponding structure is called a cluster structure unit, analogous to an aggregated spatial pattern at intertree scales.
The uniform angle index has a strong ability to analyze the spatial structure of complex forests, while the standard angle is a standard used to measure the distribution uniformity of the n nearest adjacent trees surrounding the reference tree, and it is a key factor affecting the application accuracy of the uniform angle index [39]. Many research results show that the analysis method based on four adjacent trees with a standard angle of 72° can properly describe the distribution uniformity of natural forests. However, for the plantations with equilateral triangle configuration or isosceles triangle configuration, if the standard angle analysis corresponding to n = 4 is directly used, the frequency of W = 0.5 in the uniform angle index distribution of the stand will increase, while the frequency of W < 0.5 will decrease; additionally, although it will not lead to a misjudgment of the overall forest patterns, it will affect the accurate judgment of the distribution form of some individual neighbors to a certain extent (see Figure 2). Therefore, a uniform angle index analysis method based on four adjacent trees is still applied in this study, but the standard angle of 72° applied to natural forests is revised, and the standard angle of 360°/(6 + 1) = 51.4° based on six adjacent trees is adopted. Figure 2 shows the judgment of the distribution pattern of the same single tree with different standard angles. Figure 2a simulates the spatial pattern distribution map of the evenly distributed forest trees with a common planting row spacing of 2 m × 3 m in a triangular configuration of plantations. Figure 2b shows that if the traditional 72° standard angle is used to judge, the two distribution forms may be misjudged as random distributions. However, according to the method with the modified standard angle of 51.4°, the results are all uniform distributions, and no misjudgment problem occurs, which is consistent with the real state of the stand.

2.3. Randomized Management

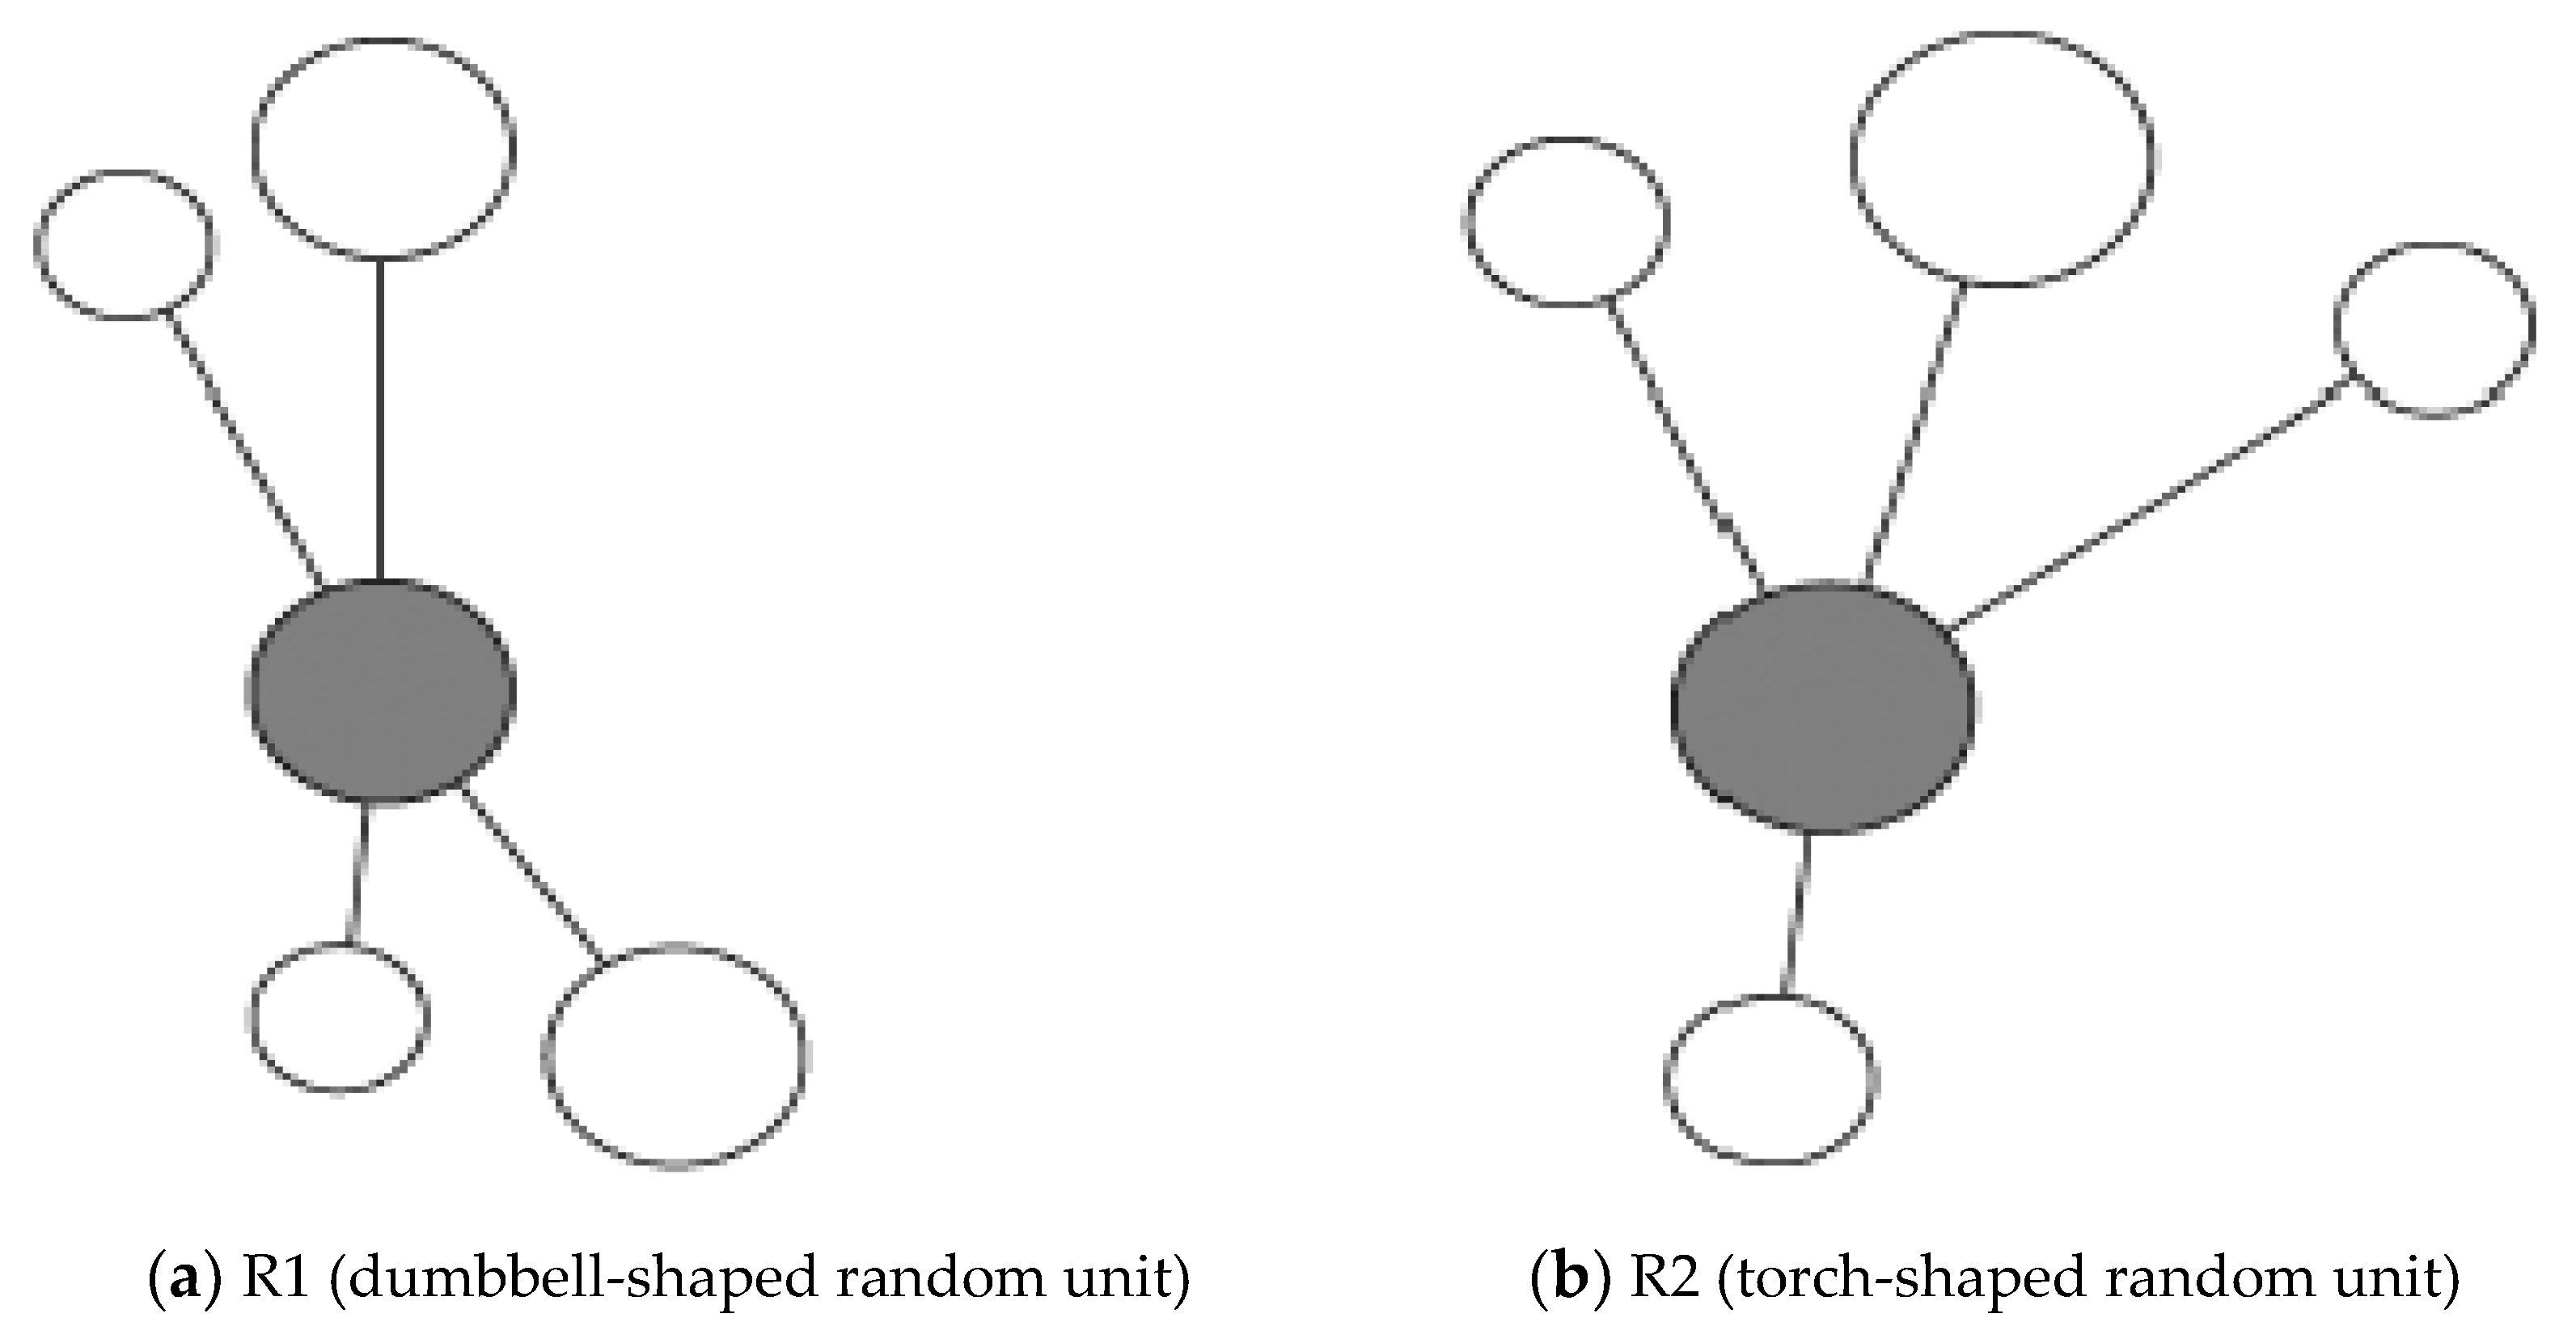
2.3.1. Theoretical Basis

First, natural forest communities usually have a high degree of heterogeneity, which creates a good niche and asymmetric competition for different tree species or tree sizes. Incomplete and unbalanced resource allocation can promote forest communities to maximize pattern diversity, which is an important basis for the formation of community stability and productivity, and ensures the stable development of forest ecosystems.
Second, the microenvironment of individual trees directly determines the reproductive ability of individual trees and shows local variability to some extent, which provides the possibility for asymmetric competitive growth of different trees. Under the same environmental conditions (climate, light), the advantages of superior individual trees will be significantly magnified in the superior growth microenvironment. The random distribution pattern is beneficial to ensure the cultivated objects receive more light on two sides and reduces the pressure of symmetrical competition with neighbors. Promoting the forest spatial structure and develop more random patterns may improve forest stability and productivity.
Third, the study on forest spatial patterns based on the uniform angle index shows that the distribution pattern of forest trees is usually composed of three parts: even, random, and clustered. The number of randomly distributed trees (number of trees or basal area) in natural forests in the climax community accounts for more than 50%, while almost all individual trees in the regularly planted plantations are in a uniformly distributed microenvironment.
Fourth, the random structure unit in natural forests can generally be divided into two types (R1 and R2) with similar proportions (R1:R2 = 1:2) [25]. The concept of near-natural forest management is to learn from the natural ecosystem and imitate the natural forest structure. Therefore, the focus of randomized management of plantation forests is how to imitate the structure of natural forests; that is, how to construct a random structure unit will become a key scientific issue in the adjustment of plantation forest structure.

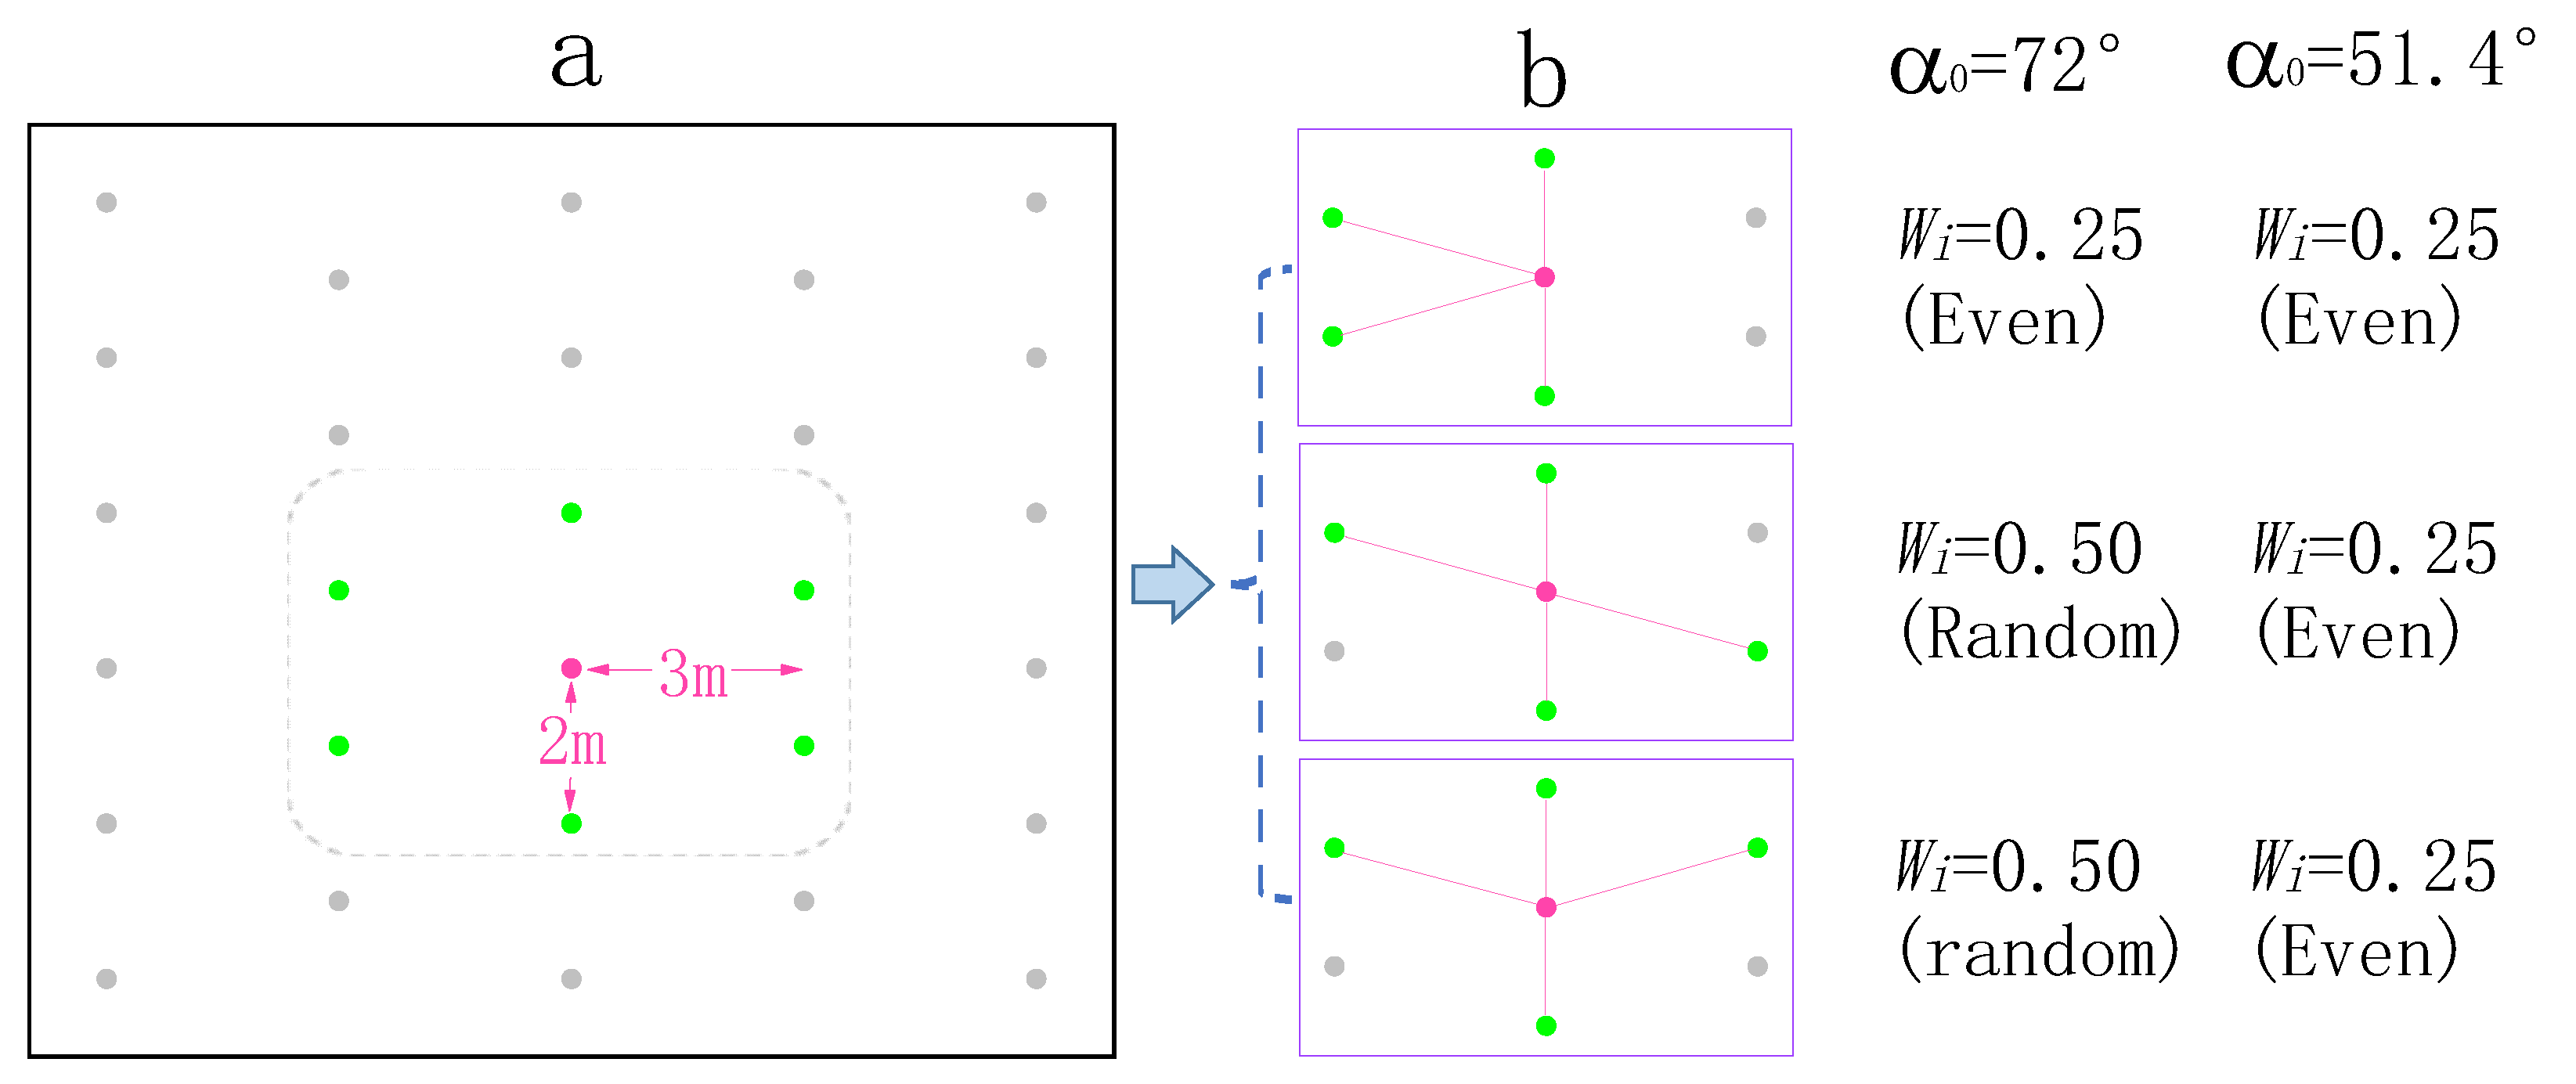
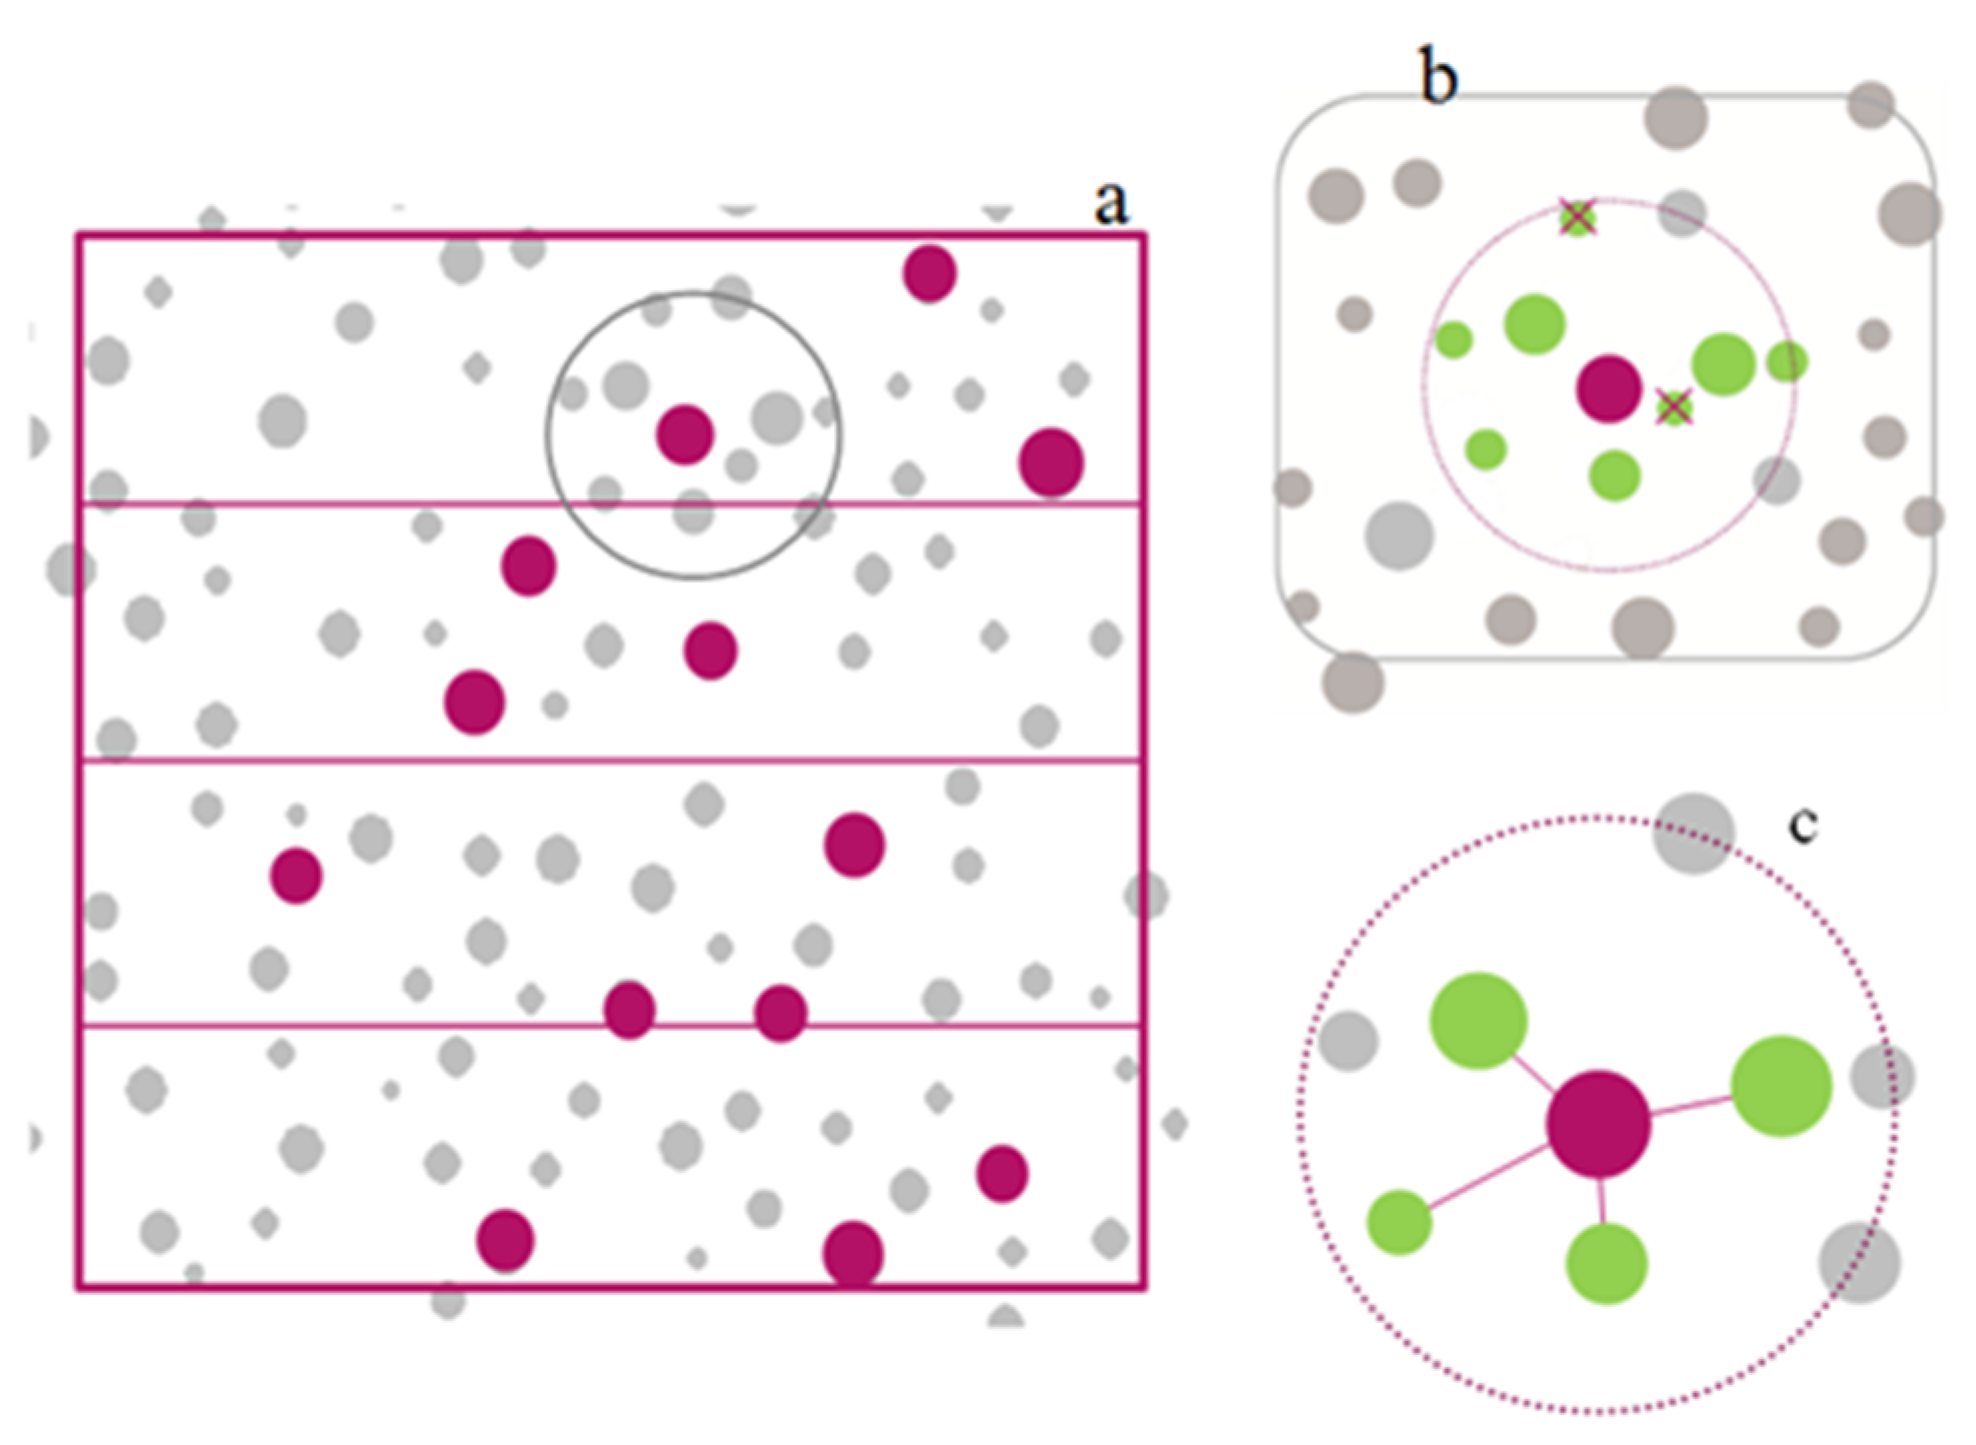
2.3.2. Operation Principle

(1) The selection principle of medium- and large-diameter trees. Each row or every 5 m along the contour line is divided into a zone in which 10% or 15% of the number of medium- and large-diameter trees are selected. Among the eight nearest neighbors of each medium- and large-diameter tree, four relatively large and healthy neighbors that can form a random structure unit were reserved, and unhealthy neighbors and other neighbors that affect the random structure unit were cut down to ensure that the large-diameter tree was randomly distributed after adjustment (Figure 3).
(2) The principle of uniform distribution of medium- and large-diameter trees. The selected medium- and large-diameter trees should be evenly distributed in the forest. If two medium- and large-diameter trees are adjacent to each other, the tree with more growth potential should be selected as the cultivation object.
(3) The priority principle of random distribution of neighbors. If the four nearest neighbors of the selected medium- and large-diameter tree have been randomly distributed around it, there is no need to construct a new random structure unit. If four of the eight neighbors of the selected medium- and large-diameter tree cannot be selected to form a random structure unit, the target tree should be replaced.
(4) The principle of minimum interference. We wish to minimize the interference of management to the forest stand, and the amount cut each time should not exceed 15% of the total stock volume. Additional large neighbors are reserved to form a random unit, and small neighbors are prioritized to cut down small neighbors. Or, we prioritized the selection of public neighbors to minimize the felling volume.
(5) The principle of tree species diversity. If there are other tree species neighbors in the neighborhood, they will be prioritized as reserved neighbors. Rare species or endangered species will not be harvested to protect the diversity of forest species.

2.4. Study Area and Experimental Design

Our study area was located in the Liziyuan Forest Farm in Xiaolongshan (105°42′–106°00′ E, 34°07′–34°24′ N), Gansu Province, China. It is a transitional zone between the humid subtropical climate zone and the warm temperate zone, most of which belongs to the warm-temperature humid, medium-temperature semihumid continental monsoon climate. The annual average temperature is 10.9 °C, and the annual mean precipitation is 700–900 mm, which is mainly concentrated in July, August, and September. The frost-free period is approximately 180 days. Most of the area elevations range from approximately 1400 to 2000 m. The forest soil is mainly cinnamon soil and mountain brown soil, and has a pH of 7.0–7.5. The experimental area covers 2.1 hectares. The shrubs were cut in the spring of 1996, and pit-shaped ground preparation was carried out for afforestation. The seedlings used 2-year-old L. kaempferi. The initial planting density was 3150 trees/ha, and the remaining tree density in 2009 was 2025 trees/ha. Sanitary and growth cuttings were carried out in 2010, and approximately 1500 trees/ha were retained after thinning.
In 2016, we started to implement randomized management trials of medium- and large-diameter trees. According to the experimental scheme, a total of 21 plots were established, and each plot area was 20 × 20 m2. We divided the fifteen plots into five groups (three plots per group), and the five groups were guaranteed to have similar plant numbers and forest stocks (the remaining six plots were used as standby plots). The 5 management modes were randomized management R1 (dumbbell-shaped random unit), randomized management R2 (torch-shaped random unit), randomized management R1:R2 = 1:2 [25], underlayer tending, and CK (no forestry operations were conducted in CK). All of the live trees with a DBH (diameter at breast height) ≥5 cm were tagged, and their positions were mapped with a Topcon GTS602 (Topcon Corporation, Tokyo, Japan) autofocus total station. The Cartesian coordinates, tree species, DBH, tree height, crown diameter, and canopy density were investigated and calculated. The stand features of the plots are shown in Table 2.

3. Results

3.1. Spatial Distributions of the Clark and Evans Index

The Clark and Evans index (CE index) is an important element in characterizing stand structure, respective to the horizontal distribution of trees. As shown in Table 3, CE index before and after adjustment under different management modes was greater than 1, and the distribution pattern of all stands was evenly distributed. The stands with R1 exhibited CE index values for before and after adjustment ranged from 1.41 ± 0.029 to 1.33 ± 0.007, and the values in R2 stands were 1.41 ± 0.039, while the corresponding values after adjustment were 1.39 ± 0.029. However, CE index values of the stands that received R1: R2 = 1:2 management before adjustment were 1.37 ± 0.071, while after adjustment were 1.40 ± 0.02. Meanwhile, in the underlayer tending treatment, the values before and after adjustment were 1.36 ± 0.047 and 1.35 ± 0.07, respectively.

3.2. Distribution of the Uniform Angle Index

The Wi frequency distribution reflects the horizontal distribution pattern of individual trees in a stand. As shown in Figure 4, sample plots with a mean value of the uniform angle index less than 0.475 accounted for 100% of the 15 plots, which all showed a uniform distribution pattern; the results were consistent with the Clark and Evans index (Table 3). Further research found that (1) the Wi frequency was unimodally distributed, the peaks all appeared at Wi = 0.25 (even distribution), and the frequencies of even trees all exceeded 40%. (2) The proportions of highly even and randomly distributed structure units were relatively low, at 17%~36% and 16%~33%, respectively. The distribution frequency of Wi = 0.75 (clustered distribution) was lower than 5%, and trees with a highly clustered distribution were not found (Wi = 1). Generally, the number of even trees in plantations was the largest, the numbers of highly even trees and random trees were relatively low, and the rate of highly clustered trees was almost 0. (3) Except for C1 and C3, the mean uniform angle index of other randomized management stands increased to varying degrees and succeeded in the direction of random distribution, while the mean of the uniform angle index of the D2 and D3 plots decreased after underlayer tending management, and the D1 plot slightly increased. The randomized management effectively promoted the stand to be closer to a random distribution, while the spatial pattern of the stand after underlayer tending became more uniform.

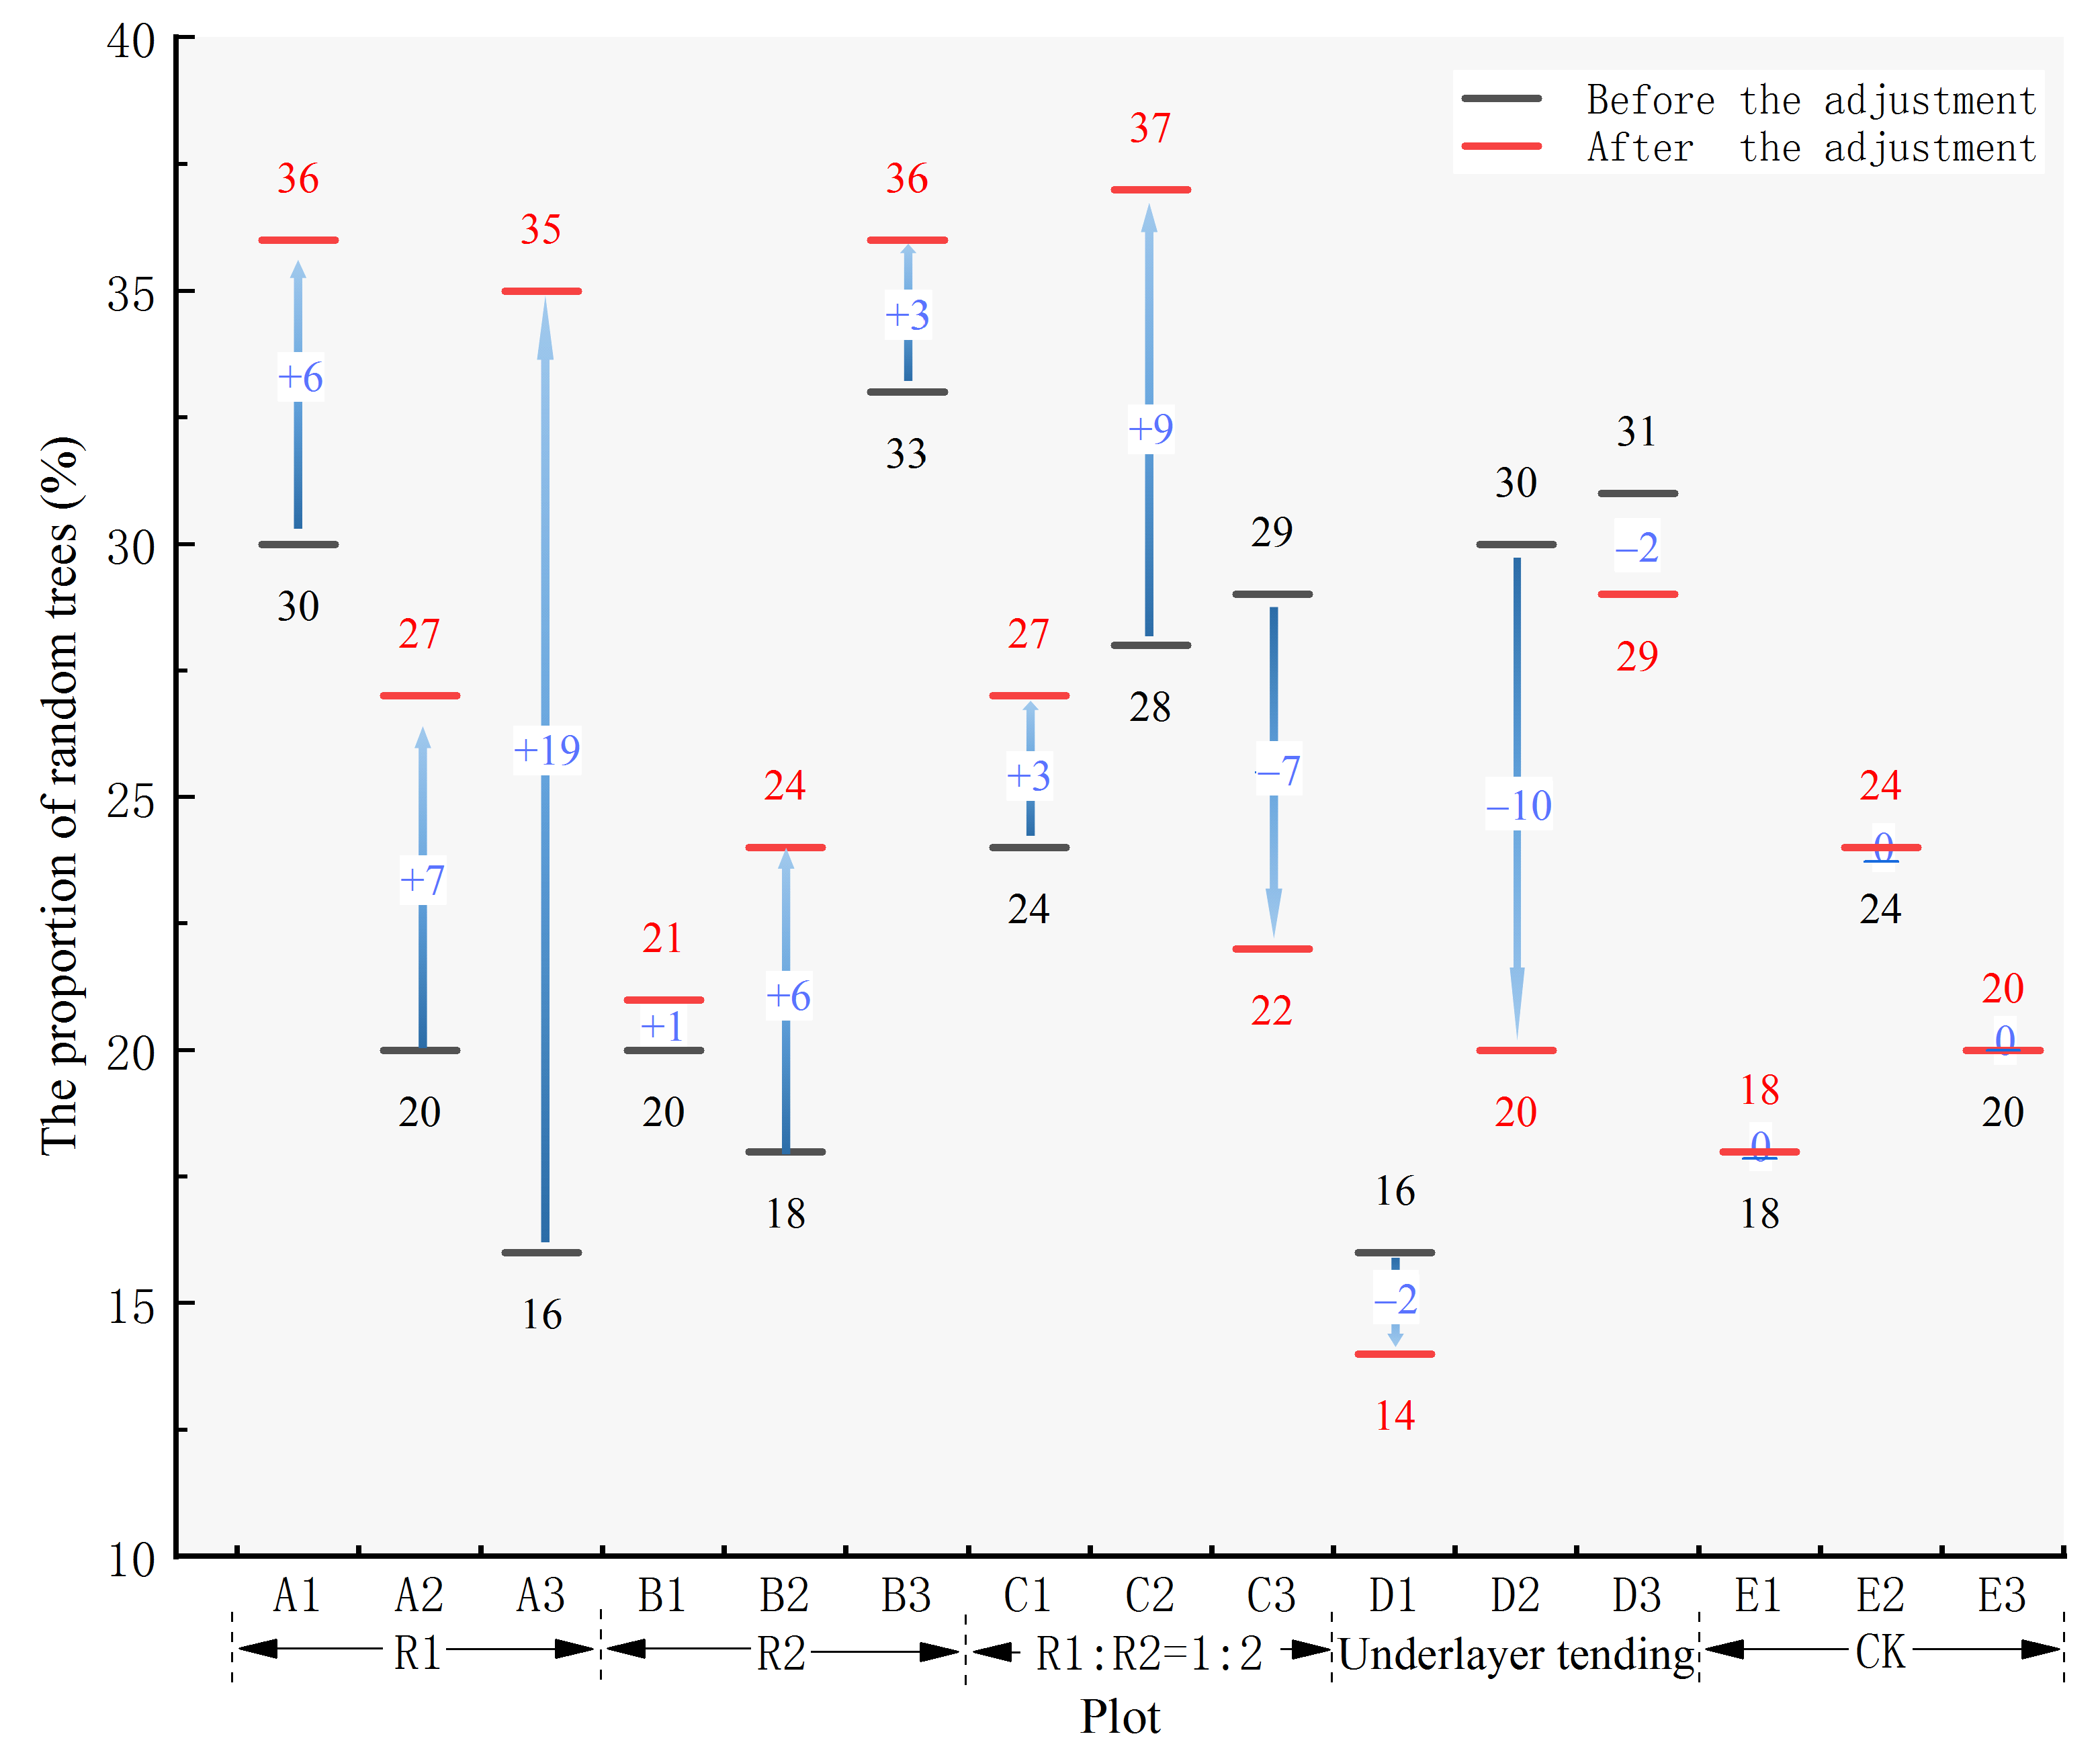
3.3. Change in Random Tree Proportion

Random trees constitute the main body of natural forests. More than 50% of the reference trees (number of trees or basal area) in a stand were random trees. Therefore, the focus of randomized management of plantations is how to construct more random structure units. Figure 5 shows the change in the proportion of random trees before and after stand management. In the randomized management, the proportion of random trees of the R1 and R2 management types was increasing; among them, the A3 plot increased the most, up to 19%. In the R1:R2 = 1:2 management model, the C1 and C2 plots showed an upward trend, increasing by 3% and 9%, respectively, while the C3 plot decreased by 7%. The proportion of random trees decreased after underlayer tending, and the rate of decline was between 2% and 10%. In general, randomized management effectively increased the proportion of random trees in forest stands, while underlayer tending caused the proportion to decrease.

4. Discussion

Forest structure is a process of dynamic development, and the change in pattern is a very long process, similar to forest succession. Not only is the change in pattern not obvious in a short time, but the effect is also difficult to predict after decades of recovery. Therefore, to shorten the succession process and improve the stable and efficient development of forests, it is necessary to promote the formation of a reasonable structure through human measures. The premise of reasonable adjustment of stand patterns is the method to accurately quantify forest distribution patterns. The uniform angle index has been proven to be an excellent pattern analysis method that has strong analytical ability for spatial structure without ranging or accurate measurement of the angle. Previous studies have shown that the randomness of tree distributions in natural forests can be properly described by the analysis method based on four adjacent trees, while the uniformity of tree distributions in artificial forests is due to the existence of special regular forms of equilateral triangle or isosceles triangle configurations. If the standard angle (72°) corresponding to n = 4 is directly used for analysis, the possibility that two distribution forms will be misjudged as random distributions—although it will not lead to the misjudgment of the overall stand pattern—will affect the judgment accuracy of some individual tree distribution patterns to a certain extent, so it needs to be corrected. In this study, the uniform angle index analysis method based on four adjacent trees was still applied, but the standard angle, 360°/(6 + 1) = 51.4°, based on six adjacent trees was adopted. According to this method, the results showed a uniform distribution, which was completely consistent with the real state of the stand, and no misjudgment problem occurred, which effectively improved the judgment accuracy of a single tree distribution pattern. Therefore, based on the method of correcting the uniform angle index standard angle and guided by structure-based forest management theory, our study compared the changes in the distribution pattern of trees after implementing randomized management and underlayer tending in L. kaempferi plantations. Our results showed that the mean value of the uniform angle index of the stand in the 15 plots before management ranged from 0.227 to 0.302, and the stands were uniformly distributed overall; the results were consistent with the Clark and Evans index. Even trees were the dominant species in all plots, accounting for more than 40%, the proportion of highly even trees and random trees was small, while the proportion of clustered trees was less than 5%. No highly clustered trees were found, which fully reflected the characteristics of plantations in rows and columns. After randomized management, the proportion of random trees in each plot significantly increased, among which the proportion of random trees in plot A3 increased by 19% and that in other plots increased by 1%~9%, while the proportion of random trees after underlayer tending decreased by 2%~10%. At the stand level, the mean value of W in most stands increased to varying degrees after randomized management, while the D2 and D3 plots decreased after underlayer tending management, and the D1 plot increased slightly. In conclusion, the spatial distribution pattern of stands tended to be more uniform after underlayer tending, while most plots were optimized to a certain extent after randomized management, and the forest stands were closer to a random distribution, but they had not yet reached the expected level of the climax community. It is worth noting that one-time optimization and adjustment cannot solve all the problems of forest distribution patterns; it should be carried out one step at a time, and multiple adjustments are needed to achieve the goal of forest management.
Generally, the horizontal distribution of natural forests in the climax community is randomly distributed [13,25]. By collecting the data of spatial distribution characteristics of natural forest communities in China, Zhang et al. (2009) [40] reported that the distribution pattern of Pinus tabuliformis natural forest in Haili River of Inner Mongolia, China, developed from a clustered distribution to a random distribution with the development of the population (saplingssmall treeslarge trees). Similar patterns have been found in studies of natural Castanopsis eyrei populations, rare and endangered Alsophila spinulosa populations, and Quercus liaotungensis populations, with the distribution pattern developing from a clustered distribution in their early successive stage to a clear random distribution in later successive stages [41,42,43]. In a mature climax natural community, those dominant species are generally randomly distributed, which not only reduces the intraspecific competition among individuals of the same species but also lessens the interaction between different dominant species. The trees of artificial forests are in rows and columns, and the whole community is dominated by similar structural units, which are usually uniform rather than random structural units. Such simple structural units easily cause a series of problems, such as low yield and quality, weak stability and poor sustainability. Numerous studies have shown that the largest difference between artificial forests and natural forests is not only the origin and species composition but also the essential difference in spatial structure, especially in the horizontal distribution pattern of forest trees. The regularity of the distribution pattern of plantation forests makes them lose their natural attributes, while the randomness of the distribution pattern in natural forests makes them have more stable productivity. Therefore, the key management measure to improve the quality of existing plantations, imitating nature, is the regulation of forest stand structure. As an important fast-growing plantation species in southern China, Eucalyptus can reach maturity for rotation at 5–6 years. Zhang et al. (2017) [44] studied the distribution pattern of 1–5-year-old LH1 Eucalyptus plantations and found that the mean value of the uniform angle index of each stand age ranged from 0.339 to 0.434, indicating that each stand age was uniformly distributed. It can be seen that the pure artificial forest will still maintain an even distribution in a short time after afforestation; at this time, the stand shows a symmetrical distribution of resources and fierce competition for intraspecific resources. Of course, with the development of the population, the increase in individual requirements on the environment will intensify intraspecific and interspecific competition, which will lead to the death of some individuals and a decrease in population density, and the distribution pattern at the community level will gradually transition from an even distribution to a random distribution. Ge et al. (2020) [45] found that the spatial distribution pattern of 29-year-old Larix principis-rupprechtii plantations in Saihanba, China, was generally randomly distributed; seedlings of 32-year-old Castanopsis hystrix plantations in southern subtropical China were mainly aggregated at small scales, and with the increase in diameter class, the aggregation intensity weakened and finally became a random distribution [46]. The spatial distribution pattern of 40-year-old Ormosia hosiei plantations in Baiyun Mountain, China, also showed a random distribution pattern [47]. These studies further confirm that the horizontal distribution pattern of the plantation will gradually transition from an even distribution pattern to a random distribution pattern after a long period of succession without serious disturbance, eventually reaching the stable structural characteristics of the climax community.
There is no doubt that the current plantation plays a very important strategic role in the timber supply, forest recreation, ecological protection, and environmental safety. However, it is an urgent problem to improve the forest productivity, ecological stability, and landscape quality of the existing low-quality large areally pure plantation by scientific and reasonable cultivation and transformation, and to induce its succession to a healthy and stable forest structure. Although natural succession communities can eventually reach a state of random distribution, this process usually takes decades. To shorten the process of succession and restoration and improve forest quality, it is necessary to adopt artificial measures to promote the process, and effective ways to promote the process rely on the management model to conduct orderly management. Structure-based forest management takes the natural succession law of natural forest climax community as the paradigm, abides by the systematic law of structure determining function, aims to cultivate healthy, stable, high-quality, and efficient forests, takes optimizing and adjusting forest structure as a means, uses stand spatial structural parameters to guide forest structure adjustment, and uses forest state change to evaluate the management effect in real time [48]. Up to date, structure-based forest management has been widely applied to different types of natural secondary forests in China, including the Korean pine and broad-leaved leaf mixed forest in Jilin Province, the mixed forest of Quercus mongolica in Liaoning Province, the mixed forest of pine and oak in Gansu Province, the natural forest of Pinus sylvestris in Inner Mongolia Autonomous Region, and the evergreen broadleaved forest in Guizhou Province. These provinces range from northeastern, northwestern and southwestern China. Such wide application of structure-based forest management over the years has yielded rich and positive data and relevant studies by researchers both at home and abroad has proven that structure-based forest management is an effective way to manage forests sustainably. With the rise of the concept of cultivating plantations that conform to nature, the close-to-natural forest structure has received increasing attention from forest managers at home and abroad. In line with the idea of “imitating natural forests and cultivating plantation forests”, a randomized management experiment of L. kaempferi plantations was carried out. This study not only offered a precedent for the adjustment of plantation density patterns, but also provided a theoretical basis and technical support for the implementation of near-naturalization structure regulation of plantations.

5. Conclusions

The method based on the modified uniform angle index standard angle could effectively improve the accuracy of the distribution pattern of individual trees in plantation forests and further improve the accuracy of the overall stand pattern quantitatively. We applied the method to compare the effects of randomized management on the forest distribution patterns of Larix kaempferi plantation. We found that randomized management significantly increased the proportion of random trees in the stands, which accelerated the evolution of the forest distribution pattern of the L. kaempferi plantation to a random distribution. These results of the study should be useful for providing a scientific basis to guide near-natural planted forests or to adjust large-diameter trees in existing forests to a more complex structure.

Author Contributions

J.X. jointly conceived the study with G.H.; Y.H., W.L., and Z.Z. designed the experiments and collected data; J.X. and G.Z. presented the method; J.X. and G.Z. analyzed the data; Writing—original draft, A.Y.; J.X. wrote the manuscript. All authors discussed the results and reviewed the manuscript. All authors have read and agreed to the published version of the manuscript.

Funding

This research was funded by the National Key Research and Development Program of China (grant number: 2016YFD0600203).

Institutional Review Board Statement

Not applicable.

Informed Consent Statement

Not applicable.

Conflicts of Interest

The authors declare no conflict of interest.

References

  1. Liu, B.; Liu, Q.; Daryanto, S.; Guo, S.; Huang, Z.; Wang, Z.; Wang, L.; Ma, X. Responses of Chinese fir and Schima superba seedlings to light gradients: Implications for the restoration of mixed broadleaf-conifer forests from Chinese fir monocultures. For. Ecol. Manag. 2018, 419–420, 51–57. [Google Scholar] [CrossRef] [Green Version]
  2. Plath, M.; Mody, K.; Potvin, C.; Dorn, S. Establishment of native tropical timber trees in monoculture and mixed-species plantations: Small-scale effects on tree performance and insect herbivory. For. Ecol. Manag. 2011, 261, 741–750. [Google Scholar] [CrossRef]
  3. Huang, Y.; Chen, Y.; Castro-Izaguirre, N.; Baruffol, M. Impacts of species richness on productivity in a large-scale subtropical forest experiment. Science 2018, 362, 80–83. [Google Scholar] [CrossRef] [PubMed] [Green Version]
  4. Frey, S.J.K.; Hadley, A.S.; Johnson, S.L.; Schulze, M.; Jones, J.A.; Betts, M.G. Spatial models reveal the microclimatic buffering capacity of old-growth forests. Sci. Adv. 2016, 2, e1501392. [Google Scholar] [CrossRef] [PubMed] [Green Version]
  5. Enquist, B.J.; West, G.B.; Brown, J.H. Extensions and evaluations of a general quantitative theory of forest structure and dynamics. Proc. Natl. Acad. Sci. USA 2009, 106, 7046–7051. [Google Scholar] [CrossRef] [Green Version]
  6. Spies, T.A. Forest structure: A key to the ecosystem. Northwest Sci. 1998, 72, 34–39. [Google Scholar]
  7. Gamfeldt, L.; Snall, T.; Bagchi, R.; Jonsson, M.; Gustafsson, L.; Kjellander, P.; Ruiz-Jaen, M.C.; Froberg, M.; Stendahl, J.; Philipson, C.D.; et al. Higher levels of multiple ecosystem services are found in forests with more tree species. Nat. Commun. 2013, 4, 1340. [Google Scholar] [CrossRef] [PubMed]
  8. Wan, P.; Zhang, G.; Wang, H.; Zhao, Z.; Hu, Y.; Zhang, G.; Hui, G.; Liu, W. Impacts of different forest management methods on the stand spatial structure of a natural Quercus aliena var. acuteserrata forest in Xiaolongshan, China. Ecol. Inform. 2019, 50, 86–94. [Google Scholar] [CrossRef]
  9. Hui, G.; Hu, Y. Application of neighborhood pattern in forest spatial structure regulation. For. Resour. Manag. 2006, 2, 31–35. [Google Scholar]
  10. Illian, J.; Penttinen, A.; Stoyan, H.; Stoyan, D. Statistical Analysis and Modelling of Spatial Point Patterns; Wiley: Chichester, England, 2008. [Google Scholar]
  11. Pretzsch, H. Analysis and modeling of spatial stand structures. Methodological considerations based on mixed beech-larch stands in Lower Saxony. For. Ecol. Manag. 1997, 97, 237–253. [Google Scholar] [CrossRef]
  12. Pommerening, A.; Grabarnik, P. Individual-Based Methods in Forest Ecology and Management; Springer: Cham, Switzerland, 2019. [Google Scholar]
  13. Zenner, E.K. Does old-growth condition imply high live-tree structural complexity? For. Ecol. Manag. 2004, 195, 243–258. [Google Scholar] [CrossRef]
  14. Pommerening, A.; Zhang, G.; Zhang, X. Unravelling the mechanisms of spatial correlation between species and size diversity in forest ecosystems. Ecol. Indic. 2020, 121, 106995. [Google Scholar] [CrossRef]
  15. Ward, J.S.; Ferrandino, F.J. New derivation reduces bias and increases power of Ripley’s L index. Ecol. Model. 1999, 116, 225–236. [Google Scholar] [CrossRef]
  16. Ward, J.S.; Parker, G.R. Spatial dispersion of woody regeneration in an old-growth forest. Ecology 1989, 70, 1279–1285. [Google Scholar] [CrossRef]
  17. Ward, J.S.; Parker, G.R.; Ferrandino, F.J. Long-term spatial dynamics in an old-growth deciduous forest. For. Ecol. Manag. 1996, 83, 189–202. [Google Scholar] [CrossRef]
  18. Hui, G.; Zhang, G.; Zhao, Z.; Yang, A. Methods of forest structure research: A review. Curr. For. Rep. 2019, 5, 142–154. [Google Scholar] [CrossRef]
  19. Li, Y.; Hui, G.; Zhao, Z.; Hu, Y. The bivariate distribution characteristics of spatial structure in natural Korean pine broad-leaved forest. J. Veg. Sci. 2012, 23, 1180–1190. [Google Scholar] [CrossRef]
  20. Corral-Rivas, J.J.; Wehenkel, C.; Castellanos-Bocaz, H.A.; Vargas-Larreta, B.; Die’guez-Aranda, U. A permutation test of spatial randomness: Application to nearest neighbour indices in forest stands. J. For. Res. 2010, 15, 218–225. [Google Scholar] [CrossRef]
  21. Graz, F.P. Spatial diversity of dry savanna woodlands. Assessing the spatial diversity of a dry savanna woodland stand in northern Namibia using neighbourhood-based measures. Biodivers. Conserv. 2006, 15, 1143–1157. [Google Scholar] [CrossRef]
  22. Greig-Smith, P. The use of random and contiguous quadrats in the study of the structure of plant communities. Ann. Bot. 1952, 16, 293–316. [Google Scholar] [CrossRef]
  23. Pommerening, A. Approaches to quantifying forest structures. Forestry 2002, 75, 305–324. [Google Scholar] [CrossRef]
  24. Zhang, G.; Hui, G.; Zhao, Z.; Hu, Y.; Wang, H.; Liu, W.; Zang, R. Composition of basal area in natural forests based on the uniform angle index. Ecol. Inform. 2018, 45, 1–17. [Google Scholar] [CrossRef]
  25. Zhang, G.; Hui, G.; Yang, A.; Zhao, Z. A simple and effective approach to quantitatively characterize structural complexity. Sci. Rep. 2021, 11, 1326. [Google Scholar] [CrossRef]
  26. Du, C.; Xu, Y.; Sun, X.; Liu, Y.; XIe, P. Variation of growth traits and early selection of Larixkaempferi clones in sub-alpine area of western Hubei Province. J. Huazhong Agric. Univ. 2015, 34, 19–23. [Google Scholar]
  27. Jiao, Y.; Sun, X.; Zhao, K.; Xie, Y.; Zhang, J.; Yang, Y. An elite of Larix kaempferi ‘Luoyang 1′. Sci. Silvae Sin. 2015, 51, 146. [Google Scholar]
  28. Xia, G.; Sun, X.; Chen, D.; Zhang, S. Spatial variation of photosynthetic characteristics in canopy of Larix kaempferi. Sci. Silvae Sin. 2019, 55, 13–21. [Google Scholar]
  29. Xie, J.; Yan, Q.; Zhang, T. Temporal effects of thinning on the composition and growth of regenerated woody plants in Larix kaempferi plantations. Chin. J. Appl. Ecol. 2020, 31, 2481–2490. [Google Scholar]
  30. Gong, Y.; Wu, G.; Xu, J.; Ren, H. Bending properties of cross-laminated timber fabricated with Larix kaempferi. J. Northwest A F Univ. (Nat. Sci. Ed.) 2018, 46, 25–38. [Google Scholar]
  31. Chen, D.; Sun, X.; Zhang, S. Biomass, carbon storage and nutrient characteristics in Larix kaempferi plantations at different stand ages. Chin. J. Appl. Ecol. 2016, 27, 3759–3768. [Google Scholar]
  32. Huang, X.; Sun, X.; Zhang, S.; Chen, D. Compatible biomass models for Larix kaempferi in mountainous area of eastern Liaoning. For. Res. 2014, 27, 142–148. [Google Scholar]
  33. Wang, H.; Sun, X.; Chen, D.; Shen, Y.; Ma, J. Changes of soil physical and chemical properties at different developmental stages of Larix kaempferi Plantations in Xiaolongshan, Gansu Province. For. Res. 2012, 25, 294–301. [Google Scholar]
  34. Yu, L.; Zhang, J.; Liu, L.; Zhang, J.; Yang, K. The effects of thinning on soil enzyme activities in Larix kaempferi plantations with different site conditions. Chin. J. Ecol. 2017, 36, 3017–3027. [Google Scholar]
  35. Niu, X.; Sun, X.; Chen, D.; Zhang, S. Soil microorganisms, nutrients and enzyme activity of Larix kaempferi plantation under different ages in mountainous region of eastern Liaoning Province, China. Chin. J. Appl. Ecol. 2015, 26, 2663–2672. [Google Scholar]
  36. Hui, G. Theory and Practice of Structure-Based Forest Management; Science Press: Beijing, China, 2020. [Google Scholar]
  37. Clark, P.J.; Evans, F.C. Distance to nearest neighbor as a measure of spatial relationships in populations. Ecology 1954, 35, 213–227. [Google Scholar] [CrossRef]
  38. Hui, G.; Gadow, K.V. Das Winkelmass-Theoretische Überlegungen zum optimalen Standardwinkel. Llgemeine Forst Jagdzeitg. 2002, 173, 173–177. [Google Scholar]
  39. Hui, G.; Gadow, K.V.; Hu, Y. The optimum standard angle of the uniform angle index. For. Res. 2004, 17, 687–692. [Google Scholar]
  40. Zhang, Y.; Zhang, C.; Zhao, X. Spatial distribution pattern of main tree species in Pinus tabulaeformis forest of Heilihe in Inner-Mongolia. Acta Bot. Boreali Occident. Sin. 2009, 29, 167–173. [Google Scholar]
  41. Song, P.; Hong, W.; Wu, C.; Feng, L.; Fan, H.; Zhu, H.; Lin, Y.; Zhang, Q. Population structure and its dynamics of rare and endangered plant Alsophila spinulosa. Chin. J. Appl. Ecol. 2005, 16, 413–418. [Google Scholar]
  42. Yi, L.; Han, H.; Cheng, X.; Kang, F.; Zhang, Z. Spatial distribution patterns of Quercus liaotungensis population in Lingkong Mountains. Acta Ecol. Sin. 2008, 28, 3254–3261. [Google Scholar]
  43. Xu, X.; Yu, M.; Hu, Z.; Li, M.; Zhang, F. The structure and dynamics of Castanopsis eyrei population in Gutian Mountain Natural Reserve in Zhejiang, East China. Acta Ecol. Sin. 2005, 25, 645–653. [Google Scholar]
  44. Zhang, X.; Bao, N.; Liu, L.; Mo, X.; Mei, J.; Xie, Y. Structural characteristics and control techniques of Eucalyptus Stand. J. Northwest For. Univ. 2017, 32, 45–51. [Google Scholar]
  45. Ge, Z.; Yuan, M.; Shan, B.; Huang, X.; Zhang, Z. Evaluation of management modes on Larix principis-rupprechtii plantations in Saihanba of Hebei Province, China. For. Res. 2020, 33, 38–47. [Google Scholar]
  46. Xu, H.; Zheng, L.; Wang, H.; Nong, Y.; Chen, Y.; Li, M.; Cai, D.; You, Y. Seedling regeneration and spatial correlation between seedlings and seed trees in Castanopsis hystrix plantation by large diameter wood cultivation in south subtropical China. Chin. J. Appl. Ecol. 2020, 31, 1055–1062. [Google Scholar]
  47. You, G.; Ye, H.; Jiao, J.; Lin, L.; Liu, W.; Wu, C. Size class structure and spatial distribution pattern of Ormosia hosiei plantation in Baiyun Mountain, Lishui. Guihaia 2017, 37, 799–805. [Google Scholar]
  48. Hui, G.; Hu, Y.; Zhao, Z. Research progress of structure-based forest management. For. Res. 2018, 31, 85–93. [Google Scholar]
Figure 1. The random tree was classified by different distributions of angles.
Forests 12 00981 g001
Figure 2. Different standard angles were used to judge the distribution pattern of the same single tree. (a) Six nearest adjacent trees of a reference tree in a regularly planted stand. (b) When n = 4, the four nearest neighbors of the reference tree may have three forms. The reference tree is represented by a red circle, the nearest adjacent trees are represented by a green circle, and α0 represents the standard angle. Wi represents the uniform angle index of each individual.
Forests 12 00981 g002
Figure 3. Schematic diagram of the “randomized management of medium- and large-diameter trees” method: (a) several medium- and large-diameter trees selected from the management forest stand are represented by red circles; (b) the 8 nearest neighbors of a medium- and large-diameter tree. Two trees need to be cut down due to unhealthy status, and they are represented by the × symbol. The green circle represents trees that may be temporarily reserved as neighbors. (c) After cutting unhealthy trees, four large trees that can form random structure units were selected, which are represented by green circles, while the other gray trees were not treated.
Forests 12 00981 g003
Figure 4. Uniform angle index distribution of stands with different management modes. Note: W 1 ¯ and W 2 ¯ represent the mean value of the uniform angle index before and after stand adjustment, respectively. A1–C3 indicates randomized management, D1–D3 indicates underlayer tending, and E1–E3 indicates unmanaged control.
Forests 12 00981 g004
Figure 5. Changes in random tree proportion in different management modes.
Forests 12 00981 g005
Table 1. The values and meanings of the uniform angle index.
Wi0.000.250.500.751.00
Graphic Forests 12 00981 i001 Forests 12 00981 i002 Forests 12 00981 i003 Forests 12 00981 i004 Forests 12 00981 i005
PatternHighly evenEvenRandomClusteredHighly clustered
Structure unitEven structure unitRandom structure unitCluster structure unit
Table 2. Plot information for L. kaempferi plantations.
Management ModelsPlotStand Density/
(tree/ha)
Average DBH/
cm
Average Height/
m
Basal Area/
(m2/ha)
Volume/
m3
Average Volume/
(m3/ha)
R1A1172512.914.022.7143.9170.2
A2177513.713.826.0161.8
A3212513.814.131.6204.9
R2B1187513.014.025.0158.3172.4
B2197513.113.926.4165.6
B3175015.014.031.1193.4
R1:R2 = 1:2C1190012.814.024.3154.9173.1
C2190013.513.527.3169.0
C3190014.414.331.1195.5
Underlayer
tending
D1196012.913.825.6156.8172.6
D2167513.914.225.3161.1
D3185014.814.331.7199.8
CKE1210012.413.625.3158.2172.3
E2147514.814.525.3164.9
E3175015.114.131.3193.6
Table 3. Clark and Evans index values and spatial pattern types of stand with different management modes.
Management ModelsPlotBefore the AdjustmentAfter the Adjustment
CE IndexSpatial Pattern TypeCE IndexSpatial Pattern Type
R1A11.37 Uniform1.32 Uniform
A21.43 Uniform1.34 Uniform
A31.44 Uniform1.33 Uniform
R2B11.41 Uniform1.36 Uniform
B21.47 Uniform1.43 Uniform
B31.37 Uniform1.39 Uniform
R1:R2 = 1:2C11.38 Uniform1.43 Uniform
C21.46 Uniform1.39 Uniform
C31.28 Uniform1.38 Uniform
Underlayer tendingD11.36 Uniform1.32 Uniform
D21.30 Uniform1.29 Uniform
D31.41 Uniform1.45 Uniform
CKE11.41 Uniform1.41 Uniform
E21.39 Uniform1.39 Uniform
E31.42 Uniform1.42 Uniform
Publisher’s Note: MDPI stays neutral with regard to jurisdictional claims in published maps and institutional affiliations.

