Article

Mapping Boreal Forest Spruce Beetle Health Status at the Individual Crown Scale Using Fused Spectral and Structural Data

1
Department of Environmental Science, American University, Washington, DC 20016, USA
2
School of Informatics, Computing and Cyber Systems, Northern Arizona University, Flagstaff, AZ 86011, USA
3
Biospheric Sciences, NASA Goddard Space Flight Center, Greenbelt, MD 20771, USA
*
Author to whom correspondence should be addressed.
Submission received: 9 June 2021 / Revised: 13 August 2021 / Accepted: 18 August 2021 / Published: 25 August 2021
(This article belongs to the Section Forest Inventory, Modeling and Remote Sensing)

Abstract

:
The frequency and severity of spruce bark beetle outbreaks are increasing in boreal forests leading to widespread tree mortality and fuel conditions promoting extreme wildfire. Detection of beetle infestation is a forest health monitoring (FHM) priority but is hampered by the challenges of detecting early stage (“green”) attack from the air. There is indication that green stage might be detected from vertical gradients of spectral data or from shortwave infrared information distributed within a single crown. To evaluate the efficacy of discriminating “non-infested”, “green”, and “dead” health statuses at the landscape scale in Alaska, USA, this study conducted spectral and structural fusion of data from: (1) Unoccupied aerial vehicle (UAV) multispectral (6 cm) + structure from motion point clouds (~700 pts m−2); and (2) Goddard Lidar Hyperspectral Thermal (G-LiHT) hyperspectral (400 to 1000 nm, 0.5 m) + SWIR-band lidar (~32 pts m−2). We achieved 78% accuracy for all three health statuses using spectral + structural fusion from either UAV or G-LiHT and 97% accuracy for non-infested/dead using G-LiHT. We confirm that UAV 3D spectral (e.g., greenness above versus below median height in crown) and lidar apparent reflectance metrics (e.g., mean reflectance at 99th percentile height in crown), are of high value, perhaps capturing the vertical gradient of needle degradation. In most classification exercises, UAV accuracy was lower than G-LiHT indicating that collecting ultra-high spatial resolution data might be less important than high spectral resolution information. While the value of passive optical spectral information was largely confined to the discrimination of non-infested versus dead crowns, G-LiHT hyperspectral band selection (~400, 675, 755, and 940 nm) could inform future FHM mission planning regarding optimal wavelengths for this task. Interestingly, the selected regions mostly did not align with the band designations for our UAV multispectral data but do correspond to, e.g., Sentinel-2 red edge bands, suggesting a path forward for moderate scale bark beetle detection when paired with suitable structural data.

1. Introduction

The spruce beetle (Dendroctonus rufipennis (Kirby)) is endemic to the natural range of spruce trees (Picea spp.) throughout the western United States and Canada. The beetles are generally confined to colonizing windthrown spruce trees unless environmental conditions and stand age lead to increased beetle populations or stressed forest stands, allowing for infestation of live spruce [1]. Outbreaks are a natural component of spruce systems, typically occurring after one or more years of above average warm and dry conditions, though they are expected to increase in frequency and severity with climate change [2]. Increased temperatures and drought support longer breeding seasons and weaken potential hosts, fueling a cycle of surging beetle populations and widespread mortality of spruce [2]. In the Alaskan boreal forest (the site of this study), there is currently a large beetle outbreak under way, and has impacted 1.2 million acres in Southcentral Alaska since 2016 [3]. However, extensive monitoring is challenging in this vast landscape with limited road access, thus highlighting the need for airborne and satellite-based approaches to quantifying beetle damage.
Early detection of outbreaks will be critical if forest managers are to minimize threats to economic and natural resources, including forestry timber stands, protected watersheds, sensitive ecosystems, and recreation areas [1,4,5]. To date, visual aerial survey has been most accurate in detecting the precise location and extent of infestations, but only after visible changes in foliage color [6]. Unfortunately, aerial visual detection of initial beetle colonization is typically not possible because spruce foliage can appear green for multiple seasons after the initial spruce beetle attack, even if imperceptible physiological changes occur as soon as a few weeks post-infestation [7,8]. By the time an infestation is observable through foliage changes from green to yellow and red, egg-bearing adults have spread to trees up to two or three kilometers away [1,9].
Physiological response has been shown to manifest in multiple regions of the electromagnetic radiation (EMR) spectrum [6,7], opening the door to automated detection of infestation through remote monitoring. Satellite platforms provide the optimal scale for regional infestation assessments, but previous research has demonstrated mixed success in their ability to separate health statuses. Setinel-2 (10 m visible-near infrared (VNIR) and 20 m red-edge and SWIR) imagery detected statistically significant differences in mean reflectance between healthy and green pixels in NIR (842 nm), SWIR1 (1610 nm), and SWIR2 (2190 nm) bands, but only achieved 67% overall accuracy (OA) in separating healthy and recently infested pixels [7]. Higher spatial resolution RapidEye (6.5 m) and SPOT5 (10 m) images were used to assess bark-beetle induced spectral changes within a spring-summer time series [10]. In this case, RapidEye red-edge (690–730 nm) and SPOT5 SWIR (1580–1750 nm) maximized separability between healthy and green pixels for the full study duration. Differences between health statuses were more evident for RapidEye versus SPOT5, suggesting the utility of higher spatial resolution data for a physiological process that can vary at the crown scale.
Unoccupied Aerial Vehicles (UAV) [11] provide ultra-high resolution imagery facilitating individual crown assessment and informing more efficient implementation of costly management actions like culling or spraying repellent [2]. Many previous UAV-based forest health monitoring (FHM) studies, including temporal change surveys, have been conducted using multispectral and hyperspectral sensors [12]. Red-green-blue (RGB) and NIR (760 nm) UAV-mounted cameras observed sub-annual changes in newly infested Norway spruce and found the Greenness Index (red:green) to be increasingly effective with time since infestation 78% accuracy after initial physiological symptoms were visible, and 96% accuracy after full decline [5].
The documented successes of UAV platforms working at the scale of the individual crown make them desirable for targeted FHM efforts, but a UAV-based methodology is not viable at regional extents due to technical and regulatory restrictions on unoccupied flight [13]. Piloted aircraft, by contrast, can also image at sub-decimeter resolution and provide landscape- to regional-scale data coverage for forest inventory (Alonzo et al., 2020). Niemann et al. [14] used aircraft-based hyperspectral VNIR (400–2500 nm) data to successfully detect (Overall Accuracy [OA] = 73%) crown-level change in girdled versus healthy plantation Lodgepole pines (Pinus contorta). Näsi et al. [15] similarly used hyperspectral VNIR data to classify healthy, late-infestation, and yellowing, and dead Norway spruce crowns (0.5 m; OA = 73%) at a level comparable to UAV imagery (10 cm, OA = 81%). Like past research using other platforms, aircraft studies found the green (551 nm), red (626 and 680 nm), red-edge (726, 773, 794 nm), and SWIR (1200 nm) spectral regions to be most useful for health status monitoring.
Spectrally based approaches dominate past research and can be used to separate healthy from late-stage infested trees. Classification that includes newly infested or green status trees in a natural forest setting remains challenging [15,16,17]. Research on bark beetle infested trees has demonstrated that older needles within the upper canopy and away from branch ends experience discoloration first, possibly concurrent to development of new needles at branch tips [1,9]. This location-specific discoloration and the presence of mixed-age needles suggest the need for remote sensing tools capable of capturing spectral information along a vertical gradient through the canopy.
UAV structure-from-motion (SfM) may support detection of location-specific discoloration through the inherent link of spectral and structural data. Past efforts have demonstrated the utility of SfM for tree crown segmentation, biophysical surveys, biomass and health assessments, and species identification [18,19,20]. While several SfM-based health assessments involving the detection of beetle infestation utilized combinations of spectral and structural data for crown segmentation [5,15,17,21], very few have attempted health status classification using this fused data [19]. Although the ability of SfM to collect data from inside tree canopies is largely minimized since SfM is an imagery-based approach, Alonzo et al. [13] found high correlation among SfM and lidar-derived sub-canopy shrub structural metrics, indicating that some information from the crown interior is available.
Fusion of airborne imagery and lidar provides an alternative method of spectral and structural fusion at the regional scale. Lidar has consistently proven a reliable tool for forest inventory with the capacity to detect information inside or below the canopy [22,23] and the ability to generate a digital terrain model for crown height reference [24,25]. The utility of using intensity (or apparent reflectance) of the lidar return energy to detect canopy water content and beetle-induced green status has been suggested, especially if its wavelength lies within the SWIR range [6,8,14,20]. Still, the point cloud density of airborne scanning lidar is relatively sparse compared to UAV SfM and does not include color information, potentially limiting utility in detecting change within the crown [1,9]. Marginal success, albeit in a different species (I. typographus; OA = 66%), by [26] in classifying no, low, and moderate infestation Norway spruce using terrestrial laser scanning (TLS) intensity metrics (dual beam 905 and 1550 nm) illustrates the limitation of lidar on its own. While structural data has potential to provide location-specific details within the crown, inclusion of spectral data likely remains important.
To date, there has been limited research relating to the detection of white spruce health status using fusion of spectral and structural features from either UAV or piloted aircraft. Therefore, the goal of this study is to demonstrate a method for classifying white spruce health statuses (“non-infested”, “green”—green-stage infested, or “dead”—red or gray-stage infested) at the individual tree crown scale using high-resolution multi- or hyperspectral data fused with structural information. Within our Alaskan boreal forest study site, we: (1) used fusion of UAV multispectral imagery and SfM to classify crown health status; (2) fused hyperspectral imagery and SWIR apparent reflectance lidar returns from NASA’s Goddard Lidar Hyperspectral (G-LiHT) platform to classify health status; (3) reported the optimal wavelengths and structural metrics for detecting crown-level health status; and (4) compared UAV and G-LiHT results to understand the tradeoffs between high spatial (UAV) and high spectral (G-LiHT) resolution image data; high point cloud density of SfM and SWIR apparent reflectance lidar data; and canopy penetrating lidar versus SfM.

2. Materials and Methods
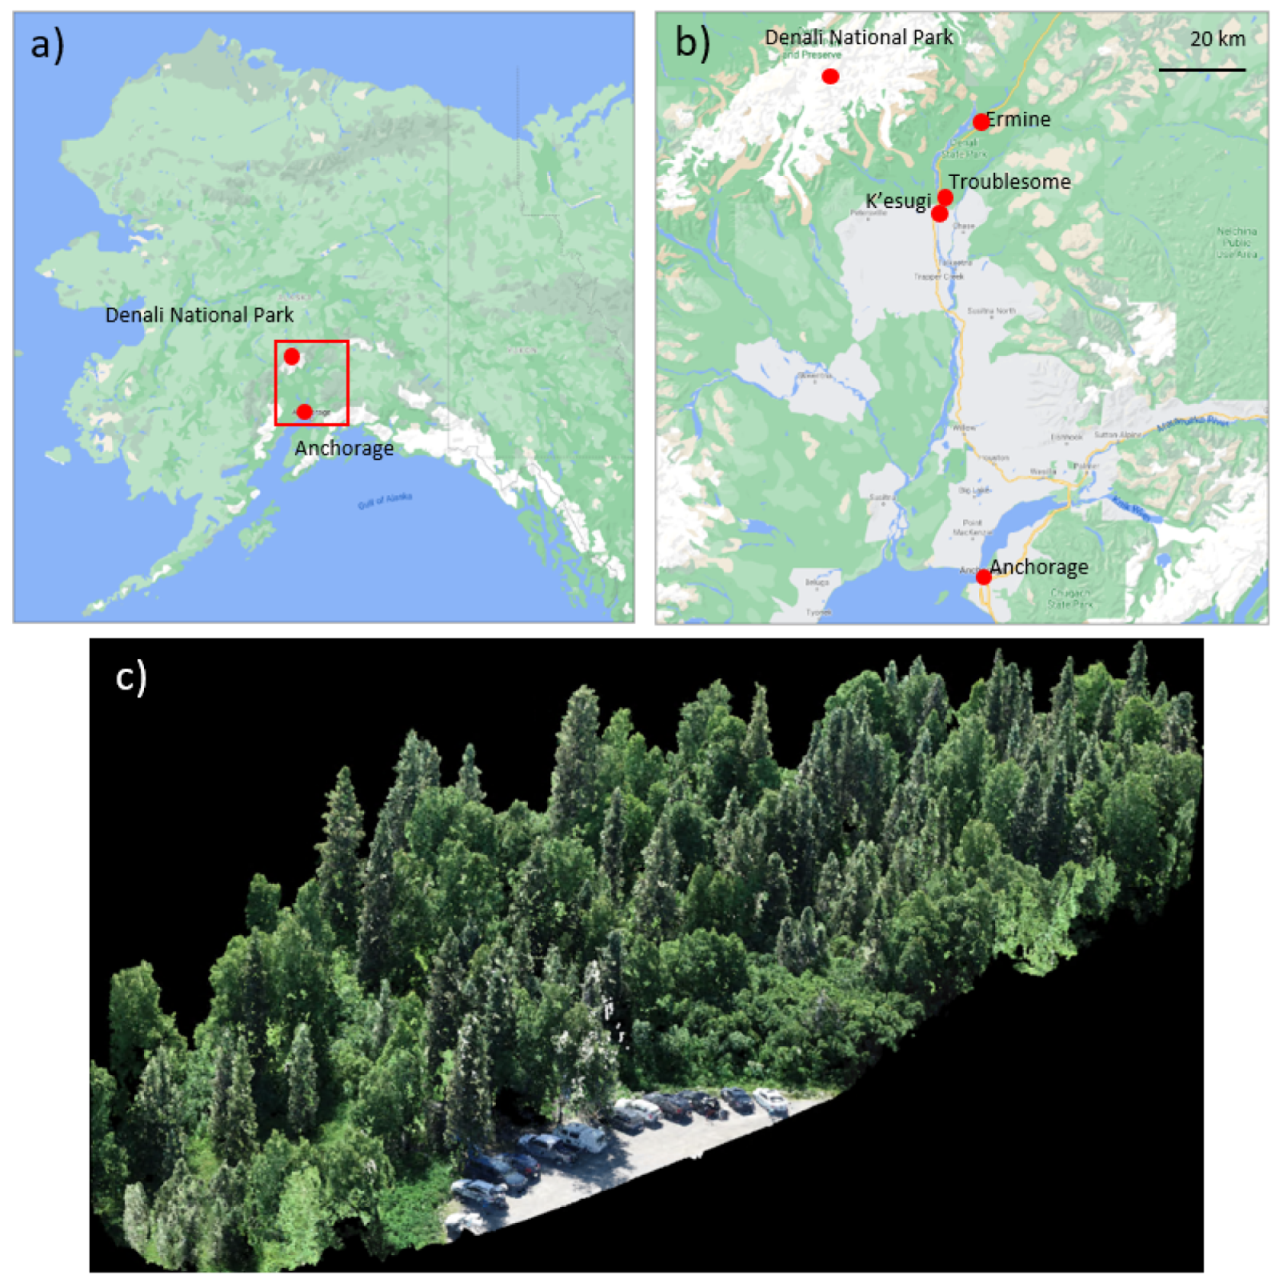
2.1. Study Area

The study area comprises three separate, but qualitatively similar, road-adjacent sites located within Denali State Park, roughly 250 km north of Anchorage, Alaska, on Highway 3 (Figure 1): Ermine Hill Trailhead (Ermine, 62.827°, −149.903°), Upper Troublesome Creek Trailhead (Troublesome, 62.630°, −150.226°), and K’esugi Ken Campground (K’esugi, 62.602°, −150.230°).

2.2. Field Data Acquisition

A total of 152 white spruce crowns were catalogued across five sites in the summer of 2018. For logistical reasons, only three sites were flown by UAV, resulting in 87 crowns available for this analysis (Table 1). Each tree was marked as “non-infested”, “green”, or “dead”. Trees that were “non-infested” had no visible evidence of infestation and had green needles. “Green” trees were identified by the presence of boring dust at bark crevices and at the base of the tree, pitch tubes or resin exudation from the bole, and needles that were still green. In cases where it was unclear if a tree had been successfully infested, some bark was removed to search for newly constructed egg galleries in the phloem. Trees that were “dead” had clear signs of previous spruce beetle infestation, and brown, gray, or missing needles. The GPS location of each tree was located to a post-processing precision of <0.5 m using either a Trimble Geo7x (Trimble, Sunnyvale, CA, USA) or a Javad Triumph-2 (Javad GNSS, Inc., San Jose, CA, USA) GPS unit. Troublesome and K’esugi sites had a balanced number of crowns across all health statuses, while Ermine had no dead crowns and a high proportion of green and non-infested crowns.

2.3. UAV Data Collection and Processing

UAV data were collected within a five-day window between 17 and 22 July 2018 with some variability in illumination conditions (Table 1). We acquired imagery at each site using two UAVs: one to capture structural and RGB information at the highest possible resolution, and the other to gather five-band multispectral data for generating common remote sensing vegetation indices. Fine-resolution RGB imagery was acquired using the DJI Phantom 4 Pro (P4P; DJI, Shenzhen, China), a consumer-grade quadcopter with a 20 Megapixel camera. Multispectral imagery was acquired using the MicaSense RedEdge (MicaSense, Seattle, WA, USA) flown aboard the DJI Matrice 210. The RedEdge samples in the visible and near infrared wavelengths, collecting five bands with center wavelengths of 475, 560, 668, 717, and 840 nm (hereafter referred to as blue, green, red, red-edge, and NIR). The RedEdge sensor is paired with an upward looking irradiance sensor to correct radiance imagery to at-sensor reflectance.
To generate data acquisition grids and flight parameters we used the iOS app Pix4DCapture (Pix4D, Lausanne, Switzerland). We established flight boxes based on the bounding boxes of the field data collection at each site, with box sizes ranging between 8.1 and 10.4 ha. In order to establish convergent view geometry and maximize 3D information content, the P4P was flown in a double, perpendicular serpentine grid pattern at nominal 55 m AGL with camera angle 20° off nadir and 90% image overlap [18,27]. Following [18], we deployed five bright colored ground targets throughout the plot in areas with full sky view. Each target was located to a post-processing precision of 0.1 m using the GPS receivers referenced in Section 2.2. Precision of ground targets is higher than that of tree stems because of purposeful selection of sites with high sky view.
For each acquisition, raw image data (6–10 cm multispectral and 2–3 cm RGB) were processed to a sparse point cloud using SfM followed by densification, leveraging multi-view stereo algorithms in the Pix4D software. We followed standard Pix4D processing procedures, including: the computation of tie points among overlapping images and bundle block adjustment; manual alignment of the ground targets to differentially corrected ground control points followed by re-optimization of computed camera positions and internal camera parameters; and generation of dense point cloud using default image scale and point density options (Pix4D, 2017). On the same campaign but at a different, more complex site, the median absolute 3D positional error of our SfM point clouds was 0.25 m, based on leave-one-out cross-validation of ground control points (Alonzo et al., 2020). Final point cloud densities averaged ~700 points m-2 with some variability depending on site-specific vegetation structure, ground sample distance, availability of viable tie points, and other acquisition parameters. Using R software (R Core Team, 2020), points were translated to heights via subtraction of the 1 m G-LiHT lidar-based DTM [13,18,28] and points with a height less than 2 m were removed to avoid confusion with understory vegetation.

2.4. G-LiHT Data Collection and Processing

The Goddard Lidar Hyperspectral Thermal (G-LiHT) is equipped to collect high pulse density, small-footprint lidar data, VNIR hyperspectral imagery, broadband thermal imagery, and high resolution (RGB) aerial photos (https://gliht.gsfc.nasa.gov; [29] accessed on 23 August 2021). Precision GPS and inertial measurements and pre- and post-campaign boresight alignment ensures lidar returns have a known horizontal and vertical positional accuracy of 0.1 and 0.2 m, respectively.
Here, we sought to understand the spectral and structural manifestations of bark beetle infestation using G-LiHT VNIR hyperspectral data and lidar. G-LiHT imaging spectroscopy data were collected between 400 and 1000 nm using the Headwall Photonics Micro-Hyperspec E-series sensor. This spectral range is initially sampled at 1.6 nm spacing and then binned to 5 nm to improve signal to noise. The Micro-Hyperspec sensor is a line-scanner (pushbroom) with 1600 across-track pixels leading to a ground instantaneous field of view of ~0.5 m at the nominal flight altitude of 335 m. G-LiHT collects structural information using two, 1550 nm Riegl VQ-480i (Horn, Austria) scanning lidars with a 300 kHz pulse repetition frequency. At G-LiHT’s typical flight altitude of 335 m, the pulse footprint diameter is approximately 0.1 m. G-LiHT imagery and lidar were collected on 3 July 2018. Final point cloud density averaged 32 returns m−2 in forested areas.
The hyperspectral and lidar data were processed to yield surface reflectance imagery and a height-normalized point cloud, respectively. At-sensor hyperspectral reflectance was computed based on observed downwelling irradiance and atmospherically corrected to surface reflectance using the FLAASH module in ENVI (L3 Harris Geospatial). Image orthorectification and alignment with the lidar data employs telemetry from the GPS/INS system, coincident lidar generated surface topography, and coefficients from boresight alignment procedures. A DTM was generated following standard G-LiHT data processing protocols [29] and yielded a median absolute deviation compared to GPS validation points—collected during the same field campaign but not at the same site—of 0.32 m [13]. Point normalization and filtering followed the same procedure as in Section 2.3 for SfM. Lidar apparent reflectance (i.e., instrument calibrated and range-corrected laser energy reflectance estimate) intensity (“intensity” and “apparent reflectance” used interchangeably) was also used in this study, since it has been previously shown that discrimination of green stage and non-infested trees is improved using shortwave infrared (e.g., 1500 nm) information [6]. In our study, lidar apparent reflectance intensity data are used similarly to uncalibrated intensity measurements that have previously proven useful for other forest research [13,30,31].

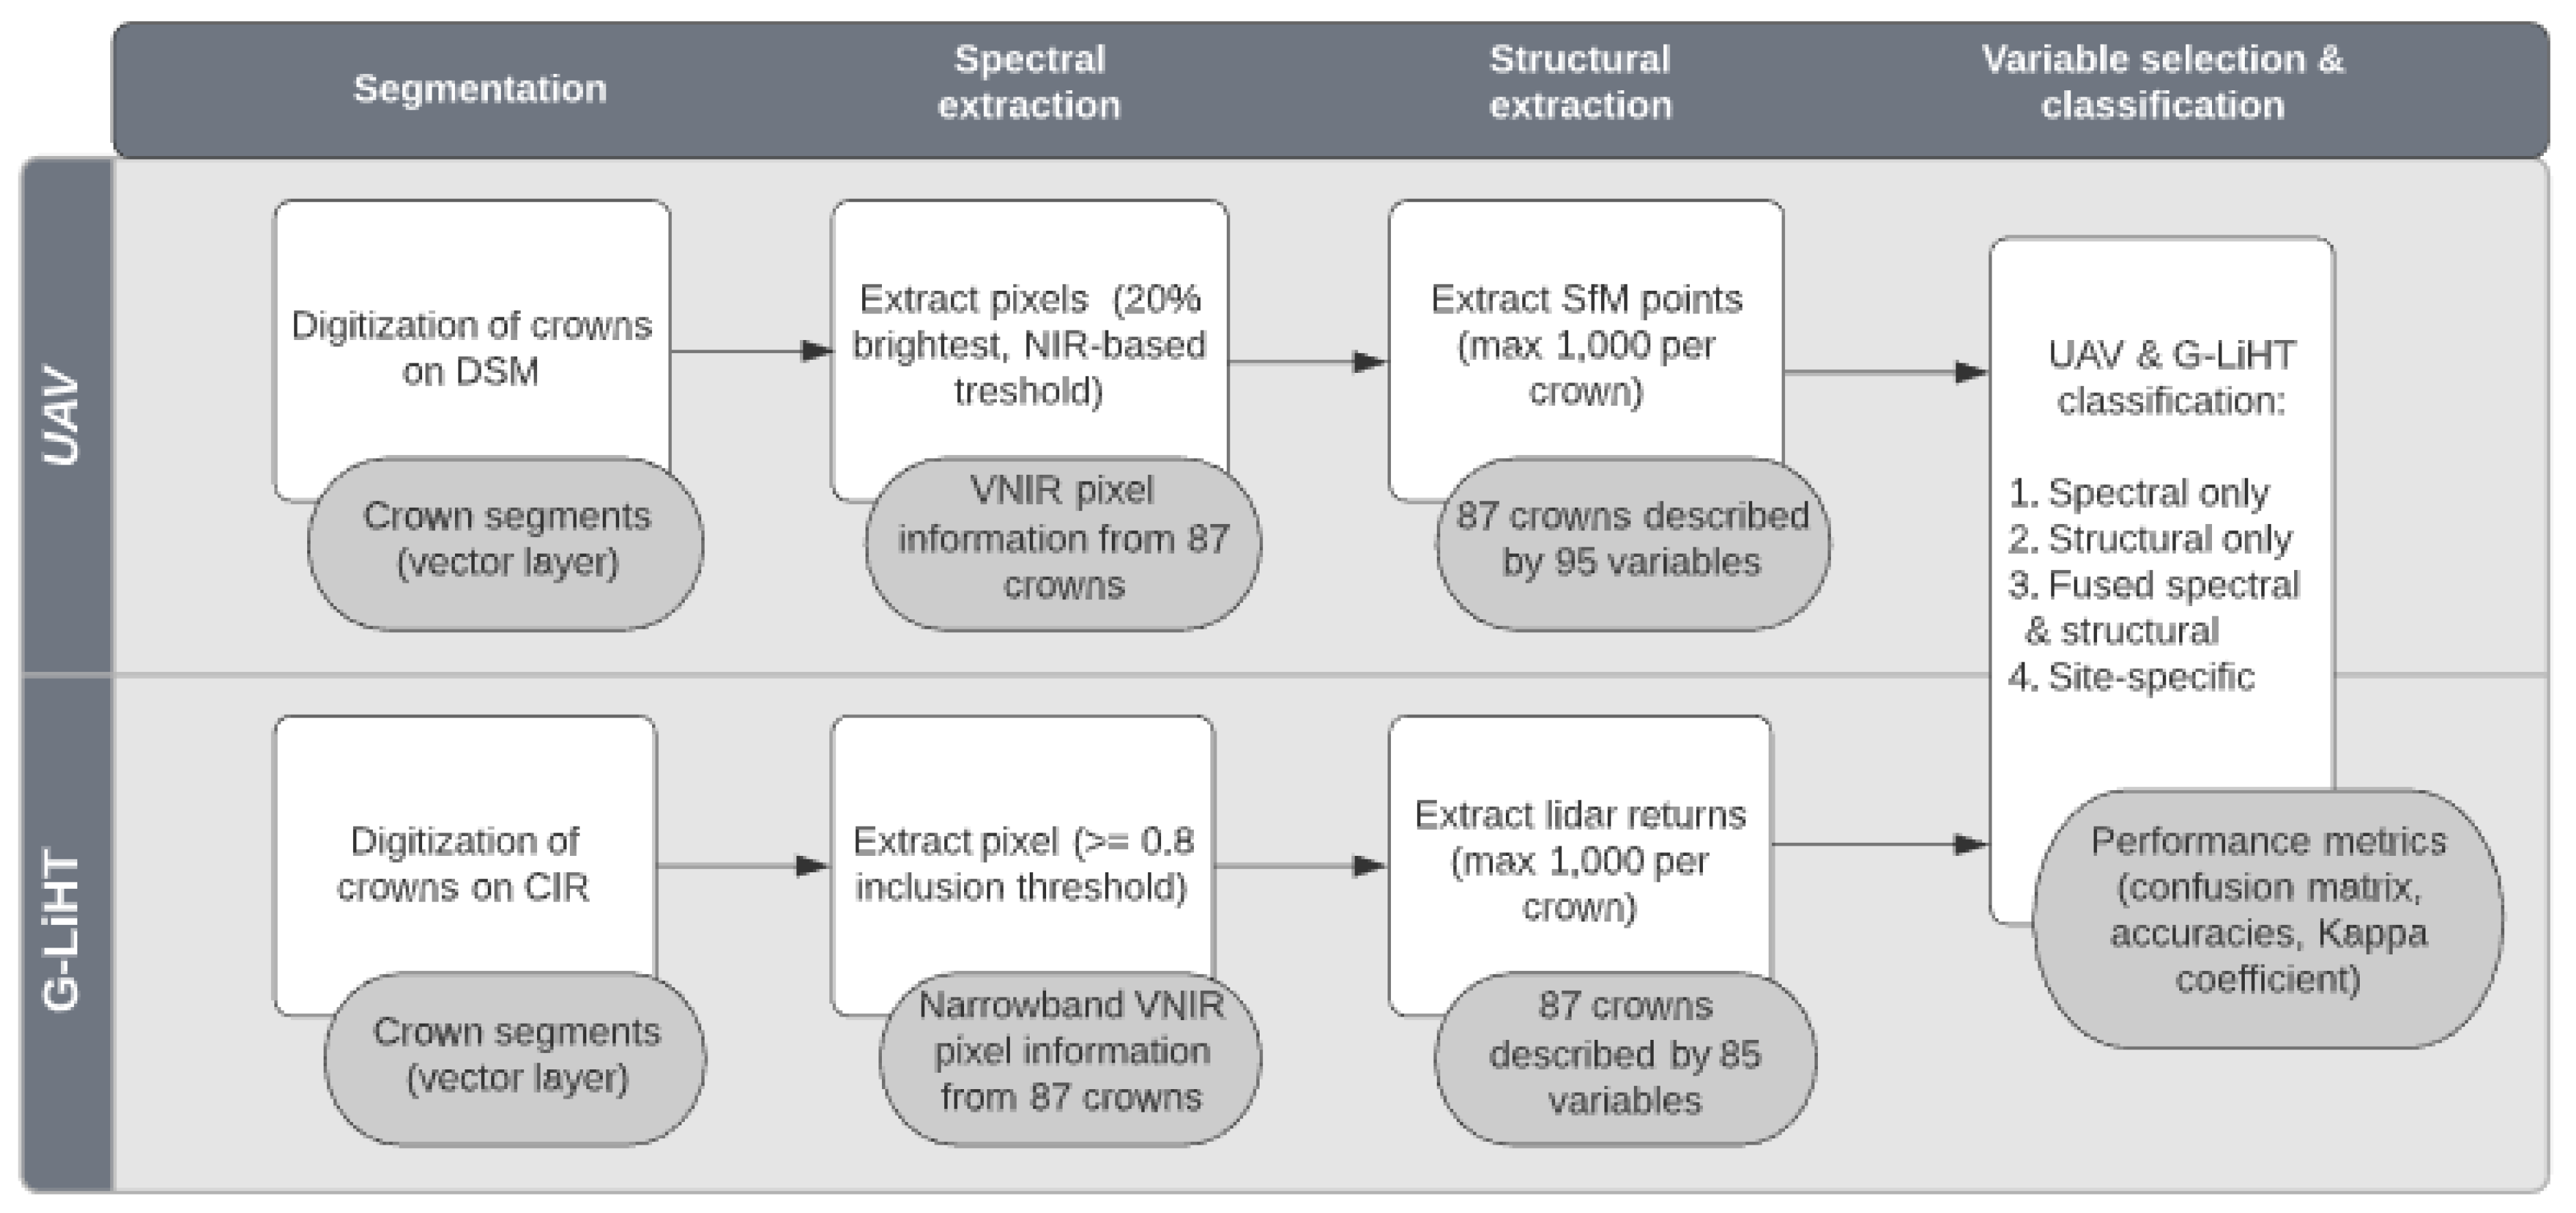
2.5. Crown Delineation and Feature Extraction

Two sets of crowns were manually digitized in ArcGIS (ESRI, Redlands, CA, USA) by overlaying GPS crown locations onto the UAV digital surface model (DSM) and G-LiHT color-infrared (CIR) image (Figure 2). The off-nadir view geometry of G-LiHT imagery necessitated a separate crown set to account for relief and height displacement. During digitization, each crown was labelled with its true health class to be used for classification model calibration and validation.

2.5.1. Extraction of Pixel-Based Spectral Information from UAV and G-LiHT Imagery

The digitized crowns were used to extract separate sets of UAV and G-LiHT spectral and structural features from UAV imagery, G-LiHT imagery, UAV SfM point clouds, and lidar point clouds (Figure 2). All data extraction was completed in R. Multispectral pixel-based feature vectors were extracted from each UAV crown for the five VNIR bands, retaining crown-level health status and unique ID. At a nominal resolution of 6 cm, the number of pixels per crown ranged 76 to 1449. To represent crown-scale spectral variability while reducing the impact of shadows and exposed branches, we selected only the brightest 20% of pixels per crown based on a NIR reflectance threshold [15]. G-LiHT Hyperspectral data were extracted following similar procedures, but given coarser resolution, requiring a >80% of a pixel to be within the crown. At a nominal resolution of 0.5 m, the number of pixels per crown ranged between 2 and 42.

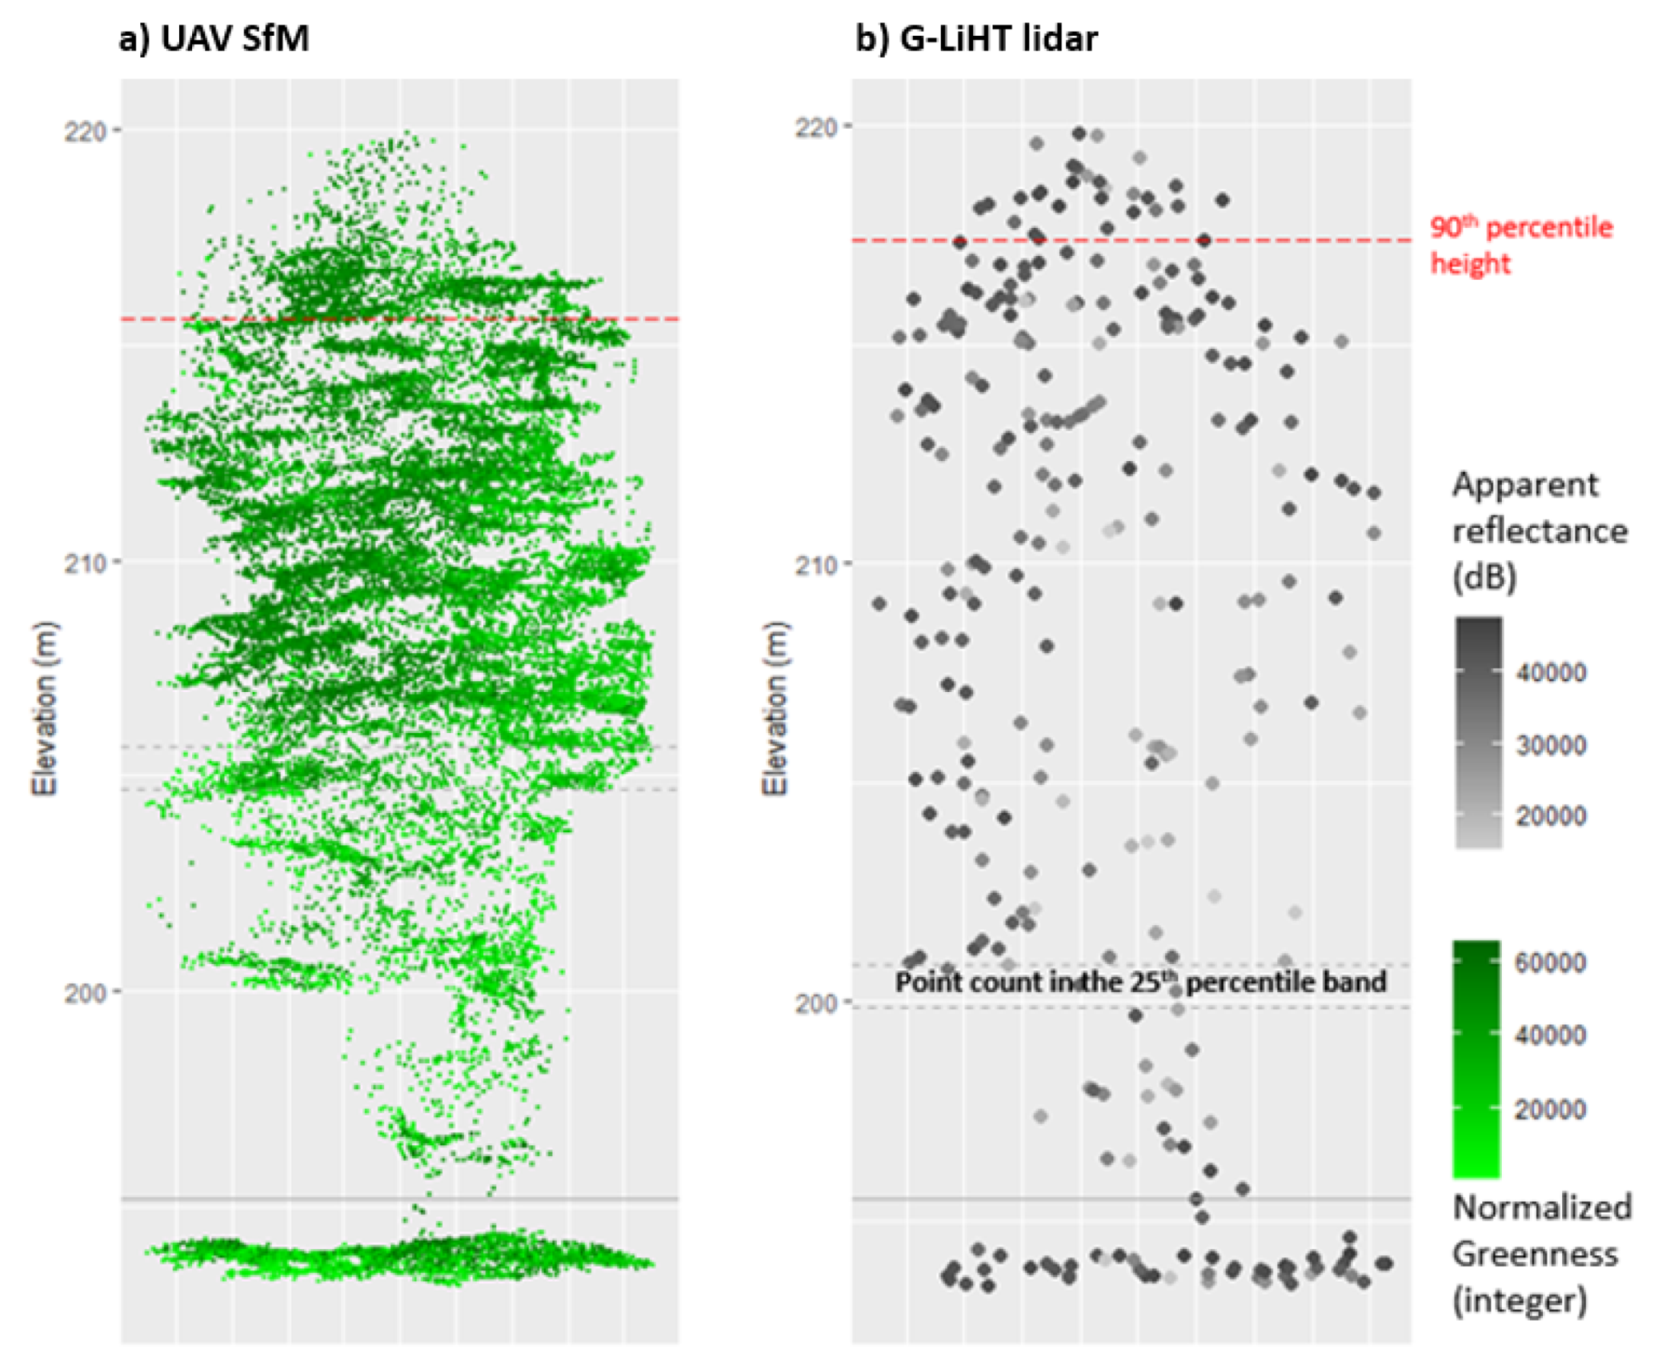
2.5.2. Extraction of Structural Metrics from UAV SfM

Points associated with each crown were extracted from the SfM point cloud, resulting in each point being assigned the appropriate unique ID and health status (Figure 3). We created 86 SfM-based structural features that can be roughly grouped as relating to color brightness, crown heights, and vertical distribution of points in a crown (Table 2; [18]). Points were randomly sampled to a maximum of 1000 points per crown to improve computational performance, after confirming no negative ramifications on classification accuracy.

2.5.3. Extraction of Structural Metrics from Lidar Data

The lidar points for each crown were extracted in the same manner as the UAV SfM (Figure 3). We created 79 lidar-based structural features that can be roughly grouped as relating to apparent lidar reflectance and vertical distribution of points in crown (Table 3; [13]).

2.6. Random Forest

Random forest (RF) classifiers in hold-out cross-validation mode were applied separately to UAV and G-LiHT spectral and structural data (Figure 2) to yield crown-level classification, using the randomForest package in R (version 1.2.5033) (Liaw, 2002). Each classifier produced a confusion matrix, overall classification accuracy, and Kappa coefficient by tabulating the health status having the highest proportion of pixel-level predictions for each crown (i.e., winner-take-all) and comparing with field-verified observations.

2.7. Data Fusion and Classification

2.7.1. Classifying Spectral and Structural Information Separately

A RF classifier using the most important features was applied to UAV and G-LiHT spectral and structural data sets. In each spectral-only and structural-only classifier we applied a hold-out cross validation strategy where each crown was classified 100 times based on random draws of a balanced (n = 15 crowns per health status) training set. This strategy allowed for mitigation of concerns associated with imbalanced classes and also gave a more realistic picture of how high variability in training data can influence classification accuracy. Two-class RF classifiers were also trained to determine simple non-infested versus dead separability, an additional capability of interest to the FHM community.

2.7.2. Classification Using Fused Spectral and Structural Data

Each spectral-only RF classifier also produced an estimate of per-pixel health status probabilities that we averaged at the crown level. In our hierarchical classification scheme, these crown-level probabilities were concatenated to corresponding crown-scale structural data to calibrate and validate a fused spectral-structural classifier. Fused models followed the general leave-one-out cross validation process noted previously.

2.8. Feature Selection

Each spectral-only and structural-only classifier used the most important features identified by its corresponding RF feature selector. RF has become a commonly accepted method of feature reduction through determining feature importance, even with small numbers of predictors [32,33]. Each spectral-only and structural-only feature selector calculated the mean decrease in Gini for each feature, indicating their relative ability to predict the true health status. The top 20 features with the highest mean decrease in Gini were selected over 100 repetitions. Results from each iteration were tabulated and sorted by frequency of feature appearance and the most important were considered those that appeared in 90 or more iterations, but with consideration for the degree of correlation among finalist features. Spectral features were additionally analyzed for their ability to separate classes using the normalized F-ratio following [34].

3. Results

3.1. Classification Results

The UAV fusion model (OA = 78%, kappa = 0.64) and G-LiHT fusion model (OA = 78%, kappa = 0.65) achieved the best overall accuracy for separating non-infested, green, and dead classes (Table 4e,f). The G-LiHT fusion model provided an improvement over individual G-LiHT structure-only (OA = 77%, kappa = 0.64) and spectral-only (OA = 62%, kappa = 0.42) models. The UAV models demonstrated similar performance trends with the fusion model outperforming the individual structural (OA = 75%, kappa = 0.59) and spectral (OA = 55%, kappa = 0.29) models.
Non-infested vs. green health statuses were consistently challenging to discriminate using either UAV or G-LiHT data, as indicated by having the lowest producer’s and user’s accuracies across all classifiers. Crowns within these two health statuses were frequently confused but both were accurately distinguished from dead crowns. The UAV spectral-only model (Table 4a) was the poorest performer for non-infested (producer’s accuracy = 33%, user’s accuracy = 32%) and green (producer’s accuracy = 54%, user’s accuracy = 68%). Spectral information on its own was least useful in both the UAV and G-LiHT models for separating green and non-infested classes. Structural, or at least 3D spectral information (e.g., UAV median normalized green brightness of points at 25th percentile height, G-LiHT 99th percentile height, Table 4c,d), drove higher classification accuracies in both structure-only and fusion models. Dead crowns in the three-class setup were classified well by all models.
All two-class cross-validated models successfully separated non-infested and dead crowns. The G-LiHT fusion was the overall best performing model (OA = 97%, kappa = 0.95) followed by the spectral-only (OA = 95%, kappa = 0.90) and structural-only (OA = 92%, kappa = 0.85) models of the same platform. UAV fusion and spectral-only models had the same overall performance (OA = 0.85, kappa = 0.69) while UAV structural-only (OA = 82%, kappa = 0.64) was the overall poorest model. Producer’s and user’s accuracies demonstrated the same trend as overall accuracy and kappa values with G-LiHT fusion returning the best for non-infested (producer’s accuracy = 95%, user’s accuracy = 100%) and dead (producer’s accuracy = 100%, user’s accuracy = 95%).

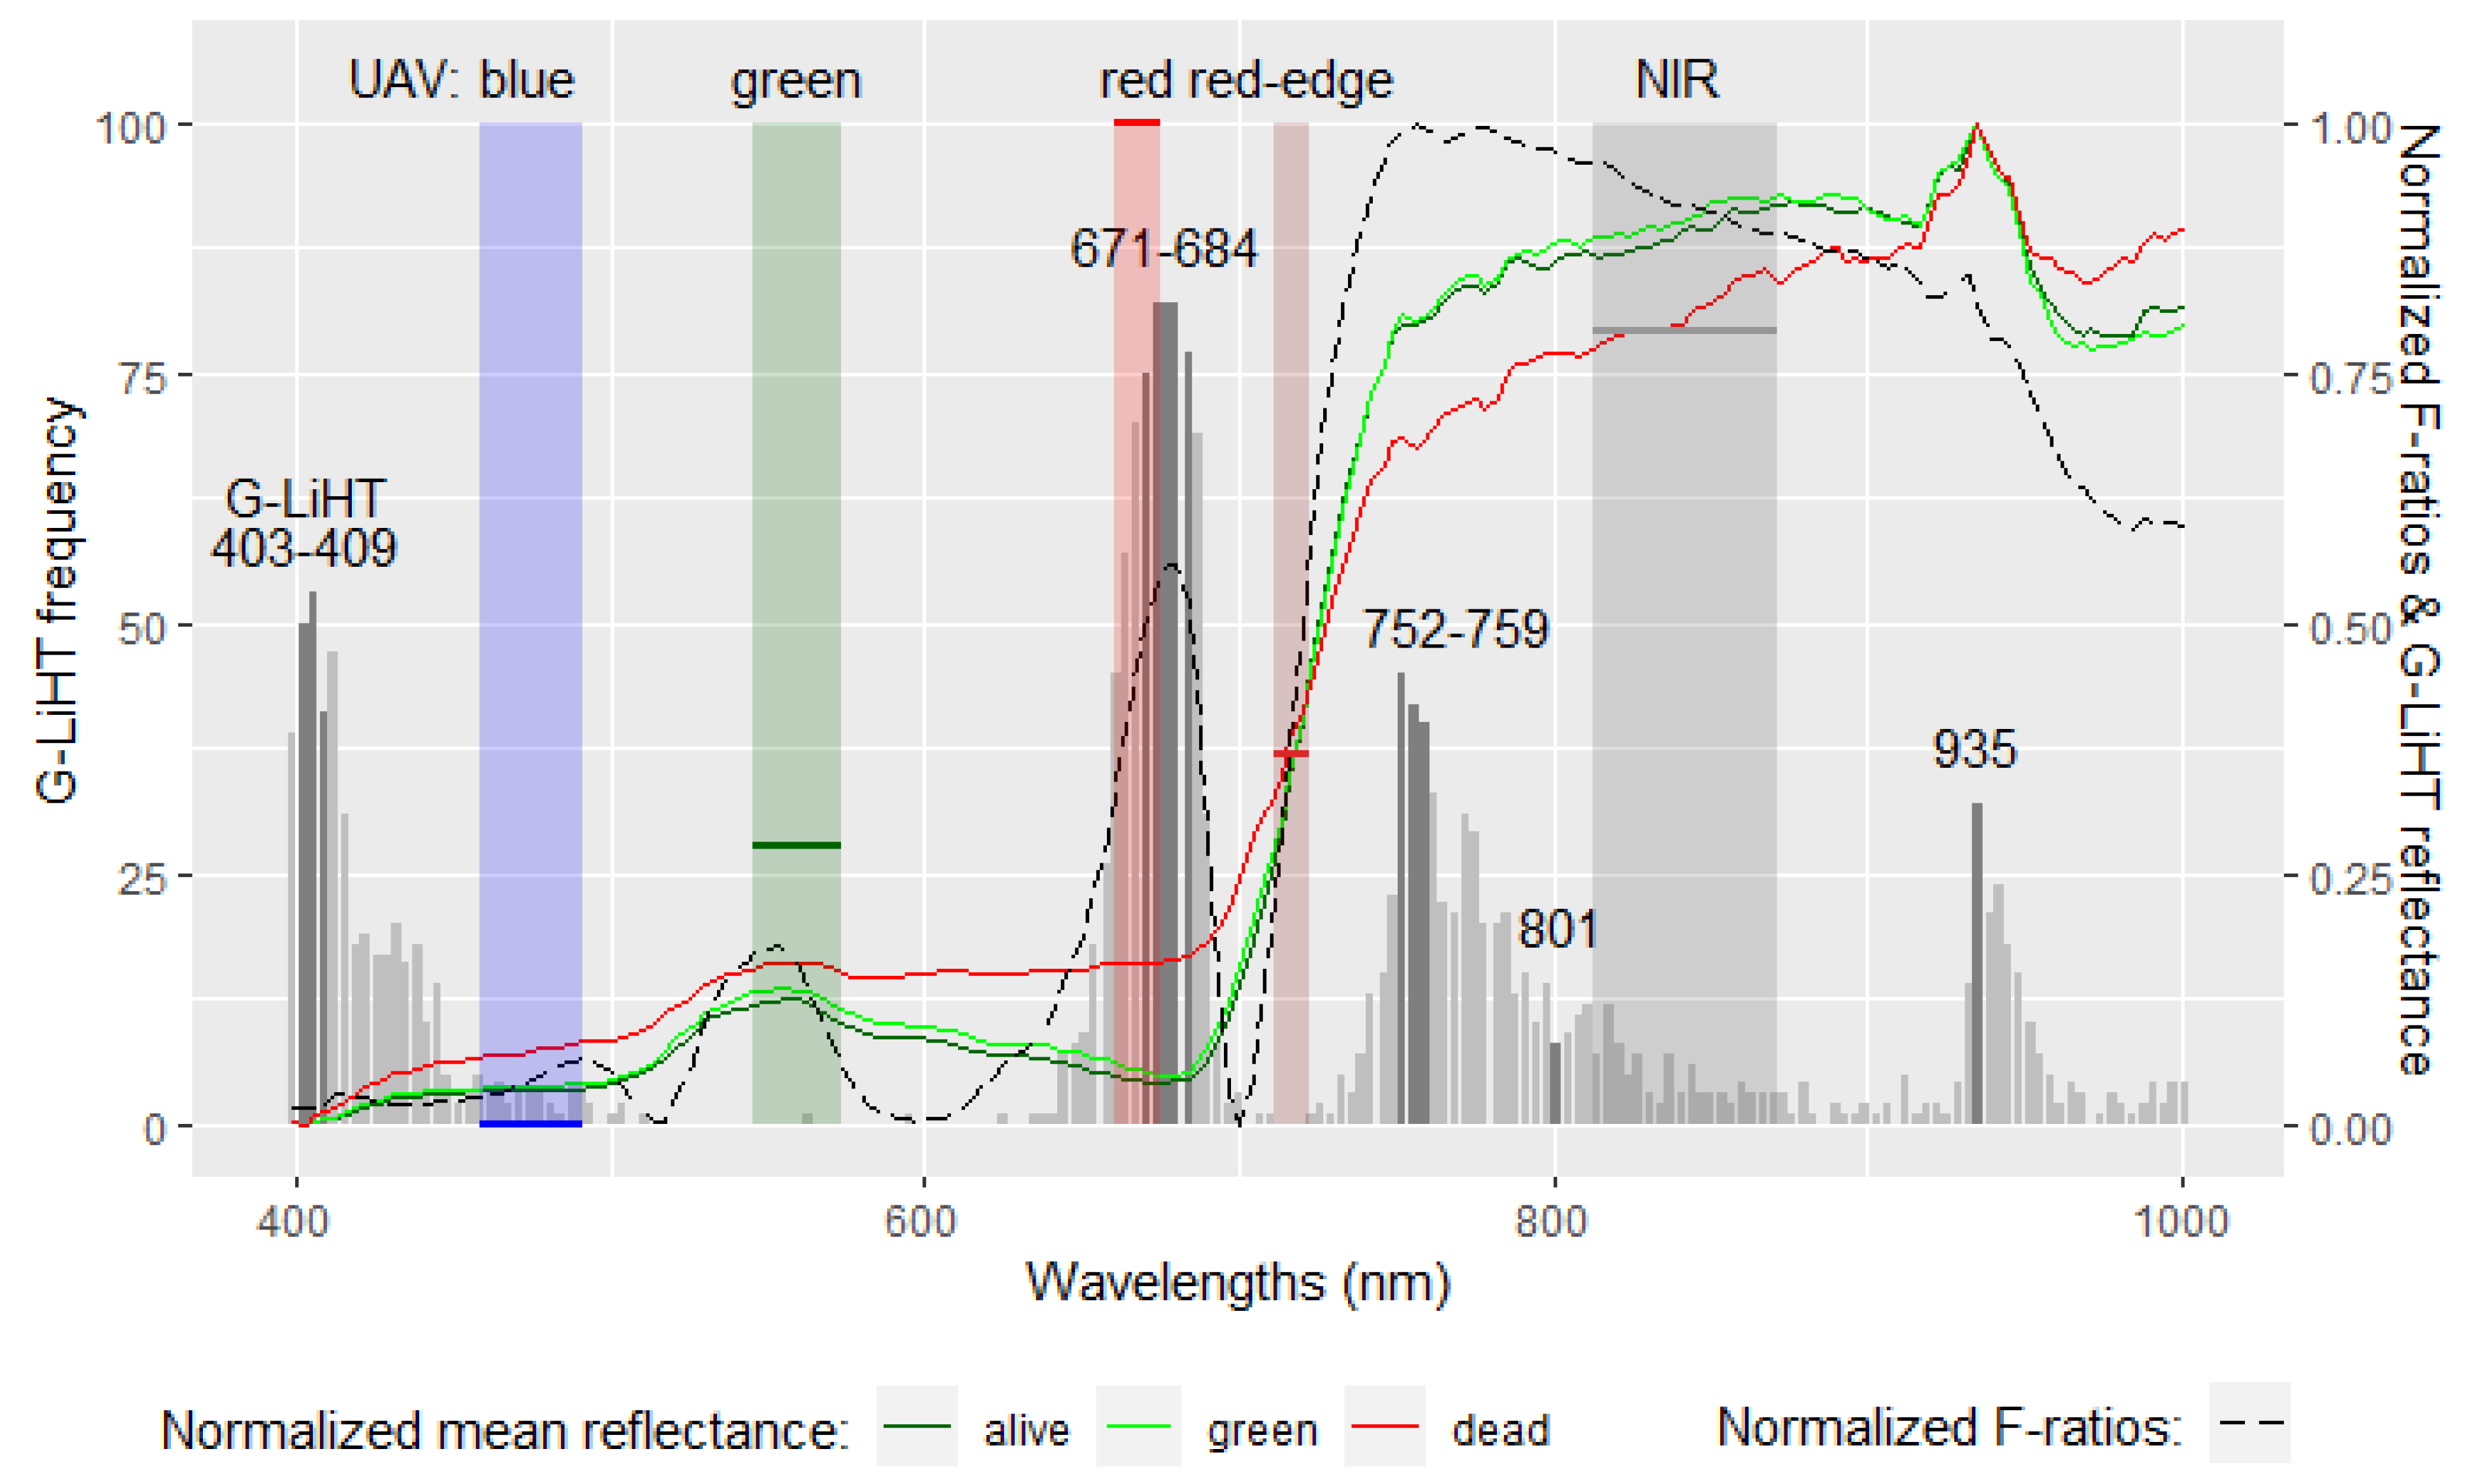
3.2. Most Important Spectral Features

While spectral-only models were limited in their ability to separate non-infested and green classes, they were useful for separating non-infested and green versus dead. All five MicaSense (UAV multispectral) spectral bands had a mean decrease in Gini of 100, thus all were used in classification models, though blue had quite a low F-ratio (Figure 4). Both UAV and G-LiHT spectral models highlighted the importance of the red spectral region but the G-LiHT bands selected in the “red edge” (752–759 nm) appear to be more useful compared to UAV red edge (711–723 nm; Figure 4). Within the G-LiHT data, violet (<~450 nm) and to a lesser extent, NIR bands were also commonly selected for model inclusion. To represent a diversity of spectral regions in the G-LiHT model, several bands were selected from each frequency peak (Figure 4, Table 5). Only the green region was not represented in the final G-LiHT feature selection, putting a fine point on the challenge in visually and algorithmically differentiating non-infested from green health statuses.

3.3. Most Important Structural Features

Many of the selected structural or 3D spectral metrics estimate upper crown characteristics or compare upper and lower crown summary values. The final UAV structural features used in the classification models include several 3D spectral metrics in normalized or ratio form, e.g., ratio of green brightness between points above and points below median height (see full list in Table 5). Final G-LiHT structural features featured a mix of lidar intensity variables at certain heights (e.g., lidar intensity at 99th percentile height in crown) and other structural variables (Table 5).
Both the UAV and G-LiHT structural feature selection processes initially led to the selection of over a dozen metrics but with high pairwise correlation (Figure 5). As expected, correlation was frequently highest between pairs in the same metric subgroup where member metrics are derived from similar color, brightness, intensity, or point count data. Thus, we further reduced dimensionality and metric redundancy by selecting only one or two metrics from each subgroup and avoiding selection of more than one metric from a high correlation pair, which resulted in final features contributing unique information.

4. Discussion

This study demonstrated the capabilities of high-resolution multi- and hyperspectral data fused with structural information for boreal FHM. We showed that non-infested, green (but infested), and dead trees can be best discriminated using fusion of both structural and spectral information using data from either a UAV or airborne platform (OA = 78% in both cases). Consistent with previous efforts, dead crowns were easily identified, while non-infested and green crowns were much harder to separate [7,15,17,35]. Indeed, for discriminating only non-infested from dead, the G-LiHT fusion model achieved very high accuracy (OA = 97%), performing better than the best UAV model (OA = 85%). Three-dimensional spectral information from either the vertical distribution of color in the UAV’s RGB point cloud or G-LiHT lidar apparent reflectance were critical components of the three-class classifier. Spectral information was more beneficial for differentiating non-infested and dead crowns (Figure 4). Our results suggest that higher spatial resolution from UAV collection does not improve classification. Rather, 0.5 m spectral information from G-LiHT better aggregates the health status signal resulting from changes in leaf properties and biomass. Additionally, 3D SWIR information in the form of lidar apparent reflectance data were useful, suggesting, as others have previously, the utility of shortwave infrared wavelengths for detecting vegetation stress.

4.1. Classification of Health Status Groups

Previous research on detecting early infestation or green health status has largely relied on spectral data, where the specific platform employed dictated the spectral and spatial characteristics of the imagery. The high degree of variability in classification accuracies from these studies highlights the difficulty of green status detection using solely spectral data. Like [17], the imbalanced distribution of health statuses in our data reduced the effective sample size available for analysis, and unlike [14,36] who simulated attack vectors through girdling and herbicide injection, our data were subject to the inherent variability of a natural setting and changes in illumination conditions over our several day field campaign. Our spectral-only models (UAV OA = 55%, G-LiHT OA = 62%) were less accurate when compared to existing multispectral [5,36] and hyperspectral research (~11% lower) [14,15], with comparable spectral and spatial resolution but lacking SWIR bands. The G-LIHT structure-only model result (OA = 77%), using calibrated and range-corrected lidar apparent reflectance (1550 nm) was comparable to previous hyperspectral research in the same SWIR region [6,14,37] and somewhat more accurate than previous terrestrial lidar work using lidar intensity [26].
Dead crowns were classified well by all models due to substantially different spectral and structural characteristics compared to non-infested crowns based on cessation of needle photosynthesis and, in some cases, needle drop. The UAV spectral-only model was worst at separating dead from non-infested or green crowns. Commission error was high (44%) possibly indicating that the high spatial resolution of the UAV led to misrepresentation of non-photosynthetic vegetation (e.g., branches) in live crowns as dead. The 6 cm resolution of UAV pixels reduces integration, leading to multimodal reflectance distributions with respect to both sunlit and shade as well as green vs. non-photosynthetic vegetation. Accordingly, using the 20% brightest UAV pixels achieved better health status mean separation, narrowed the within-crown reflectance ranges, and reduced outliers for most bands [5,15]. By contrast, the 0.5 m spatial resolution of G-LiHT captured more varied reflectance from entire crowns or portions of crowns, thus integrating more information about canopy structure and composition. While G-LiHT fusion was the most effective in separating dead from non-infested and green crowns, the G-LiHT spectral-only model performed similarly for this task, showing that averaging green and non-photosynthetic vegetation in 0.5 m pixels was helpful in establishing the overall status of the crown. The higher success with relatively larger pixel size is consistent with past research that suggested aggregation of UAV data to 1 m improved classification results [36].

4.2. Contribution to Classification: Spectral Regions

Consistent with previous research, we demonstrate the utility of red and red-edge wavelengths for differentiating health status groups and, importantly, note that the specific wavelength ranges matter, highlighting one advantage of a hyperspectral system [5,6,7,15,17,36]. We found high non-infested and green versus dead class separability in the red bands between 660–690 nm based on both UAV and G-LiHT F-ratios and RF feature selection (Figure 4). The chlorophyll absorption feature centered on 685 nm experiences significant change as green vegetation senesces, particularly during post-infestation as white spruce transform from green to red [1,9,14]. G-LiHT, and to some extent UAV data, also yielded high separability in red-edge bands, but it is not entirely clear which red edge features are most important for FHM. A common definition of the “red edge” suggests inclusion of wavelengths from 690 to 750 nm, based on rapid change in this region from the dominance by chlorophyll absorption of red light to leaf mesophyll and canopy (e.g., LAI) structural amplification of NIR reflectance [38]. The UAV red edge band is centered on 717 nm and ranges between 711 and 723 nm, clearly sitting in the range of rapid reflectance increase in our data (Figure 4). Class separability using the red edge reflectance value based on F-ratio was middling but higher than blue or green, and the band was important in classification models. Note, that the value of the red edge region is commonly found in terms of reflectance slope (rather than absolute values), which can be characterized to some extent with vegetation indices such as Red Edge NDVI (RENDVI). We tested this and similar indices but ultimately found greater classification success with the raw bands. Interestingly, this region appeared to offer very limited spectral separability when assessed using the G-LiHT F-ratio and low G-LiHT band selection (Figure 4). By contrast, the G-LiHT bands between 752 and 759 nm were quite important to separability with the highest overall F-ratio and frequent band selection (Figure 4). While these bands fall outside of the previously mentioned 690 to 750 nm range, they are included in or near Sentinel-2 “red edge” bands 6 and 7 (~740 nm ± 15 nm and ~783 nm ± 20 nm respectively [39]. Thus, with 20 m spatial resolution at these wavelengths and 10 m spatial resolution at red wavelengths, Sentinel-2 data, particularly when paired with lidar, may offer a viable path forward for more extensive forest health monitoring.
Frequent G-LiHT violet band selection and high UAV NIR and green F-ratios suggest usefulness of these spectral ranges. A high UAV NIR F-ratio also reinforced feature selection importance for bands surrounding 840 nm, consistent with [6,7,26,36]. The high F-ratio for G-LiHT data in the NIR spectral region indicated general utility of these bands but, ultimately, band selection was infrequent (Figure 4). This is possibly due to high correlations between NIR bands and those selected at 752–759 nm. The selection of violet by the G-LiHT feature selector exhibits the opposite relationship. The G-LiHT F-ratio provided no indication of separability in this wavelength range but bands 403–409 nm were selected over 50% of the time. This is consistent with [6] who identified differences of health status group means at 368 nm to be statistically significant but no other hyperspectral literature reviewed in this study included bands below 400 nm. Bands below 400 nm are commonly excluded from analyses due to pervasive issues of poor sensor signal-to-noise (SNR) and strong interference by Rayleigh scattering [34]. G-LiHT SNR is highest at 550 nm and degrades substantially below 420 nm and above 920 nm. A marginal selection of green (560 nm) by the UAV model and absence of selection by the G-LiHT model, regardless of the latter F-ratio indicator, indicates the absence of green region discriminatory power. This is in line with previous research mentioned herein and the expectation of difficult non-infested-green separability, given both statuses visually appear green.

4.3. Contribution to Classification: Structural Metrics

The majority of selected structural features from both UAV and G-LiHT related to 3D spectral or structural variability within the upper canopy or between the upper and lower canopy. Fifteen of the 16 selected UAV metrics pertained to the 3D distribution of RGB color while 12 of 19 G-LiHT metrics captured the distribution of lidar intensity, supporting the overarching utility of spectral information but stressing the importance of examining its vertical gradient within the crown. Our frequent selection of structural and 3D spectral metrics in the upper crown envelope is consistent with literature, which suggests that post-infestation change first occurs in the upper, inner canopy [1,9].
The selection of lidar intensity metrics as important G-LiHT features suggest that SWIR-band lidar may be useful for assessing vertical variation in canopy water content and indicative of tree health status. The utility of SWIR information has been previously confirmed by [6,14,37], who achieved 83% (2080–2350 nm), 73% (1250 nm) and 86% (2202 nm) OA. While evidence has been provided regarding the utility of SWIR information in passive optical data [6] and we have shown the benefit of lidar apparent reflectance, other studies show limited use for SWIR optical data [14] and SWIR-band lidar [26]. The apparent inconsistency in SWIR utility may be attributable to differences in instruments and operations (e.g., image resolution, lidar footprint size), environmental conditions at the time of acquisition (e.g., soil moisture, time of day, air temperature, and vapor pressure deficit), or derivation from 2D passive optical data where the ability to compare upper and lower canopy foliage is not possible. However, it must be noted that, beyond canopy moisture content, lidar intensity is influenced by the target scattering cross section, complicating interpretation of this reflectance signal [30]. Future research with multispectral lidar is warranted given potential sensitivity to vertical gradients in photosynthetic function, leaf structure, and canopy water content [26].

4.4. Site-Specific Differences

Collection of UAV data occurred at different times of the day over a series of days with varying sky conditions while G-LiHT was completed on the same, clear day with a minimal time elapsed. Examination of downwelling irradiance data from the MicaSense RedEdge sensor reveals inconsistent irradiance received by the UAV over the course of its flight (Figure 6). In the Troublesome and Ermine plots, the regular pattern of alternating higher and lower irradiance point groups indicates directionality of UAV movement during its flight, while the outliers between each high–low or low–high pairing are turn-arounds at the end of each flight line. At these two sites, within flight line illumination variability is quite low (but the effects of high solar zenith angle are notable at Troublesome; Figure 6). At K’esugi, however, we see alternating peaks and valleys indicating the presence of patchy cloud cover, as well as an overall irradiance increase over the duration of the flight. The K’esugi flight began under higher cloud cover that dissipated as time elapsed, possibly explaining the overall trend. Thus, while our imagery was corrected to at-sensor reflectance—nominally removing the artifacts from variable illumination conditions—one can never fully remove the effects of clouds and cloud shadows from these data. As the use of UAV data proliferates in ecological studies requiring stable spectral information [40], it is important that practitioners keep in mind that just because flying under clouds is possible, it does not mean that it is recommended [41].

5. Conclusions

Detection of early infestation or green health status has been suggested as key for mitigation of bark beetle outbreaks and management of forests on a regional scale [6,42]. To be effective, remote sensing methods must be timely, accurate, and of adequate spatial extents [43]. This study demonstrates that health status mapping is possible at modest accuracy when including green stage and the expected high accuracy when only mapping non-infested versus dead. Physiological changes experienced by crowns during early infestation may be best detected using structural metrics capable of comparing spectral reflectance or intensity in upper and lower canopy regions. Further research into methods capable of detecting the interior canopy, where physiological change typically occurs first, may bolster classification success. Importantly, we show that G-LiHT data is as useful, or more useful, than UAV data for achieving classification goals due to a feature-appropriate spatial resolution, spectral band availability, and SWIR-band lidar. This opens the door for regional-scale FHM efforts across large swaths of the boreal region in a manner not possible with either ground-based field assessment or UAV.

Author Contributions

M.G.A., A.C.F. and B.D.C. conceived and designed the project and were directly involved in field and/or flight data collection. J.C. and M.G.A. were responsible for data analysis, article drafting, and editing. All authors have read and agreed to the published version of the manuscript.

Funding

Funding for this research was provided by NASA’s Carbon Monitoring System (NNX17AJ66G).

Data Availability Statement

Data and associated codes are available from the corresponding author upon reasonable request.

Acknowledgments

The authors would like to thank Anthony Santana, Anika Halota, and the Alaska Department of Natural Resources for assistance in data collection.

Conflicts of Interest

The authors declare no conflict of interest.

References

  1. Holsten, E.H.; Thier, R.W.; Munson, K.E.; Gibson, S.A. The Spruce Beetle. U.S. Dep. Agric. For. Serv. 1999, 127, 1–10. [Google Scholar]
  2. Bentz, B.J.; Régnière, J.; Fettig, C.J.; Hansen, E.M.; Hayes, J.L.; Hicke, J.A.; Kelsey, R.G.; Negrón, J.F.; Seybold, S.J. Climate Change and Bark Beetles of the Western United States and Canada: Direct and Indirect Effects. Bioscience 2010, 60, 602–613. [Google Scholar] [CrossRef]
  3. USDA Forest Service. Forest Health Conditions in Alaska-2020; USDA Forest Service: Washington, DC, USA, 2021.
  4. Jenkins, M.J.; Hebertson, E.G.; Munson, A.S. Spruce Beetle Biology, Ecology and Management in the Rocky Mountains: An Addendum to Spruce Beetle in the Rockies. Forests 2014, 5, 21–71. [Google Scholar] [CrossRef] [Green Version]
  5. Klouček, T.; Komárek, J.; Surový, P.; Hrach, K.; Janata, P.; Vašíček, B. The Use of UAV Mounted Sensors for Precise Detection of Bark Beetle Infestation. Remote Sens. 2019, 11, 1561. [Google Scholar] [CrossRef] [Green Version]
  6. Foster, A.C.; Walter, J.A.; Shugart, H.H.; Sibold, J.; Negron, J. Spectral evidence of early-stage spruce beetle infestation in Engelmann spruce. For. Ecol. Manag. 2017, 384, 347–357. [Google Scholar] [CrossRef] [Green Version]
  7. Abdullah, H.; Darvishzadeh, R.; Skidmore, A.K.; Groen, T.A.; Heurich, M. European spruce bark beetle (Ips typographus, L.) green attack affects foliar reflectance and biochemical properties. Int. J. Appl. Earth Obs. Geoinf. 2018, 64, 199–209. [Google Scholar] [CrossRef] [Green Version]
  8. Abdullah, H.; Skidmore, A.K.; Darvishzadeh, R.; Heurich, M. Sentinel-2 accurately maps green-attack stage of European spruce bark beetle (Ips typographus, L.) compared with Landsat-8. Remote Sens. Ecol. Conserv. 2019, 5, 87–106. [Google Scholar] [CrossRef] [Green Version]
  9. Schmid, J.M.; Frye, R.H. Spruce Beetle in the Rockies. USFS Gen. Tech. Rep. 1977, 49, 38. [Google Scholar]
  10. Abdullah, H.; Skidmore, A.K.; Darvishzadeh, R.; Heurich, M. Timing of red-edge and shortwave infrared reflectance critical for early stress detection induced by bark beetle (Ips typographus, L.) attack. Int. J. Appl. Earth Obs. Geoinf. 2019, 82, 101900. [Google Scholar] [CrossRef]
  11. Joyce, K.; Anderson, K.; Bartolo, R. Of Course We Fly Unmanned—We’re Women! Drones 2021, 5, 21. [Google Scholar] [CrossRef]
  12. Barbedo, J. A Review on the Use of Unmanned Aerial Vehicles and Imaging Sensors for Monitoring and Assessing Plant Stresses. Drones 2019, 3, 40. [Google Scholar] [CrossRef] [Green Version]
  13. Alonzo, M.; Dial, R.J.; Schulz, B.K.; Andersen, H.-E.; Lewis-Clark, E.; Cook, B.D.; Morton, D.C. Mapping tall shrub biomass in Alaska at landscape scale using structure-from-motion photogrammetry and lidar. Remote Sens. Environ. 2020, 245, 111841. [Google Scholar] [CrossRef]
  14. Niemann, K.O.; Quinn, G.; Stephen, R.; Visintini, F.; Parton, D. Hyperspectral Remote Sensing of Mountain Pine Beetle with an Emphasis on Previsual Assessment. Can. J. Remote Sens. 2015, 41, 191–202. [Google Scholar] [CrossRef]
  15. Näsi, R.; Honkavaara, E.; Blomqvist, M.; Lyytikäinen-Saarenmaa, P.; Hakala, T.; Viljanen, N.; Kantola, T.; Holopainen, M. Remote sensing of bark beetle damage in urban forests at individual tree level using a novel hyperspectral camera from UAV and aircraft. Urban For. Urban Green. 2018, 30, 72–83. [Google Scholar] [CrossRef]
  16. Blomqvist, M.; Kosunen, M.; Starr, M.; Kantola, T.; Holopainen, M.; Lyytikäinen-Saarenmaa, P. Modelling the predisposition of Norway spruce to Ips typographus L. infestation by means of environmental factors in southern Finland. Eur. J. For. Res. 2018, 137, 675–691. [Google Scholar] [CrossRef]
  17. Näsi, R.; Honkavaara, E.; Lyytikäinen-Saarenmaa, P.; Blomqvist, M.; Litkey, P.; Hakala, T.; Viljanen, N.; Kantola, T.; Tanhuanpää, T.; Holopainen, M. Using UAV-Based Photogrammetry and Hyperspectral Imaging for Mapping Bark Beetle Damage at Tree-Level. Remote Sens. 2015, 7, 15467–15493. [Google Scholar] [CrossRef] [Green Version]
  18. Alonzo, M.; Andersen, H.-E.; Morton, D.C.; Cook, B.D. Quantifying Boreal Forest Structure and Composition Using UAV Structure from Motion. Forests 2018, 9, 119. [Google Scholar] [CrossRef] [Green Version]
  19. Brovkina, O.; Cienciala, E.; Surový, P.; Janata, P. Unmanned aerial vehicles (UAV) for assessment of qualitative classification of Norway spruce in temperate forest stands. Geo-Spat. Inf. Sci. 2018, 21, 12–20. [Google Scholar] [CrossRef] [Green Version]
  20. Iglhaut, J.; Cabo, C.; Puliti, S.; Piermattei, L.; O’Connor, J.; Rosette, J. Structure from Motion Photogrammetry in Forestry: A Review. Curr. For. Rep. 2019, 5, 155–168. [Google Scholar] [CrossRef] [Green Version]
  21. Minařík, R.; Langhammer, J. Use of a multispectral UAV photogrammetry for detection and tracking of forest disturbance dynamics. Int. Arch. Photogramm. Remote Sens. Spat. Inf. Sci. ISPRS Arch. 2016, 41, 711–718. [Google Scholar] [CrossRef] [Green Version]
  22. Babcock, C.; Finley, A.O.; Cook, B.D.; Weiskittel, A.; Woodall, C.W. Modeling forest biomass and growth: Coupling long-term inventory and LiDAR data. Remote Sens. Env. 2016, 182, 1–12. [Google Scholar] [CrossRef] [Green Version]
  23. Popescu, S.C.; Wynne, R.H.; Scrivani, J.A. Fusion of small-footprint lidar and multispectral data to estimate plot-level volume and biomass in deciduous and pine forests in Virginia, USA. For. Sci. 2004, 50, 551–565. [Google Scholar]
  24. Reutebuch, S.E.; Andersen, H.-E.; McGaughey, R.J. Light detection and ranging (LIDAR): An emerging tool for multiple resource inventory. J. For. 2005, 103, 286–292. [Google Scholar]
  25. Wulder, M.A.; White, J.C.; Nelson, R.F.; Næsset, E.; Ørka, H.O.; Coops, N.C.; Hilker, T.; Bater, C.W.; Gobakken, T. Remote Sensing of Environment Lidar Sampling for Large-Area Forest Characterization: A Review. Remote Sens. Environ. 2012, 121, 196–209. [Google Scholar] [CrossRef] [Green Version]
  26. Junttila, S.; Holopainen, M.; Vastaranta, M.; Lyytikäinen-Saarenmaa, P.; Kaartinen, H.; Hyyppä, J.; Hyyppä, H. The potential of dual-wavelength terrestrial lidar in early detection of Ips typographus (L.) infestation—Leaf water content as a proxy. Remote Sens. Environ. 2019, 231, 111264. [Google Scholar] [CrossRef]
  27. Dietrich, J.T. Riverscape mapping with helicopter-based Structure-from-Motion photogrammetry. Geomorphology 2016, 252, 144–157. [Google Scholar] [CrossRef]
  28. White, J.C.; Saarinen, N.; Kankare, V.; Wulder, M.; Hermosilla, T.; Coops, N.C.; Pickell, P.D.; Holopainen, M.; Hyyppä, J.; Vastaranta, M. Confirmation of post-harvest spectral recovery from Landsat time series using measures of forest cover and height derived from airborne laser scanning data. Remote Sens. Environ. 2018, 216, 262–275. [Google Scholar] [CrossRef]
  29. Cook, B.D.; Corp, L.A.; Nelson, R.F.; Middleton, E.M.; Morton, D.C.; McCorkel, J.T.; Masek, J.G.; Ranson, K.J.; Ly, V.; Montesano, P.M. NASA Goddard’s LiDAR, hyperspectral and thermal (G-LiHT) airborne imager. Remote Sens. 2013, 5, 4045–4066. [Google Scholar] [CrossRef] [Green Version]
  30. Hopkinson, C.; Chasmer, L. Testing LiDAR models of fractional cover across multiple forest ecozones. Remote Sens. Environ. 2009, 113, 275–288. [Google Scholar] [CrossRef]
  31. Kim, S.; McGaughey, R.J.; Andersen, H.-E.; Schreuder, G. Tree species differentiation using intensity data derived from leaf-on and leaf-off airborne laser scanner data. Remote Sens. Environ. 2009, 113, 1575–1586. [Google Scholar] [CrossRef]
  32. Archer, K.; Kimes, R.V. Empirical characterization of random forest variable importance measures. Comput. Stat. Data Anal. 2008, 52, 2249–2260. [Google Scholar] [CrossRef]
  33. Liaw, A.; Wiener, M. Classification and Regression by randomForest. R News 2002, 2, 18–22. [Google Scholar]
  34. Alonzo, M.; Bookhagen, B.; Roberts, D.A. Urban tree species mapping using hyperspectral and lidar data fusion. Remote Sens. Environ. 2014, 148, 70–83. [Google Scholar] [CrossRef]
  35. Fassnacht, F.E.; Latifi, H.; Koch, B. An angular vegetation index for imaging spectroscopy data—Preliminary results on forest damage detection in the Bavarian National Park, Germany. Int. J. Appl. Earth Obs. Geoinf. 2012, 19, 308–321. [Google Scholar] [CrossRef]
  36. Dash, J.P.; Watt, M.; Pearse, G.D.; Heaphy, M.; Dungey, H. Assessing very high resolution UAV imagery for monitoring forest health during a simulated disease outbreak. ISPRS J. Photogramm. Remote Sens. 2017, 131, 1–14. [Google Scholar] [CrossRef]
  37. Huo, L.; Persson, H.J.; Lindberg, E. Early detection of forest stress from European spruce bark beetle attack, and a new vegetation index: Normalized distance red & SWIR (NDRS). Remote Sens. Environ. 2021, 255, 112240. [Google Scholar] [CrossRef]
  38. Smith, K.; Steven, M.; Colls, J. Use of hyperspectral derivative ratios in the red-edge region to identify plant stress responses to gas leaks. Remote Sens. Environ. 2004, 92, 207–217. [Google Scholar] [CrossRef]
  39. European Space Agency. Sentinel Online. Available online: https://sentinels.copernicus.eu/web/sentinel/user-guides/sentinel-2-msi/resolutions/spatial (accessed on 10 August 2021).
  40. Anderson, K.; Gaston, K.J. Lightweight unmanned aerial vehicles will revolutionize spatial ecology. Front. Ecol. Environ. 2013, 11, 138–146. [Google Scholar] [CrossRef] [Green Version]
  41. Dandois, J.P.; Olano, M.; Ellis, E.C. Optimal Altitude, Overlap, and Weather Conditions for Computer Vision UAV Estimates of Forest Structure. Remote Sens. 2015, 7, 13895–13920. [Google Scholar] [CrossRef] [Green Version]
  42. Hall, R.; Castilla, G.; White, J.; Cooke, B.; Skakun, R. Remote sensing of forest pest damage: A review and lessons learned from a Canadian perspective. Can. Èntomol. 2016, 148, S296–S356. [Google Scholar] [CrossRef]
  43. Wulder, M.A.; Dymond, C.C.; White, J.; Leckie, D.G.; Carroll, A.L. Surveying mountain pine beetle damage of forests: A review of remote sensing opportunities. For. Ecol. Manag. 2006, 221, 27–41. [Google Scholar] [CrossRef]
Figure 1. (a) Study area in Southcentral Alaska. (b) Zoom showing Ermine, Troublesome, and K’esugi study sites. (c) Data example: An RGB-colored point cloud from SfM (2 cm resolution) at Ermine.
Forests 12 01145 g001
Figure 2. Workflow for data processing, crown delineation, extraction of image and point cloud data, and feature selection and classification. White boxes are processes and gray boxes are data products.
Forests 12 01145 g002
Figure 3. Cross-sectional view of point clouds from the same crown with example structural metrics where (a) is UAV SfM and (b) is G-LiHT lidar. Points below the solid grey line are understory vegetation removed prior to analysis.
Forests 12 01145 g003
Figure 4. The five color-coded shaded rectangles show MicaSense sensor bands (blue = 459–491, green = 546.5–573.5, red = 661–675, red-edge = 711–723, NIR = 813.5–870.5) with a color-coded horizontal bar in each representing the normalized F-ratio. Gray vertical bars on x-axis show the frequency (out of 100 model runs) that each G-LiHT spectral band was selected by RF model. Dark grey bars with text labels highlight the final selected G-LiHT bands. Dashed black line shows normalized G-LiHT F-ratios. Dark green, green, and red lines are normalized mean G-LiHT spectrum per non-infested, green, and dead health statuses, respectively.
Forests 12 01145 g004
Figure 5. Correlations between most important variables for UAV (above) and G-LiHT (below) structural data. Blue color indicates positive correlation, red color indicates negative. Circle size and color intensity indicate degree and direction of correlation.
Forests 12 01145 g005
Figure 6. Relative irradiance plots at three UAV sites flown on different days. Solar zenith angles were 57.5° (Troublesome), 42.2° (Ermine), and 4.74° (K’esugi).
Forests 12 01145 g006
Table 1. Crown and study site statistics.
Site (Area)CrownsNon-InfestedGreenDeadData AcquisitionSolar Zenith AngleWeather
Troublesome (80,900 m2)311191120 July 2018, 18:0057.5°Clear skies
Ermine (103,900 m2)36432---22 July 2018, 12:0042.2°Clear skies
K’esugi (104,200 m2)2067717 July 2018, 14:0047.4°Variable clouds
Totals 87214818
Table 2. Structural features extracted from UAV SfM. “[color]” notation indicates that each variable was constructed from each color (red, green, and blue).
VariableDescription
brightness_meanMean overall brightness
brightness_medMedian overall brightness
brightness_stdStandard deviation of overall brightness
brightness_skwSkew of overall brightness
[color]_meanMean red, green, or blue brightness
[color]_medMedian red, green, or blue brightness
[color]_stdStandard deviation of red, green, or blue brightness
[color]_skwSkew of red, green, or blue brightness
[color]_norm_meanMean normalized red, green, or blue brightness
[color]_norm_med_lower50Median normalized red, green, or blue brightness of points below median height
[color]_norm_med_upper50Median normalized red, green, or blue brightness of points above median height
[color]_ratio_upper_lowerRatio of red, green, or blue brightness between points above and points below median height
[color]_norm_med_25thMedian normalized red, green, or blue brightness of points within ±0.05 m of 25th percentile height
[color]_norm_med_75thMedian normalized red, green, or blue brightness of points within ±0.05 m of 75th percentile height
[color]_norm_med_99thMedian normalized red, green, or blue brightness of points above 99th percentile height
[color]_ratio_75_25Ratio of [color]_norm_med_75th to [color]_norm_med_25th for red, green, or blue brightness
[color]_25th25th percentile of red, green, or blue brightness
[color]_75th75th percentile of red, green, or blue brightness
HVARVariance of crown height
HSDStandard deviation of crown height
HCVCoefficient of variation of height
HKURKurtosis of crown height
HSKESkew of crown height
TotalReturnsTotal number of points
n_25Number of points within ±0.005 m of 25th percentile height
n_75Number of points within ±0.005 m of 75th percentile height
n_ratio_75_25Ratio of n_75 to n_25
n_99Number of points above 99th percentile height
Table 3. Structural features extracted from lidar point cloud.
VariableDescription
IMAXMax intensity
IMINMin intensity
IMEANMean intensity
IMEDIANMedian intensity
IMODEMode of intensity
IVARVariance of intensity
ISDStandard deviation of intensity
ICVCoefficient of variation of intensity
IKURKurtosis of intensity
ISKESkew of intensity
I05TH, I10TH, I15TH, I20TH, I25THPercentiles of intensity (e.g., 5th percentile, 10th percentile, 15th percentile, etc.)
I30TH, I35TH, I40TH, I45TH, I50TH
I55TH, I60TH, I65TH, I70TH, I75TH
I80TH, I90TH, I95TH, I99TH
HVARVariance of crown height
HSDStandard deviation of crown height
HCVCoefficient of variation of height
HKURKurtosis of crown height
HSKESkew of crown height
TotalReturnsTotal number of points
n_10, n_20, n_30, n_40, n_50, n_60Number of points between major height percentiles
n_70, n_80, n_90, n_100(e.g., n_20 = points between 10th and 20th percentiles)
n_ratio_30_10Ratio of n_30 to n_10
n_ratio_90_10Ratio of n_90 to n_10
n_ratio_90_20Ratio of n_90 to n_20
n_ratio_80_10Ratio of n_80 to n_10
n_ratio_80_20Ratio of n_80 to n_20
n_ratio_70_10Ratio of n_70 to n_10
n_ratio_70_20Ratio of n_70 to n_20
Table 4. Confusion matrices for all models. Results reported at crown level (n = 87) following winner-take-all (i.e., mode) classification. All results shown here are from multiple hold-out cross validation, meaning that each crown was classified 100 times using random subsets of the training data: (a) UAV spectral; (b) G-LiHT spectral; (c) UAV structural; (d) G-LiHT structural; (e) UAV spectral-structural fusion; and (f) G-LiHT spectral-structural fusion.
(a) UAV SpectralActual ClassTotalUser’s Accuracy(b) G-LiHT SpectralActual ClassTotalUser’s Accuracy
Predicted ClassAliveGreenDeadPredicted ClassAliveGreenDead
Alive7141220.32Alive11200310.35
Green10262380.68Green7250320.78
Dead4815270.56Dead3318240.75
Total21481887 Total21481887
Producer’s accuracy0.330.540.83 Producer’s accuracy0.520.521.00
Overall accuracy 0.55Overall accuracy 0.62
Kappa coefficient 0.29Kappa coefficient 0.42
(c) UAV StructuralActual ClassTotalUser’s Accuracy(d) G-LiHT StructuralActual ClassTotalUser’s Accuracy
Predicted ClassAliveGreenDeadPredicted ClassAliveGreenDead
Alive1484260.54Alive1590240.63
Green5370420.88Green3340370.92
Dead2314190.74Dead3518260.69
Total21481887 Total21481887
Producer’s accuracy0.670.770.78 Producer’s accuracy0.710.711.00
Overall accuracy 0.75Overall accuracy 0.77
Kappa coefficient 0.59Kappa coefficient 0.64
(e) UAV Spectral-Structural FusionActual ClassTotalUser’s Accuracy(f) G-LiHT Spectral-Structural FusionActual ClassTotalUser’s Accuracy
Predicted ClassAliveGreenDeadPredicted ClassAliveGreenDead
Alive1372220.59Alive15100250.60
Green5390440.89Green5350400.88
Dead3216210.76Dead1318220.82
Total21481887 Total21481887
Producer’s accuracy0.620.810.89 Producer’s accuracy0.710.731.00
Overall accuracy 0.78Overall accuracy 0.78
Kappa coefficient 0.64Kappa coefficient 0.65
Table 5. Final variable selection for spectral and structural classification models.
ModelFinal Variables Selected Description
UAV spectral840717668560475NIR, red-edge, red, green, and blue multispectral bands
UAV structuralgreen_norm_med_25th Median normalized green brightness of points within ±0.05 m of 25th percentile height
green_ratio_upper_lower Ratio of green brightness between points above and points below median height
blue_ratio_upper_lower Ratio of blue brightness between points above and points below median height
blue_norm_med_99th Median normalized blue brightness of points above 99th percentile height
redness_skw Skew of red brightness
G-LiHT spectral403406409 Violet, red, red-edge, and near infrared hyperspectral bands
671674677680684
752756759801935
G-LiHT structuralI99TH 99th percentile intensity
HCV Coefficient of variance of height
ICV Coefficient of variance of intensity
IMEAN Mean intensity
n_70 Lidar returns between 60th and 70th height percentiles
n_ratio_70_10 Ratio of n_70 and lidar returns below 10th percentile height
Publisher’s Note: MDPI stays neutral with regard to jurisdictional claims in published maps and institutional affiliations.

