Review

A Synthesis of Spatial Forest Assessment Studies Using Remote Sensing Data and Techniques in Pakistan

1
College of Earth and Environmental Sciences, University of the Punjab, Lahore 54590, Pakistan
2
Department of Geography, University of the Punjab, Lahore 54590, Pakistan
3
Department of Space Science, Institute of Space Technology, Islamabad 44000, Pakistan
4
State Key Laboratory of Information Engineering in Surveying, Mapping and Remote Sensing, Wuhan University, Wuhan 430072, China
5
State Key Laboratory of Resources and Environmental Information System, Institute of Geographic Sciences and Natural Resources Research, Chinese Academy of Sciences, Beijing 100101, China
6
State Key Laboratory of Remote Sensing Sciences, Aerospace Information Research Institute, Chinese Academy of Sciences, Beijing 100101, China
7
University of Chinese Academy of Sciences (UCAS), Beijing 101408, China
*
Author to whom correspondence should be addressed.
Na Zhao act as co-corresponding authors.
Submission received: 26 July 2021 / Revised: 31 August 2021 / Accepted: 1 September 2021 / Published: 6 September 2021
(This article belongs to the Special Issue Applications of Satellite Data for Forest Monitoring and Management)

Abstract

:
This paper synthesizes research studies on spatial forest assessment and mapping using remote sensing data and techniques in Pakistan. The synthesis states that 73 peer-reviewed research articles were published in the past 28 years (1993–2021). Out of all studies, three were conducted in Azad Jammu & Kashmir, one in Balochistan, three in Gilgit-Baltistan, twelve in Islamabad Capital Territory, thirty-one in Khyber Pakhtunkhwa, six in Punjab, ten in Sindh, and the remaining seven studies were conducted on national/regional scales. This review discusses the remote sensing classification methods, algorithms, published papers’ citations, limitations, and challenges of forest mapping in Pakistan. The literature review suggested that the supervised image classification method and maximum likelihood classifier were among the most frequently used image classification and classification algorithms. The review also compared studies before and after the 18th constitutional amendment in Pakistan. Very few studies were conducted before this constitutional amendment, while a steep increase was observed afterward. The image classification accuracies of published papers were also assessed on local, regional, and national scales. The spatial forest assessment and mapping in Pakistan were evaluated only once using active remote sensing data (i.e., SAR). Advanced satellite imageries, the latest tools, and techniques need to be incorporated for forest mapping in Pakistan to facilitate forest stakeholders in managing the forests and undertaking national projects like UN’s REDD+ effectively.

1. Introduction

The credibility of the forests lies in the environmental resources they provide and the biodiversity they possess and support, along with the utilization of wood and non-wood products they produce [1]. One of the most significant ecosystem regulators, forests also conserves soil and water resources [2]. For instance, mangrove forests sequester and store carbon more effectively than tropical forests and have enormous economic worth [3]. However, irrespective of how remote or accessible forests are, they are affected by land-use changes, land degradation, climate change, and like phenomena [4]. One of the most significant global bodies working on climate change, the Intergovernmental Panel on Climate Change (IPCC), had already reported that forests respond to such variations as they undergo significant changes in their structure and composition [5]. Due to such changes, forests significantly lose their biodiversity richness and affect conservation and management practices worldwide [6].
Forest mapping and inventories are essential for countries worldwide, and remote sensing makes it possible on temporal and spatial scales, especially for countries with little to no forest inventories [7]. Remote sensing data, irrespective of their type (active or passive sensing), provide valuable information on forest stands, their composition, and their comparison with field-based conventional studies [8], and land cover mapping using remote sensing methods is used widely worldwide [9]. With time, remote sensing makes it possible to precisely map forest dispersion on landscapes by correlating forest properties with other factors [10] and mapping the species-level distribution of forests using fine spectral resolution imageries [11]. Remote sensing data types, including optical, point-cloud (e.g., LiDAR), RADAR (e.g., Synthetic Aperture Radar (SAR)), and hyperspectral, can be used effectively to map forest types [12]. Furthermore, researchers have designed algorithms for robust time-series mapping for vegetation change detection [13] and monitoring systems for forest attributes using multiple sources and techniques [14]. Lechner et al. [15] described six key reasons why remote sensing is becoming important in forest studies, including (1) remote sensing imagery allows wall-to-wall mapping by providing a synoptic view of the area observation, (2) temporal data available anywhere and anytime you need, (3) homogeneity in remote sensing data, eradicating the possibility of human-induced errors, (4) remotely sensed data integrity and interoperability, (5) cost-effective data availability, and (6) readily available remote sensing data products, reducing the need of expertise.
On a global scale, some studies have reported forest distribution and dynamics [16,17], while other studies reported characteristics of forests, including aboveground biomass (AGB), canopy height, and canopy cover [18,19,20,21,22]. A recent study by Nesha et al. [23] analyzed the Food and Agriculture Organization’s (FAO) Global Forest Resource Assessment (FRA) report of 2005–2020. They reported a healthy trend of countries worldwide to incorporate remote sensing data in reporting National Forest Inventories (NFI) as the number of countries increased from 55 in 2005 to 99 in 2020. They also reported that ~85% of global forests are monitored using up-to-date remotely sensed data products or NFIs. This healthy trend is due to the international investments for monitoring global forests, especially in the context of the United Nations (UN) project ‘Reducing Emissions from Deforestation and forest Degradation plus’ (REDD+). The most significant step towards forest conservation and management in Pakistan, other than the provincial forest departments and Pakistan Forest Institute (PFI), was the ministry of climate change, established in 2017 under which the activities of the UNREDD+ project for Pakistan are functional. These departments and the ministry are publishing several reports, but, to our knowledge, Pakistan has not yet produced a peer-reviewed publication on its national forest inventory and mapping in a well-reputed international journal. We believe that gaps exist in the literature, including (1) knowledge regarding the synthesis of widely used remote sensing techniques in forest mapping in Pakistan and (2) key satellite imageries used to map forest distribution in different spatial scales.
Based on the above analysis of the past studies conducted in the context of forestry in Pakistan, this review fundamentally tries to answer: (1) Which remotely sensed satellite imageries, classification techniques, and algorithms had been used mainly for forest mapping in Pakistan? (2) What is the pattern of citations and developed methodologies of all published papers chronologically? (3) What is the difference between the forest studies for pre- and post-period of 18th amendment in Pakistan’s constitution? and (4) What are the limitations and challenges of forest mapping in Pakistan?

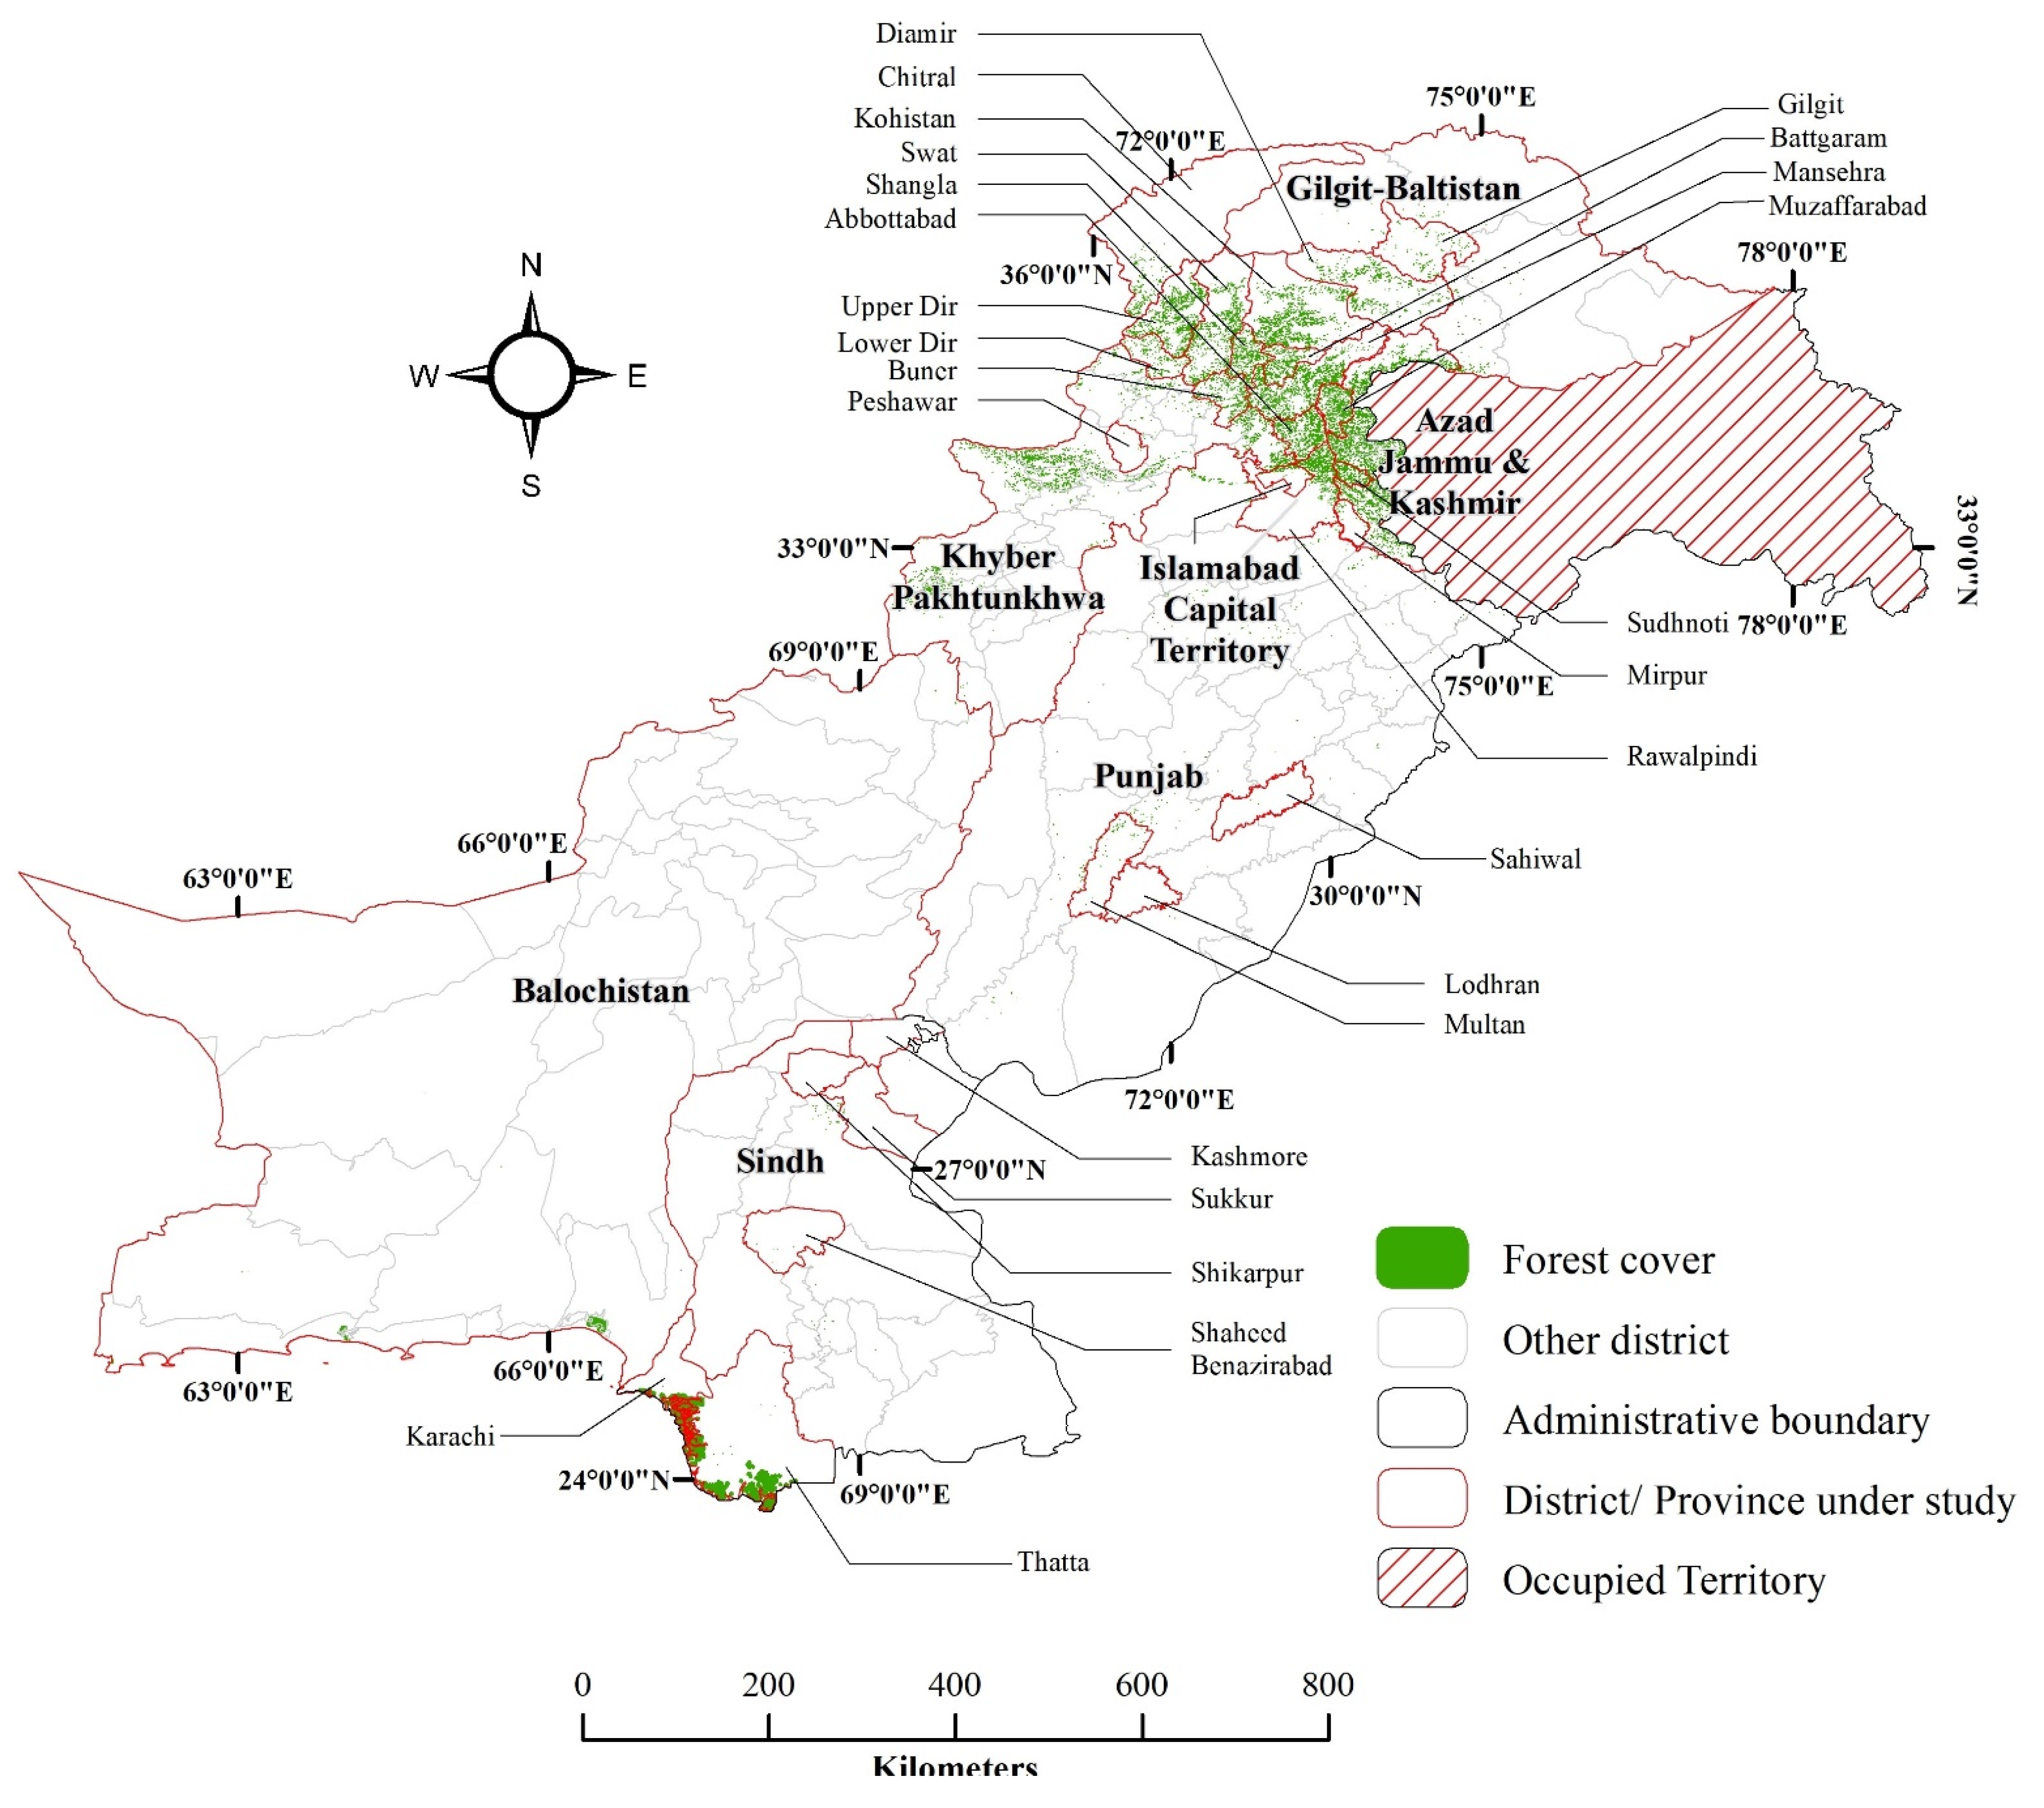
2. Geographical Coverage

According to 73 published papers in the last 28 years (1993–2021), each administrative division of Pakistan is covered geographically, as shown in Figure 1. Out of these studies, three studies were conducted in Azad Jammu & Kashmir (AJK), only one in Balochistan province, three in Gilgit-Baltistan (GB), 12 in Islamabad Capital Territory (ICT), 31 in Khyber Pakhtunkhwa (KP) province, six in Punjab province, and 10 in Sindh province. The remaining seven studies were of either regional or national scales, including one or more administrative divisions of Pakistan (Table 1). Among all satellite data sets, the Landsat series (Landsat 5, 7, and 8) were primarily used satellite imagery for forest mapping in Pakistan, while among high-resolution optical imagery, Satellite pour l’Observation de la Terre (SPOT) satellite imagery was used mainly by the researchers. Among all the reviewed papers, which reported mean elevation, 11 studies were conducted between 1–1000 meters (m) above mean sea level, eight between 1000–2000 m, six between 2000–3000 m, 16 studies above 3000 m, and 32 studies did not mention the elevation (Table S1).

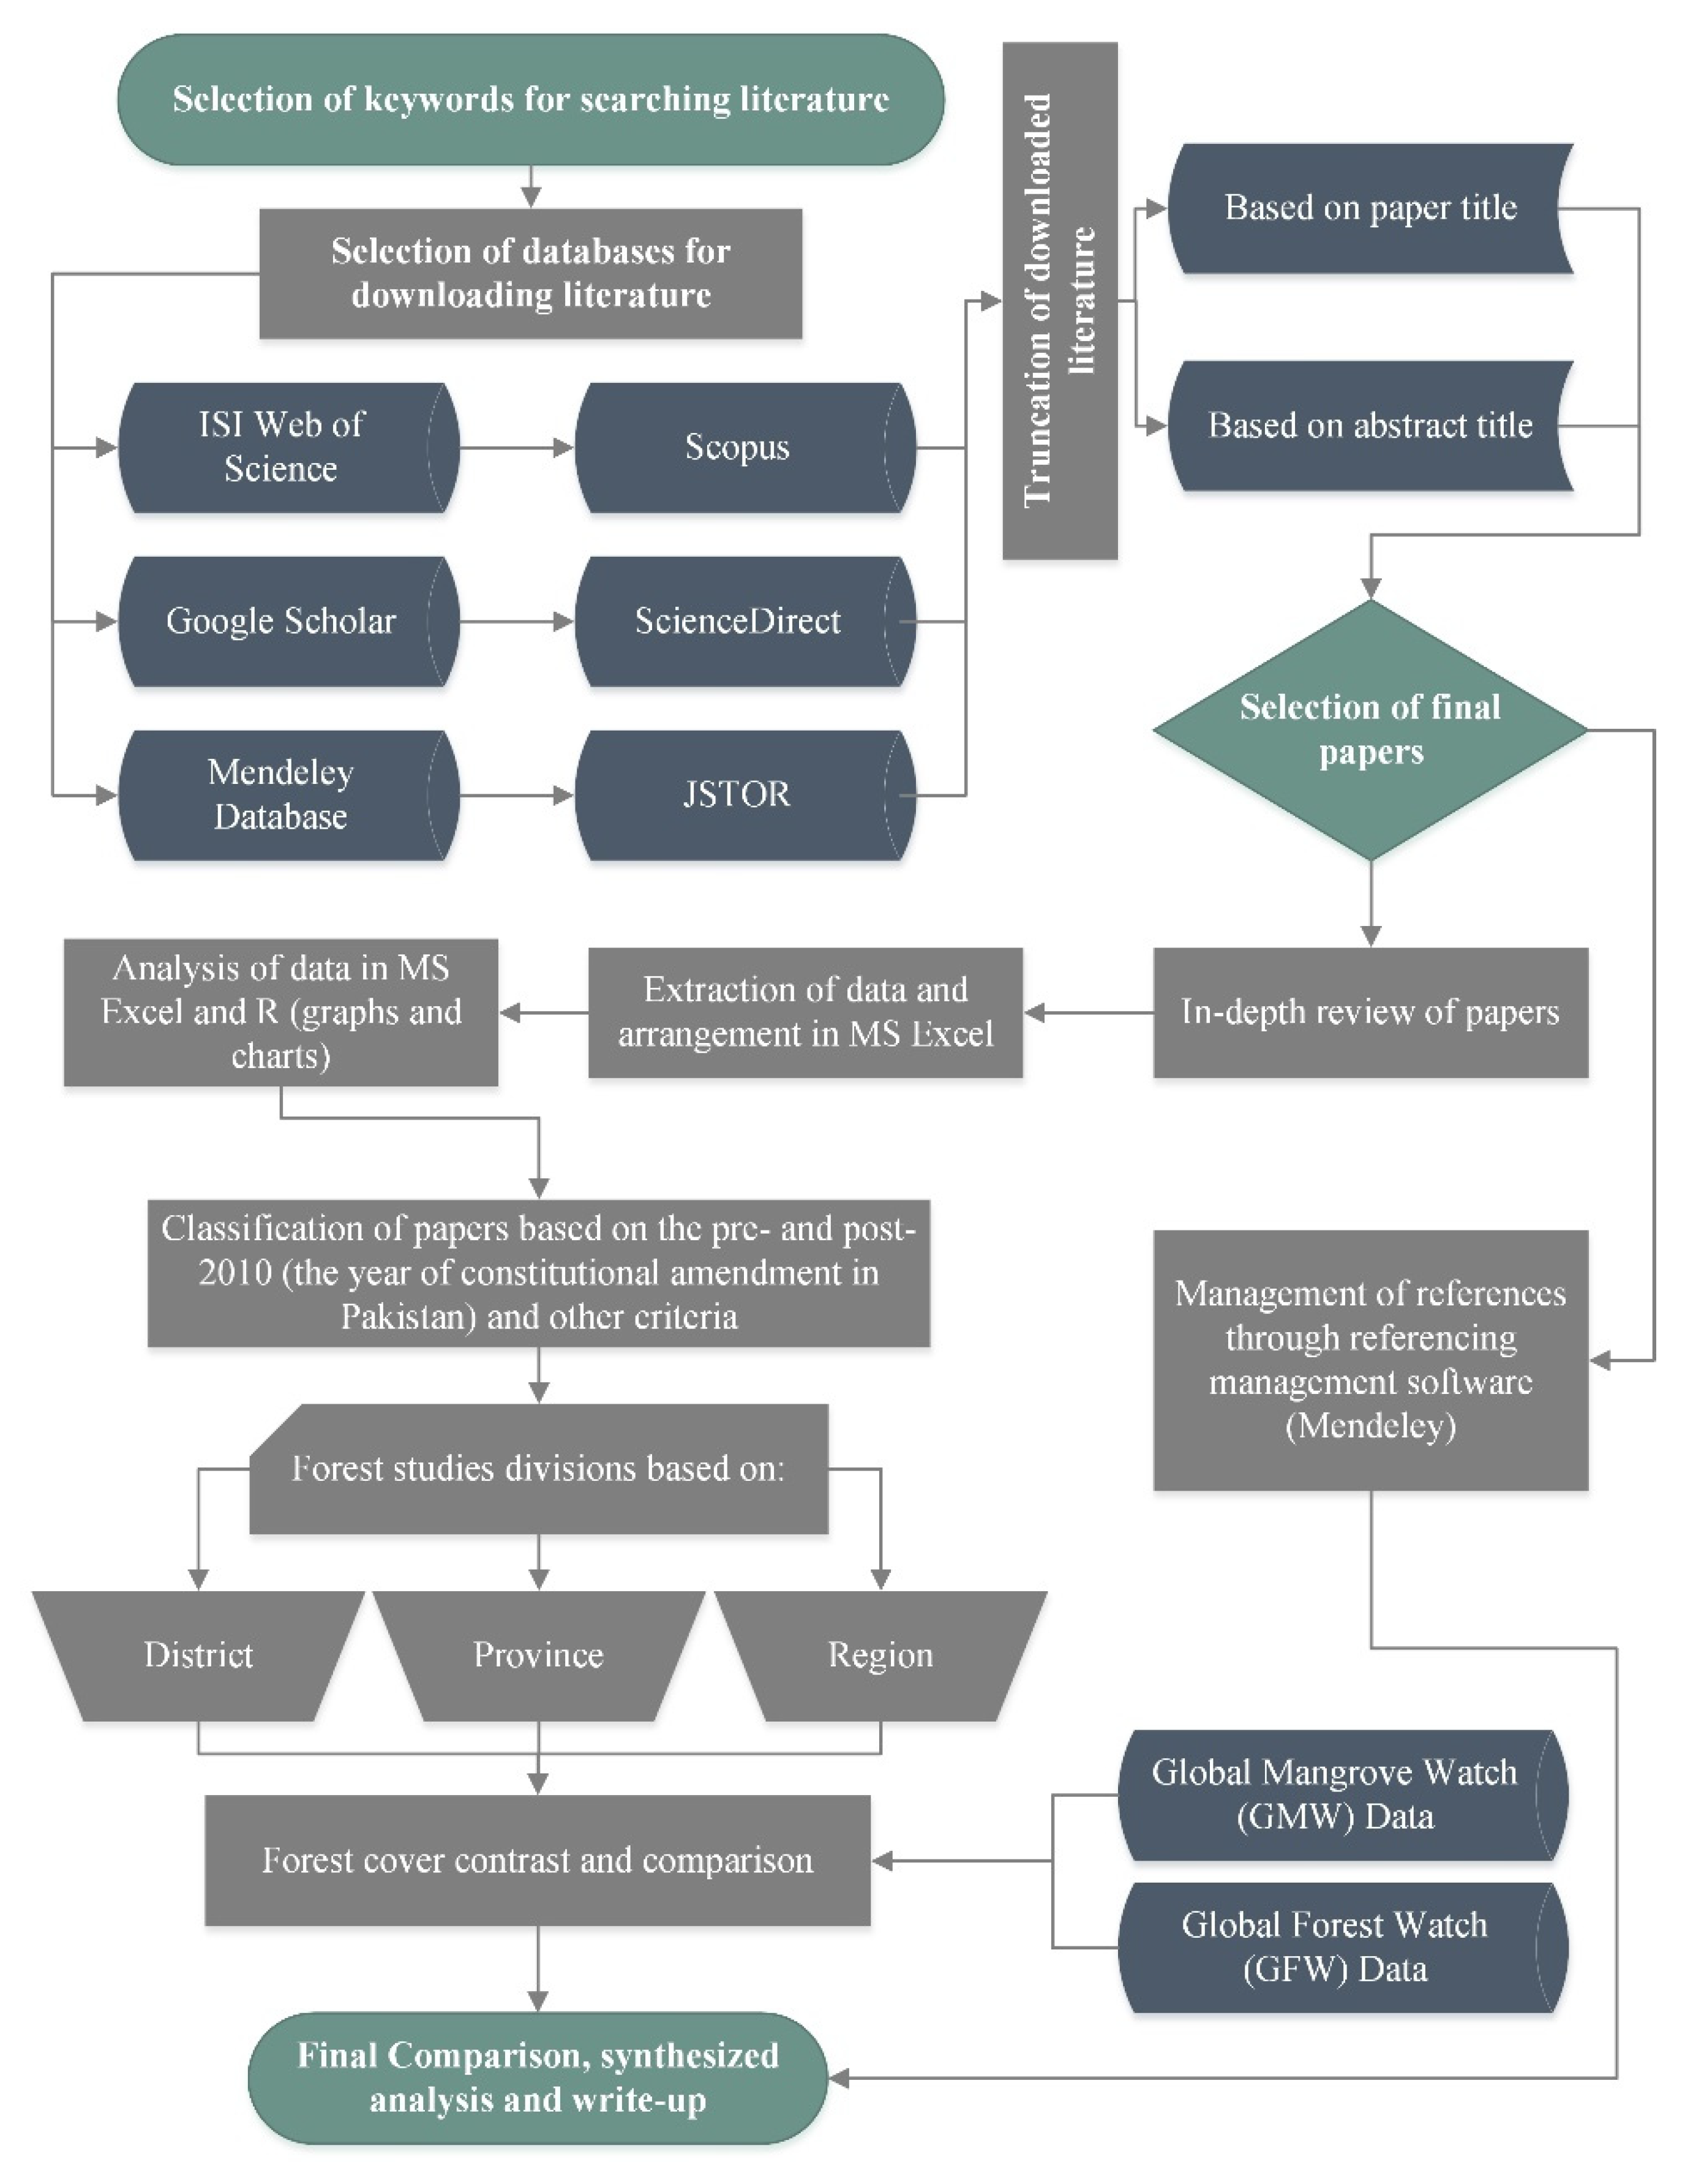
3. Review Methodology

Figure 2 presents the methodology of this literature review’s methodology workflow. The first step was carefully selecting the keywords for searching the literature through online available literature resources. These specific keywords for this review included forest mapping in Pakistan, remote sensing Pakistan, satellite image Pakistan, landcover mapping Pakistan, land-use and landcover mapping (LULC) Pakistan, land use and land cover mapping using remote sensing in Pakistan, biomass assessment using satellite imagery Pakistan, AGB using remote sensing Pakistan, forest cover mapping Pakistan, spatial analysis of forests in Pakistan, and so on. Several published papers were downloaded and managed in folders. These papers were filtered based on their respective titles and abstracts, and few published papers were screened based on the methodology section (which explains whether forest was among the LULC classes or not and which satellite imagery was used). Following this, a final selection of the papers underwent detailed reading, and data were extracted. The extracted data were managed in Microsoft Excel (MS Excel) database and were thoroughly analyzed. The analysis through MS Excel and R software produced maps, graphs, and charts. The write-up of this manuscript was designed after splitting the published papers into pre- and post-2010 scenarios to compare the statistics and discuss them further. Under these sections, the studies were divided into geographical areas (districts/provinces). The studies under these sections were discussed based on a baseline global forest cover data provided by Global Forest Watch (GFW) [24] and Global Mangrove Watch (GMW) [25]. The forest cover in each studied district/province was extracted, and contrast was made with the forest cover reported in respective studies. We used Mendeley Reference Manager, an open-source software, for managing, citing, and referencing published papers in the manuscript.
The first-ever study on spatial forest assessment in Pakistan was conducted in 1993, according to this review. From 1993 until now, we found 73 articles that presented various methodologies to map forest cover (as a main land cover class or as part of land use and land cover classes) and its change assessment using remotely sensed data and imageries. Out of these 73 published papers, only one study (around 1%) used the calibration method for classifying active remote sensing, i.e., SAR data, 4% of studies used the manual (digitization) method, 5% used the unsupervised image classification method, and 84% studies used the supervised image classification method, as shown in Figure 3. The remaining 6% of studies did not clearly report any methodology to be put among any image classification method.
Due to the 18th amendment in the constitution of the federation of Pakistan, provinces gained more autonomy and power [26]. This led towards a different approach of regions and other administrative areas of Pakistan towards forest management and conservation practices. Based on this, we divided the literature review into pre- and post-2010 scenarios. These sections were further divided into subsections based on the area/district/province/region in which these studies were conducted. The description of published papers in the pre- and post-2010 period is as follows.

4. Articles Published in the Pre-2010 Period

Appropriate classification techniques are fundamentally essential to generate reliable forest maps [27]. The classification methods were divided into supervised image classification, unsupervised image classification, and manual and calibration categories. Supervised image classification refers to the user’s choice of selecting training samples to train the algorithm for classifying the satellite image, while unsupervised image classification needs no training sample from the user for classification. Unsupervised image classification does not require the user to have the study area’s prior knowledge, and it is fast as well; however, practically, its results are often not satisfactory [28]. The manual method includes any other form with no known classification method, usually digitization, etc. Additionally, calibration refers to the technique used for processing the active sensor data like SAR.
In the pre-2010 period, very few (six) studies were conducted for spatial forest mapping, and assessment using remotely sensed data. Only two studies, using supervised image classification and unsupervised image classification method, were performed, while only a single study was conducted using a manual approach. Another study was conducted during this period in which the authors did not mention any method for image classification. Regarding the geographical area, two studies were conducted in the Margalla Hills area of Islamabad Capital Territory (ICT), one each in a part of Mansehra and Abbottabad district in KP, and one each in a part of Thatta and Kashmore district in Sindh (Table S2).

4.1. Islamabad Capital Territory (ICT)

The first study by Siddiqui and Jamil [29] used principal component analysis (PCA), an unsupervised image classification technique, using a maximum likelihood algorithm to map the forest in Margala Hills possessing an area of 148 square kilometers (km2), Islamabad. Their study incorporated SPOT XS, Landsat Multi-Spectral Scanner (MSS), and Landsat TM imageries to assess forest change between 1976–1987 and 1987–1990. This study classified forest class into dense and sparse forest subtypes and reported that forest area depleted between 1976 and 1987 but got an appraisal between 1978 and 1990. The second study by Malik and Husain [30] used pixel-based supervised classification for mapping forest in the same study area (126 km2). They used SPOT multispectral (XS) and Landsat 5 Thematic Mapper (TM) sensor for mapping forest areas. Other than forest, they classified other classes, including agricultural land, settlements/urban, and sparse vegetation. Their study did not mention the algorithm used for the classification, and they did not perform any accuracy assessment for the classified data. Their study calculated an annual forest decline rate of 0.6% between 1990–1998. Margala Hills lies in the north and northwest of ICT. Total forest cover extracted using GFW data (2019) was 102 km2 in the entire ICT.

4.2. Mansehra District

Only one study in the pre-2010 period was performed in the Mansehra district of KP. Using unsupervised image classification, Lodhi et al. [31] mapped forest cover in Siran Valley, a part of the Mansehra district. They used a nonhierarchical clustering procedure known as ISODATA (Interactive Self Organizing Data Analysis) algorithm to produce a landcover map of Siran valley in former NWFP. Using Landsat MSS and TM satellite data, their study reported a decline in overall tropical, dry, deciduous forest decline between 1979–1993 (from 202.7 km2 to 113.4 km2). The forest cover in the whole of Mansehra district using GFW data was 1385 km2 in 2019.

4.3. Thatta District

Only one study in the pre-2010 period was conducted in Keti Bunder, Thatta district of Sindh. This study was led by Saeed et al. [32] using a manual approach. They used band combination techniques to visually interpret dense, medium, sparse, and very sparse mangrove forests located in the study area. The decrypted image was then converted to a vector using an on-screen digitization approach. Using Landsat, Advanced Spaceborne Thermal Emission and Reflection Radiometer (ASTER) terra, and SPOT images for 1992, 2001, and 2007, they assessed that mangrove forests showed a declining trend from 1992–2001 (a net change of 19.38 km2) while an increasing trend from 2001–2007. Using the GMW data set, a total of 34 km2 of mangrove forest area was calculated in this coastal belt for 2019.

4.4. Kashmore District

The study by Siddiqui et al. [33] did not mention any image classification method. They worked on riverine forests in the Kashmore district of Sindh province using Landsat MSS and TM imageries for 1977, 1990, and 1998. This study evaluated that riverine forest declined at 8.78 km2 per year (km2/y) from 1977–1990 and 8.98 km2/y from 1990–1998. The total forest cover extracted using the GFW data in this district was 34 km2 for 2019.

4.5. Abbottabad District

The study was conducted by Abbas et al. [34] in Ayubia National Park (ANP), Abbottabad district of the former North Western Frontier Province (NWFP). Their study utilized object-based image analysis (OBIA) incorporating a supervised image classification method using high-resolution optical imagery of QuickBird. Using a neural network (NN) fuzzy classifier algorithm, they mapped forest subtypes, including conifer forest, conifer (shadowed) forest, and mixed forest in the complex topography of ANP. This study did not perform any forest change assessment but reported 29.56 km2 of forest cover. This district’s total forest cover area was 765 km2, as calculated from the GFW data set.

5. Articles Published in the Post-2010 Period

Around 90% (67) papers reviewed in this study were published in the post-2010 period. Most of these papers (59) used the supervised image classification method for classifying the satellite imageries to extract land use and land cover of the study areas. One study used the calibration of active remotely sensed data from the remaining studies, two studies used unsupervised image classification method, and three studies used the manual classification method, while two studies did not mention any method in their papers. Geographically, most of the studies (10) were conducted in ICT, seven in Swat district, five in Abbottabad district, five in Dir district, four each in Chitral and Thatta districts, two each in Mansehra, Rawalpindi, Gilgit, and Shaheed Benazirabad districts, three in the provinces of KP, GB, and AJK, three national-level studies on mangrove sites of Pakistan, and the remaining studies were performed in the remaining districts (one in each district).

5.1. Abbottabad District

A total of five studies were conducted in the Abbottabad district of KP (the former NWFP). The forest cover extracted from the GFW data set, for the year 2019, in this district was 765 km2.
The first study (post-2010) on the urban forest assessment was conducted by Raza et al. [35] in the part of Abbottabad district (1967 km2 area) of the former NWFP using Landsat TM, Enhanced Thematic Mapper (ETM), and ETM+ satellite imageries for 1998, 2005, and 2009. The maximum likelihood algorithm was used through the supervised image classification method to assess landcover classes of settlement, vegetation, water, forest, and bare land. Overall forest change from 1998–2009 was positive in this study, i.e., 11.943–14.77%. A subsequent study by Khan et al. [36] used SPOT-5 to assess urban forests in the Abbottabad district (4600 km2 area) of KP for 2014. This study used the supervised image classification method to compare the MDC algorithm and parallel-piped classifier algorithms. This study did not report forest cover stats. Gul et al. [37] conducted another study in the Abbottabad district (4999 km2 area) of KP to map urban forests using SPOT-5 data. They used two different classifiers, the NN classifier and Support Vector Machine (SVM) classifier, in OBIA to compare the classification results. This study also did not report forest stats. The study by Nisa et al. [38] used Landsat 5 data to map urban forests in a part of Abbottabad district (1756 km2), KP. They used a pixel-based supervised image classification method to classify 2000 and 2009 Landsat images and reported that overall forest area decreased from 211.5 km2 in 2000 to 195.9 km2 in 2009. The last study in this district was led by Ullah et al. [39] and aimed to assess alpine forest distribution and change assessment in a part of Abbottabad district (1967 km2), KP, using Landsat 5 TM, Landsat 7 ETM+, and Landsat 8 Operational Land Imager (OLI)/Thermal Infrared Sensor (TIRS). They used the non-parametric image classification technique of SVM through the supervised image classification method to classify images of 1987, 2002, and 2017. This study assessed a positive change in the forest area of 2.90% between 1987–2017, in contrast to the previous research by Nisa et al. [38], who assessed a decrease in the forest in the same study area between 2000–2009. As per the GFW data, the total forest cover they assessed for 2017 was 730 km2, which increased to 765 km2.

5.2. Chitral District

A total of four studies were conducted in the Chitral district of KP (former NWFP). The forest cover extracted from the GFW data set, for the year 2019, in this district was 247 km2.
The first post-2010 study focused on mapping the dry temperate forest of Chitral tehsil (5818 km2) of Chitral district in the former NWFP by Shehzad et al. [40]. They achieved their objectives using the Landsat TM satellite data for 1992, 2000, and 2009. Using a pixel-based supervised image classification method, the study found that the deforestation rate increased from 0.14% per annum during 1992–2000 to 0.54% per annum during 2000–2009, with 3759 ha forest lost over the 17 years. This study reported 37.6 km2 forest loss during this period. Zeb et al. [41] published the subsequent paper on the Kalasha valleys (456 km2) of Chitral district, KP, using Landsat imagery for 2003 and 2015. They used supervised image classification incorporating a maximum likelihood algorithm and indicated a decline in forest area without mentioning the statistics. Similarly, the following paper, again by Zeb et al. [42], was performed in the same study (456 km2) area using Landsat MSS, Landsat TM, Landsat ETM+, and Landsat OLI satellite imageries for 1973, 1993, and 2015 to map the dry, temperate, coniferous forests. This study also used the pixel-based supervised image classification method to report an overall decline in the forest area between 1993–2015 with a reduced rate of 0.6% and 0.9% per year in different valleys of the study area without mentioning the actual forest cover statistics. The third paper, by the same author Zeb [43], attempted to map the dry, temperate, conifer forests, deciduous forests, and oak scrub forests of the study area of Chitral district (14,850 km2), KP. Using Landsat images and applying the supervised image classification method, this study mapped dense and sparse forests between 1973, 1993, and 2015. The author reported an annual rate of change of −0.43% between 1973–1993 and −0.82% between 1993–2015, with an overall rate of change of forest of −0.63% between 1973–2015. This study reported forest cover of 689 km2 in 2015, compared to a very low estimated forest cover of 247 km2 through GFW for 2019.

5.3. Dir District

A total of five studies were conducted in the Dir (Lower and Upper) district of KP. The forest cover extracted from the GFW data set for 2019 was 257 km2 for Lower Dir, 1019 km2 for Upper Dir, and 1276 km2 for both divisions of the Dir district.
The first study in this regard, by Sajjad et al. [44], used Landsat 5 data to map the coniferous forests mixed with the broadleaved forest in Barawal tehsil (391 km2 area) of district Lower Dir, KP, using a pixel-based supervised image classification technique. They concluded that from 2000–2012, the forest area decreased by 12% (from 193.5 km2 to 145.2 km2) and the agriculture area increased by 7%. The study published by Munawar et al. [45] worked on mapping the temperate conifer forests using SPOT and MODIS satellite data in the district of Dir (Lower and Upper), KP, possessing a 4198 km2 area. They obtained land cover from the Global Land Vegetation Monitoring (GVM) project and reported that in 2001 the forest change was −362 km2 using SPOT and −587 km2 ha using MODIS, while in 2012, it was 151 km2 ha using SPOT and 416 km2 ha using MODIS, showing a positive trend in the forest area. The following, conducted by Ullah et al. [46] in the Dir Kohistan (Part of Upper Dir) forest division (927 km2 area), KP, used SPOT-5 imagery to spatially assess subtropical broadleaved oak forest temperate distribution coniferous forest, alpine, and subalpine forests. They used the pixel-based supervised image classification method to classify images of 2004, 2007, 2010, and 2013 and found that the forest declined 6.4% from 2004 to 2013 with an annual rate of −0.6%. The forest cover reported for 2013 was 289.5 km2. The study by Ullah et al. [47] used Landsat 8 OLI and SPOT-5 to map the subtropical oak forest and dry temperate coniferous forest using multiple non-parametric image classification techniques, including k-nearest neighbor (k-NN), SVM, random forest (RF), and NN in part of Dir Kohistan forest division (99 km2 area), KP. This study reported an average forest cover of 43.4 km2 using all image classification algorithms. The last study conducted in this district used a manual approach (digitization) for satellite image classification, conducted by Haq et al. [48]. They used land-use surveyed maps to estimate coniferous and alpine forests in the study area of Dir (Lower and Upper) valley, KP. They scanned the maps and digitized them for 1970 and 2014 and found that 17% of forests declined during this period. This study did not mention forest cover statistics.

5.4. Gilgit District

A total of two studies were conducted in the Gilgit district of GB. The forest cover extracted from the GFW data set, for the year 2019, in this district was 148 km2. It is important to note that both of these studies were conducted in a part of this district, and none of the studies used the district as a whole.
The study by Khan et al. [49] in the Central Karakoram National Park (CKNP), GB (10,000 km2 area), used high-resolution SPOT-5 satellite data to map the forest area for 2013. However, the study did not report any statistics on the land cover. In the paper by Imran and Din [50], they used Sentinel-2 satellite images to map the alpine, sub-alpine, and coniferous forests of Bagrote valley (4.4 km2) in GB. This study utilized OBIA incorporating an NN classifier to map the landcover for 2016 in the study area. This study classified the images into the landcover classes of dense conifer, sparse conifer, agricultural land, linear/block plantations, sparse broadleaved, sparse mix, dense mix, and dense broadleaved. The study reported forest cover (including all types) as 0.28 km2 (6.4% of the study area).

5.5. Islamabad Capital Territory (ICT)

A total of 10 studies were conducted in the federal area of ICT, which is the maximum number of studies in a single district. The forest cover extracted from the GFW data set, for the year 2019, in this district was 102 km2.
Among the twin studies by Butt et al. [51], the first study used Landsat 5 TM data to spatially assess the conifer forest and dry, semi-evergreen forest in the Rawal watershed (274.4 km2 area) near ICT. They evaluated a decrease in forest area from 1992–2012 using maximum likelihood in the supervised image classification method with an annual rate of –6.6%. This study reported a forest cover of 122.9 km2 in this watershed. The second study, by Butt et al. [52], used Landsat 5 TM and SPOT data sets to evaluate landcover in the Simly watershed (164 km2 area) near ICT using the supervised image classification method. They reported that vegetation (mixed forest) in 1992 was 113.2 km2, decreasing to 70.1 km2 in 2012, with a −26% change. The following study by Hassan et al. [53] used Landsat 5 TM and SPOT-5 imageries for 1992 and 2012 to map forest change in ICT (907 km2 area). Using a pixel-based supervised image classification method, their study evaluated that the forest area in Islamabad declined from 121.4 km2 in 1992 to 61.4 km2 ha in 2012, with an annual rate of change of –2.47%. In contrast, the forest cover in the same area was extracted as 102 km2 using a global forest data set. Following this, Mannan et al. [54] used Landsat 5 TM, Landsat 7 ETM, and Landsat 8 OLI to assess forest change of subtropical, broad-leaved evergreen and subtropical Chir Pine forests in Margallah Hills National Park (MHNP), Islamabad, from 1990 to 2017, possessing an area of 174 km2. Using the maximum likelihood classifier in the supervised image classification method, they reported that dense forests decreased by 11.14% (with a rate of −0.41% per year) and open forests increased by 4.28% (with a rate of 0.15% per year). The research conducted by Batool and Javaid [55] used Landsat 7 ETM+ and Landsat 8 OLI to map forest change between 2000–2018 in MHNP (571 km2), Islamabad. Using the maximum likelihood algorithm in the supervised image classification method, they reported a net change of –13% from 2000–2018, a loss of 651.48 km2 of forest area. The paper by Waseem and Khayyam [56] used Landsat 5 and Landsat 8 satellite data to map the forest area of ICT (907 km2). They used the supervised image classification method to report that the study area faced a 22% reduction in the vegetative (forest) cover area between 1992 and 2017, with a high, 51%, reduction between 2008 and 2017. The study by Khan et al. [57] focused on the impact of land use and land cover changes on the urban heat island in Islamabad (906 km2) using a machine learning RF algorithm. They used Landsat 5 TM and Landsat 8 OLI images to map Islamabad’s subtropical broadleaves and pine forests for 1993 and 2018. They assessed a net change in the forest area of −1.4% between 1993–2018. The forest cover reported for 2018 was 266.8 km2. Gilani et al. [58] worked on urban landscape ecology dynamics of Islamabad (906 km2) over four decades (1976–2016) using Landsat 3 MSS, Landsat 5 TM, Landsat 7 ETM+, and Landsat 8 OLI satellite images. They mapped the tropical forest cover of Islamabad using the supervised image classification method and reported that the annual rate of change of tree cover >40% canopy between 1976–2016 was −0.81%. The reported 132.3 km2 area for tree cover >40% canopy. Subsequently, Shah et al. [59] used Landsat MSS, Landsat TM, Landsat ETM+, and Landsat OLI sensors’ data to spatially assess thick and mixed forest land distribution in Islamabad (906 km2) for 1979, 1989, 1999, 2009, and 2019. Using the supervised image classification method, their study indicated that 81.3 km2 of forest area declined from 1979 to 2019. This study reported forest cover of 93.4 km2 for 2019 in contrast to 102 km2 of forest cover extracted from the global data set for the same year, 2019. The last study on ICT (906 km2) by Shah and Nizami [60] used OBIA for the same years using the same satellite data as in their previous research. This study also indicated the same 81.3 km2 deforestation between 1979–2019.

5.6. Mansehra District

A total of two studies were conducted in the Mansehra district of KP. The forest cover extracted from the GFW data set, for the year 2019, in this district was 1385 km2. It is important to note that both of these studies were conducted in a part of this district, and none of the studies used the district as a whole.
The first study, by Amjad et al. [61], used Landsat 5 and Landsat 8 satellite imageries to map the tropical forest of Mansehra district (4,296 km2 area), KP, for 1998, 2008, and 2017. Using the pixel-based image classification method, they reported that the forest in the study area increased from 1998 to 2008 and had a huge decrease from 1998 to 2017. This study reported 668 km2 forest cover in 2008 compared to 194 km2 in 2017. The second study, by Ullah et al. [62], used Landsat 5 TM, Landsat 7 ETM+, and Landsat 8 OLI data to map the land cover of a study area within Mansehra and Battagram districts (1802 km2 area) of KP. The forest cover for the Battagram district extracted through the GFW data set was 462 km2. The study used a supervised image classification method incorporating non-parametric image classification techniques (SVM and Andreson classification scheme level 1). This study reported vegetation (forest) cover in 1990 to be 1017.66 km2, in 2002 to be 933.25 km2, and in 2017 to be 841.89km2, with a net change of -9.88% between 1990–2017.

5.7. Rawalpindi District

A total of two studies were conducted in the Rawalpindi district of Punjab. The forest cover extracted from the GFW data set, for the year 2019, in this district was 712 km2.
Shahzad et al. [63] explored the trend of the Himalayan subtropical pine forests using SPOT-5 high-resolution optical imagery from 2005–2011 in the Murree galliat area (468 km2 area), Rawalpindi district, Punjab. They used the standard NN technique in OBIA through supervised image classification to assess forest conversions in the state-owned and community/private forests. The results showed a decrease of about 5 km2 of ‘closed-canopy Pinus wallichiana’ forest from 2005–2011 in the state-managed area, whereas a reduction of about 2 km2 in the community/private forest was observed. The following study, by Mannan et al. [64], utilized Landsat 5 TM and Landsat 8 OLI satellite images to explore the sub-tropical and moist temperate forests in the foothills of the Himalayan mountains (622 km2 area), Rawalpindi district, Punjab. Using a pixel-based maximum likelihood algorithm in supervised image classification, they reported that the annual rate of forest change between 1998–2008 was −0.09%, which increased to −0.32% between 2008–2018. This study reported 392.3 km2 forest cover in the study area, and the projected forest cover for 2018 was 405.5 km2.

5.8. Shaheed Benazirabad District

A total of two studies were conducted in the Shaheed Benazirabad district of Sindh. The forest cover extracted from the GFW data set, for the year 2019, in this district was 11 km2. Siyal et al. [65] conducted a study in the Pai forest (20 km2 area), located in the Shaheed Benazirabad district of Sindh, using Landsat TM, ETM, and OLI satellite imageries. They used supervised image classification to map dense and sparse forests for 1987, 1992, 2000, 2010, 2013, and 2014. They observed that the total forest cover of the study area increased about 24% from 1992 to 2010 and about 6% from 2010 to 2014. The study reported 16.4 km2 of total forest cover in 2014. The second study in this district, by Shafique et al. [66], evaluated Landsat 8 OLI/TIRS to map the Pai forest (19 km2) in district Shaheed Benazirabad, Sindh. Using unsupervised image classification indexes of Normalized Difference Vegetation Index (NDVI) and Enhanced Vegetation Index (EVI), they reported that forest carbon stock declined between 2018–2020. However, this study did not report statistics of forest cover found in the study area.

5.9. Swat District

A total of seven studies were conducted in the Swat district of KP. The forest cover extracted from the GFW data set, for the year 2019, in this district was 939 km2. The first post-2010 study in this district (5037 km2) used the manual method for image classification, published by Qasim et al. [67]. This study aimed to map conifer forests of Swat district, the former NWFP, using aerial photographs and satellite imageries. The forest area was digitized through visual interpretation, and they found a significant decrease in forest area from 1968–2007. The study reported a total of 56.5 km2 of forest cover in three selected zones of this district. The work on coniferous forest mapping by Qasim et al. [68] in this district (5037 km2 area) used a manual digitization approach using aerial photographs and satellite imageries for 1968, 1990, and 2007. They divided the study area into different zones, A, B, and C. In zone C, 75.1% of the forest area was converted to rangeland in 40 years, whereas this happened to 37.8% of the area in zone A. Afforestation also occurred in the study area but was negligible compared to deforestation. The subsequent study was conducted by Qamer et al. [69], who used Landsat 5 TM, Landsat 7 Enhanced Thematic Mapper Plus (ETM+), and SPOT-5 High-Resolution Visible (HRV) imageries to temporally map the western Himalayan subalpine conifer and subtropical pine forests in Swat and Shangla districts of the former NWFP. The forest cover in the Shangla district was 539 km2, as calculated through the GFW data set. Using a pixel-based image classification method, they mapped dense and open forest in the study area for 2001 and 2009 and found an average annual gross deforestation rate of 0.82%. This study reported an overall forest area of 1572.82 km2 for 2009 compared to 1478 km2 forest cover (for 2019) extracted from the GFW data set for both districts. The study by Ali et al. [70] used Landsat imagery to estimate the spatial distribution of tropical deciduous to the alpine forest in the Swat valley (5337 km2 area), KP. They assessed forest change between 1992–2011 and reported a 13.42% decrease in the dense forest, while open forest increased from 926 km2 in 1992 to 116.7 km2 ha in 2011. A subsequent study by Ahmad et al. [71] mapped coniferous forest change in Kumrat valley (346 km2 area), district Swat, KP, using Landsat 5 TM and Landsat 8 OLI satellite data. They used the supervised image classification method to state a net loss of 6.3 km2 (with a rate of 0.29 km2 per year) from 1994–2016. Ahmad et al. [72] used Landsat 8 OLI to map Cedrus Deodara forest, Pinus Wallichiana forest, Abies pindrow, and mixed coniferous forest in the Kumrat valley (346 km2 area), district Swat, KP. They used a maximum likelihood classifier in the supervised image classification method and mapped dense and open forests for 2016. This study reported a total of 176.9 km2 of forest cover in the study area for 2016. The last study in this district, by Talib et al. [73], used Landsat TM, Landsat ETM+, and Landsat OLI/TIRS to map the forests of Swat valley (5392 km2 area). The study reported that the forest area decreased from 1473.1 km2 in 2000 to 1235.40 km2 in 2005 to 1167.093 km2 in 2010 to 1086.05 km2 in 2015. In contrast to this, the forest cover extracted through the GFW data set was 939 km2 for 2019.

5.10. Thatta District

A total of four studies were conducted in the Thatta district of Sindh. The forest cover (riverine and mangrove forests) extracted from the GFW (2019), and GMW (2016) data sets in this district was 964.9 km2. The first study on mangrove forest cover assessment was led by [74] in the Indus delta (1010 km2 area), district Thatta, Sindh. Along with Landsat TM, they were the first in Pakistan to use Landsat 8 OLI satellite data for forest cover assessment. They incorporated a supervised classification method combined with a manual digitization method to delineate mangroves, mudflats, vegetation/crop, algae, sand, and water for 2009 and 2014. The results showed that the total area of mangrove cover was 946.52 km2 using supervised image classification and 960.83 km2 using manual digitization in 2009, while it was 1010.11 km2 using supervised image classification, and 1082.71km2 using manual digitization in 2014, clearly indicating an increase in mangrove forests. The second study, by Qasim et al. [75], in district Thatta (17,361 km2 area), Sindh, used Landsat imagery to map the riverine/mangrove forest by applying a maximum likelihood algorithm in supervised image classification. Their study evaluated that the forest area declined from 1527.6 km2 in 1990 to 1293.1 km2 in 2010 to 1022.2 km2 in 2014. The paper by Rehman and Kazmi [76] attempted to map mangrove forests in the Indus delta (11,962 km2 area), district Thatta, Sindh, using Landsat 7 ETM+ and Landsat 8 OLI satellite images. They used the supervised image classification method to map dense and regular mangroves for 2000 and 2014. Their study assessed an annual decrease rate of dense forests of −0.93 km2 and regular mangroves’ yearly increase rate of 23.21 km2 from 2000–2014. The total mangrove forest cover in this study was 953.2 km2 for 2014. The last study in this district (942 km2 area) by Abbasi et al. [77] used Landsat 3 MSS and Landsat 5 TM satellite imageries to map the Thatta river’s riverine forest in the Indus river basin, Sindh. Using the supervised image classification method, they mapped the riverine forests for 1979, 1992, 1998, 2000, 2006, 2009, and 2010 and observed an enormous net change in the forest area of −89.07% between 1979–2010.

5.11. Khyber Pakhtunkhwa (KP), Gilgit-Baltistan (GB), and Azad Jammu and Kashmir (AJK)

A total of three studies were conducted collectively in three administrative areas of Pakistan, including KP, GB, and AJK. The forest cover extracted from the GFW data set, for the year 2019, in this study area was 15,103 km2. Qamer et al. [78] conducted the first regional-level study, including the province of KP and the administrative units of GB and AJK (182,600 km2 area) using Landsat TM and ETM satellite imageries for 1990, 2000, and 2010. The study evaluated that the overall annual forest cover rate of change was –0.38% for the entire area from 1990 to 2010 (KP −0.42%, GB −0.31%, and AJK −0.13%). The total forest cover in this entire region was 21,521 km2 for 2010. The second such study, published by Munawar and Udelhoven [79], used MODIS to map the evergreen coniferous forest, including some deciduous broad-leaved forests, for 2000–2018 in KP, GB, and Kashmir (183,000 km2 area) regions. However, the study does mention that it used pixel-based classification, but without reporting the method, and it also did not mention the forest change statistics. The following study, by Khan et al. [80], used Landsat 5 and Landsat 8 remotely sensed images to map the alpine forests existing in the northern part of Pakistan (GB, KP, and AJK), possessing an area of 85,435.4 km2. They used a maximum likelihood classifier to map the forests for 2000, 2010, and 2020. This study mainly aimed to find the impact of land use and land cover changes on snow leopards’ habitat. An unfavorable change of 1777.20 km2 (−32%) was observed in the forest woodland between 2000–2020. The study reported a forest cover of 6649.8 km2 for 2020.

5.12. Coastal Mangrove Sites of Pakistan

The coastal mangrove sites of Pakistan consist of five locations, including Indus Delta and Sandspit in Sindh, and Miani Hor (Sonmiani Bay), Kalmat Khor, and Jiwani (Gwadar Bay) in Balochistan. The total mangrove forest cover assessed through the GMW data set collectively in these sites was 680 km2 in 2016. The first national-scale study, by Abbas et al. [81], used NN and rule-based methods in OBIA to map mangrove forests using ALOS AVNIR-2 for 2009. The total mangrove forest cover for all these sites was 981.3 km2 in this study. The following study was done by Abbas et al. [82], who used a NN fuzzy classifier through OBIA to map the mangrove forest belt located at the coastal belt (1580 km2 study area) of Pakistan. Advanced Land Observation Satellite’s (ALOS) Advanced Visible and Near Infrared Radiometer type 2 (AVNIR-2) sensor high-resolution data were used for 2008–2009. The total mangrove forest cover for all these sites was 924.1 km2 in this study. The latest study by Gilani et al. [83], mapped national-level mangroves in Pakistan, including various sites (9538 km2 area) for 1990, 1995, 2000, 2005, 2010, 2015, and 2020. Processing and classification of Landsat 5 TM, Landsat 7 ETM+, and Landsat 8 OLI satellite images reported a national-scale increase in a mangrove from 477.22 km2 in 1990 to 1463.59 km2 in 2020 with an annual rate of change of 3.74%.

5.13. Other Districts

The remaining 18 studies were performed in different districts of Pakistan. The study by Abbasi et al. [84] in the forest divisions of the districts of Sukkur and Shikarpur (1997 km2 area), Sindh, used Landsat MSS and TM satellite images to generate landcover maps of riverine forests for 1979, 1992, 1998, 2000, 2006, and 2009. Their study examined a considerable decline, 85%, of riverine forests from 1979–2009. Forest cover in 1979 was observed as 22.67% of the total study area, while in 2009, it was 5.97% (119.2 km2). The total forest cover of both districts was calculated as 12 km2 using the GFW data set (2019). The study by Iqbal and Khan [85] in the Muzaffarabad district of AJK (740 km2 area) used Landsat TM satellite data to map subtropical, evergreen, dry, broad-leaved forests, subtropical Chir pine forests, and temperate broad-leaved forests for 1998 and 2009 using the pixel-based supervised image classification method. The classification results revealed that, from 1998 to 2009, over a period of about 11 years, forest cover and low vegetation decreased at the annual rate of 2.70% and 2.60%, respectively. This study reported a forest cover of 155.5 km2 for 2009 compared to 724 km2 calculated through the GFW data set (2019). Batool et al. [86] used Landsat ETM data to map forest cover in the Thak valley (Diamir District), KP. Using supervised image classification, the forest change assessment in the study area (213 km2) was performed for 1989, 1999, and 2009, where forest decreased from 85.83 km2 in 1989 to 34.4 km2 in 2009. The total forest area in the entire district was calculated as 570 km2 using the GFW data set for 2019. Among all the reviewed papers in this review, only one study, conducted by Baig et al. [87], used active remotely sensed data. Using a calibration technique, they mapped an irrigated forest plantation (47 km2 area) in the Sahiwal district, Punjab, through SAR ALOS-2 PALSAR (the Phased Array type L-band Synthetic Aperture Radar). Along with this, they used WorldView-3 imagery to verify their results. They mapped various forest tree species, including Shisham (Dalbergia sissoo), Sufeda (Eucalyptus camaldulensis), Toot or Mulberry (Morus alba), and Simal (Bombax ceiba) in pure and mixed forms with naturally grown Mesquite (Prosopis juliflora). The total forest area in the entire district was calculated as 3 km2 using the GFW data set for 2019. Younis and Ammar [88] mapped the forest area in Besham watershed (which lies within Buner and Mansehra districts), KP, using Landsat 5 TM satellite data from 2000–2010 with an area of 6812 km2. This study reported a net loss of 17% (3.88 km2) from 2000–2010 in the forest area. This study reported forest cover of 1892.6 km2 for 2010 compared to 1849 km2 forest cover in both of these districts (Buner and Mansehra) through the GFW data set for 2019. The following study, led by Rashid and Iqbal [89], used Landsat 4–5 TM, Landsat 7 ETM, and Landsat 8 OLI to map conifer and pine forests along the Karakoram Highway (N-35), through KP, to GB (4,200 km2 area). The study used imageries of 1990, 2000, 2010, and 2016 and reported a 26% decrease in the forest cover during this period. The total forest cover of KP and GB combined was 11,042 km2, as per the GFW data set for 2019. The following study, by Khan et al. [90], used Landsat 5, Landsat 7, and Landsat 8 images for 1996, 2003, and 2016 to map the urban forest in Peshawar district (1257 km2 area), Pakistan. This study used the supervised image classification method to report vegetation (including forest) increase from 1996 to 2003 and then decrease from 2003 to 2016. An overall vegetation decrease of 21.90% was described between 2003 to 2016. The total forest area in the entire district was calculated as 9 km2 using the GFW data set for 2019. The study by Urooj and Ahmad [91] incorporated Landsat 5 TM, Landsat 7 ETM+, and Landsat 8 OLI to map the dry, subtropical thistle and scrub forests in and around the surroundings of Mangla Dam (3053 km2 area) in the Mirpur district of AJK. Using the supervised image classification method, they mapped the land cover of 1992, 2002, and 2013 and reported that deforestation occurred with a net change of 547.45 km2 from 1992 to 2013. The total forest area in the entire district was calculated as 63 km2 using the GFW data set for 2019. The study by Khan et al. [92] used Landsat TM, Landsat ETM+, and Landsat OLI satellite data sets to map temperate forests in Sudhnuti district (471 km2 area), AJK. They extracted vegetation fractions (forest, non-forest area) using Linear Spectral Mixture Analysis (LSMA), a supervised image classification approach, for 1989, 1993, 1999, 2005, 2010, 2015, and 2018. As a result, they reported that the forest area declined between 1989–1993 and 1993–1999; it increased between 1999–2005, 2005–2010, 2010–2015, and 2015–2018. This study reported approximately 203 km2 of forest cover for 2018 compared to 297 km2 for 2019, as calculated through the GFW data set. The subsequent study by Mahmoudi et al. [93], used Moderate Resolution Imaging Spectroradiometer (MODIS) data to map regional mixed forests of Balochistan and the eastern Iran region (769,824 km2 area). Using MODIS land cover type product (MCD12Q1) on a yearly basis, this study reported that the forest area increased between 2001–2013. The total forest area in the entire province of Balochistan was calculated as 18 km2 using the GFW data set for 2019. The following research, by Ali et al. [94], used SPOT-5 satellite imagery to map Subalpine, dry temperate, moist temperate, oak, subtropical broad-leaved, subtropical pine, and dry tropical thorn forests of KP (11,336 km2 area) using OBIA. The total forest area in the entire province of KP was calculated as 10,123 km2 using the GFW data set for 2019. The following study by Saddique et al. [95] used Landsat TM, Landsat ETM+, and Landsat OLI to map the evergreen and deciduous forests in the river Jhelum basin (Mangal Dam watershed), AJK (33,397 km2 area). Using a machine-learning algorithm (RF) in supervised image classification, they reported that the forest area showed a positive difference of 2806.87 km2 between 2001–2009 and 2009–2018. This study reported a forest cover of 12,118 km2 for the entire watershed for 2018. The total forest area in the entire AJK region was calculated as 4061 km2 using the GFW data set for 2019. The following study, conducted by Hussain et al. [96], used Landsat TM and Landsat OLI satellite imagery in the urban forest (3650 km2 area) of Multan district, Punjab. They mapped the study area for two cropping seasons of Rabi and Kharif. They reported that the forest area gained a negative change of –41 km2 from 1988–2017 during the Rabi season and –48.6 km2 for the same period during the Kharif season. This study reported a forest cover area of 53 km2 compared to 59 km2 extracted through the GFW data set for 2019. Another research work by Hussain et al. [97] for mapping urban forest in Lodhran district, Punjab, used Landsat 4–5 TM, Landsat 7 ETM+, and Landsat 8 OLI satellite images for 1977, 1987, 1997, 2007, and 2017. Using a maximum likelihood classifier in the supervised image classification, they reported that the vegetation (forest) area increased from 87.9% (of the total study area) in 1987 to 90.8% in 2017. The total forest area in the entire district was calculated as only 1 km2 using the GFW data set for 2019. That the subsequent study used the supervised image classification method was published by Khan et al. [98], who used Landsat 7 and Landsat 8 satellite images to map the Himalayan moist temperate and sub-alpine temperate forests’ AGB of Battagram (1507 km2 area), KP, for 2000 and 2015. Their study indicated a –16.88% loss in the forests of the study area with an annual deforestation rate of 2.51%. This study reported a forest cover area of 450.8 km2 in 2015 compared to 462 km2 extracted through the GFW data set for 2019. Ali and Nayyar [99] used Landsat 8 OLI satellite imagery to assess mangrove forests located in the Karachi region’s coastal belt (2030 km2 area) for 2017 using the unsupervised image classification method. They used pixel-based spectral indexes, including NDVI, Normalized Difference Moisture Index (NDMI), Ratio Vegetation Index (RVI), EVI, Combined Mangrove Recognition Index (CMRI), and Soil Adjusted Vegetation Index (SAVI) to delineate mangrove and non-mangrove land covers. This study reported a mangrove forest cover area of 228.6 km2 in 2017 compared to 34 km2 extracted through the GMW data set for 2019. The difference in the areas is because mangroves do not have an exact boundary. The paper by Haq et al. [100] used Landsat 3 MSS, Landsat 7 ETM+, and Sentinel 2A satellite images to map dense Deodar and Pine forest, Juniperus Communis (juniper), Pinus Wallichiana (blue pine), Abies Webbiana (silver fir), Aesculus Indica (bankhor), Pinus species, Cedrus Deodara (deodar), Abies Pindrow (palunder), Pinus Gerardiana (chalghoza), and Juglans Regia (walnut) in the Palas valley in Kohistan district (7492 km2 area), KP. Using the maximum likelihood classification technique in the supervised image classification method, this study reported that the forest cover declined between 1980–2017, with a change of −12.23%. This study reported a forest cover area of 198.6 km2 in 2017. The forest cover of the entire Kohistan district, extracted through the GFW data set, was 1304 km2. The last reviewed study, performed by Zafar et al. [101], used MODIS data to map the coniferous, broad-leaved, and mixed forests in GB (68,601 km2 area) using a pixel-based supervised image classification method. This study reported that a substantial increase in the forest was observed between 2008–2017 yearly. This study reported an overall forest cover in the study area as 0.081% of the total area, while the GFW data set showed 919 km2 of forest cover in the entire GB for 2019.

6. Accuracies, Assessments, and Validations for Forest Mapping

Abbas et al. [34] reported overall accuracy of 89.99% without mentioning ground-truthing/validation points used to assess overall accuracy. The subsequent study used the supervised image classification method by Abbasi et al. [84], who used the maximum likelihood technique and assessed overall accuracy and kappa coefficient for accuracy assessments of generated land covers. Overall accuracies of 99.96%, 99.9%, 99.53%, 99.96%, 99.93%, and 99.68% with kappa coefficient values of 0.9995, 0.9996, 0.9935, 0.9994, 0.9985, and 0.9945 were calculated for the years 1979, 1992, 1998, 2000, 2006, and 2009, respectively. Similarly, Abbas et al. [102] used overall accuracy and the kappa coefficient to assess the accuracy of the national-level mapping of mangrove forests in Pakistan. Two hundred fifty ground validation points were used to assess the accuracy of the classified map. Their study achieved an overall accuracy of 83.2%, along with the kappa coefficient value of 0.7301. The study by Qamer et al. [103] was the first to use the user’s and producer’s accuracies and overall accuracy assessment. However, they did not mention the observed accuracy values (user’s and producer’s accuracies) and only mentioned overall accuracies of 79.2% and 81.1% for 2001 and 2009. Abbas et al. [81] used the OBIA method to map mangrove forests in Pakistan and assessed the accuracy of their classified image using overall accuracy and kappa coefficient. In this national-scale study, they found overall accuracies of 80.2%, 84.6%, 80.5%, 78.9%, and 83.7%, and kappa coefficients of 0.71, 0.74, 0.76, 0.69, and 0.73 for the study locations of Indus delta, Sandspit, Kalmat Khor, Miani hor, and Jiwini, respectively. Shehzad et al. [40] presented the first study that mentioned and reported the maximum accuracy assessments, including overall accuracy, kappa statistics, producer’s accuracy, and user’s accuracy. The total accuracy rate (total number of accurate pixels compared to the number of pixels taken as reference) was 87.6%, and the kappa statistics value was 85.0%. The producer’s accuracy was over 80% in all classes except agricultural fields (78.9%), and the user’s accuracy was over 80% in all classes except for grasses (75%). The subsequent study by Iqbal and Khan [85] also reported all major accuracies. Overall accuracy and kappa coefficient were 89%, 86%, and 86%, 82% for 1998 and 2009. User’s accuracies were assessed to be >84% and >77% for all classes while producer’s accuracies were >90% (except bare soil class, i.e., 85%) and >87% (except bare soil class, i.e., 79%) for 1998 and 2009. Shahzad et al. [63] used high-resolution SPOT-5 imagery and, with the help of 117 ground validation points, they calculated an overall accuracy of 94.01%, kappa coefficient of 0.93, producer’s accuracy >91.67% (for all classes except scrub forest, i.e., 85.71%,), and user’s accuracy >80.95% (for all classes) for 2011. Khan et al. [36] compared the Mahalanobis Distance Classification (MDC) algorithm and Parallel-piped classifier using different accuracies. The MDC algorithm assessed overall accuracy of 95.4%, kappa coefficient of 0.937, producer’s accuracy of >95.34% (except sparse vegetation class, i.e., 76.31%), and user’s accuracy of 84.84% (except settlements class, i.e., 75.65%) compared to Parallel-piped classifier that resulted in an overall accuracy of 85.97%, kappa coefficient of 0.8115, producer’s accuracy of 70.28% for all classes, and user’s accuracy of 61.55% (except sparse vegetation class, i.e., 46.84%). Butt et al. [51] used 100 validation points to assess overall accuracy and kappa coefficient of 95.32%, 0.9237 for 1992, and 95.13%, 0.9070 for 2012, respectively. Similarly, Butt et al. [52] used 100 validation points to calculate accuracies of classified images using Landsat 5 TM and SPOT imageries. They reported overall accuracy and kappa coefficient of 95.32% and 0.9237 for 1992 and 95.13% and 0.9070 for 2012, respectively. Hassan et al. [53] used 100 validation points to assess overall accuracy and kappa statistics. They found 89% overall accuracy and 0.89 kappa value for both 1992 and 2012. Similarly, Qamer et al. [78] performed a regional-level study and assessed overall accuracy, producer’s accuracy, and user’s accuracy. Their study resulted in an overall accuracy of >80% for sparse coniferous forest and >84% for all other forest types (dense coniferous forest, dense mixed forest, sparse mixed forest, dense broad-leaved forest, and sparse broad-leaved forest). They evaluated 80.95% and 71.43% producer’s accuracy for dense and sparse forests, with 94.44% and 95.24% user’s accuracy for dense and sparse forests, respectively. Producer’s accuracy of 49.35%, 65.31%, 81.25%, 60.71%, 60.71%, and >90% and user’s accuracy of 74.51%, 60.38%, 59.09%, 53.13%, and 64.29% were observed for the landcover classes of grass/shrubs, agriculture, bare soil/rock, snow/glaciers, and water, respectively. Gul et al. [37] compared NN and SVM classifiers using OBIA and obtained the overall accuracy of 96% and 98.93%, kappa value of 0.96 and 0.98, producer’s accuracy of >92% and >96%, and user’s accuracy of 85% and >93% for NN and SVM classifiers, respectively. Similarly, Ullah et al. [46] used 297 validation samples to assess overall accuracy and kappa statistics for the classification accuracy assessment. They reported overall accuracy of 62.22%, 75%, 78%, and 78% and kappa statistics of 58%, 65%, 69%, and 69% for 2004, 2007, 2010, and 2013, respectively. The Study by Ali et al. [70] used 30 ground validation samples to report an overall accuracy of 72% using Landsat imagery. Ullah et al. [47] used multiple non-parametric image classification techniques of k-NN, SVM, RF, and NN for classifying Landsat 8 OLI and SPOT-5 images to map forest cover in the study area. Table 2 shows the details of each accuracy achieved against each image and technique using 280 validation samples.
Mannan et al. [54] used only kappa statistics by using 200 validation points to report accuracy while mapping forests in MHNP, Islamabad. They reported a kappa value of 0.90, 0.91, 0.87, and 0.91 for 1990, 2000, 2010, and 2017. The study by Ahmad et al. [71] reported 50 validation samples to assess accuracies for classified maps using overall accuracy, kappa coefficient, producer’s accuracy, and user’s accuracy, but they did not report values in their paper. Younis and Ammar [88] used 98 ground validation points to report overall accuracy of 71.4% and a kappa coefficient of 0.623 for 2010 using Landsat imagery. After this, Rahid and Iqbal [89] analyzed forest cover along a national highway in Pakistan and assessed accuracy using 500 validation points. This study reported an overall accuracy of 88%, 85%, 83%, and 89%, and a kappa coefficient of 0.83, 0.78, 0.77, and 0.85 for 1990, 2000, 2010, and 2016, respectively. The study by Ullah et al. [39] used a non-parametric approach of SVM and assessed overall accuracy and a kappa value against each year. The resultant kappa value was 0.76, 0.86, and 0.92, and overall accuracy of 82.44%, 88.80%, and 94.68% for 1987, 2002, and 2017, respectively. Similarly, Mannan et al. [64] performed supervised image classification and assessed classification accuracy using 300 validation points. They reported an overall accuracy of 96% for each year and a kappa coefficient of 0.832, 0.832, and 0.841 for 1998, 2008, and 2018. This study reported producer’s accuracy of >72.73%, >83.33%, and >83.87% and user’s accuracy of >70%, >83.78%, and >80.00% for 1998, 2008, and 2018, respectively. Subsequently, Zeb [42] used the supervised image classification method to map forests in Chitral, KP, and reported overall accuracy of around 89% and 93% for dense and sparse forests, respectively, with producer’s accuracy of 90% and 92% for dense and sparse forests. Ullah et al. [62] used 160 validation points for accuracy assessment and evaluated classification’s overall accuracy of 94.96%, 92.26%, and 91.35%, and kappa coefficient of 0.92, 0.88, and 0.87 for 1990, 2002, and 2017. The producer’s and user’s accuracy for 1990, 2002, and 2017 were calculated as 93.15%, 86.24%, and 92.84% and 96.34%, 96.34%, and 93.67%, respectively. Subsequently, Urooj and Ahmad [91] reported the accuracy of their classified maps of 1992, 2002, and 2013 using 120 validation points: overall accuracy of 95.83%, 96.67%, and 99.17%, and kappa value of 0.93, 0.95, and 0.99. Similarly, Abbasi et al. [77] used 28 ground validation points to report overall accuracy and kappa statistics for their classified maps of 1979, 1992, 1998, 2000, 2006, 2009, and 2010, as shown in Table 2.
Ahmad et al. [72] worked on mapping deciduous and conifer forests for 2016 and used 50 ground validation points to calculate overall accuracy and kappa coefficient value. However, their study did not mention the achieved values. In the first study of 2020, Khan et al. [92] used 140 validation points to map the forest and non-forest fractional maps. This study reported an overall accuracy of 96%, kappa value of 0.92, producer’s accuracy of 97% for forest and 95% for the non-forest area, and user’s accuracy of 96% for forest and 97% for the non-forest area. Ali and Nayyar [99] published their research on forests of KP for 2012 and mentioned that they used 373 validation points for the accuracy assessment of produced maps but did not mention the obtained values. Similarly, Khan et al. [57] used 460 validation points to report an overall accuracy of 84% and 91%, with a kappa coefficient of 0.79 and 0.85 for 1993 and 2018. The study by Gilani et al. [58] used 125 validation points to report overall accuracy, user’s accuracy, producer’s accuracy, and kappa coefficient, as shown in Table 2.
Saddique et al. [95] published a study that used a machine learning algorithm (RF) to report overall accuracy of 90%, 92%, and 95%, and kappa coefficient of 89%, 90%, and 94% for 2001, 2009, and 2018. The producer’s accuracy was calculated as >83%, >88%, and 93%, and the user’s accuracy was calculated as >83%, >82%, and >94% for the same years, respectively. Similarly, Hussain et al. [96] reported classification accuracies, as described in Table 2, showing that the more accurate classification statistics were achieved for the Kharif season classification. Similarly, Hussain et al. [97] again reported accuracies for mapping landcover of Lodhran district, Punjab, as shown in Table 2. High accuracies were reported in the later years, i.e., 2007 and 2017. The last study of 2020 by Khan et al. [98] reported landcover classification accuracies as overall accuracy of 80.44% and 86.24%, kappa coefficient of 0.7621 and 0.8422, producer’s accuracy of >65.31% and >67.59%, and user’s accuracy of >69.14% and >77.59% for 2000 and 2015.
Haq et al. [100] used overall accuracy, kappa coefficient, producer’s and user’s accuracy to report the accuracy achieved in their classified maps. This study only calculated the user’s accuracy, without mentioning the producer’s accuracy, as in Table 2. Interestingly, they achieved lower accuracies in recent years (2010 and 2017) than previous years (1980 and 2000). Shah et al. [59] used 50 validation points to assess the accuracy of their five classified maps for 1979, 1989, 1999, 2009, and 2019. They reported an overall accuracy of 90.5%, 91.13%, 95.32%, 94.44%, and 95.1% and kappa value of 0.90, 0.92, 0.94, 0.92, and 0.93 for the years, respectively. In their second study of 2021, Shah et al. (2021b) reported that they achieved an overall accuracy of above 90% and a kappa coefficient of around 0.90 for all satellite images used in their previous research. Imran and Din [50] used OBIA and reported overall accuracy of 92.180%, a kappa coefficient of 0.914, the producer’s accuracy of 92.70%, and the user’s accuracy of 91.17%, using 179 ground validation samples. The study by Gilani et al. [83] reported overall accuracies and kappa coefficient values, as shown in Table 2. It can be observed that better accuracies were achieved using a machine-learning algorithm (RF) for more recent years. In the last study reviewed, Zafar et al. [90] used 30 ground validation samples to achieve an overall accuracy of 92.3% for all yearly classified maps they produced between 2008–2017.
It is important to note that the studies that used the unsupervised image classification method in the pre-2010 period reported no image classification accuracies. Among all 73 reviewed papers, only one post-2010 study reported accuracy assessments by Ali and Nayyar [99], who used various vegetation and other indexes to map mangrove and non-mangrove areas. They noted that the overall accuracy of newly developed Landsat 8 indexes and other indexes remained >95.8%, while the kappa coefficient was around 0.851.

7. Discussion

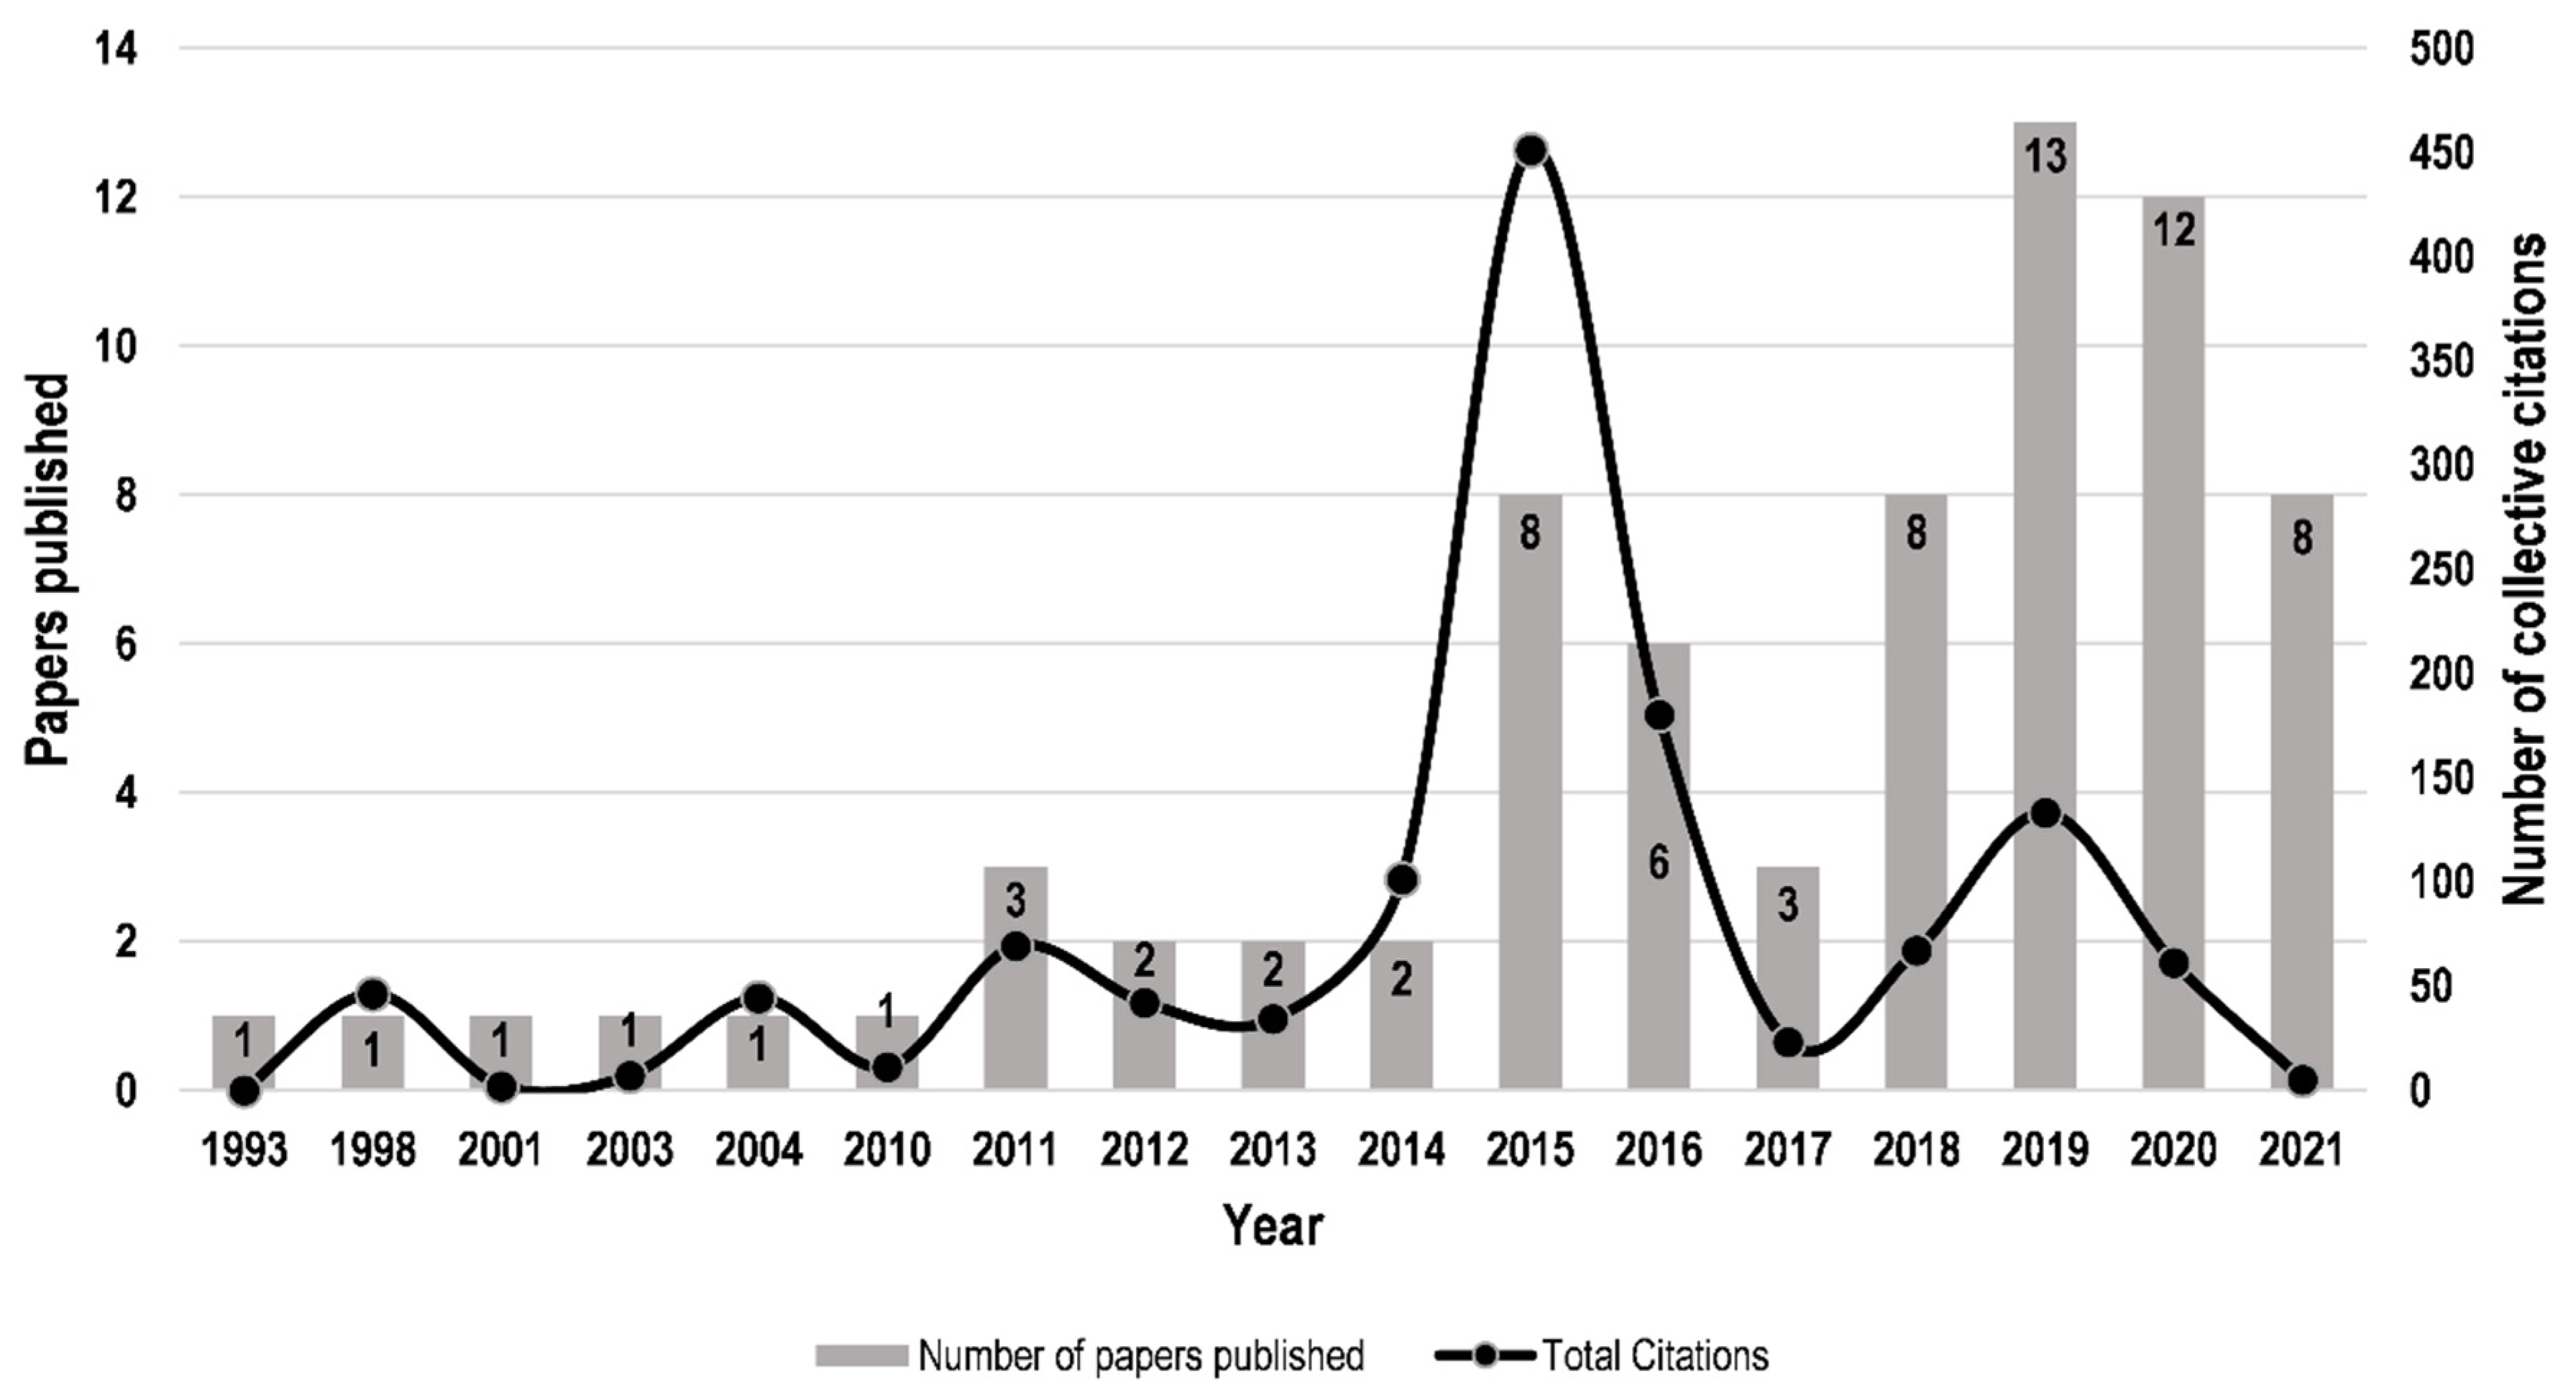
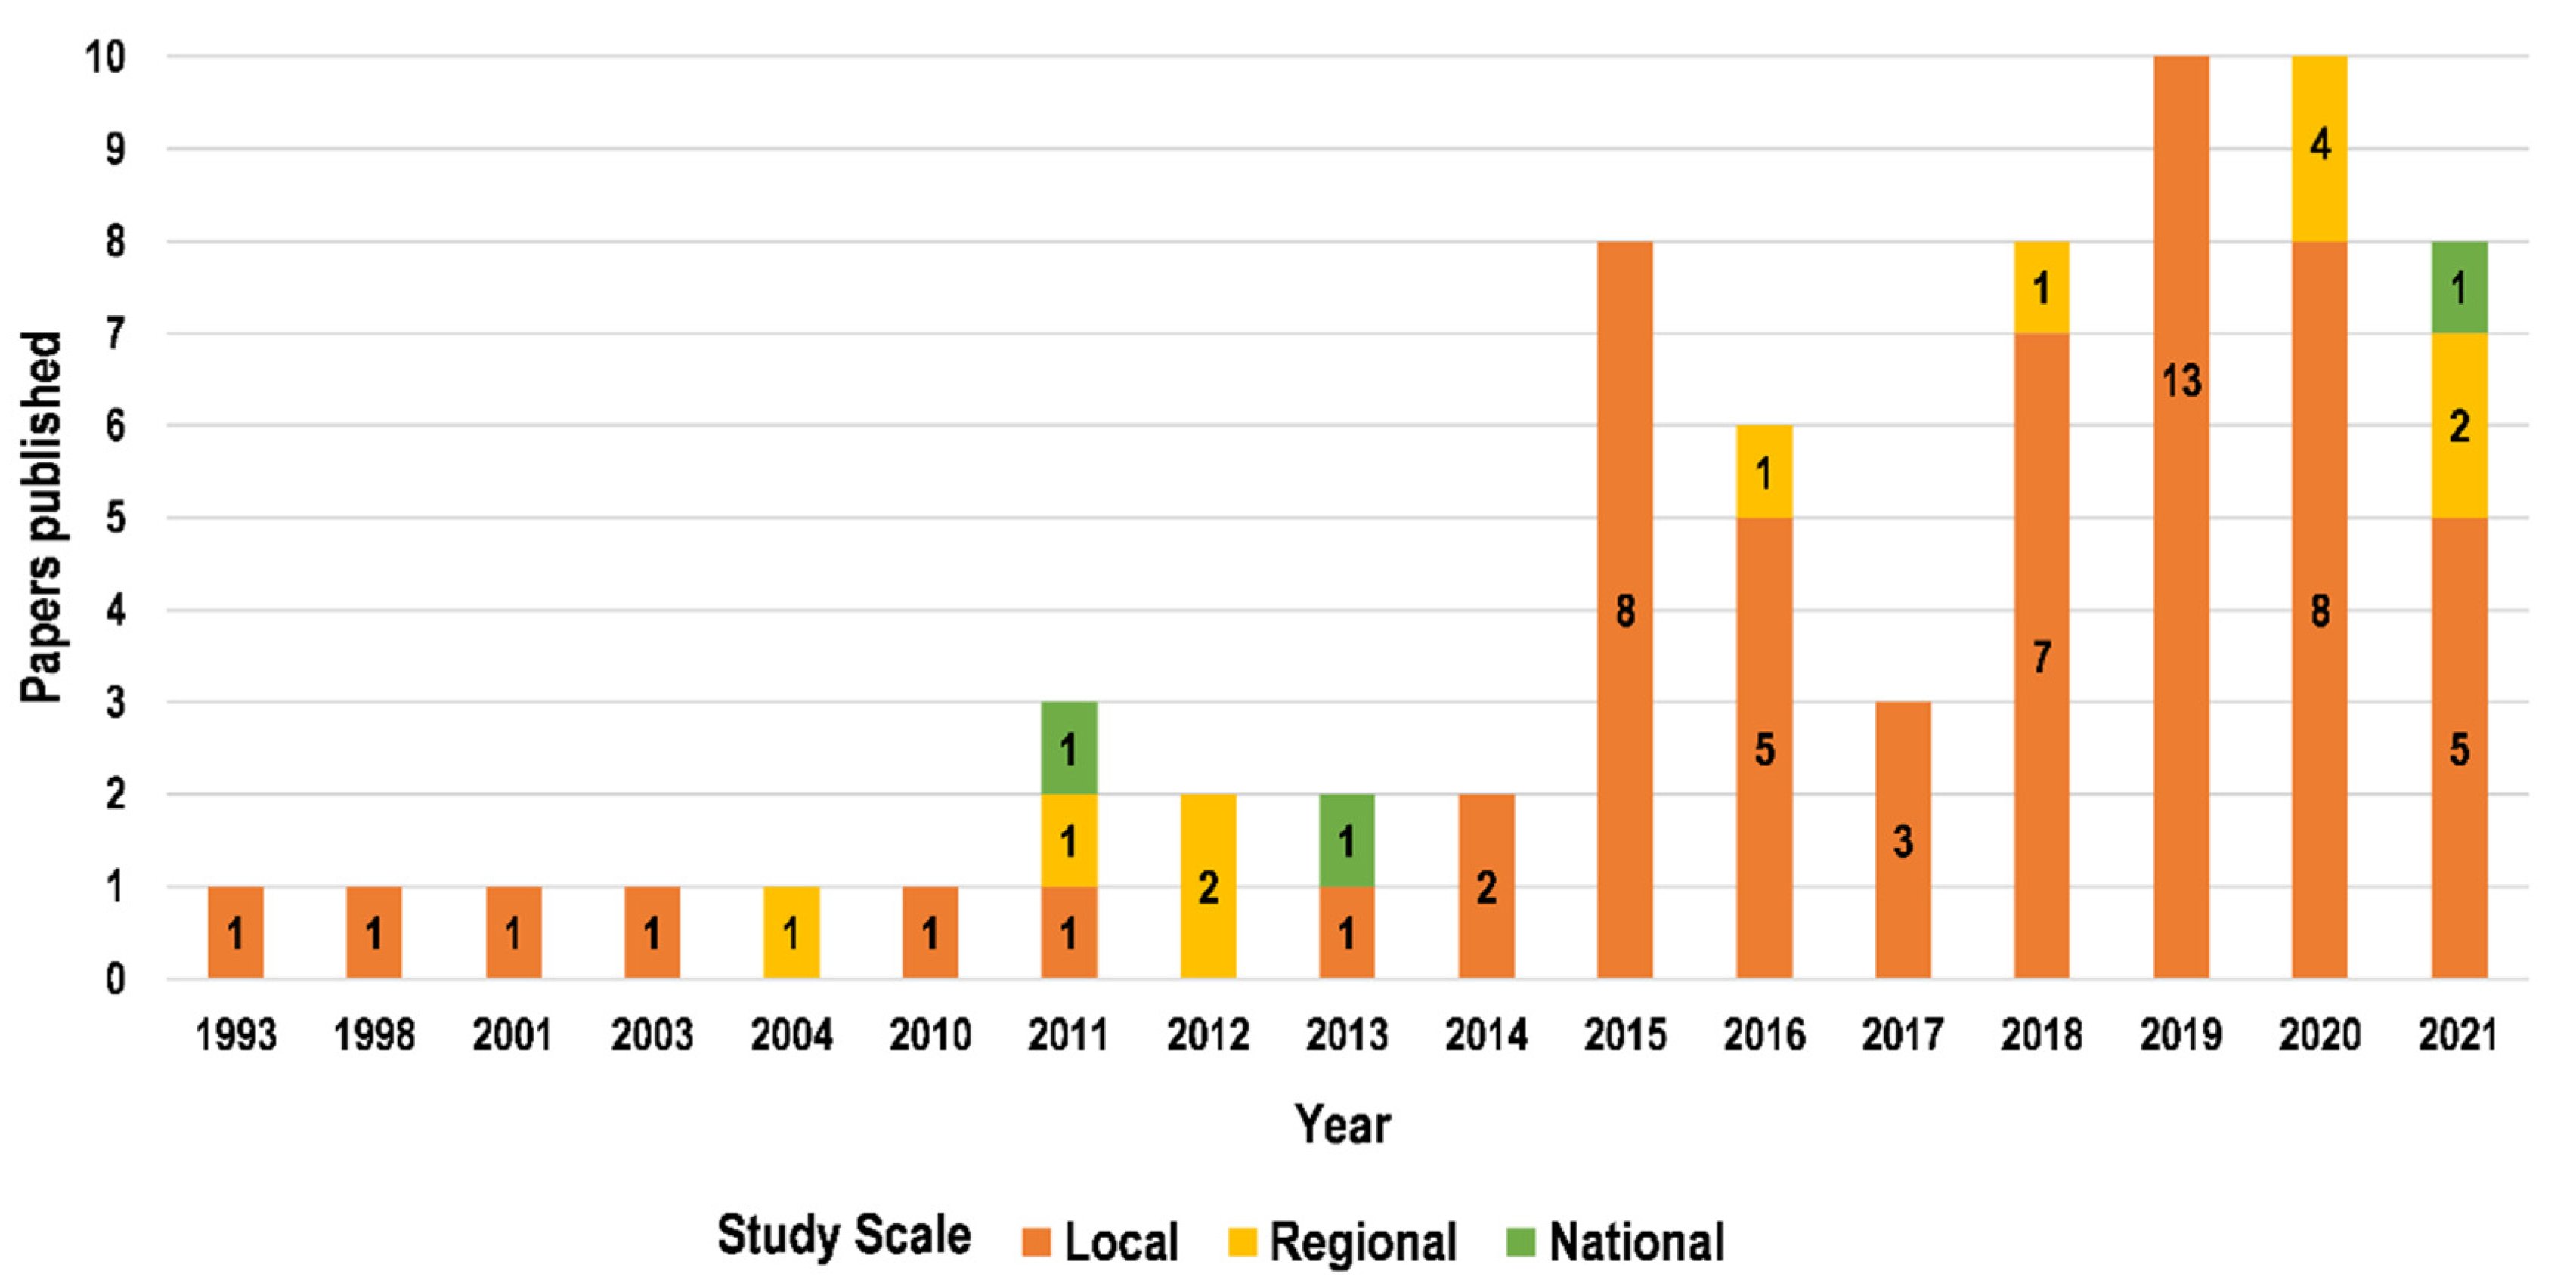
7.1. Citations’ vs. Publications’ Frequency

The citation is not the only important indicator of the quality of the research papers. Figure 4 presents the collective number of citations of the total number of articles published in the same year. It can be observed that a mixed trend of total citations is present even though the total number of published papers is in an increasing trend between 1993–2021. The articles published in 2015 reached the maximum number of collective citations, of 451, followed by the second-best of 133 in 2019. In contrast, the maximum number of 13 articles was published in 2019, followed by the second-best of 12 in 2020. The citations gained an increasing trend between 2004–2015 and a declining trend in the following year.

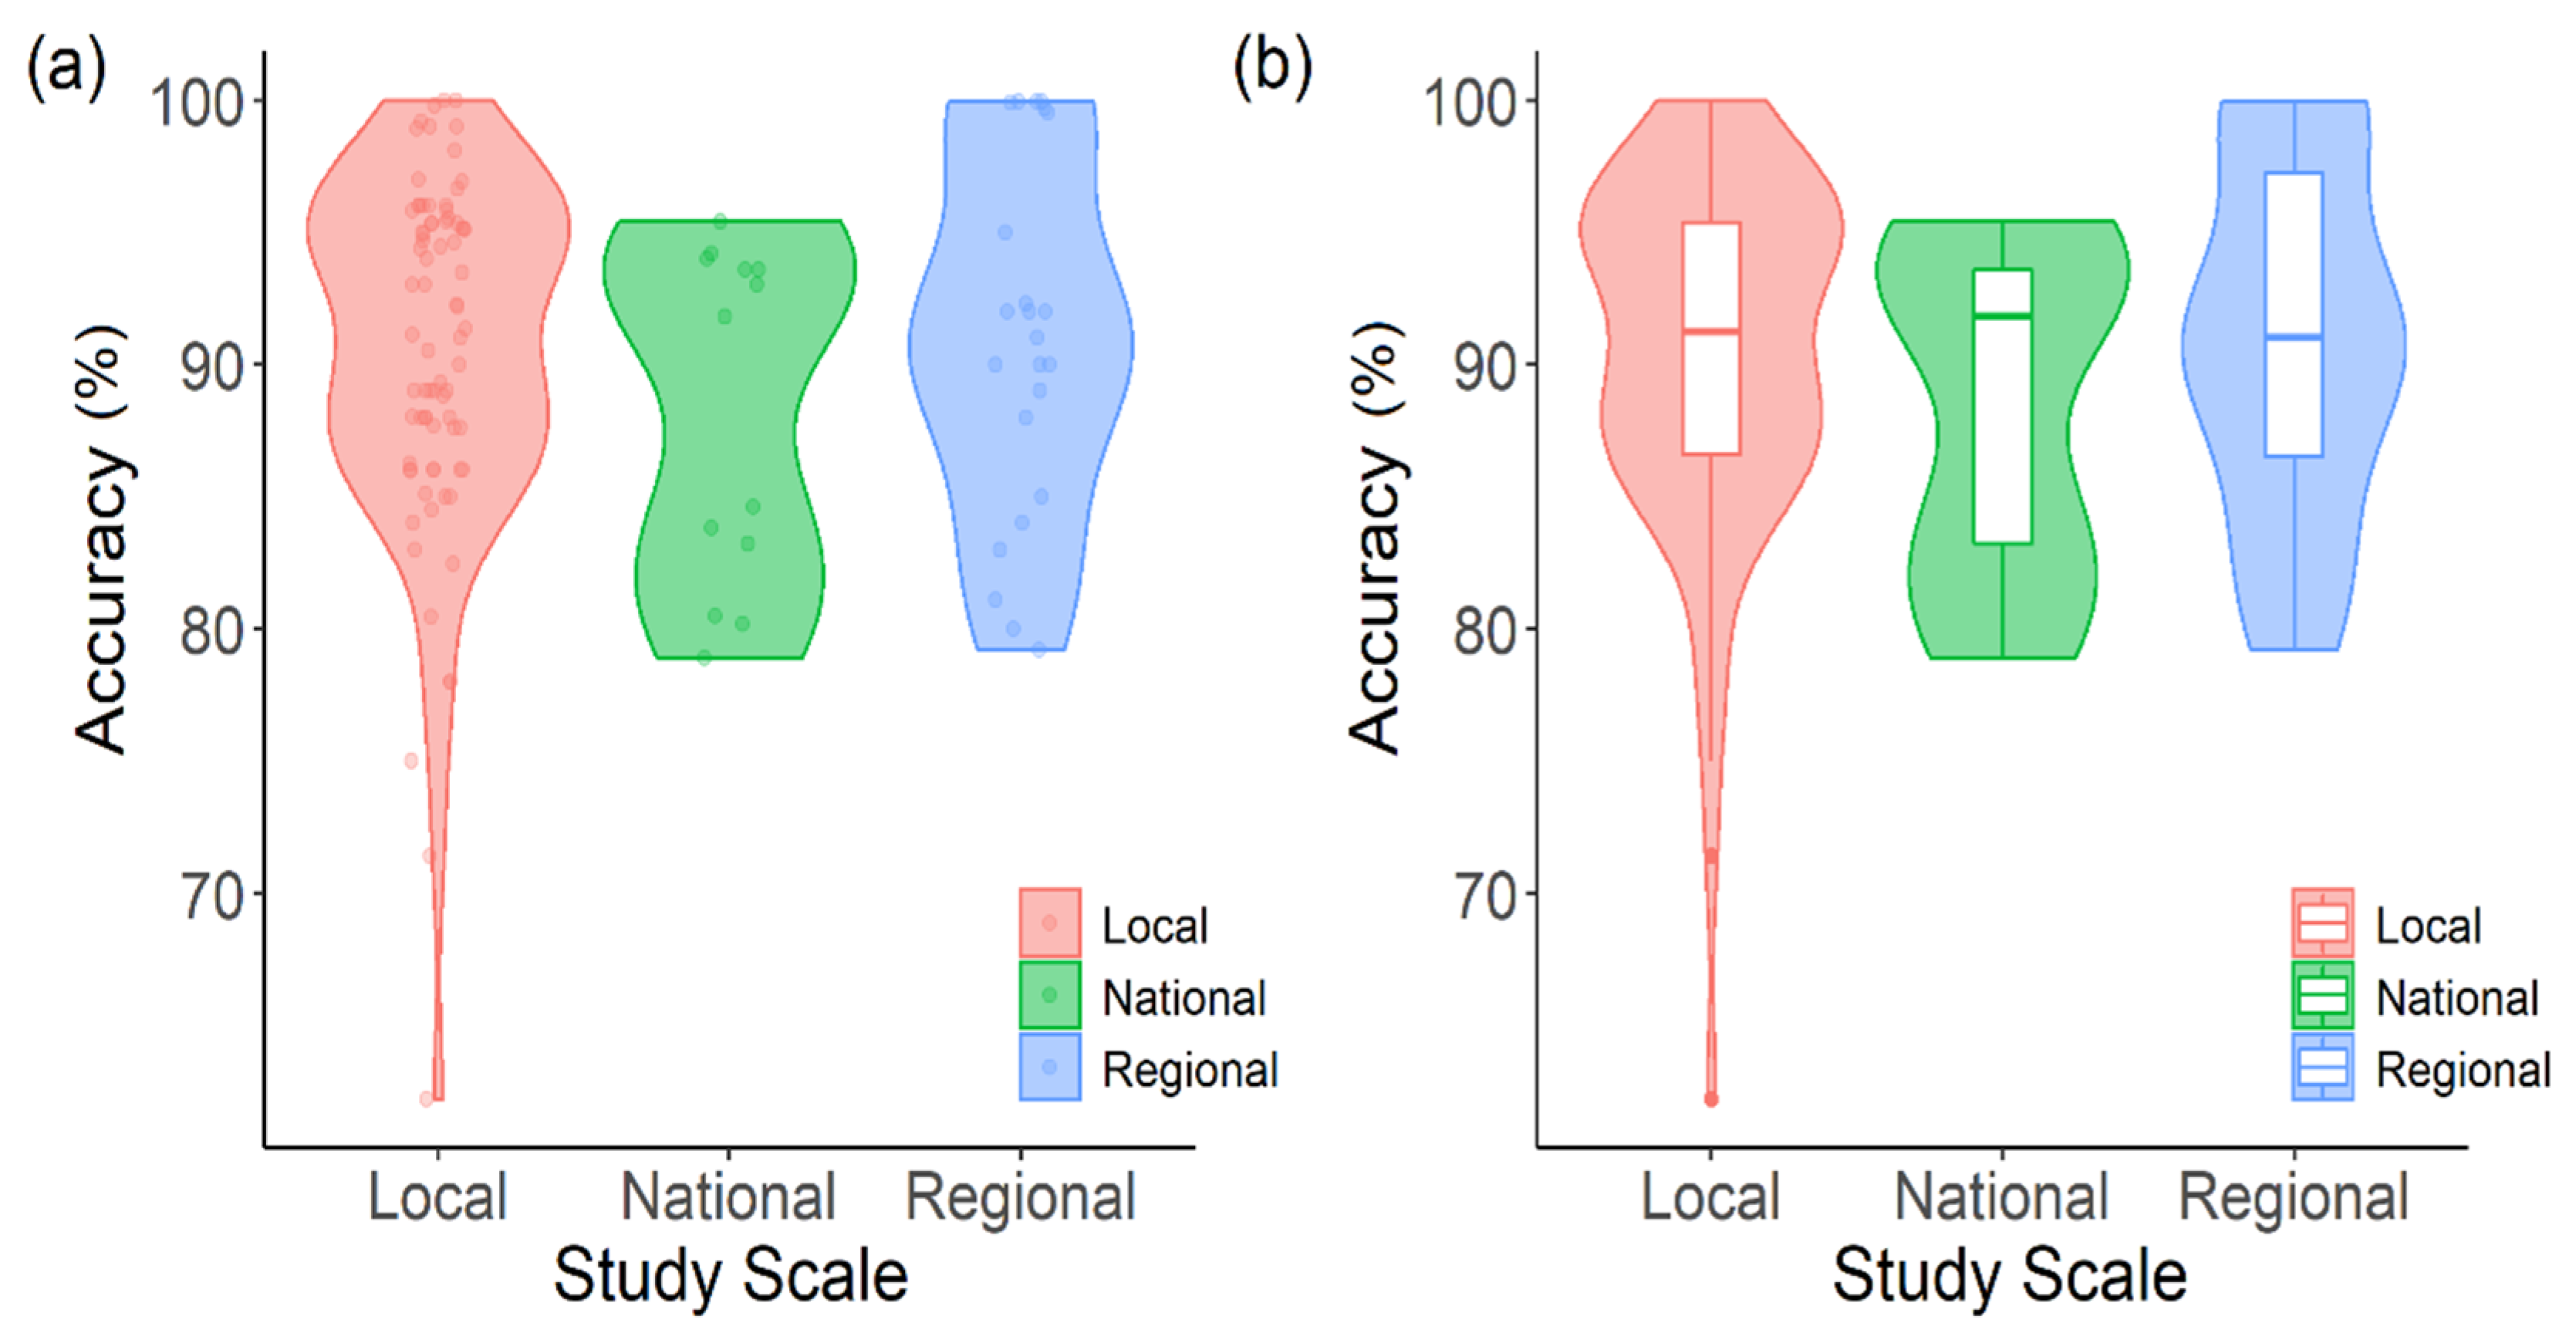
7.2. Study Scales and Accuracy Comparison

All reviewed papers were divided into three spatial scales based on their administrative properties. In Pakistan, the administrative units from smaller to larger spatial scale include national, provincial, division, district, and so on. By local-scale studies, we referred to that study as spatially confined to any single district of Pakistan; by regional-scale, we referred to any research that was performed in more than one district division in Pakistan; and by national scale, we referred to a study that mapped any single forest type that could be present in any location all over Pakistan, geographically.
About 80% of studies were performed on a local scale, while about 16% were performed on a regional scale. The rest of the studies, only three, were conducted on a national scale (Figure 5). It can be observed that the pre-2010 studies were very few in number and were mostly done on the local scale, while only one of these studies was conducted on the regional scale. The post-2010 period, especially the recent years of 2019 and onwards, has seen a boom in research publications on forest assessment using remote sensing. In 2021, five local scales, two regional scales, and one national scale have already been published, showing a boosting trend in studies that include spatial forest assessments.
An interesting comparison of achieved overall accuracies against study scales was performed (Figure 6a,b). Figure 6a shows the distribution of the overall accuracies of each study against local, regional, and national study scales. It can be noted that the majority of the studies achieved overall accuracy in the range of 88%–95% on a local scale, 82%–95% on a national scale, and 89%–92% on a regional scale. The minimum accuracy achieved was 62.22% on a local scale study, 79.20% on a regional scale study, 78.9% on a national scale study, and maximum accuracy achieved was 100% on a local scale study, 99.96% on a regional scale study, and 95.40% on a national scale study (Figure 6b). The mean accuracy achieved was 90.52%, 90.98%, and 88.22% for local, regional, and national scale studies.

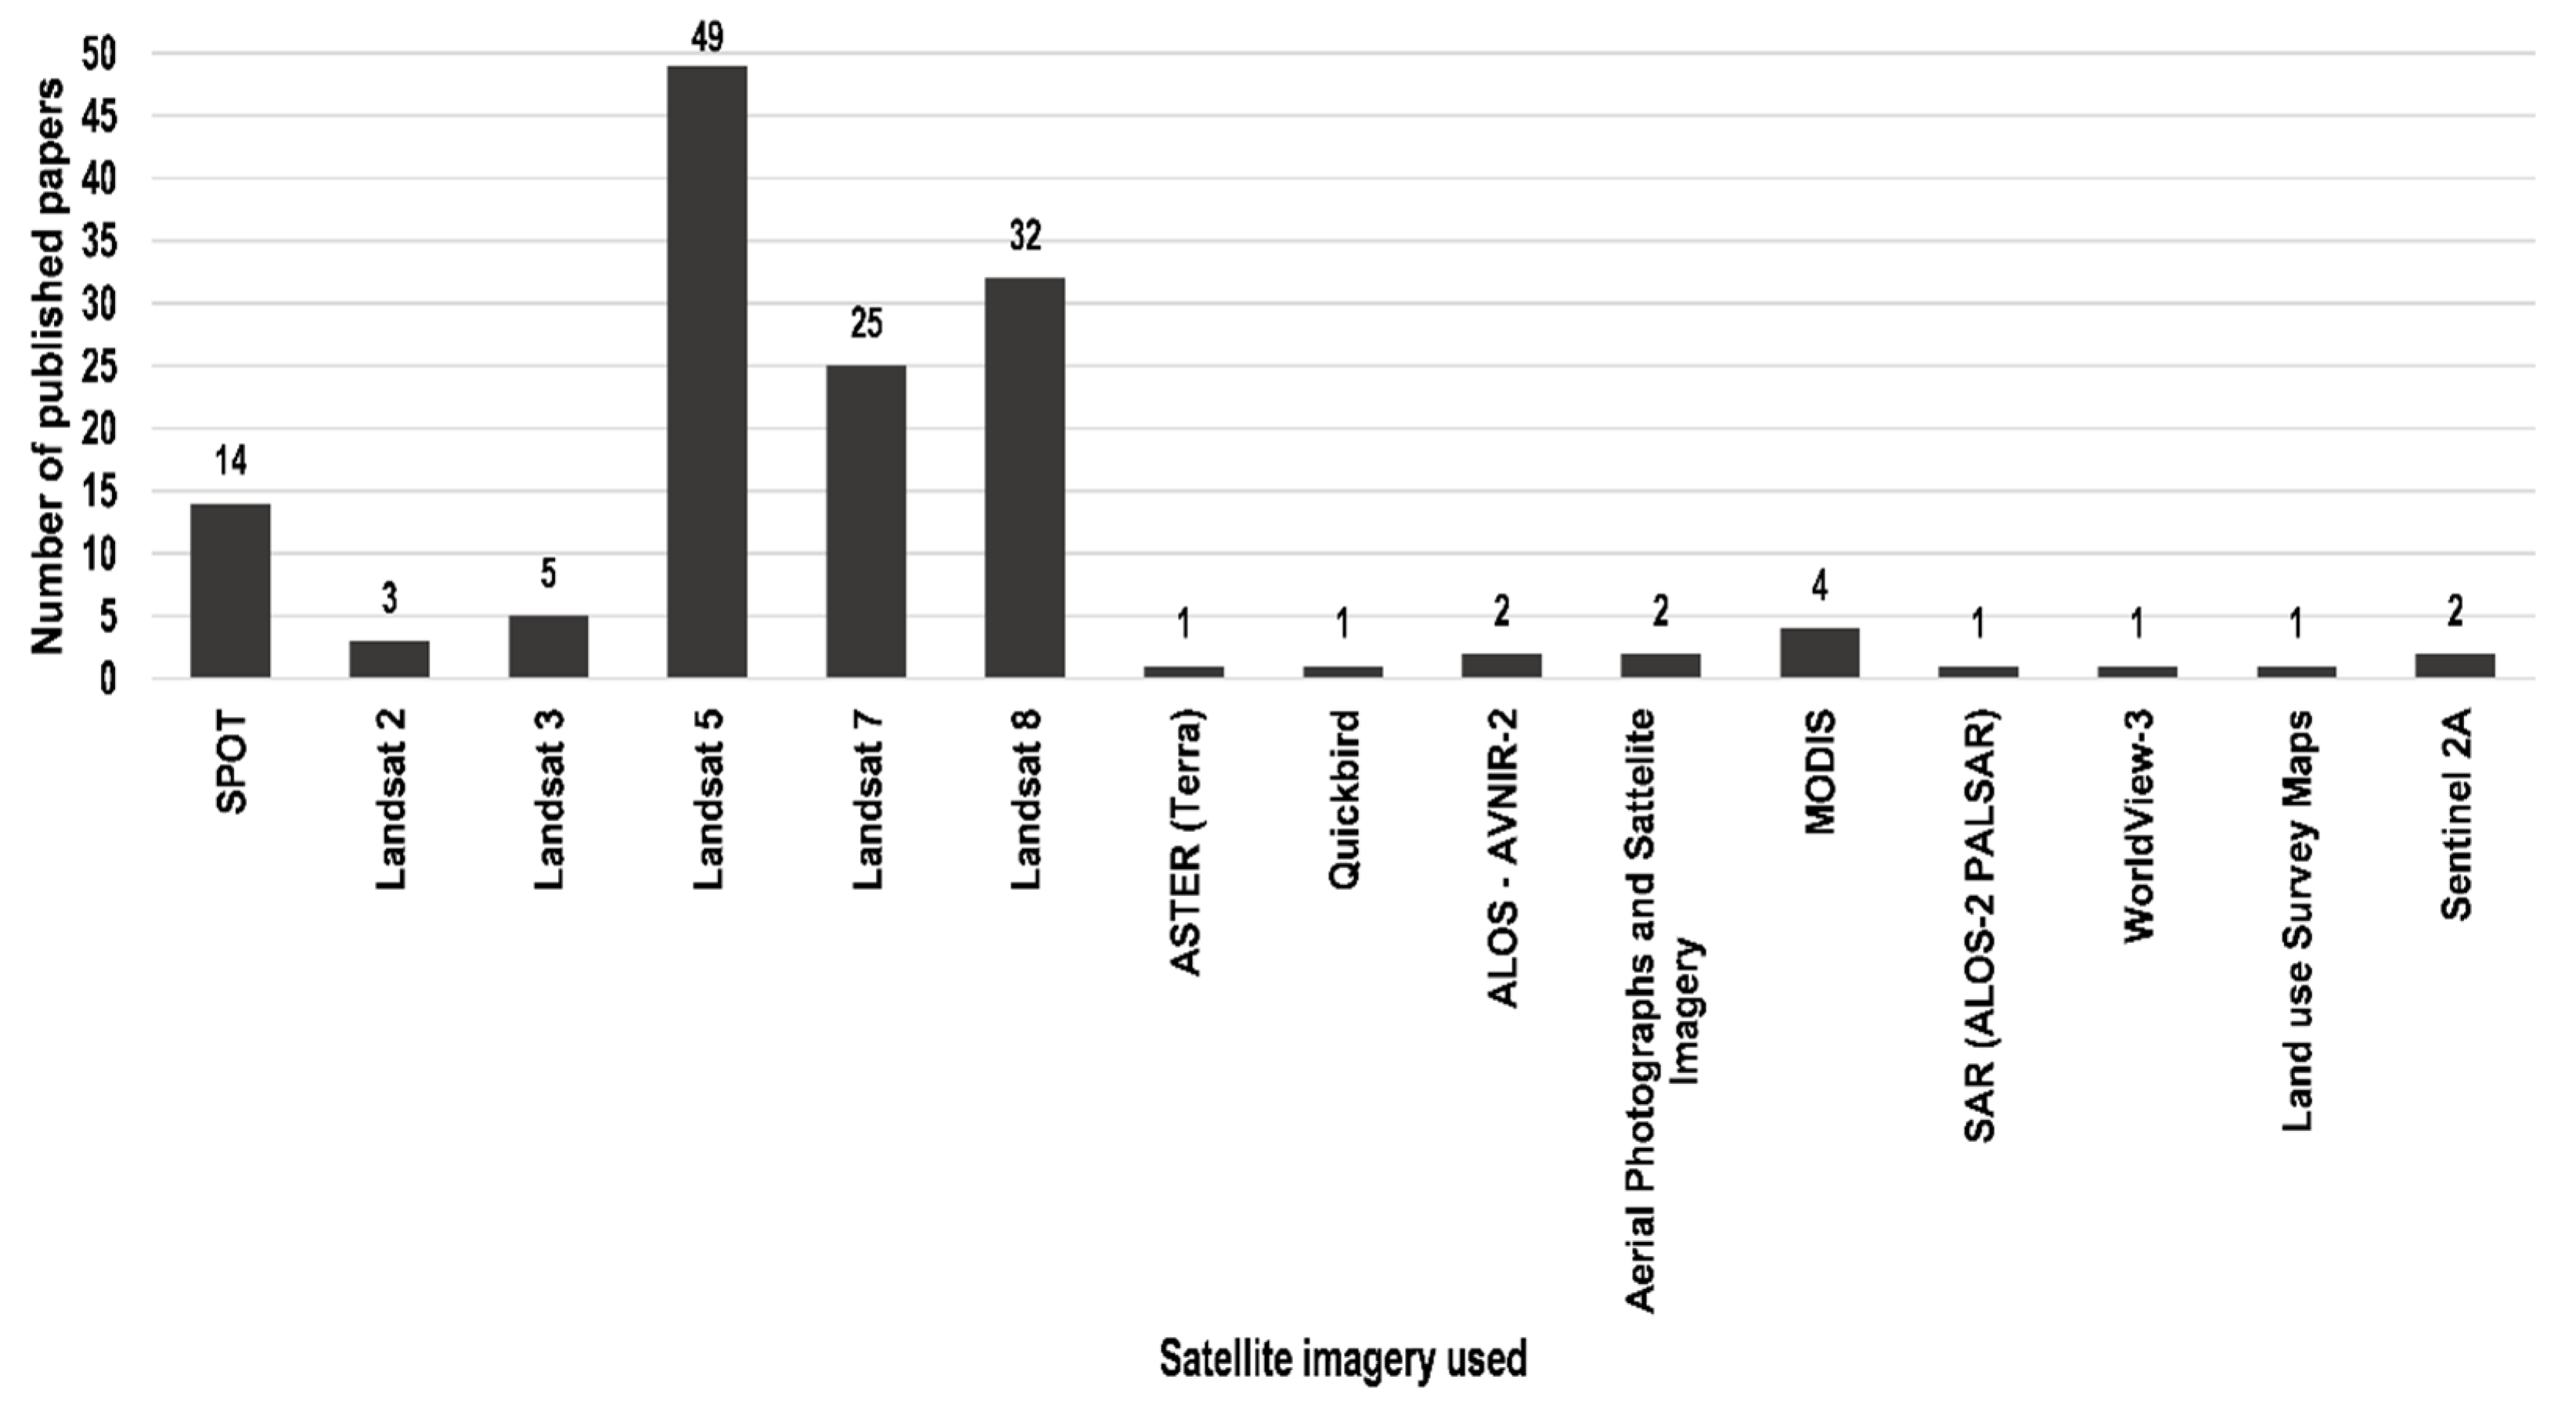
7.3. Remotely Sensed Data

Landsat is the oldest imagery mission in the history of optical remote sensing and is a moderate resolution satellite. Landsat 5 was the most frequently used satellite data by the researchers to map forests in different areas of Pakistan (Figure 7). In most of the studies, more than one satellite imagery was used. Landsat series (2, 3, 5, 7, and 8) imageries were used 114 times for mapping forests in Pakistan. The most frequently used very-high-resolution satellite data were of SPOT, used 14 times, along with other high-resolution satellite images including QuickBird (one time), ALOS – AVNIR-2 (two times), aerial photographs (two times), and WorldView-3 (one time). Sentinel data that became publicly available around 2015 and ASTER data are moderate- to high-resolution satellite images and were used two times and one time, respectively. The Low-resolution MODIS data products were used four times, while SAR data were used only once.

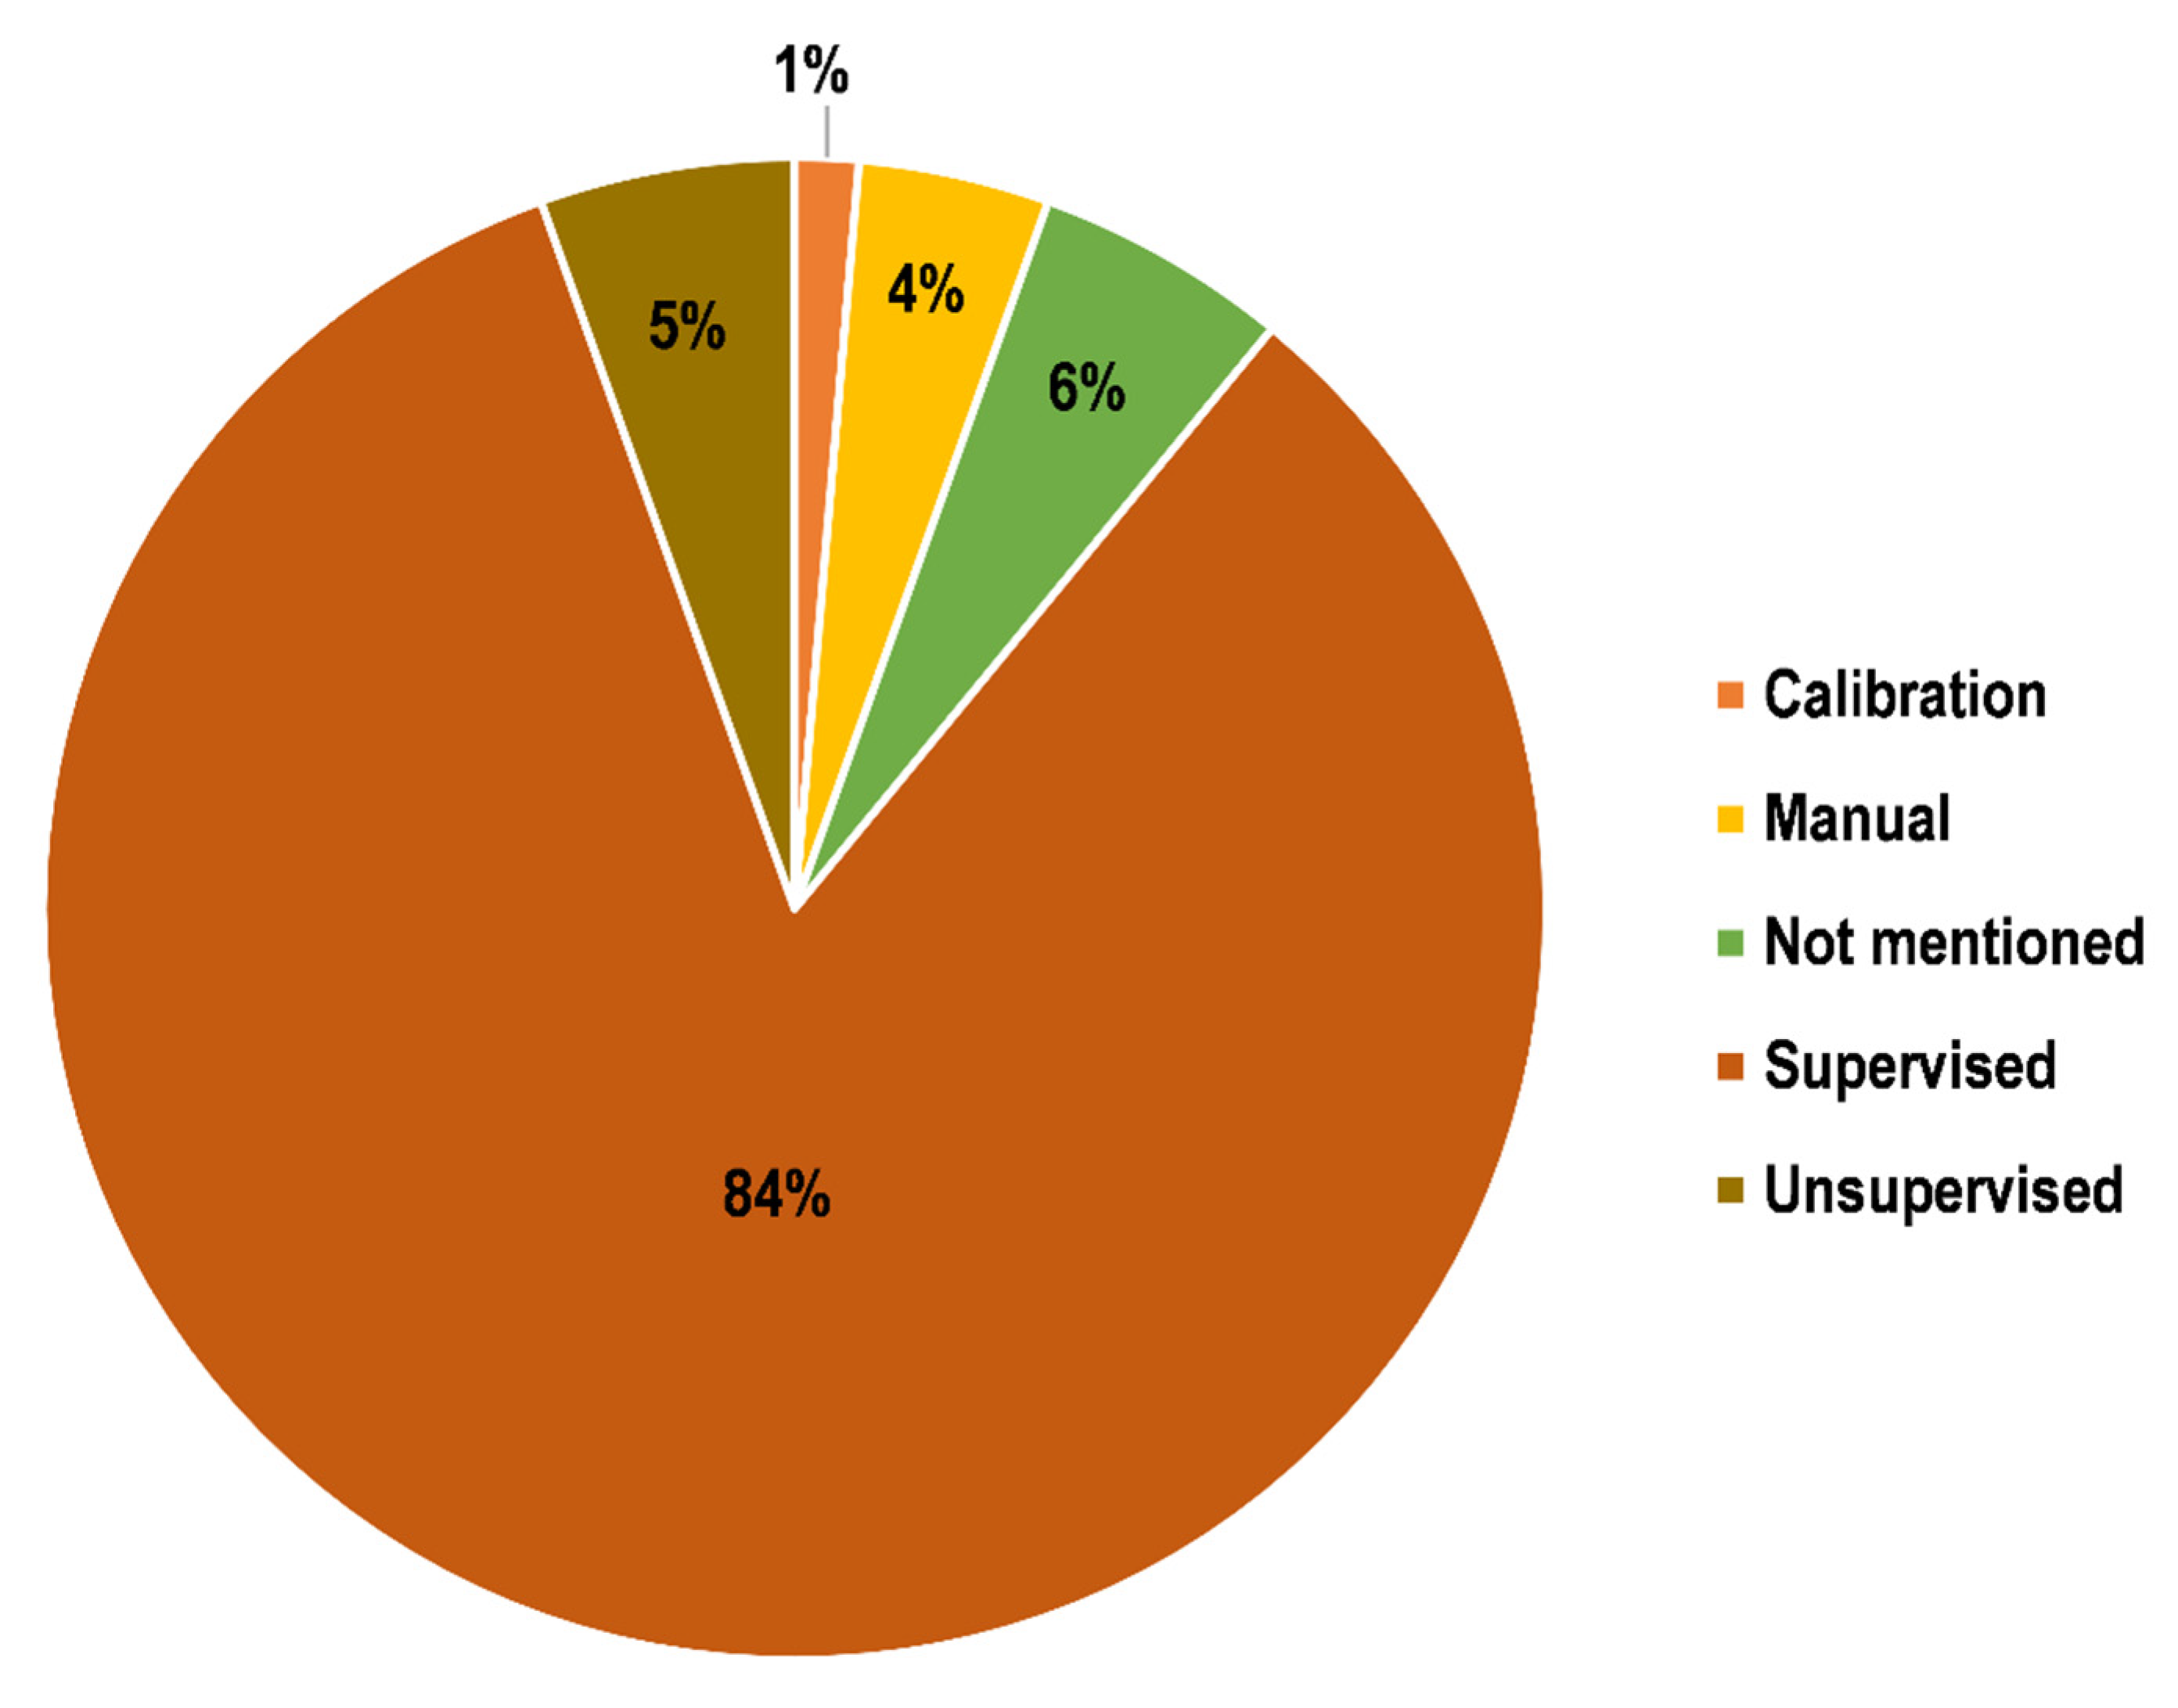
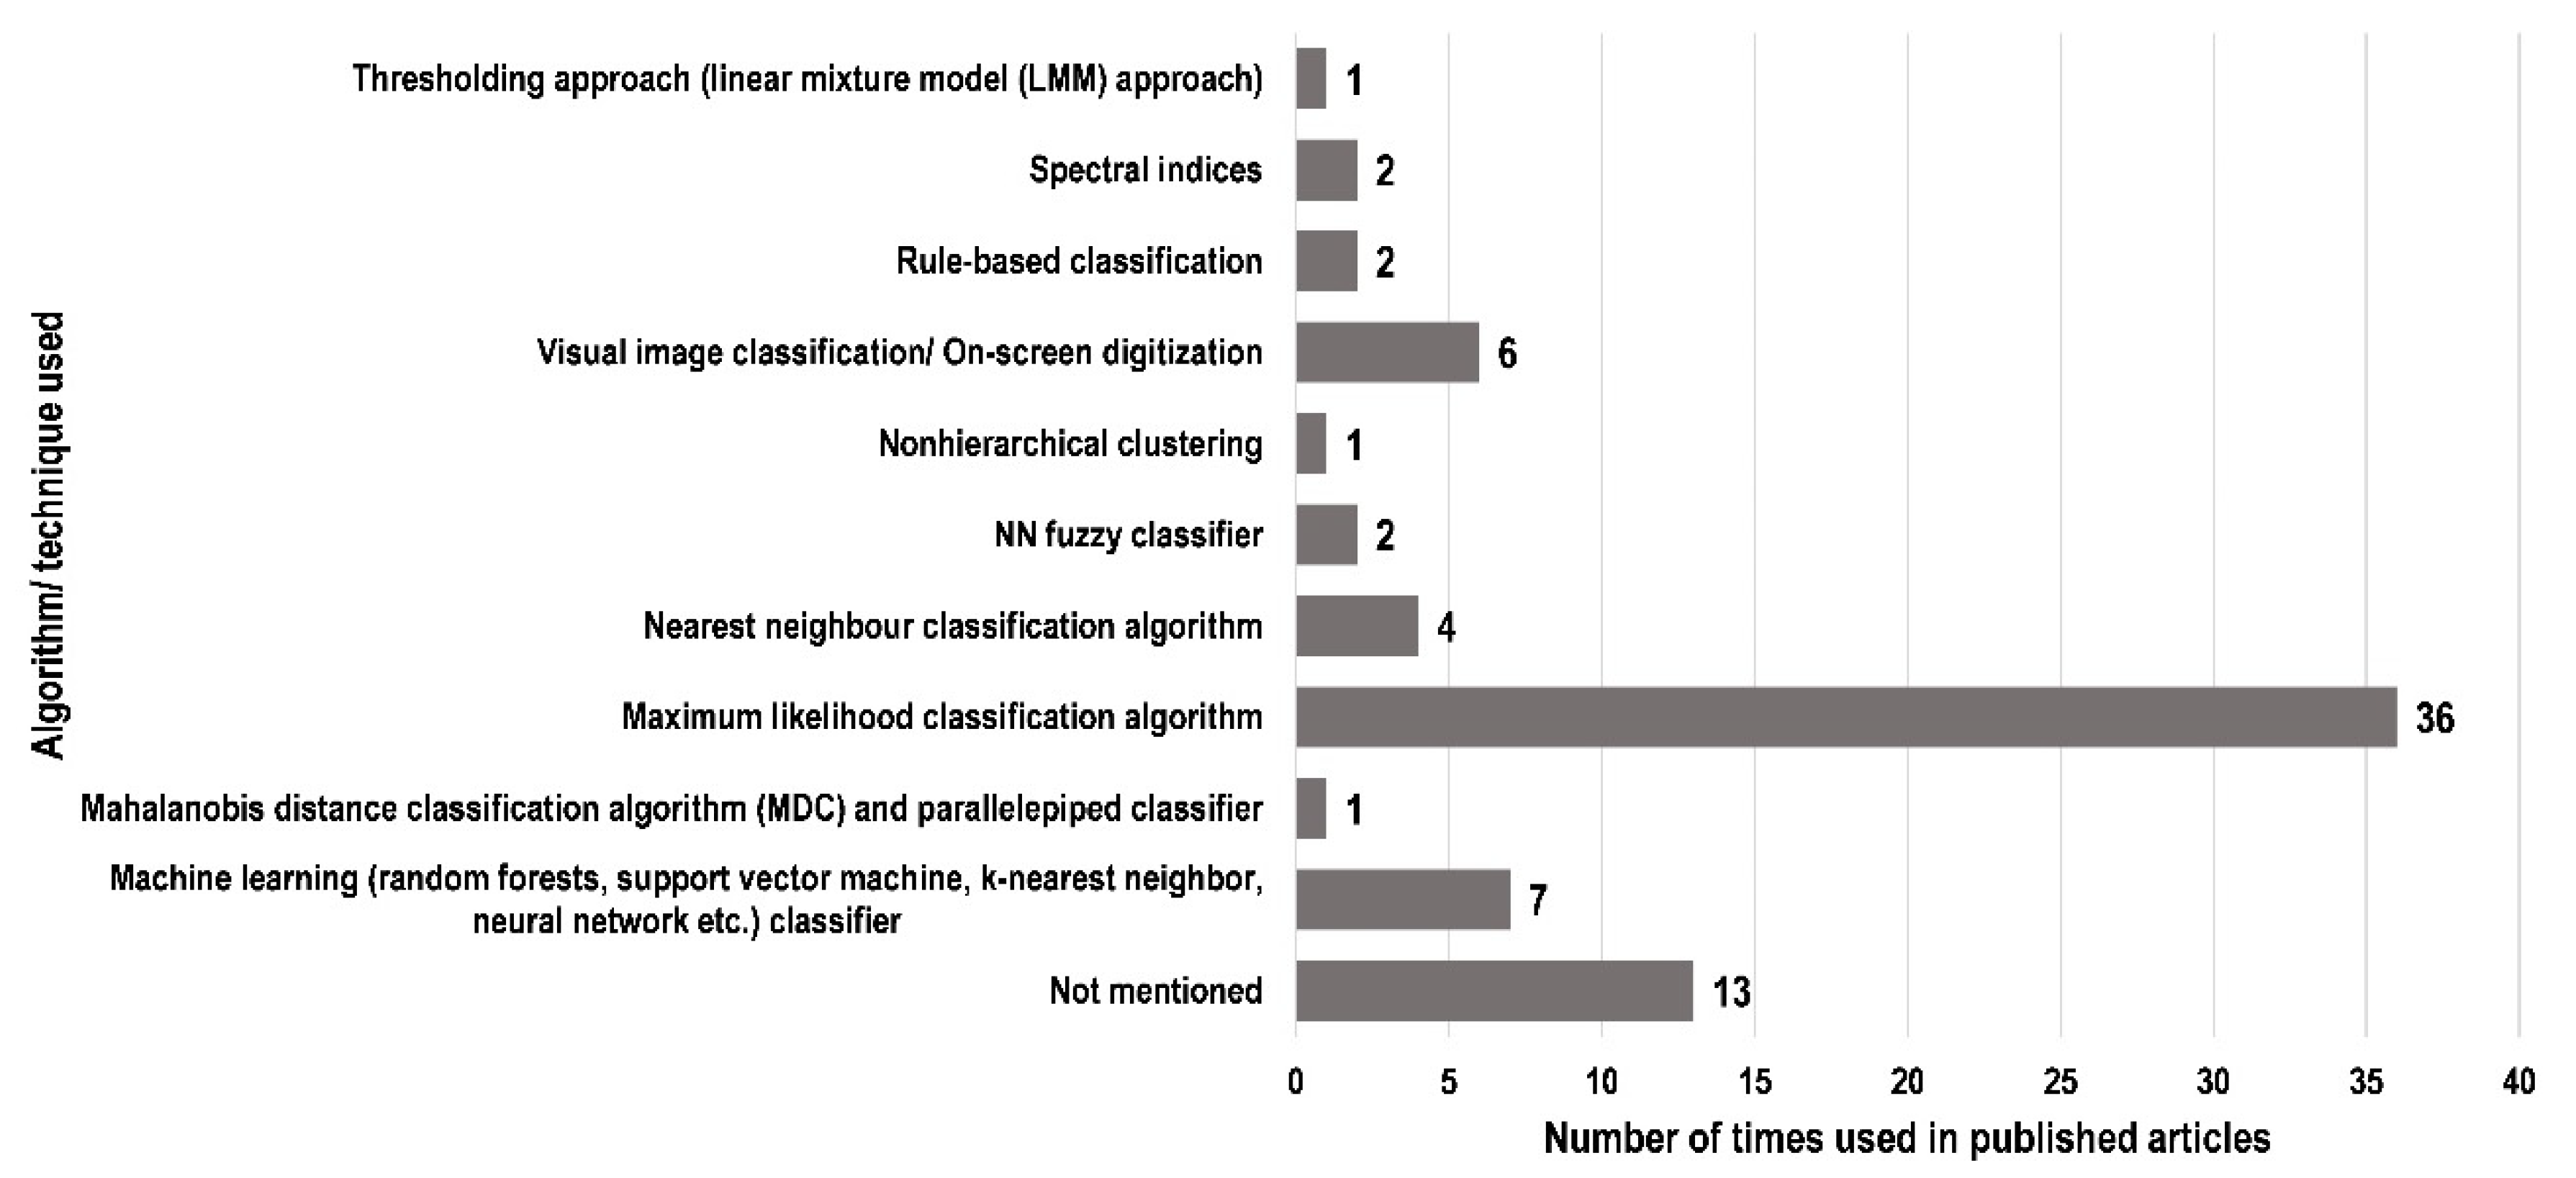
7.4. Classification Algorithms

Not all studies mentioned which image classification algorithm they used. The maximum likelihood classifier seemed to be the most trusted and reliable image classifier used by most researchers, 36 (Figure 8), to map forest/land use and land cover in Pakistan. This algorithm works on the principle that class signatures are normally distributed and uses classes’ multivariate probability density function [104]. Various machine learning algorithms were used by seven studies, including RF, SVM, NN, etc. These algorithms learn better as they are exposed to more data and fed by correct training samples. On the third number, six studies used the manual method of digitizing land use and land cover for extracting forests in different areas of Pakistan.

7.5. Forest Types

The locations of the forest studies in Pakistan were overlaid onto the global ecoregions’ map produced by Dinerstein et al. [105], and eight forested ecoregions were identified, on which the reviewed studies were conducted. Most of the reviewed studies (29%) were conducted in the Western Himalayan subalpine conifer forests, and the fewest studies (5%) were conducted in the Karakoram-West Tibetan Plateau alpine steppe (Figure 9). A comprehensive overview of studies in each forest ecoregion is discussed in the following subsections.

7.5.1. Aravalli West Thorn Scrub Forests

In this forest ecoregion, eight studies were conducted [33,65,66,75,84,87,96,97]. Almost all studies in this forest ecoregion type used the maximum likelihood image classification algorithm for forest classification. The only study by Baig et al. [87] used active remote sensing (SAR) data for forest classification. Another study by Shafique et al. [66] used vegetation indices to classify forest cover incorporating unsupervised image classification. All studies in this forest ecoregion reported a forest decline, except two studies [65,97] that reported an overall increase in the forest cover.

7.5.2. Baluchistan Xeric Woodlands

In this forest ecoregion, only two studies were conducted [90,93]. Both studies reported an overall increase in the forest area. One study used the supervised image classification method [90], while the second used the MODIS land cover product [93].

7.5.3. Himalayan Subtropical Pine Forests

In this forest ecoregion, 11 studies were conducted [29,30,51,52,54,55,63,64,85,92,98]. Two studies from the Himalayan subtropical pine forests’ ecoregion reported an increase in the forest area [29,92], and all other studies reported a decline in the overall forest area. Most studies used pixel-based image classification techniques, while only one study [63] used OBIA.

7.5.4. Indus River Delta-Arabian Sea Mangroves

In this forest ecoregion, eight studies were conducted [32,74,76,77,81,83,99,102]. The studies reported an increase in the mangroves’ forest area in the coastal belt of Pakistan and the Indus delta. Only one study [77] reported a decline in the riverine forest of the Thatta district of Sindh province. Two studies [81,102] used OBIA for image classification, while all others used pixel-based image classification techniques.

7.5.5. Karakoram-West Tibetan Plateau Alpine Steppe

In this forest ecoregion, four studies were conducted [42,49,50,101]. Out of these studies, one study used OBIA [50], and all others used pixel-based image analysis. One study [101] reported an increase in the forest cover, one reported [42] a decreasing trend, and two studies did not perform change analysis.

7.5.6. Mixed Forests

In this forest ecoregion, five studies were conducted [62,78,79,80,103]. These studies were performed in a relatively larger region than other studies, which is why they fall under two or more forest ecoregions. These studies lie in the Himalayan subtropical pine forests, Western Himalayan broadleaf forests, Karakoram-West Tibetan Plateau alpine steppe, and Western Himalayan subalpine conifer forests ecoregions. All studies reported a temporal decline in forest cover, except one study [79], which did not perform a change assessment. All of these studies used pixel-based image analysis for forest cover classification.

7.5.7. Northwestern Himalayan Alpine Shrub and Meadows

In this forest ecoregion, six studies were conducted [40,41,43,71,72,86]. An overall forest declination trend was reported by all studies except one [72], which did not perform change analysis. These studies used a pixel-based image classification method and a maximum likelihood classifier for forest cover extraction.

7.5.8. Western Himalayan Broadleaf Forests

In this forest ecoregion, eight studies were conducted [31,34,35,36,37,38,39,61]. Two studies [35,39] reported an increasing trend of forest cover, three reported a declining trend [31,38,61], and the remaining studies did not report forest change evaluation. Two studies [34,37] utilized OBIA for forest cover assessment, and all others used the pixel-based image classification method.

7.5.9. Western Himalayan Subalpine Conifer Forests

In this forest ecoregion, 21 studies were conducted [44,45,46,47,48,53,56,57,58,59,60,67,68,70,73,88,89,91,94,95,100]. This is the forest ecoregion in which the largest number of studies were conducted. Almost all studies reported forest declination trends, except two studies [45,80], which reported an overall increase in forest cover. Out of all these studies, two [47,94] did not perform forest change assessment. Among these studies, two [60,94] used OBIA, two [67,68] used manual assessments, and the remaining studies used a pixel-based satellite image classification method to assess forest cover.

7.6. Evolution of Forest Mapping and Forest Change Assessment in Pakistan

The pre-2010 period was very inconsistent as only six papers were published with gaps (1993, 1998, 2001, 2003, 2004, and 2010), each in a different year. In contrast, in the post-2010 period, each year produced studies of forest mapping using remote sensing with an average of around six papers per year. Furthermore, the recent years of 2019, 2020, and 2021, so far, have produced the most papers using the latest techniques compared to the previous eight years combined. Out of all 73 reviewed papers, 61 worked on forest change assessment (Table 3). Only one paper out of these 61 articles did not report statistics of forest change. Of the 60 papers that reported forest change assessment, 13 assessed an overall forest appraisal (mainly in the mangrove forests), while 47 papers reported forest decline in various study areas.

8. Limitations and Challenges for Forest Mapping

Pakistan has not yet produced any national-level landcover studies in a peer-reviewed article for international reporting. Landcover mapping is an essential component for a country’s forest cover reporting. According to [106], only one national-scale forest inventory study was produced in Pakistan without using remote sensing in 1992, and only KP province has more inclusive data than the other provinces in Pakistan. Under the REDD+ initiative, United Nations Framework Convention on Climate Change (UNFCCC), each country needs to report baseline forest data, and Pakistan has not produced allometric equations of all notable species in Pakistan yet [106]. Landsat archive imageries provide an excellent opportunity to explore forest resources at national, regional, or local spatial scales. A higher spatial resolution satellite, Sentinel, launched in 2014, also makes it possible to map forests at better accuracies. The introduction of cloud-based platforms like Google Earth Engine, an excellent and invaluable resource cloud-computing services [107], solves the issue of computing a large number of satellite imageries to map on a national-level scale. Even the latest news of Microsoft’s Planetary Computer launching will also make it easy and convenient to map the ecosystems and forests and assess their spatial patterns and change [108]. Therefore, we cannot say that there is some severe limitation to map forests on national scales using freely available global resources.

9. Conclusions

The Landsat series (Landsat 2, 3, 5, 7, and 8) satellite imageries were most frequently used to map forests in Pakistan at various spatial scales. Very few studies used classification methods other than supervised image classification. The maximum likelihood classifier is a deep-rooted classifier that has been used by researchers for the past three decades and is also the most widely used in forest/land use and land cover mapping in Pakistan. However, recent studies are using and emphasizing machine learning classifiers (e.g., RF, SVM, NN, etc.). Among all the districts of Pakistan, most forest studies were conducted in ICT, the capital of Pakistan. Similarly, most studies were conducted in the Himalayan subtropical pine forests ecoregion. There is an overall increasing trend in the citation of forest studies and a rising trend in forest studies’ publications. Other than local-scale studies, the recent trend shows more studies are being conducted on regional and national scales. This is because of the introduction of mega cloud-computing platforms like Google Earth Engine, Microsoft’s Planetary Computer, etc., in the public domain. As far as the pre-and post-18th constitutional amendment period studies are concerned, the post-period showed a steep increase in publications. The possible reason could be provincial stakeholders’ interest in estimating and consequently managing forest ecosystems in their concerned regions.
Using high-resolution satellite data for accurate forest mapping is a limiting factor in Pakistan as very few studies used high-resolution images for this purpose. Improved and advanced remote sensing data, e.g., LiDAR, which has a unique ability to capture individual tree details and overall forest structure in a precise and accurate manner, Sentinel series, which provides an opportunity to use high-resolution (10-m) optical data for forest mapping free of cost, and hyperspectral imagery, which provides in-depth forest health monitoring, have revolutionized forest cover mapping. No study used LiDAR point-cloud or hyperspectral data for forest mapping in Pakistan, and only one study reported using SAR data. These active sensor data sets are being widely used worldwide to accurately and precisely map forests and calculate forest’s biophysical attributes. Processing these data sets requires expert skills and knowledge. It is essential to consider accurately using the latest data sets, tools, and techniques to map forests through the capacity building of the geospatial experts in Pakistan. This will also be very helpful for the ministry of climate in Pakistan, which is currently working on the United Nations REDD+ project implementation.

Supplementary Materials

The following are available online at https://0-www-mdpi-com.brum.beds.ac.uk/article/10.3390/f12091211/s1. Table S1: A catalog of 73 published studies between 1993 to 2021 (so far) on forest mapping using remotely sensed data in Pakistan. Table S2: A database of methodology, accuracy, LULC classes, classification techniques, algorithms, and forest change statistics published in 73 published articles (1993–2021) for forest mapping in Pakistan using remotely sensed data.

Author Contributions

Conceptualization, A.A., S.R.A., A.T. and H.G.; methodology, A.A., A.T.; software, A.A., A.T.; validation, A.A., A.T. and H.G.; formal analysis, A.A.; investigation, A.T., A.A., S.R.A., R.W.A. and H.G.; resources, A.T., H.G. and S.R.A.; data curation, A.A., A.T.; writing—original draft preparation, A.T., A.A., S.R.A., R.W.A. and H.G.; writing—review and editing, A.T., A.A., S.R.A., R.W.A., F.M. and H.G.; visualization, A.A., A.T. and H.G.; supervision, A.T. and H.G.; project administration, A.T., N.Z. and F.M.; funding acquisition, A.T. and N.Z. All authors have read and agreed to the published version of the manuscript.

Funding

This study was supported by National Natural Science Foundation of China (grant 42071374) and the program of Frontier Science of Chinese Academy of Sciences, grant number (ZDBS-LY-DQC005).

Data Availability Statement

The data sets generated and/or analyzed during the current study are not publicly available due to legal constraints because they are owned by different institutions, but are available from the authors on reasonable request.

Acknowledgments

We would like to express our thanks to the management of the Institute of Space Technology (IST), College of Earth and Environmental Sciences (CEES), and Department of Geography, University of the Punjab, and State Key Laboratory of Information Engineering in Surveying, Mapping, and Remote Sensing, Wuhan University, Wuhan, China, for their support.

Conflicts of Interest

The authors declare no conflict of interest.

Abbreviations

The following abbreviations are used in this article:
AGBAboveground Biomass
AJKAzad Jammu & Kashmir
ALOSAdvanced Land Observation Satellite
ANPAyubia National Park
ASTERAdvanced Spaceborne Thermal Emission and Reflection Radiometer
AVNIR-2Advanced Visible and Near Infrared Radiometer type 2
CKNPCentral Karakoram National Park
CMRICombined Mangrove Recognition Index
ETMEnhanced Thematic Mapper
ETM+Enhanced Thematic Mapper Plus
EVIEnhanced Vegetation Index
FAOFood and Agriculture Organization
GBGilgit-Baltistan
GVMGlobal Land Vegetation Monitoring
HRVHigh-Resolution Visible
ICTIslamabad Capital Territory
IPCCIntergovernmental Panel on Climate Change
ISODATAInteractive Self Organizing Data Analysis
k-NNk-Nearest Neighbor
KPKhyber Pakhtunkhwa
LSMALinear Spectral Mixture Analysis
LULCLand-Use and Land Cover
MDCMahalanobis Distance Classification
MHNPMargallah Hills National Park
MOSISModerate Resolution Imaging Spectroradiometer
MSMicrosoft
MSSMulti-Spectral Scanner
NFINational Forest Inventory
NDMINormalized Difference Moisture Index
NDVINormalized Difference Vegetation Index
NNNeural Network
NWFPNorth Western Frontier Province
OBIAObject-Based Image Analysis
OLIOperational Land Imager
PCAPrincipal Component Analysis
PFIPakistan Forest Institute
REDD+Reducing Emissions from Deforestation and forest Degradation plus
RFRandom Forest
RVIRatio Vegetation Index
SARSynthetic Aperture Radar
SAVISoil Adjusted Vegetation Index
SPOTSatellite pour l’Observation de la Terre
SVMSupport Vector Machine
TIRSThermal Infrared Sensor
TMThematic Mapper
UNUnited Nations
UNFCCCUnited Nations Framework Convention on Climate Change

References

  1. Boyd, D.S.; Danson, F.M. Satellite remote sensing of forest resources: Three decades of research development. Prog. Phys. Geogr. 2005, 29, 1–26. [Google Scholar] [CrossRef]
  2. Miura, S.; Amacher, M.; Hofer, T.; San-Miguel-Ayanz, J.; Ernawati; Thackway, R. Protective functions and ecosystem services of global forests in the past quarter-century. For. Ecol. Manag. 2015, 352, 35–46. [Google Scholar] [CrossRef] [Green Version]
  3. Giri, C. Observation and monitoring of mangrove forests using remote sensing: Opportunities and challenges. Remote Sens. 2016, 8, 783. [Google Scholar] [CrossRef] [Green Version]
  4. Birdsey, R.; Pan, Y. Trends in management of the world’s forests and impacts on carbon stocks. For. Ecol. Manag. 2015, 355, 83–90. [Google Scholar] [CrossRef]
  5. Tian, X.; Sohngen, B.; Kim, J.B.; Ohrel, S.; Cole, J. Global climate change impacts on forests and markets. Environ. Res. Lett. 2016, 11, 1–10. [Google Scholar] [CrossRef]
  6. Liang, J.; Crowther, T.W.; Picard, N.; Wiser, S.; Zhou, M.; Alberti, G.; Schulze, E.D.; McGuire, A.D.; Bozzato, F.; Pretzsch, H.; et al. Positive biodiversity-productivity relationship predominant in global forests. Science 2016, 354, 6309. [Google Scholar] [CrossRef] [PubMed] [Green Version]
  7. Yin, H.; Khamzina, A.; Pflugmacher, D.; Martius, C. Forest cover mapping in post-Soviet Central Asia using multi-resolution remote sensing imagery. Sci. Rep. 2017, 7, 1–11. [Google Scholar] [CrossRef] [Green Version]
  8. Grabska, E.; Hostert, P.; Pflugmacher, D.; Ostapowicz, K. Forest stand species mapping using the sentinel-2 time series. Remote Sens. 2019, 11, 1197. [Google Scholar] [CrossRef] [Green Version]
  9. Isuhuaylas, L.A.V.; Hirata, Y.; Santos, L.C.V.; Torobeo, N.S. Natural forest mapping in the Andes (Peru): A comparison of the performance of machine-learning algorithms. Remote Sens. 2018, 10, 782. [Google Scholar] [CrossRef] [Green Version]
  10. Valjarević, A.; Djekić, T.; Stevanović, V.; Ivanović, R.; Jandziković, B. GIS numerical and remote sensing analyses of forest changes in the Toplica region for the period of 1953–2013. Appl. Geogr. 2018, 92, 131–139. [Google Scholar] [CrossRef]
  11. Gudex-Cross, D.; Pontius, J.; Adams, A. Enhanced forest cover mapping using spectral unmixing and object-based classification of multi-temporal Landsat imagery. Remote Sens. Environ. 2017, 196, 193–204. [Google Scholar] [CrossRef]
  12. Shoot, C.; Andersen, H.E.; Monika Moskal, L.; Babcock, C.; Cook, B.D.; Morton, D.C. Classifying forest type in the national forest inventory context with airborne hyperspectral and lidar data. Remote Sens. 2021, 13, 1863. [Google Scholar] [CrossRef]
  13. Ghaderpour, E.; Vujadinovic, T. Change detection within remotely sensed satellite image time series via spectral analysis. Remote Sens. 2020, 12, 4001. [Google Scholar] [CrossRef]
  14. Portillo-Quintero, C.; Hernández-Stefanoni, J.L.; Reyes-Palomeque, G.; Subedi, M.R. The road to operationalization of effective tropical forest monitoring systems. Remote Sens. 2021, 13, 1370. [Google Scholar] [CrossRef]
  15. Lechner, A.M.; Foody, G.M.; Boyd, D.S. Applications in Remote Sensing to Forest Ecology and Management. One Earth 2020, 2, 405–412. [Google Scholar] [CrossRef]
  16. Shimada, M.; Itoh, T.; Motooka, T.; Watanabe, M.; Shiraishi, T.; Thapa, R.; Lucas, R. New global forest/non-forest maps from ALOS PALSAR data (2007–2010). Remote Sens. Environ. 2014, 155, 13–31. [Google Scholar] [CrossRef]
  17. Keenan, R.J.; Reams, G.A.; Achard, F.; de Freitas, J.V.; Grainger, A.; Lindquist, E. Dynamics of global forest area: Results from the FAO Global Forest Resources Assessment 2015. For. Ecol. Manag. 2015, 352, 9–20. [Google Scholar] [CrossRef]
  18. Lefsky, M.A. A global forest canopy height map from the moderate resolution imaging spectroradiometer and the geoscience laser altimeter system. Geophys. Res. Lett. 2010, 37, 1–5. [Google Scholar] [CrossRef] [Green Version]
  19. Tang, H.; Armston, J.; Hancock, S.; Marselis, S.; Goetz, S.; Dubayah, R. Characterizing global forest canopy cover distribution using spaceborne lidar. Remote Sens. Environ. 2019, 231, 111262. [Google Scholar] [CrossRef]
  20. Hu, T.; Su, Y.; Xue, B.; Liu, J.; Zhao, X.; Fang, J.; Guo, Q. Mapping global forest aboveground biomass with spaceborne LiDAR, optical imagery, and forest inventory data. Remote Sens. 2016, 8, 565. [Google Scholar] [CrossRef] [Green Version]
  21. Potapov, P.; Li, X.; Hernandez-Serna, A.; Tyukavina, A.; Hansen, M.C.; Kommareddy, A.; Pickens, A.; Turubanova, S.; Tang, H.; Silva, C.E.; et al. Mapping global forest canopy height through integration of GEDI and Landsat data. Remote Sens. Environ. 2021, 253, 112165. [Google Scholar] [CrossRef]
  22. Le Toan, T.; Quegan, S.; Davidson, M.W.J.; Balzter, H.; Paillou, P.; Papathanassiou, K.; Plummer, S.; Rocca, F.; Saatch, S.; Shugart, H.; et al. The BIOMASS Mission: Mapping global forest biomass to better understand the terrestrial carbon cycle. Remote Sens. Environ. 2011, 115, 2850–2860. [Google Scholar] [CrossRef] [Green Version]
  23. Nesha, M.K.; Herold, M.; De Sy, V.; Duchelle, A.E.; Martius, C.; Branthomme, A.; Garzuglia, M.; Jonsson, O.; Pekkarinen, A. An assessment of data sources, data quality and changes in national forest monitoring capacities in the Global Forest Resources Assessment 2005–2020. Environ. Res. Lett. 2021, 16, 054029. [Google Scholar] [CrossRef]
  24. Potapov, P.; Li, X.; Hernandez-Serna, A.; Tyukavina, A.; Hansen, M.C.; Kommareddy, A.; Pickens, A.; Turubanova, S.; Tang, H.; Silva, C.E.; et al. Mapping and Monitoring Global Forest Canopy Height through the Integration of GEDI and Landsat Data. Available online: www.globalforestwatch.org (accessed on 25 August 2021).
  25. Global Forest Watch. Global Mangrove Watch. Available online: www.globalforestwatch.org (accessed on 25 August 2021).
  26. Adeney, K. A step towards inclusive federalism in Pakistan? The politics of the 18th amendment. Publius 2012, 42, 539–565. [Google Scholar] [CrossRef]
  27. Tariq, A.; Shu, H.; Li, Q.; Altan, O.; Khan, M.R.; Baqa, M.F.; Lu, L. Quantitative Analysis of Forest Fires in Southeastern Australia Using SAR Data. Remote Sens. 2021, 13, 2386. [Google Scholar] [CrossRef]
  28. Tariq, A.; Shu, H. CA-Markov chain analysis of seasonal land surface temperature and land use landcover change using optical multi-temporal satellite data of Faisalabad, Pakistan. Remote Sens. 2020, 12, 3402. [Google Scholar] [CrossRef]
  29. Siddiqui, M.N.; Jamil, Z. Forest change detection in Margala hills of Pakistan. Adv. Space Res. 1993, 13, 107–110. [Google Scholar] [CrossRef]
  30. Malik, R.N.; Husain, S.Z. Evaluating deforestation using landsat TM and SPOT XS data in dry sub-tropical forest of Margalla Hills, northwest of Pakistan. Geoinform. Eur. Integr. 2003, 429–434. [Google Scholar]
  31. Lodhi, M.A.; Echavarria, F.R.; Keithley, C. Using remote sensing data to monitor land cover changes near afghan refugee camps in northern pakistan. Geocarto Int. 1998, 13, 33–39. [Google Scholar] [CrossRef]
  32. Saeed, U.; Gilani, H.; Shahzad, N.; Gill, K. Remote sensing based forest change trend analysis–a case study of mangrove forest of Keti Bunder, Indus Delta. Terra 2001, 15, 12–24. [Google Scholar]
  33. Siddiqui, M.N.; Jamil, Z.; Afsar, J. Monitoring changes in riverine forests of Sindh-Pakistan using remote sensing and GIS techniques. Adv. Space Res. 2004, 33, 333–337. [Google Scholar] [CrossRef]
  34. Abbas, S.; Qamer, F.M.; Rana, A.D.; Hussain, N.; Saleem, R. Application of Object Based Image Analysis for Forest Cover Assessment of Moist Temperate Himalayan Forest in Pakistan. Int. Arch. Photogramm. Remote Sens. Spat. Inf. Sci. 2010, XXXVIII-4, 39-4. [Google Scholar]
  35. Raza, A.; Raja, I.A.; Raza, S. Land-use change analysis of district abbottabad, pakistan: Taking advantage of gis and remote sensing analysis. Sci. Vis. 2012, 18, 43–50. [Google Scholar]
  36. Khan, U.; Minallah, N.; Junaid, A.; Gul, K.; Ahmad, N. Parallelepiped and Mahalanobis Distance based Classification for forestry identification in Pakistan. In Proceedings of the 2015 International Conference on Emerging Technologies (ICET), Peshawar, Pakistan, 19–20 December 2015; pp. 1–6. [Google Scholar] [CrossRef]
  37. Gul, K.; Minallah, N.; Junaid, A.; Aziz, N. Performance Analysis of Object Oriented Remote Sensing Techniques for Forest Detection in Pakistan. Sindh Univ. Res. J. 2016, 48, 511–515. [Google Scholar]
  38. Un Nisa, Z.; Mir, K.; Fatimah, H.; Batool, S.M.; Sanaullah; Atif, S.; Awan, M.A. Application of satellite remote sensing in forest change detection and its environmental impacts in district Abbottabad, Pakistan. J. Pure Appl. Agric. 2018, 3, 49–62. [Google Scholar]
  39. Ullah, S.; Ahmad, K.; Sajjad, R.U.; Abbasi, A.M.; Nazeer, A.; Tahir, A.A. Analysis and simulation of land cover changes and their impacts on land surface temperature in a lower Himalayan region. J. Environ. Manag. 2019, 245, 348–357. [Google Scholar] [CrossRef]
  40. Shehzad, K.; Qamer, F.M.; Murthy, M.S.R.; Abbas, S.; Bhatta, L.D. Deforestation trends and spatial modelling of its drivers in the dry temperate forests of northern Pakistan—A case study of Chitral. J. Mt. Sci. 2014, 11, 1192–1207. [Google Scholar] [CrossRef]
  41. Zeb, A.; Armstrong, G.W.; Hamann, A. Forest conversion by the indigenous Kalasha of Pakistan: A household level analysis of socioeconomic drivers. Glob. Environ. Change 2019, 59, 102004. [Google Scholar] [CrossRef]
  42. Zeb, A. Spatial and temporal trends of forest cover as a response to policy interventions in the district Chitral, Pakistan. Appl. Geogr. 2019, 102, 39–46. [Google Scholar] [CrossRef]
  43. Zeb, A.; Hamann, A.; Armstrong, G.W.; Acuna-Castellanos, D. Identifying local actors of deforestation and forest degradation in the Kalasha valleys of Pakistan. For. Policy Econ. 2019, 104, 56–64. [Google Scholar] [CrossRef]
  44. Sajjad, A.; Hussain, A.; Wahab, U.; Adnan, S.; Ali, S.; Ahmad, Z.; Ali, A. Application of Remote sensing and GIS in Forest cover change in Tehsil Barawal, District Dir, Pakistan. Am. J. Plant. Sci. 2015, 06, 1501–1508. [Google Scholar] [CrossRef] [Green Version]
  45. Munawar, S.; Khokhar, M.F.; Atif, S. Reducing emissions from deforestation and forest degradation implementation in northern Pakistan. Int. Biodeterior. Biodegrad. 2015, 102, 316–323. [Google Scholar] [CrossRef]
  46. Ullah, S.; Farooq, M.; Shafique, M.; Siyab, M.A.; Kareem, F.; Dees, M. Spatial assessment of forest cover and land-use changes in the Hindu-Kush mountain ranges of northern Pakistan. J. Mt. Sci. 2016, 13, 1229–1237. [Google Scholar] [CrossRef]
  47. Ullah, S.; Shafique, M.; Farooq, M.; Zeeshan, M.; Dees, M. Evaluating the impact of classification algorithms and spatial resolution on the accuracy of land cover mapping in a mountain environment in Pakistan. Arab. J. Geosci. 2017, 10, 67. [Google Scholar] [CrossRef]
  48. Haq, F.; Rahman, F.; Tabassum, I.; Ullah, I.; Sher, A. Forest Dilemma in the Hindu Raj Mountains Northern Pakistan: Impact of Population Growth and Household Dynamics. Small-Scale For. 2018, 17, 323–341. [Google Scholar] [CrossRef]
  49. Khan, H.; Shafique, M.; Khan, M.A.; Bacha, M.A.; Shah, S.U.; Calligaris, C. Landslide susceptibility assessment using Frequency Ratio, a case study of northern Pakistan. Egypt. J. Remote Sens. Sp. Sci. 2019, 22, 11–24. [Google Scholar] [CrossRef]
  50. Imran, M.; ud Din, N. Geospatially mapping carbon stock for mountainous forest classes using InVEST model and Sentinel-2 data: A case of Bagrote valley in the Karakoram range. Arab. J. Geosci. 2021, 14, 756. [Google Scholar] [CrossRef]
  51. Butt, A.; Shabbir, R.; Ahmad, S.S.; Aziz, N. Land use change mapping and analysis using Remote Sensing and GIS: A case study of Simly watershed, Islamabad, Pakistan. Egypt. J. Remote Sens. Sp. Sci. 2015, 18, 251–259. [Google Scholar] [CrossRef] [Green Version]
  52. Butt, A.; Shabbir, R.; Ahmad, S.S.; Aziz, N.; Nawaz, M.; Tahir, M.S.A. Land cover classification and change detection analysis of rawal watershed using remote sensing data. J. Biodivers. Environ. Sci. 2015, 6, 236–248. [Google Scholar]
  53. Hassan, Z.; Shabbir, R.; Ahmad, S.S.; Malik, A.H.; Aziz, N.; Butt, A.; Erum, S. Dynamics of land use and land cover change (LULCC) using geospatial techniques: A case study of Islamabad Pakistan. Springerplus 2016, 5, 812. [Google Scholar] [CrossRef] [PubMed] [Green Version]
  54. Mannan, A.; Feng, Z.; Ahmad, A.; Liu, J.; Saeed, S.; Mukete, B. Carbon dynamic shifts with land use change in margallah hills national park, Islamabad (Pakistan) from 1990 to 2017. Appl. Ecol. Environ. Res. 2018, 16, 3197–3214. [Google Scholar] [CrossRef]
  55. Batool, R.; Javaid, K. Spatio-temporal assessment of Margalla hills forest by using LANDSAT imagery for year 2000 and 2018. Int. Arch. Photogramm. Remote Sens. Spat. Inf. Sci.-ISPRS Arch. 2018, 42, 69–72. [Google Scholar] [CrossRef] [Green Version]
  56. Waseem, S.; Khayyam, U. Loss of vegetative cover and increased land surface temperature: A case study of Islamabad, Pakistan. J. Clean. Prod. 2019, 234, 972–983. [Google Scholar] [CrossRef]
  57. Khan, M.S.; Ullah, S.; Sun, T.; Rehman, A.U.; Chen, L. Land-use/land-cover changes and its contribution to urban heat Island: A case study of Islamabad, Pakistan. Sustainability 2020, 12, 3861. [Google Scholar] [CrossRef]
  58. Gilani, H.; Ahmad, S.; Qazi, W.A.; Abubakar, S.M.; Khalid, M. Monitoring of urban landscape ecology dynamics of Islamabad capital territory (ICT), Pakistan, over four decades (1976–2016). Land 2020, 9, 123. [Google Scholar] [CrossRef] [Green Version]
  59. Shah, A.; Ali, K.; Nizami, S.M. Four decadal urban land degradation in Pakistan a case study of capital city islamabad during 1979–2019. Environ. Sustain. Indic. 2021, 10, 100108. [Google Scholar] [CrossRef]
  60. Shah, A.; Ali, K.; Nizami, S.M. Spatio-temporal analysis of urban sprawl in Islamabad, Pakistan during 1979–2019, using remote sensing. GeoJournal 2021, 6. [Google Scholar] [CrossRef]
  61. Amjad, D.; Kausar, S.; Waqar, R.; Sarwar, F. Land cover change analysis and impacts of deforestation on the climate of District Mansehra, Pakistan. J. Biodivers. Environ. Sci. 2019, 14, 103–113. [Google Scholar]
  62. Ullah, S.; Tahir, A.A.; Akbar, T.A.; Hassan, Q.K.; Dewan, A.; Khan, A.J.; Khan, M. Remote sensing-based quantification of the relationships between land use land cover changes and surface temperature over the lower Himalayan region. Sustainability 2019, 11, 5492. [Google Scholar] [CrossRef] [Green Version]
  63. Shahzad, N.; Saeed, U.; Gilani, H.; Ahmad, S.R.; Ashraf, I.; Irteza, S.M. Evaluation of state and community/private forests in Punjab, Pakistan using geospatial data and related techniques. For. Ecosyst. 2015, 2, 7. [Google Scholar] [CrossRef] [Green Version]
  64. Mannan, A.; Liu, J.; Zhongke, F.; Khan, T.U.; Saeed, S.; Mukete, B.; ChaoYong, S.; Yongxiang, F.; Ahmad, A.; Amir, M.; et al. Application of land-use/land cover changes in monitoring and projecting forest biomass carbon loss in Pakistan. Glob. Ecol. Conserv. 2019, 17, e00535. [Google Scholar] [CrossRef]
  65. Siyal, A.A.; Siyal, A.G.; Mahar, R.B. Spatial and temporal dynamics of Pai forest vegetation in Pakistan assessed by RS and GIS. J. For. Res. 2016, 28, 593–603. [Google Scholar] [CrossRef]
  66. Shafique, T.; Zuberi, M.H.; Shams, Z.I. Geospatial assessment of carbon stock inventory by vegetation indices in Pai Forest, Sindh, Pakistan. Int. J. Environ. Qual. 2021, 43, 47–64. [Google Scholar] [CrossRef]
  67. Qasim, M.; Hubacek, K.; Termansen, M.; Khan, A. Spatial and temporal dynamics of land use pattern in District Swat, Hindu Kush Himalayan region of Pakistan. Appl. Geogr. 2011, 31, 820–828. [Google Scholar] [CrossRef]
  68. Qasim, M.; Hubacek, K.; Termansen, M.; Fleskens, L. Modelling land use change across elevation gradients in district Swat, Pakistan. Reg. Environ. Chang. 2013, 13, 567–581. [Google Scholar] [CrossRef]
  69. Tariq, A.; Shu, H.; Siddiqui, S.; Mousa, B.G.; Munir, I.; Nasri, A.; Waqas, H.; Lu, L.; Baqa, M.F. Forest fire monitoring using spatial-statistical and Geo-spatial analysis of factors determining forest fire in Margalla Hills, Islamabad, Pakistan. Geomat. Nat. Hazards Risk 2021, 12, 1212–1233. [Google Scholar] [CrossRef]
  70. Ali, S.; Ali, W.; Khan, S.; Khan, A.; Rahman, Z.U.; Iqbal, A. Forest cover change and carbon stock assessment in Swat valley using remote sensing and geographical information systems. Pure Appl. Biol. 2017, 6, 850–856. [Google Scholar] [CrossRef]
  71. Ahmad, A.; Liu, Q.J.; Nizami, S.M.; Mannan, A.; Saeed, S. Carbon emission from deforestation, forest degradation and wood harvest in the temperate region of Hindukush Himalaya, Pakistan between 1994 and 2016. Land Use policy 2018, 78, 781–790. [Google Scholar] [CrossRef]
  72. Ahmad, A.; Liu, Q.J.; Marwat, K.B.; Shah, S.; Amir, M.; Mannan, A. Tree distribution pattern, growing stock characteristics and carbon mitigation potential of different forests ecosystems in kumrat, hindukush region of northern pakistan. Pak. J. Bot. 2019, 51, 2185–2194. [Google Scholar] [CrossRef]
  73. Talib, B.; Arif, H.; Shahzad, M.; Mehmood, S.A.; Batool, H.; Naeem, K.; Batool, S.; Nasir, J.; Shafiq, M. Spatiotemporal analysis of land use /land cover in Swat, Pakistan using supervised classification in Remote Sensing: 2000 to 2015. Int. J. Econ. Environ. Geol. 2020, 11, 69–74. [Google Scholar] [CrossRef]
  74. Tariq, A.; Shu, H.; Siddiqui, S.; Imran, M.; Farhan, M. Monitoring Land Use And Land Cover Changes Using Geospatial Techniques, A Case Study of Fateh Jang, Attock, Pakistan. Geogr. Environ. Sustain. 2021, 14, 41–52. [Google Scholar] [CrossRef]
  75. Qasim, H.; Luqman, M.; Khan, S. A study of forest land cover changes using satellite remote sensing in thatta district Pakistan. Sci. Int. 2016, 28, 4069–4075. [Google Scholar]
  76. Ur Rehman, Z.; Kazmi, S.J.H. Land use/land cover changes through satellite remote sensing approach: A case study of Indus delta, Pakistan. Pak. J. Sci. Ind. Res. 2018, 61, 156–162. [Google Scholar] [CrossRef]
  77. Abbasi, H.U.; Chughtai, A.H.; Sultana, G.; Adhban; Farea, O.A.; Islam, H. Spatio-temporal Land use/cover assessment of Sub-Tropical Forests ofThatta Division. Sindh Univ. Res. J. 2019, 51, 547–554. [Google Scholar] [CrossRef]
  78. Qamer, F.M.; Shehzad, K.; Abbas, S.; Murthy, M.S.R.; Xi, C.; Gilani, H.; Bajracharya, B. Mapping deforestation and forest degradation patterns in Western Himalaya, Pakistan. Remote Sens. 2016, 8, 385. [Google Scholar] [CrossRef] [Green Version]
  79. Munawar, S.; Udelhoven, T. Land change syndromes identification in temperate forests of Hindukush Himalaya Karakorum (HHK) mountain ranges. Int. J. Remote Sens. 2020, 41, 7735–7756. [Google Scholar] [CrossRef]
  80. Khan, T.U.; Mannan, A.; Hacker, C.E.; Ahmad, S.; Siddique, M.A.; Khan, B.U.; Din, E.U.; Chen, M.; Zhang, C.; Nizami, M.; et al. Use of GIS and remote sensing data to understand the impacts of land use/land cover changes (LULCC) on snow leopard (Panthera uncia) habitat in pakistan. Sustainability 2021, 13, 3590. [Google Scholar] [CrossRef]
  81. Abbas, S.; Qamer, F.M.; Ali, G.; Tripathi, N.K.; Shehzad, K.; Saleem, R.; Gilani, H. An assessment of status and distribution of mangrove forest cover in Pakistan. J. Biodivers. Environ. Sci. 2013, 3, 64–78. [Google Scholar]
  82. Tariq, A.; Shu, H.; Siddiqui, S.; Munir, I.; Sharifi, A.; Li, Q.; Lu, L. Spatio-temporal analysis of forest fire events in the Margalla Hills, Islamabad, Pakistan using socio-economic and environmental variable data with machine learning methods. J. For. Res. 2021, 13, 12. [Google Scholar] [CrossRef]
  83. Gilani, H.; Naz, H.I.; Arshad, M.; Nazim, K.; Akram, U.; Abrar, A.; Asif, M. Evaluating mangrove conservation and sustainability through spatiotemporal (1990–2020) mangrove cover change analysis in Pakistan. Estuar. Coast. Shelf Sci. 2021, 249, 107128. [Google Scholar] [CrossRef]
  84. Abbasi, H.; Baloch, M.A.; Memon, A.G. Deforestation analysis of riverine forest of sindh using remote sensing techniques. Mehran Univ. Res. J. Eng. Technol. 2011, 30, 477–482. [Google Scholar]
  85. Iqbal, M.F.; Khan, I.A. Spatiotemporal Land use land cover change analysis and erosion risk mapping of Azad Jammu and Kashmir, Pakistan. Egypt. J. Remote Sens. Space Sci. 2014, 17, 209–229. [Google Scholar] [CrossRef] [Green Version]
  86. Batool, S.; Khan, K.; Ghaffar, A.; Hussain, S.Z. Forest Cover Change Detection and Its Impact on Rainfall Patternin Thak Valley (Pakistan). Pak. J. Sci. 2015, 67, 1–9. [Google Scholar]
  87. Baig, S.; Qazi, W.A.; Akhtar, A.M.; Waqar, M.M.; Ammar, A.; Gilani, H.; Mehmood, S.A. Above Ground Biomass Estimation of Dalbergia sissoo Forest Plantation from Dual-Polarized ALOS-2 PALSAR Data. Can. J. Remote Sens. 2017, 43, 297–308. [Google Scholar] [CrossRef]
  88. Younis, S.M.Z.; Ammar, A. Quantification of impact of changes in land use-land cover on hydrology in the upper Indus Basin, Pakistan. Egypt. J. Remote Sens. Space Sci. 2018, 21, 255–263. [Google Scholar] [CrossRef]
  89. Rashid, B.; Iqbal, J. Spatiotemporal Change Detection in Forest Cover Dynamics along Landslide Susceptible Region of Karakoram Highway, Pakistan. ISPRS Ann. Photogramm. Remote Sens. Spat. Inf. Sci. 2018, 4, 177–184. [Google Scholar] [CrossRef] [Green Version]
  90. Khan, I.; Javed, T.; Khan, A.; Lei, H.; Muhammad, I.; Ali, I.; Huo, X. Impact assessment of land use change on surface temperature and agricultural productivity in Peshawar-Pakistan. Environ. Sci. Pollut. Res. 2019, 26, 33076–33085. [Google Scholar] [CrossRef] [PubMed]
  91. Urooj, R.; Ahmad, S.S. Spatio-temporal ecological changes around wetland using multispectral satellite imagery in AJK, Pakistan. SN Appl. Sci. 2019, 1, 1–8. [Google Scholar] [CrossRef] [Green Version]
  92. Khan, I.A.; Khan, M.R.; Baig, M.H.A.; Hussain, Z.; Hameed, N.; Khan, J.A. Assessment of forest cover and carbon stock changes in sub-tropical pine forest of Azad Jammu & Kashmir (AJK), Pakistan using multitemporal Landsat satellite data and field inventory. PLoS ONE 2020, 15, e0226341. [Google Scholar] [CrossRef] [Green Version]
  93. Mahmoudi, P.; Shirazi, S.A.; Firoozi, F.; Jahanshahi, S.M.A.; Mazhar, N. Detection of land cover changes in Baluchistan (shared between Iran, Pakistan, and Afghanistan) using the MODIS Land Cover Product. Arab. J. Geosci. 2020, 13, s12517-s020. [Google Scholar] [CrossRef]
  94. Ali, A.; Ashraf, M.I.; Gulzar, S.; Akmal, M.; Ahmad, B. Estimation of soil carbon pools in the forests of Khyber Pakhtunkhwa Province, Pakistan. J. For. Res. 2020, 31, 2313–2321. [Google Scholar] [CrossRef] [Green Version]
  95. Saddique, N.; Mahmood, T.; Bernhofer, C. Quantifying the impacts of land use/land cover change on the water balance in the afforested River Basin, Pakistan. Environ. Earth Sci. 2020, 79, 1–13. [Google Scholar] [CrossRef]
  96. Hussain, S.; Mubeen, M.; Akram, W.; Ahmad, A.; Habib-ur-Rahman, M.; Ghaffar, A.; Amin, A.; Awais, M.; Farid, H.U.; Farooq, A.; et al. Study of land cover/land use changes using RS and GIS: A case study of Multan district, Pakistan. Environ. Monit. Assess. 2020, 192, 2. [Google Scholar] [CrossRef] [PubMed]
  97. Hussain, S.; Mubeen, M.; Ahmad, A.; Akram, W.; Hammad, H.M.; Ali, M.; Masood, N.; Amin, A.; Farid, H.U.; Sultana, S.R.; et al. Using GIS tools to detect the land use/land cover changes during forty years in Lodhran District of Pakistan. Environ. Sci. Pollut. Res. 2020, 27, 39676–39692. [Google Scholar] [CrossRef]
  98. Khan, K.; Iqbal, J.; Ali, A.; Khan, S.N. Assessment of sentinel-2-derived vegetation indices for the estimation of above-ground biomass/carbon stock, temporal deforestation and carbon emissions estimation in the moist temperate forests of pakistan. Appl. Ecol. Environ. Res. 2020, 18, 783–815. [Google Scholar] [CrossRef]
  99. Ali, A.; Nayyar, Z.A. Extraction of mangrove forest through Landsat 8 Mangrove Index (L8MI). Arab. J. Geosci. 2020, 13, s12517-s020. [Google Scholar] [CrossRef]
  100. Ul Haq, N.; Rahman, F.; Tabassum, I.; Mehran. Forest cover dynamics in Palas Valley Kohistan, Hindu Kush-Himalayan Mountains, Pakistan. J. Mt. Sci. 2021, 18, 416–426. [Google Scholar] [CrossRef]
  101. Zafar, Z.; Mehmood, M.S.; Ahamad, M.I.; Chudhary, A.; Abbas, N.; Khan, A.R.; Zulqarnain, R.M.; Abdal, S. Trend analysis of the decadal variations of water bodies and land use/land cover through MODIS imagery: An in-depth study from Gilgit-Baltistan, Pakistan. Water Sci. Technol. Water Supply 2021, 21, 927–940. [Google Scholar] [CrossRef]
  102. Abbas, S.; Qamer, F.M.; Hussain, N.; Saleem, R.; Nitin, K.T. National Level Assessment of Mangrove Forest Cover in Pakistan. ISPRS-Int. Arch. Photogramm. Remote Sens. Spat. Inf. Sci. 2011, XXXVIII-8, 187–192. [Google Scholar] [CrossRef] [Green Version]
  103. Qamer, F.M.; Abbas, S.; Saleem, R.; Shehzad, K.; Ali, H.; Gilani, H. Forest cover change assessment in conflict-affected areas of northwest Pakistan: The case of Swat and Shangla districts. J. Mt. Sci. 2012, 9, 297–306. [Google Scholar] [CrossRef]
  104. Ali, M.Z.; Qazi, W.; Aslam, N. A comparative study of ALOS-2 PALSAR and landsat-8 imagery for land cover classification using maximum likelihood classifier. Egypt. J. Remote Sens. Space Sci. 2018, 21, S29–S35. [Google Scholar] [CrossRef]
  105. Dinerstein, E.; Olson, D.; Joshi, A.; Vynne, C.; Burgess, N.D.; Wikramanayake, E.; Hahn, N.; Palminteri, S.; Hedao, P.; Noss, R.; et al. An Ecoregion-Based Approach to Protecting Half the Terrestrial Realm. Bioscience 2017, 67, 534–545. [Google Scholar] [CrossRef] [PubMed]
  106. Khan, I.A.; Khan, W.R.; Ali, A.; Nazre, M. Assessment of above-ground biomass in pakistan forest ecosystem’s carbon pool: A review. Forests 2021, 12, 586. [Google Scholar] [CrossRef]
  107. Brovelli, M.A.; Sun, Y.; Yordanov, V. Monitoring forest change in the amazon using multi-temporal remote sensing data and machine learning classification on Google Earth Engine. ISPRS Int. J. Geoinf. 2020, 9, 580. [Google Scholar] [CrossRef]
  108. Dimock, W.C. AI and the Humanities. PMLA/Publ. Mod. Lang. Assoc. Am. 2020, 135, 449–454. [Google Scholar] [CrossRef]
Figure 1. Geographical locations of 73 studies on forest mapping in Pakistan (1993–2021) laid over global forest/mangrove watch data set.
Forests 12 01211 g001
Figure 2. Methodological flowchart of the review.
Forests 12 01211 g002
Figure 3. Percentage of each methodology used for image classification for the 73 reviewed studies.
Forests 12 01211 g003
Figure 4. Collective citations of total published papers against each year between 1993–2021.
Forests 12 01211 g004
Figure 5. Distribution of study scale against each year (1993–2021).
Forests 12 01211 g005
Figure 6. (a) Distributions of the overall accuracy of each study against different study scales. (b) Boxplots of the overall accuracy of each study against different study scales.
Forests 12 01211 g006
Figure 7. Frequency of satellite imageries used by the researchers in Pakistan for forest mapping.
Forests 12 01211 g007
Figure 8. Various image classification algorithms used by the researchers (1993–2021).
Forests 12 01211 g008
Figure 9. Distribution of studies based on global forest types/ecoregions.
Forests 12 01211 g009
Table 1. Number of studies published in each administrative division of Pakistan (1993–2021).
Administrative AreaNumber of Studies
Azad Jammu & Kashmir (AJK)03
Balochistan01
Gilgit-Baltistan (GB)03
Islamabad Capital Territory (ICT)12
Khyber Pakhtunkhwa (KP)31
Punjab06
Sindh10
Other (national/regional level studies)07
Total73
Table 2. Details of accuracies achieved by researchers for image classification of forests in Pakistan.
Satellite ImageClassifierOverall AccuracyKappa CoefficientProducer’s AccuracyUser’s AccuracyReference
SPOT-5SVM89%0.86>72%>78%Ullah et al. [47]
k-NN88%0.85>69%>71%
RF88%0.84>69%>71%
NN88%0.84>73%>64%
Landsat 8SVM71%0.59>26%>40%
k-NN59%0.54>11%>31%
RF71%0.59>17%>33%
NN65%0.51>11%>4%
Year Abbasi et al. [77]
1979 93.46%0.9094
1992 98.10%0.9886
1998 99.01%0.9986
2000 99.79%0.9966
2006 100%1.0
2009 100%1.0
2010 99.00%0.9825
Year Gilani et al. [58]
1976 0.830.79>72%>75%
1990 0.850.81>80%>77%
2000 0.860.82>80%>80%
2010 0.880.84>80%>79%
2016 0.900.85>84%>84%
YearSeason Hussain et al. [96]
1988Rabi87.6%0.75>85.2%>85.5%
Kharif86%0.81>84.4%>82.7%
2002Rabi84.5%0.77>80.4%>82.1%
Kharif89.3%0.84>83.5%>81.9%
2017Rabi85.1%0.82>84.2%>79.2%
Kharif87.7%0.78>83.2%>83.1%
Year Hussain et al. [97]
1977 0.860.77>82.9%>89.1%
1987 0.850.74>83.9%>84.3%
1997 0.860.77>85.5%>87%
2007 0.880.79>87.7%>89.8%
2017 0.950.84>87.5%>95%
Year Haq et al. [100]
1980 94.60%93.41% >90%
2000 95.50%94.39% >90%
2010 94.40%93.20% >90%
2017 93.00%91.40% >90%
Year Gilani et al. [83]
1990 91.80.892
1995 940.906
2000 930.892
2005 94.20.908
2010 93.60.892
2015 93.60.904
2020 95.40.926
Table 3. Forest change assessment statistics in different areas of Pakistan (1993–2021).
Studies with No Forest Change Assessment12
Studies with forest change assessment61Studies did not report forest change1
Studies reported forest change60Studies reported overall forest appraisal13
Studies reported overall forest decline47
Publisher’s Note: MDPI stays neutral with regard to jurisdictional claims in published maps and institutional affiliations.

