Article

Influence of Topographic Conditions on Teak Growth Performance in Mountainous Landscapes of Lao PDR

by
Simone Vongkhamho
1,2,*,
Akihiro Imaya
3,†,
Kazukiyo Yamamoto
1,
Chisato Takenaka
1 and
Hiroyuki Yamamoto
1
1
Graduate School of Bioagricultural Sciences, Nagoya University, Furo-cho, Chikusa-ku, Nagoya 464-8601, Japan
2
Forestry Research Center, National Agriculture and Forestry Research Institute, Vientiane 01170, Laos
3
Japan International Research Center for Agricultural Sciences, 1-1 Ohwashi, Tsukuba, Ibaraki 305-8686, Japan
*
Author to whom correspondence should be addressed.
Current address: Forestry and Forest Products Research Institute, 1 Matsunosato, Tsukuba, Ibaraki 305-8687, Japan.
Submission received: 12 October 2021 / Revised: 14 December 2021 / Accepted: 17 December 2021 / Published: 14 January 2022
(This article belongs to the Section Forest Ecology and Management)

Abstract

:
Teak is a globally valuable hardwood tree species, as its growth performance is important for timber productivity. The purpose of this study was to establish an effective management system for teak plantations in the Lao PDR. Using diameter at breast height (DBH) and height growth as significant indicators of growth performance, we investigated the relationship between tree growth curve parameters of teak and topographic conditions. Stem analysis data for 81 sample trees (three trees selected in canopy trees with predominant height in each plot) were examined for growth performance using the Mitscherlich growth function. The results of Spearman’s partial rank correlation indicated that the upper limits of DBH and tree height growth had significant negative correlations with the slope gradient and stand density. The curvature of DBH and tree height growth curves showed significant positive correlations with the slope form. Moreover, the elevation and slope gradient showed significant negative correlations with the curvature of tree height growth curve. However, the time lag of DBH growth showed a significant negative correlation with the slope position, while the slope gradient was positively correlated with the time lag of tree height growth. These results suggest that teak planted at lower slopes has faster growth rates and that there is an interaction with the gentle concave slope of this area.

1. Introduction

Teak (Tectona grandis Linn. F) is endemic to Asia, and its natural distribution ranges from India, Myanmar and Thailand to north-western Lao People’s Democratic Republic (PDR) [1,2]. Teak is a globally important commercial hardwood tree species; it has been planted in sites with a large diversity of conditions inside and outside of its endemic area across tropical countries for many centuries. In 2017, the area of teak plantations reached 6.89 million hectares [3].
The growth and development of teak are affected by genotype [4,5,6], silviculture and management practices (e.g., spacing, weeding, thinning and pruning) [7,8,9,10]; for example, wider initial spacing of teak plantations promotes greater stem diameter growth than narrow spacing, but it requires intense early weeding and pruning [7,10,11], environmental factors (e.g., rainfall, temperature and wind), edaphic factors (e.g., geology, topography and soil), moisture [1,2,12,13] and sunlight [10,14]. Apart from management, the high yield for teak plantations is therefore dependent on optimum site conditions.
The growth performance of planted teak is an important determinant of timber productivity. Teak is a calcicolous tree species; it requires soil with a high calcium content to support growth and development [1,11,13]. For trees planted in soil with the same nutrient composition of calcium (Ca), phosphate (P), potassium (K), magnesium (Mg) and nitrogen (N), better performance is significantly correlated with location in the valley’s gentle slopes and bottoms [15]. Therefore, topographic conditions (slope gradient, slope position, etc.) can be expected to affect growth performance.
In the Lao PDR, teak has been planted across the country for many decades [16,17,18], and there are large-scale teak plantations in the northern mountainous region. Luang Prabang Province has 15,000 hectares of plantations, accounting for about 37.5% of the total area of planted teak in Laos. In this province, teak has customarily been established over diverse landforms and topography in areas near villages along roads, rivers and fallow land [19].
In Lao PDR, teak has commonly been grown with high stand density from 1100 to 2500 trees per hectare with poor silviculture management and careless management of planting materials, such as using seeds and seedlings of uncertain quality with unknown genetic origin [16,20,21]. These practices can directly reduce growth performance [22]. Imaya et al. [23] reported that the soil physicochemical properties in the Luang Prabang and Xieng Ngern Districts were suitable for growing teak on a large scale; in particular, the Ca content in the soil was optimum (>4.0 cmolc/kg soil) in about 64% of this area. However, a high proportion of teak plantations actually showed poor growth performance, as low site index (SI) values were found. Dieters et al. [24] reported that SI ranged from 15 to 23 for plantations with a reference age of 15 years, and Imaya et al. [23] reported that SI ranged from 13 to 27 for plantations with a reference age of 20 years. In other tropical regions such as Venezuela, SI ranged from 15 to 27 for plantations with a reference age of 16 years [11], and in Mexico, SI ranged from 12 to 24 for plantations with a reference age of 10 years [25]. In neighbouring countries, such as Thailand, SI ranged from 14 to 30 for a reference age of 30 years [26]. Thus, even where soil suitable for teak growth is found on a large scale, the lack of control of genetic management and silviculture practices prevents the attainment of good growth performance. Therefore, we assume that topographic conditions may influence the growth performance of planted teak in this area. However, there is little research on this in Lao PDR.
This paper aims to examine the relationship between growth performance as diameter at breast height (DBH) and tree height growth curve parameters and topographic condition variables (elevation, slope gradient, slope direction, slope form and slope position) of teak trees in the mountainous areas of Luang Prabang Province of Lao PDR.

2. Material and Methods
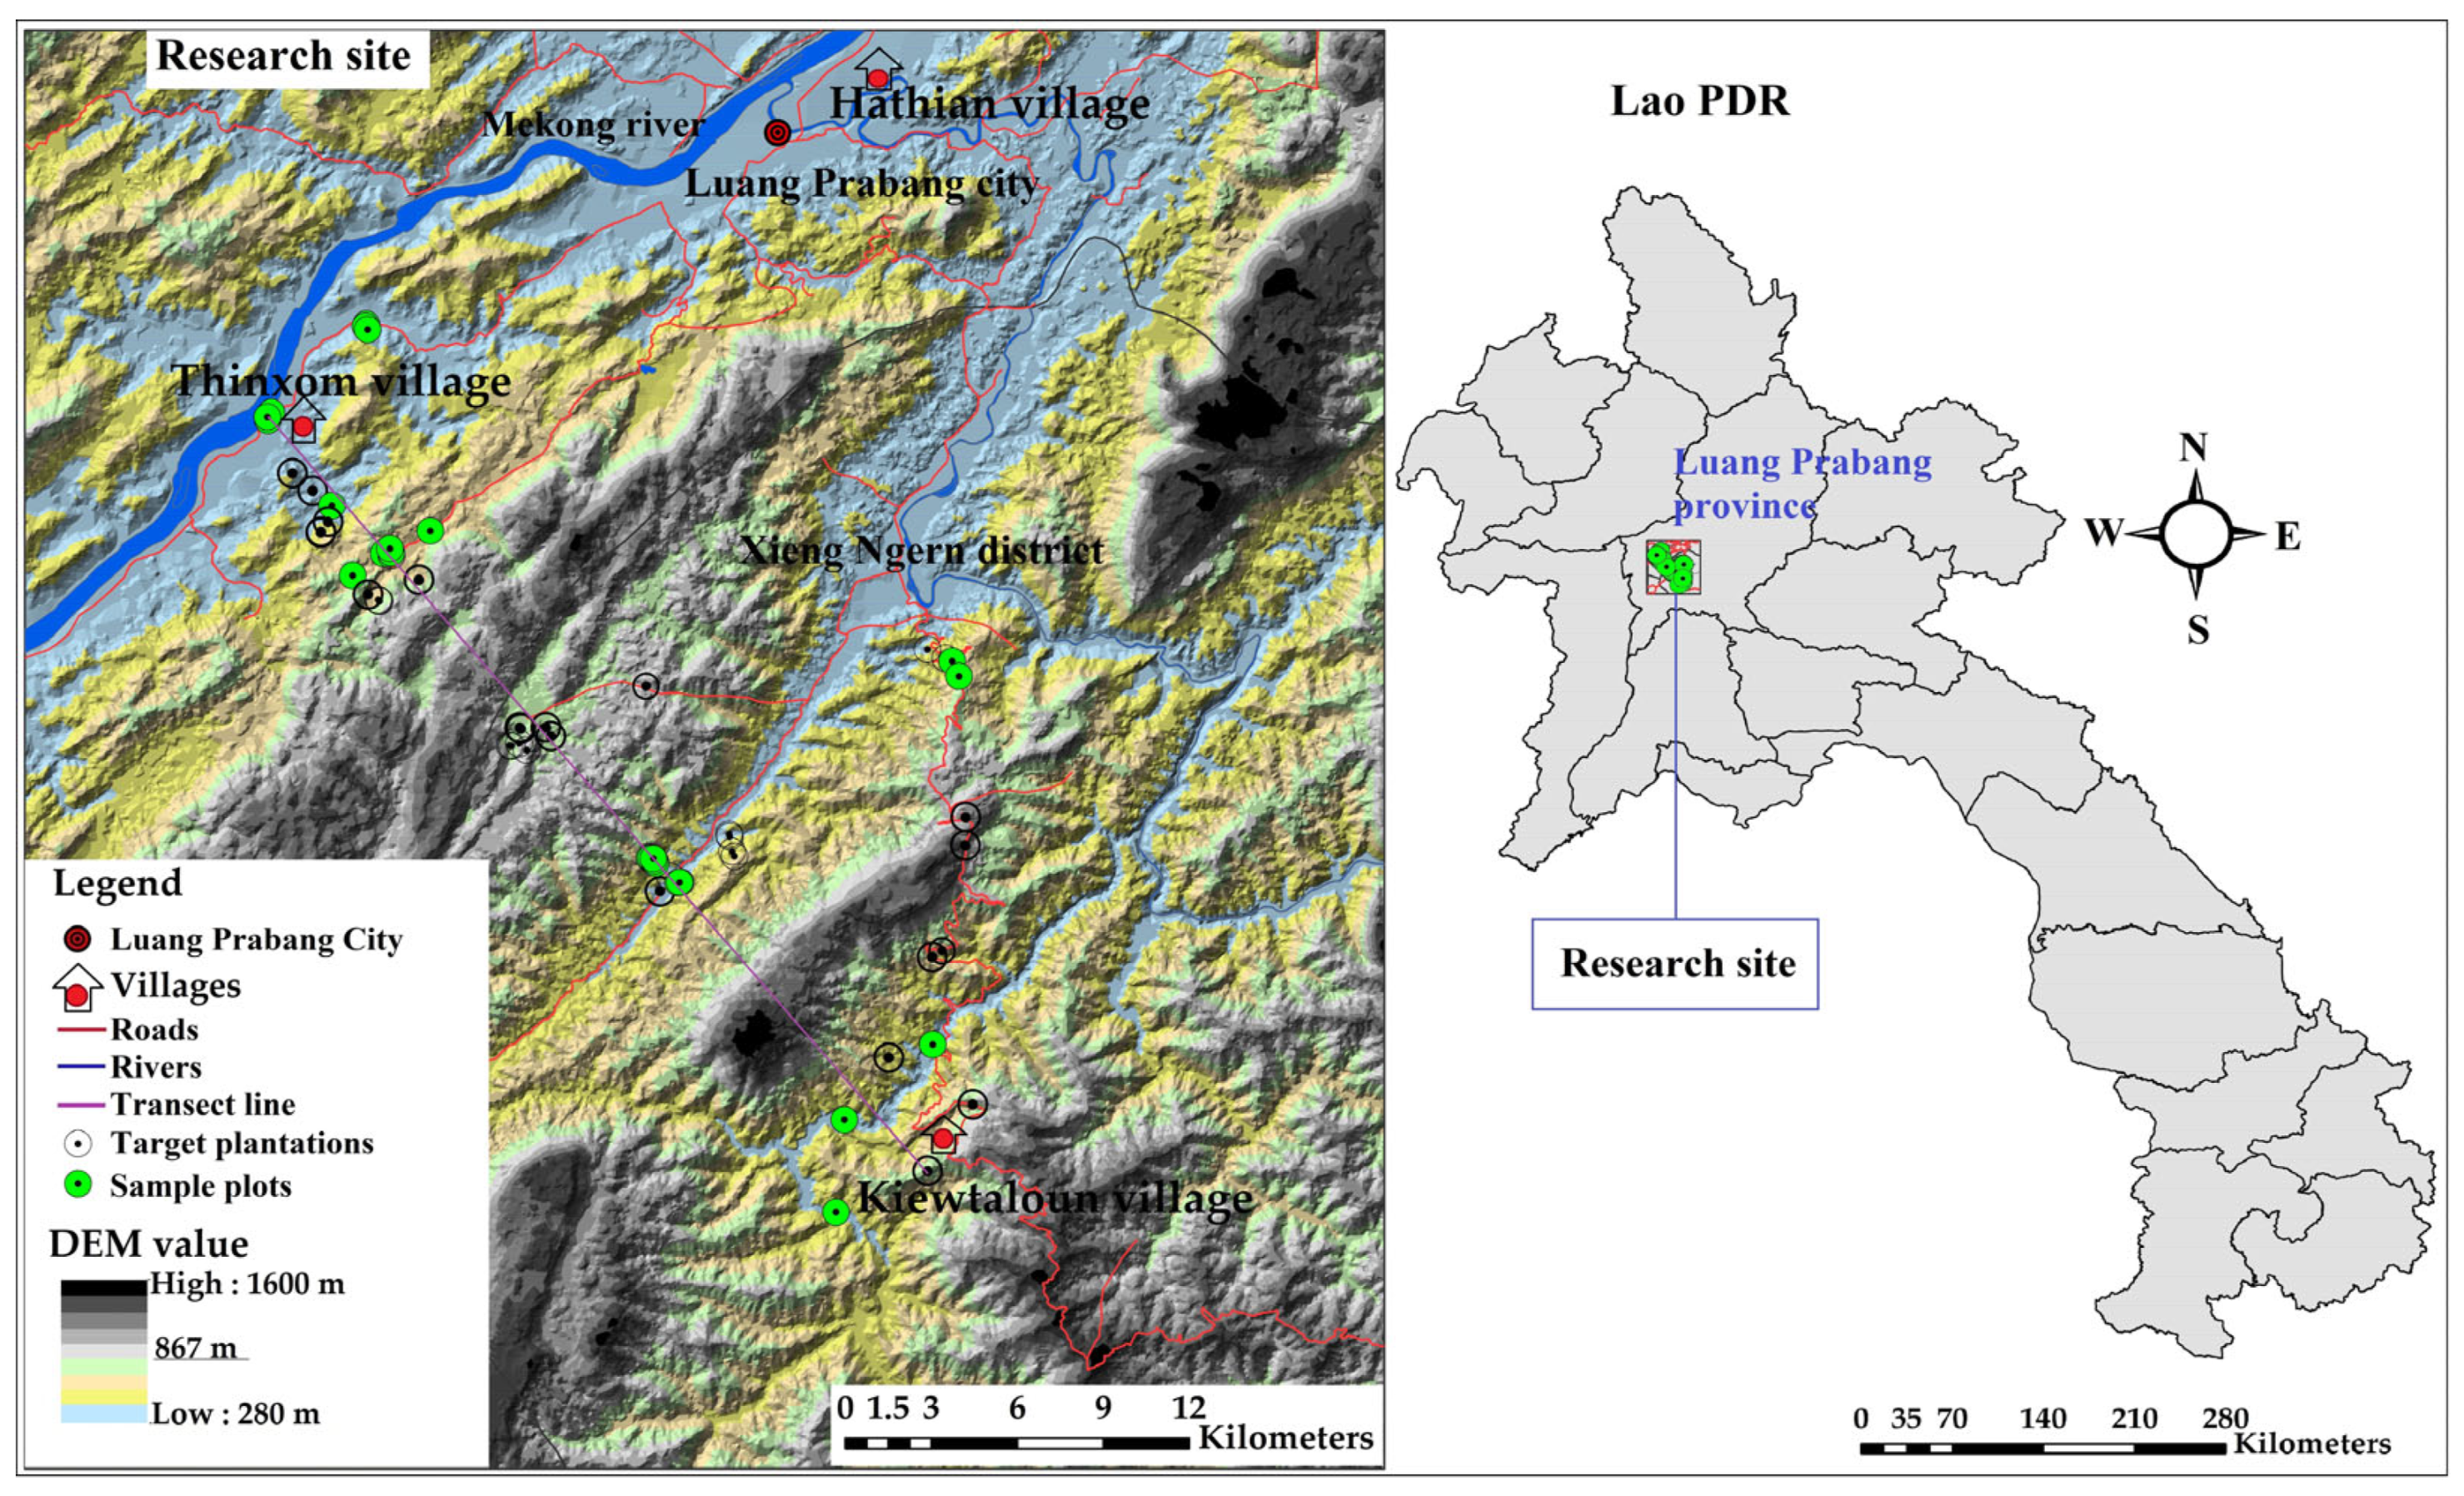
2.1. Research Site

The teak plantation area of Luang Prabang Province covers 11 districts. The Luang Prabang and Xieng Ngern Districts account for about 43% of the total planted teak area, with 98% belonging to individual farmers and the private sector [16,19,27]. These two districts in the southwest part of Luang Prabang Province were selected as being representative of the planted area of the province. As shown in Figure 1, a 31-km transect line was drawn from approximately 16 km west of Luang Prabang City, beginning from the flat land area of the Mekong River basin (19°48′14″ N; 101°59′54″ E) in Thinxom Village in the Luang Prabang City (elevation, 287 m) and running straight across the mountain ridges and valleys to the highland area of Kiewtaloun Village (19°36′8″ N; 102°11′26″ E) in the southwestern part of Xieng Ngern District (elevation, 867 m). The research site is in a region with a tropical monsoon climate comprising two distinct seasons, a dry season (October–March) and a wet season (April–September). According to weather data recorded over 10 years (2008–2017) at the Luang Prabang Meteorology Station (Hathian Village, 19°54′1″ N 102°10′12″ E; elevation, 297 m), the mean annual rainfall was 1628 mm (minimum, 1259 mm; maximum, 2233 mm). The mean annual temperature was 26.4 °C (minimum 20.5 °C; maximum, 32.3 °C), and the average relative humidity was 79% (minimum, 52%; maximum, 95%) [28].

2.2. Tree Sampling and Site Description

Data for this research were collected from individual teak plantations with various stand ages and site conditions. Sixty-one target teak plantations were designated along the transect line to establish the temporary square sample plots (TSPs: 20 m × 20 m in size), with site elevation ranging from 287 to 1057 m (Figure 1). TSPs were created for plot sampling purposes. All teak trees in each TSP were measured; the DBH (1.3 m in height above ground level) was measured using a measuring tape, and total tree height was measured using an ultrasonic height measurer (Vertex IV, Haglöf, Sweden). In addition, 183 trees in total (three canopy trees per plot) were selected from each TSP for assessing tree age according to the tree rings on the crosscut disk at ground level of each sample tree.
Tree growth increases with tree age [30]; teak exhibits fast height growth in the early stages of stem development, slowing after 15 years with good sites and appropriate establishment and management practices [11]. Therefore, in this study, we first investigated the relationship between tree height growth and tree age using Mitscherlich and Richards growth functions [31], and the results indicated that younger teak (e.g., <20 years) had not completed tree height growth (Figure 2). Therefore, the TSPs with trees < 20 years in age were excluded in this study. At the same time, this study also designated the following criteria: (1) stand elevation of ≤900 m and the plantations were classified by (2) landform (lowland, hill, or mountain), (3) slope position (bottom, lower, middle, upper and crest), (4) slope form (straight, convex and concave in the vertical and horizontal directions) [32] and (5) slope direction (north, east, south and west). The assessment consisted of establishing and taking measurements of parameters for sample plots and trees and felling the dominant tree for stem analysis.
In total, 27 sample plots based on the above criteria were selected from 61 TSPs, which were distributed in 13 sub-areas with current stand densities ranging from 525 to 1650 trees per hectare and various stand ages and site conditions along the transect line (Figure 1). Generally, sample plots came from 22 individual plantations, although some sample plots came from the same plantation with different slope positions. Tree assessments were conducted, and the DBH and total height were measured (Table A1). Only canopy trees with no obvious evidence of growth abnormalities or damage were selected for sampling. A total of 81 sample trees (three trees selected in canopy trees with predominant height in each plot) were felled for stem analysis; the true height of the tree was also measured after harvest. Crosscut discs (disc thickness, 5 cm) from each felled tree were taken at ground level, 0.3 m, 1.3 m (breast height), at every 2.0 m from breast height to the base of the crown and at every 1.0 m in the crown section [30,33]. A total of 1374 sample discs were stored in plastic bags in the field to prevent loss of moisture before analysis. Discs were polished using a sanding machine with sandpaper numbers 40, 80 and 120 to make a flat surface and clarify the pattern of annual growth rings, and afterward, the crosscut discs were scanned with 1200 dpi resolution on a flatbed scanner (EPSON Perfection V370 Photo) to a digital file. In the scanned image of each of the crosscut discs, the radii of all annual tree growth rings from the inner bark to the pith in four cardinal directions marked in the field (north, east, south and west) were manually measured using imgviewer (self-made software). Annual tree growth ring data obtained from the crosscut discs were used to estimate the annual height growth based on a tree’s annual radial growth [34]. The stem analysis data including number of observations for DBH and tree height were 1745 and 1819, respectively (Figure 3), and were made for assessing tree growth curves.
Topographic conditions of the sample plots including coordinates and elevation (EV) were recorded with the aid of a global positioning system receiver (GPSMAP64, Garmin); slope gradient (SG, %) and slope direction (SD) were measured using a clinometer with SD scored as north (1), east (2), south (3) and west (4). The slope position (SP) was scored as bottom (1), lower (2), middle (3), upper (4) and crest (5). The slope form (SF) classes for this study included straight (S), concave (C) and convex (V) based on the general shape of the slope in both the vertical and horizontal directions [32], and SF categories were VV (1), vs. (2), VC (3), SV (4), SS (5), SC (6), CV (7), CS (8) and CC (9) to the reflect the soil water condition: convex slopes are drier than concave slopes in general.

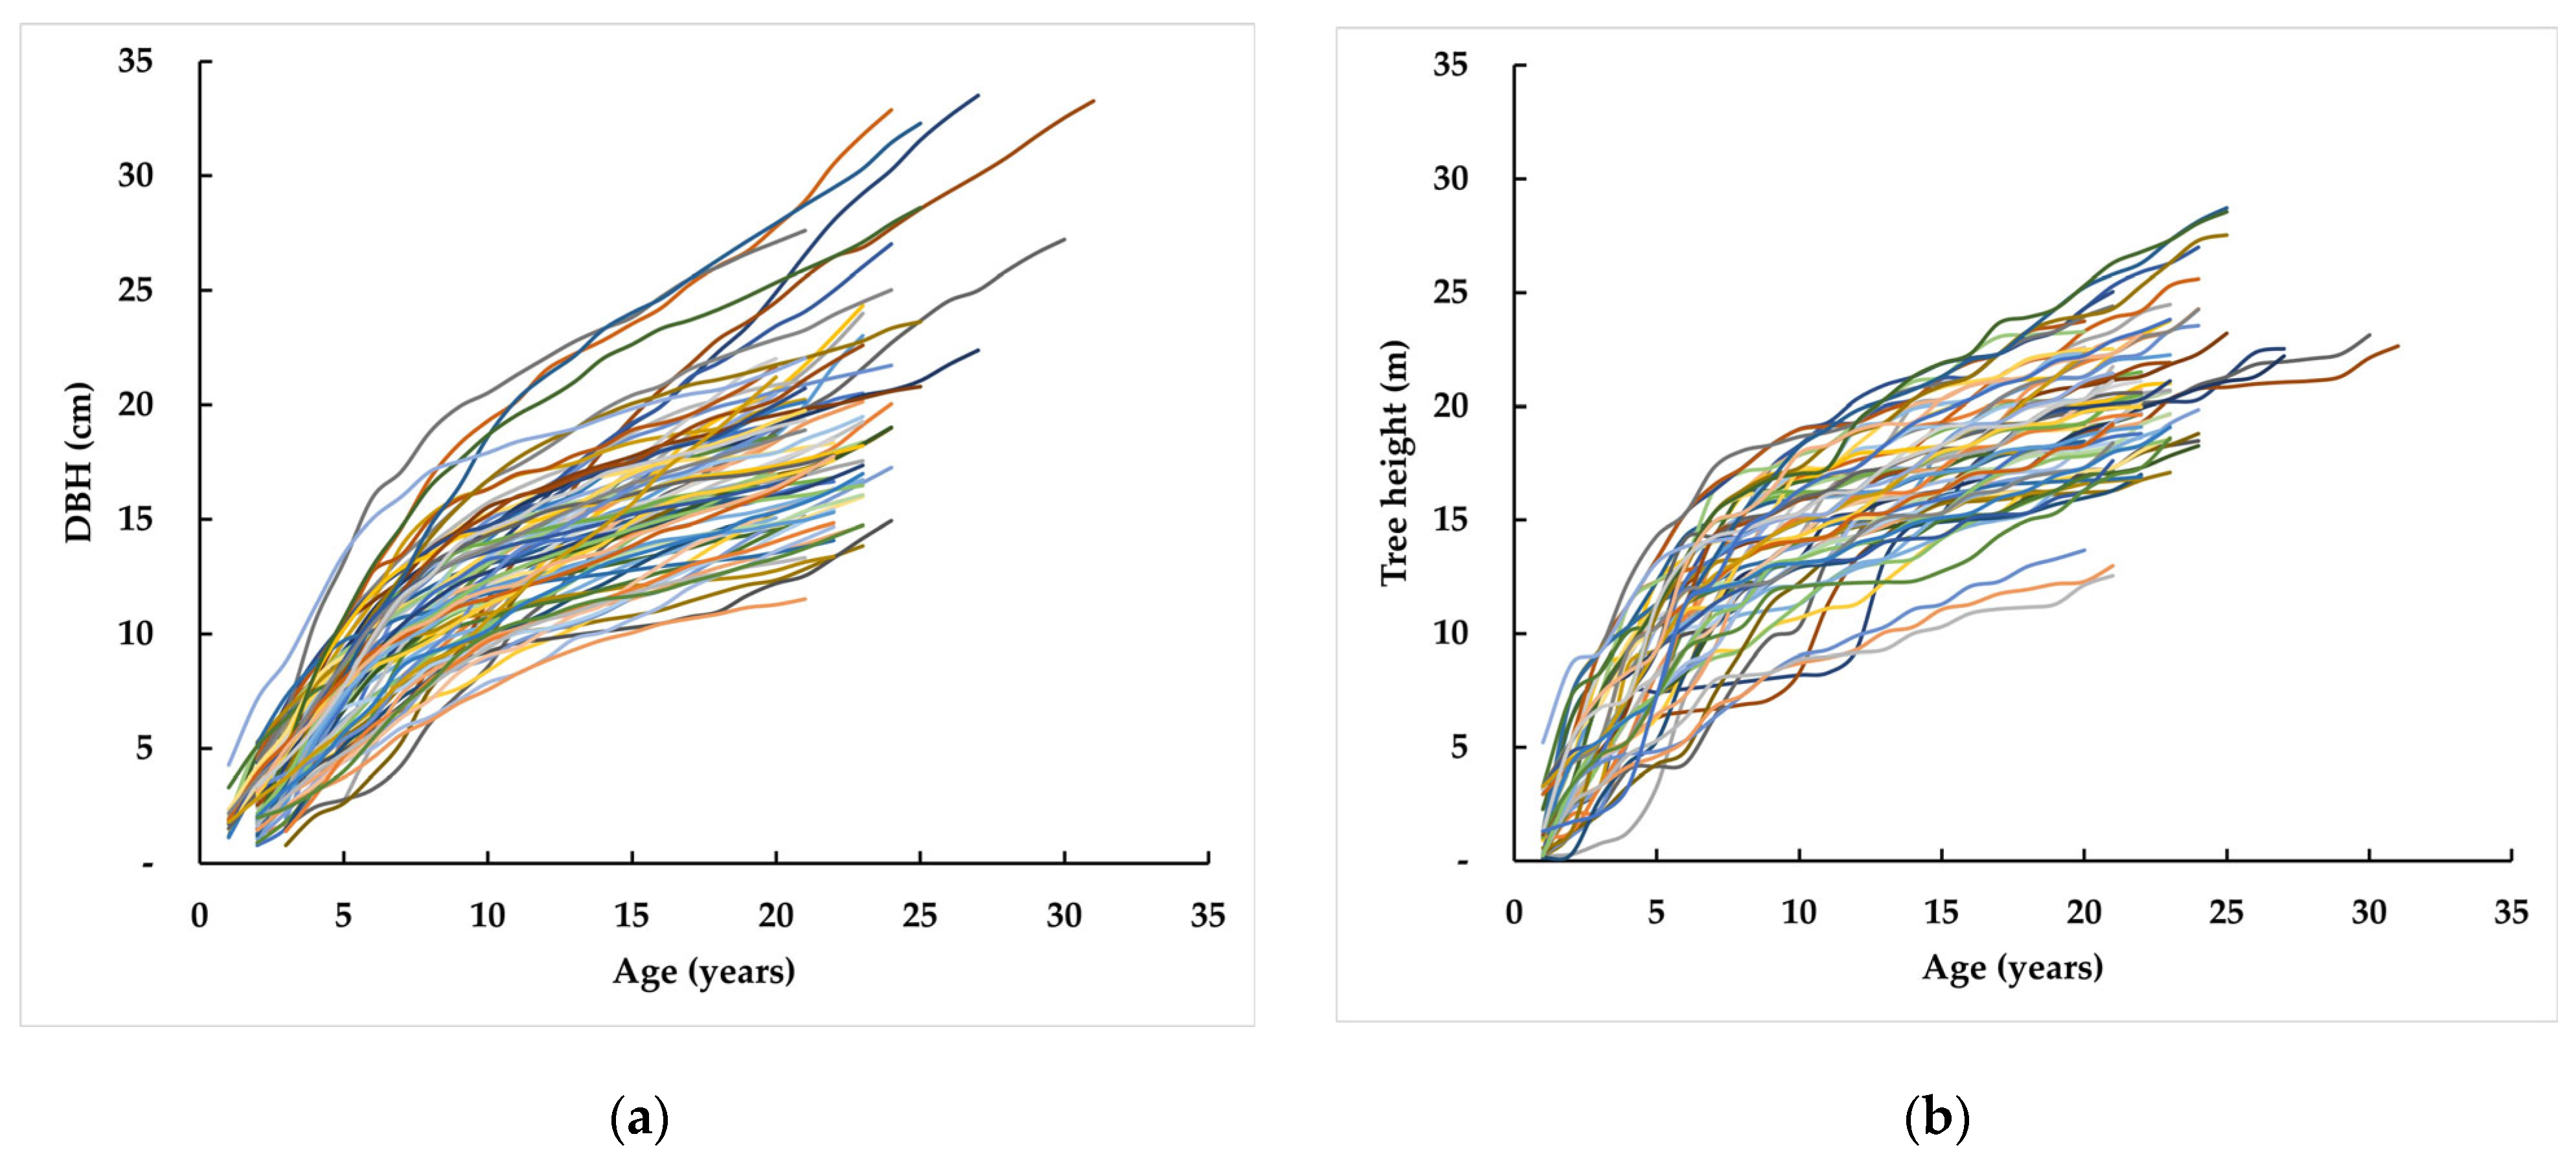
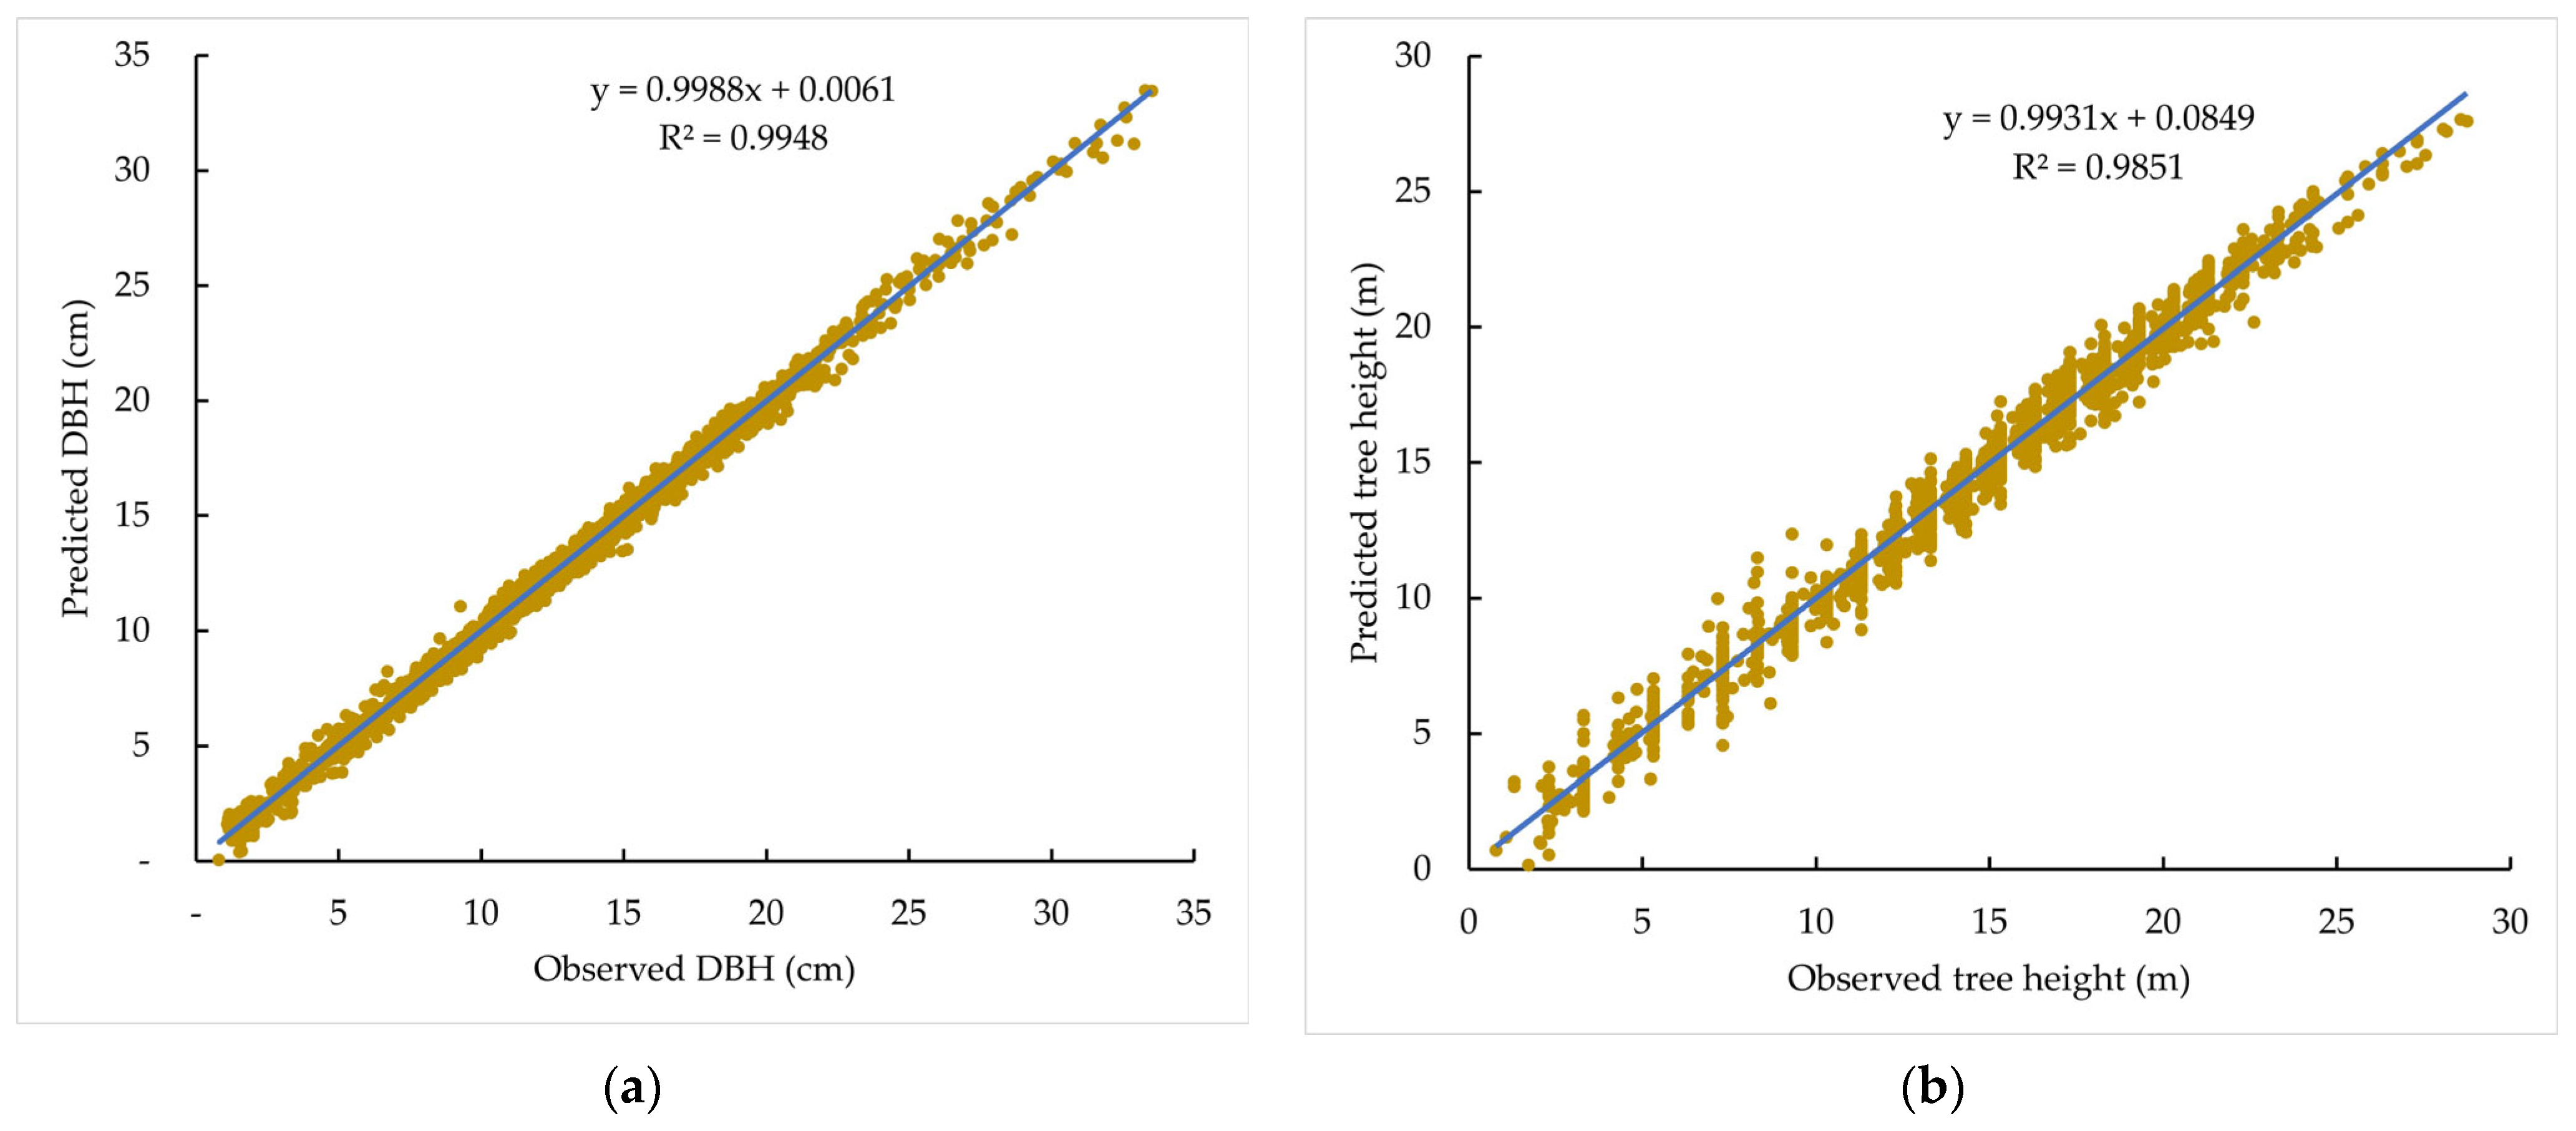
2.3. Assessing Tree Growth Curves

Several growth functions, such as Richards, Korf and Mitscherlich, have been used to investigate the tree height and DBH growth of tree species; all of these functions are optimal fitting models [35,36]. However, this study tested two functions, Mitscherlich (Equation (1)) and Richards (Equation (2)) [31], to assess tree growth curve parameters:
Y = A ( 1 exp ( k ( t i t 0 ) ) )
Y = A ( 1 exp ( k ( t i t 0 ) ) ) ( 1 1 m )
where Y is the predicted DBH (cm) or tree height (m) at age t i (years), A is the upper limit of tree growth, k is the curvature of tree growth curve or parameter related to growth rate, t 0 is the time lag of tree growth and m is the shape of growth or shape parameter; if m = 0, the Richards function (Equation (2)) will be the same as the Mitscherlich function (Equation (1)). Furthermore, “m” means “the inflection point of the growth curve”; when 0 < m < 1, the Richards function ranging Mitscherlich growth type. On the other hand, when m > 1, Richards function ranging logistic type [37,38]) are fitted tree growth curve parameters.
The Mitscherlich and Richards growth functions were fitted to the DBH–age and tree height–age relationships obtained from the stem analysis data (Figure 3) using the nonlinear regression function with the lowest values of RMSE (Equation (3)) in the Excel solver. The obtained parameters of tree growth curves and their performance are shown in Table 1 and Table A2 and Figure 4 and Figure 5, respectively.
RMSE = i 0 n ( y i y ^ ) 2 n
where RMSE is the root mean square error of the fitted tree growth curve, y i is the observed DBH or height, y ^ is the predicted DBH or height and n is the number of observations.

2.4. Data Analysis

The relationships between the 81 growth curve parameters of Equation (1) (Table 1) of the 27 sample plots and topographic condition variables (elevation, slope gradient, slope form, slope direction and slope position) were analysed by Spearman’s partial rank correlation analysis using R (version 4.0.3, R Core Team, Vienna, Austria) [39] with ppcor package [40] and the partial rank correlation network diagram using the qgraph package [41] in order to examine the effect of topographic conditions on the growth performance of planted teak trees.

3. Results

Both growth functions, Mitscherlich and Richards, were best fitted to stem analysis data (Figure 3), as the values of RMSE shown in the Table 1 and Table A2 and the values of the correlation coefficient shown in Figure 4 and Figure 5 indicate that there is an insignificant difference. However, it was difficult to consider the characteristics of the Richards growth function parameters, especially for the parameter m. Thus, we decided that using the Mitscherlich growth function to examine the relationship between the growth curve parameters and topographic conditions was more appropriate; Nagashima et al. [42] reported that height growth and diameter growth are supposed to follow the Mitscherlich growth process.
The results of Spearman’s partial rank correlation analysis indicated that the DBH–age curve parameters (Figure 6a and Table A3) and time lag of growth ( t 0 ) had significant negative correlations with slope position. Simultaneously, elevation showed a positive correlation (p < 0.05). Meanwhile, curvature of the growth curve (k) showed a significant positive correlation with slope form (p < 0.01). The upper limit of growth (A) had significant negative correlations with stand density (p < 0.01) and slope gradient (p < 0.05). Moreover, the results revealed that height–age curve parameters (Figure 6b and Table A4) for time lag of growth showed a significant positive correlation with slope gradient (p < 0.01) and curvature of growth curve (k) had a significant positive correlation with slope form (p < 0.01), while elevation (p < 0.05) and slope gradient (p < 0.01) had a negative correlation. Separately, the upper limit of growth (A) showed significant negative correlations with the stand density and slope gradient, while the slope form showed a significant positive correlation (p < 0.01).
The analysis results showed that DBH had a faster time lag of growth at higher slope positions with lower elevations. However, the growth rate was faster on concave slopes, and the upper limit of growth was greater at lower slope gradients along with lower stand densities. Tree height showed a faster time lag of growth with decreasing slope gradients. The growth rate was faster on gentle concave slopes, similar to the relationship with DBH, and was slower at higher elevations, unlike that of DBH. The upper limit of height growth was greater at lower slope gradients together with lower stand densities, similar to that of DBH, and on gentle slopes with concave shapes, unlike for DBH.

4. Discussion

Luang Prabang Province has a long history of planted teak spanning several decades [16,21]. At the same time, teak seed sources were established during the boom years of the 1990s and early 2000s. Nevertheless, these seed sources have been less utilised because the seed supply network has not been created [20,43]. On the contrary, the growers and seedling producers have used self-collected seeds and those bought from local seed collectors; normally, seeds are picked up from the ground from trees surrounding teak forest areas, which often contain unknown “mother” trees. Therefore, the seeds and seedlings are genetically unimproved and of unknown origin [16,43]. Apart from genetic issues, silvicultural management of planted teak (e.g., thinning and pruning) is uncommon due to the lack of economic return from small felled trees [44]. This might be the reason many teak growers have encountered low growth performance; for example, Kolmert [15], Keonakhone [17] and Dieters et al. [24] confirmed that the planted teak had fundamental differences, as the mean annual increment in volume ranged from 3.4 to 21.3 m3/hectare per year. This is because genetics [4,5,6,45] and effective silvicultural management systems (e.g., spacing, weeding, thinning and pruning) [7,8,17,22] affect teak growth and development; for example, Sreekanth [4] reported that genetic and morphological data in teak populations in India revealed that genetic distances and morphological characters had a positive correlation with the petiole shape and height of the tree. Larekeng et al. [45] also reported that morphophysiological analyses on teak in Indonesia showed that provenance significantly affected tree diameter and leaf area. Moreover, Pachas et al. [10] reported the effect of the initial spacing of planted teak on growth and development, showing that trees with a low stand density of 423 trees per hectare had a DBH of 24.5 cm, while those with a high stand density of 1659 tree per hectare had a DBH of 14.3 cm when the trees reached 10 years of age in Lao PDR. Jerez et al. [11] reported that two intensive thinning (50%) processes at ages 3 and 12 doubled DBH growth compared with no thinning treatment in Venezuela. However, our present study did not examine the effect of genetics and silvicultural practices, except for stand density control, on teak growth performance.
Apart from genetics and silvicultural management, environmental factors [1,2,11,46] are essential elements for teak growth and development. Teak achieves better growth and yield with proper soil conditions; Kolmert [15], for example, reported that soil properties affected teak growth. Despite this, teak had higher growing yield on flat land than steep slopes, but there was no significant difference with gentle slopes, while changes in nutrient status (Na, Ca, Mg, K, N, pH, cation exchange capacity and base saturation) did not produce notable differences. However, this study did not focus on various site factors, such as elevation, slope form and slope direction. Although several studies have examined the growth and yield of teak over the past decade, soil conditions were not considered [10,24]. Recently, Imaya et al. [23] established a soil suitability map for planted teak in northern Laos based on terrain characteristics, site characteristics and soil physicochemical properties, but they did not test the effect of topographic conditions on teak growth. Therefore, in the present study, we examined which topographic condition factors most influence the growth performance of planted teak.
We found that the upper asymptote of teak growth was greatest for stands in lower slope positions with a gentle slope (p < 0.01), while a concave slope increased the growth rate (p < 0.01) and the upper limit of the height growth (p < 0.01). These findings extend the reports of Kolmert [15] and Imaya et al. [23], confirming that a bottom (flat), foot slope with a gentle slope promotes higher growth of planted teak than other sites because these sites have re-sedimented deeper soil, accumulate soil organic matter and nutrients [1,2], and boast good drainage [47]. Further, Watanabe et al. [13] confirmed that teak growth was significantly correlated with volumetric water content and maximum water holding capacity, as soil moisture is an essential factor that controls the growth of teak. The present study results corroborated the findings of Vaides-Lopez et al. [47], who reported that terrain with a flat topography and a lower slope show the best growth and productivity and site elevation and slope are negatively correlated with teak growth variables. Notwithstanding, our results contradicted the findings of Watanabe et al. [13], who reported that the growth performance of planted teak had no significant correlation with site factors, particularly slope position and slope gradient for site elevations ranging from 134 to 460 m along with different parent material, groundwater and soil classifications.
Teak requires high light conditions [48,49]. The present study showed that a higher slope position, especially in the middle and upper slope, promoted a greater time lag of growth (p < 0.05), while shorter periods were needed to reach breast height (p < 0.01). In this study, the study area had complex landforms; the deep valley had shorter hours of sunlight in a day than upper slope positions. As confirmed by Dieters et al. [24], Pachas et al. [10] and Zahabu et al. [7], stand density has a significant effect on stem development, crown diameter and proportion of live and dead branches as a result of the inter-tree competition. Thus, the results for time lag of tree growth in this study might be due to the interaction of light requirement with initial high stocking density in upper slope positions (Table A1) [50,51].
Therefore, the present study indicates that teak exhibits good growth on gentle slopes, especially when the bottom and concave slope area might be influenced by soil moisture, although soil factors were not investigated in our study. Most remarkably, this is the first study to our knowledge to examine the effect of topographic conditions on growth performance.

5. Conclusions

The growth performance of planted teak is highly dependent on relevant environmental factors. In this study, we examined the relationship between growth performance and topographic conditions to clarify which topographic factors have the most influence. The result of the Spearman’s partial rank correlation indicated that the upper limit of the DBH and tree height growth ranged from 13.4 to 100.6 and from 16.2 to 33.0, respectively, showing significant negative correlations with the slope gradient and stand density, while the slope form showed a significant positive correlation with the upper limit of the tree height growth. The curvature of the DBH and tree height growth curves had significant positive correlations with slope form. Moreover, elevation and slope gradient showed significant negative correlations with the curvature of the tree height growth curve. However, the time lag of DBH growth had a significant negative correlation with the slope position, while the slope gradient was positively correlated with the time lag of the tree height growth. These analyses suggest that planted teak in this area has faster growth in lower slopes that also have a gentle concave slope. Our results, as scientific evidence, critically contribute to developing a long-term teak plantation management strategy to improve the economic potential of timber production for small-scale farmers. The high timber productivity of teak plantations is based on tree quality, tree size and heartwood characteristics. Therefore, further study of the effects of topographic conditions on heartwood characteristics is warranted.

Author Contributions

Conceptualisation, S.V., A.I. and K.Y.; methodology, S.V., K.Y. and A.I.; software, K.Y.; validation, K.Y., A.I. and S.V.; formal analysis, S.V. and K.Y.; investigation, S.V. and A.I.; resources, S.V. and A.I.; data curation, S.V.; writing—original draft preparation, S.V.; writing—review and editing, K.Y., A.I., C.T. and H.Y.; visualisation, S.V. and K.Y.; supervision, K.Y. and C.T.; project administration, A.I.; funding acquisition, A.I. and C.T. All authors have read and agreed to the published version of the manuscript.

Funding

This research was funded by project three on the development of forestry technologies for indigenous tree plantation on slopes in the Lao PDR, the Japan International Research Center for Agricultural Sciences (JIRCAS) and the National Agriculture and Forestry Research Institute (NAFRI) Collaboration Projects, Fiscal Year 2016–2020 under the aid of the government of Japan. In addition, this research and the APC were also funded by the scholarship of the Asian Satellite Campuses Institute Program (ASCI) under Nagoya University, Japan.

Data Availability Statement

The data is available on request from the corresponding author.

Acknowledgments

This research could not have been accomplished without support. Thus, we would like to express our sincere thanks to the JIRCAS and Nagoya University for providing the budget, equipment and technical guidelines for conducting the field survey and tree sampling. Furthermore, we are pleased to deliver our special thanks to the Forest Research Center staff at NAFRI for contributing their valuable time to assist with the sample disc processing work. In addition, we thank the local staff of Luang Prabang provincial Forestry Office, the District Agriculture and Forest Offices of Luang Prabang and Xieng Ngern for participating on our team during fieldwork.

Conflicts of Interest

The authors declare that they have no conflict of interest.

Appendix A

Table A1. Stand and topographic conditions of selected teak plantations. Stand age (SA); stand density (SDe); basal area (BA); total height (Ht); elevation (EV); slope gradient (SG); slope direction (SD), north (N), east (E), south (S), west (W); slope form (SF), straight (S), convex (V), concave (C); slope position (SP), bottom (BO), lower slope (LS), middle slope (MS), upper slope (US), crest (CR).
SiteSA (Years)SDe (Trees/ha)BA (m2/ha)Ht (m)EV (m)SG (%)SDSFSP
12381117.816.6 ± 5.628717SSVBO
223100522.818.6 ± 3.33086WSSBO
33152620.816.7 ± 4.630911ESSBO
423109618.315.6 ± 2.737620WSVU
523106531.519.9 ± 3.966717EVVLS
62098016.514.3 ± 2.465917SVVLS
72471032.521.4 ± 4.767117SVVMS
82189816.213.9 ± 4.151543ECCLS
92052513.617.6 ± 4.548560ECCLS
1023126424.517.2 ± 2.445915SCCLS
112473724.217.9 ± 4.240233ESVLS
122497819.615.7 ± 2.141250WVVMS
1324105920.816.5 ± 2.640562WCVLS
142087520.019.4 ± 3.73897NCCBO
152387526.322.1 ± 4.02926WCVBO
1624165017.612.9 ± 2.232345NCVLS
1722107519.516.4 ± 3.535040NCVMS
1822135018.314.2 ± 2.739034NCVUS
1922115026.317.6 ± 2.143227SCCLS
2022130026.817.2 ± 2.345221SCCMS
2123135031.217.3 ± 1.747323SCCUS
222557528.424.8 ± 6.16293EVVBO
232192513.511.1 ± 1.970723EVVUS
2423117528.616.7 ± 2.161045WCCUS
2521137528.216.6 ± 3.075811ECCCR
2622132521.914.5 ± 2.93864NVSBO
272175014.515.0 ± 4.63699NSCLS
Mean ± standard deviation.
Table A2. Individual tree growth curve parameters of Richards growth function. RMSE: root mean square error. A (upper limit of tree growth), k (curvature of tree growth curve or intrinsic growth speed), t 0 (initial tree growth) and m (shape of growth) are fitted tree growth curve parameters.
SiteDBH–AgeTree Height–Age
Akt0mRMSEAkt0mRMSE
127.18 ± 6.280.08 ± 0.032.21 ± 1.000.03 ± 0.050.36 ± 0.0623.98 ± 0.630.18 ± 0.050.56 ± 0.950.45 ± 0.400.74 ± 0.15
241.04 ± 18.650.05 ± 0.04 0.00 ± 0.000.00 ± 0.000.47 ± 0.1324.35 ± 2.970.11 ± 0.040.00 ± 0.000.00 ± 0.000.78 ± 0.21
386.23 ± 78.870.04 ± 0.030.45 ± 0.670.25 ± 0.220.46 ± 0.0530.45 ± 11.670.09 ± 0.070.00 ± 0.000.36 ± 0.331.06 ± 0.37
415.32 ± 1.200.14 ± 0.030.09 ± 0.160.00 ± 0.000.33 ± 0.1117.85 ± 1.160.23 ± 0.020.08 ± 0.120.17 ± 0.290.56 ± 0.07
522.02 ± 0.530.13 ± 0.021.59 ± 0.610.00 ± 0.000.33 ± 0.1325.37 ± 0.810.09 ± 0.001.06 ± 0.460.00 ± 0.000.61 ± 0.21
624.78 ± 8.280.06 ± 0.040.28 ± 0.480.00 ± 0.000.3 ± 0.0220.83 ± 2.730.08 ± 0.020.01 ± 0.010.00 ± 0.000.51 ± 0.06
734.74 ± 6.740.07 ± 0.020.04 ± 0.060.00 ± 0.000.54 ± 0.2627.15 ± 1.710.10 ± 0.010.00 ± 0.000.00 ± 0.000.74 ± 0.28
820.28 ± 1.160.18 ± 0.060.29 ± 0.250.33 ± 0.350.31 ± 0.0919.97 ± 1.250.16 ± 0.030.76 ± 0.670.07 ± 0.120.53 ± 0.16
925.25 ± 6.700.09 ± 0.040.37 ± 0.640.00 ± 0.000.53 ± 0.0822.19 ± 1.270.14 ± 0.010.24 ± 0.410.02 ± 0.040.63 ± 0.32
1018.85 ± 1.130.19 ± 0.060.18 ± 0.310.32 ± 0.300.31 ± 0.0420.37 ± 0.990.20 ± 0.030.40 ± 0.510.22 ± 0.170.44 ± 0.02
1119.59 ± 3.140.11 ± 0.030.63 ± 0.410.00 ± 0.000.54 ± 0.1621.64 ± 2.380.11 ± 0.010.21 ± 0.280.00 ± 0.000.65 ± 0.15
1219.75 ± 0.660.12 ± 0.060.82 ± 0.800.24 ± 0.420.33 ± 0.0817.57 ± 1.030.19 ± 0.030.94 ± 0.870.34 ± 0.310.52 ± 0.07
1322.18 ± 5.980.07 ± 0.030.74 ± 0.360.00 ± 0.000.37 ± 0.0520.8 ± 0.680.12 ± 0.010.58 ± 0.60.07 ± 0.120.65 ± 0.03
1419.29 ± 2.720.13 ± 0.03 0.00 ± 0.000.06 ± 0.110.26 ± 0.0424.58 ± 0.790.13 ± 0.010.04 ± 0.060.02 ± 0.030.53 ± 0.09
1523.8 ± 3.960.14 ± 0.010.37 ± 0.410.00 ± 0.000.5 ± 0.0824.08 ± 0.530.16 ± 0.010.03 ± 0.050.00 ± 0.000.68 ± 0.11
1613.35 ± 0.680.21 ± 0.04 0.00 ± 0.000.00 ± 0.000.48 ± 0.2116.16 ± 0.350.23 ± 0.020.00 ± 0.000.00 ± 0.000.68 ± 0.12
1727.45 ± 5.440.05 ± 0.030.22 ± 0.380.00 ± 0.000.19 ± 0.0722.17 ± 0.600.12 ± 0.010.00 ± 0.000.15 ± 0.140.45 ± 0.07
1816.46 ± 1.180.13 ± 0.040.32 ± 0.550.00 ± 0.000.42 ± 0.1019.37 ± 1.600.13 ± 0.040.05 ± 0.080.00 ± 0.000.53 ± 0.07
1916.57 ± 0.410.18 ± 0.061.38 ± 0.570.20 ± 0.170.32 ± 0.0919.75 ± 1.210.17 ± 0.011.32 ± 0.540.00 ± 0.000.66 ± 0.10
2016.39 ± 1.230.22 ± 0.031.15 ± 0.460.13 ± 0.210.36 ± 0.0719.63 ± 0.860.20 ± 0.010.81 ± 0.390.08 ± 0.130.58 ± 0.13
2119.51 ± 3.480.15 ± 0.050.59 ± 0.530.12 ± 0.210.35 ± 0.1821.39 ± 1.020.15 ± 0.020.54 ± 0.480.00 ± 0.000.66 ± 0.09
2230.12 ± 6.770.11 ± 0.031.54 ± 0.290.00 ± 0.000.44 ± 0.1631.17 ± 1.360.08 ± 0.000.27 ± 0.330.00 ± 0.000.78 ± 0.12
2317.44 ± 6.140.11 ± 0.02 0.00 ± 0.000.32 ± 0.040.26 ± 0.2416.13 ± 2.760.08 ± 0.020.00 ± 0.000.00 ± 0.000.37 ± 0.14
2418.34 ± 2.310.12 ± 0.030.65 ± 0.570.00 ± 0.000.30 ± 0.0821.04 ± 1.290.1 ± 0.000.08 ± 0.130.00 ± 0.000.53 ± 0.21
2518.18 ± 1.880.14 ± 0.050.03 ± 0.060.11 ± 0.150.38 ± 0.0817.92 ± 1.140.15 ± 0.000.00 ± 0.000.00 ± 0.000.64 ± 0.11
2659.8 ± 73.770.08 ± 0.070.23 ± 0.390.14 ± 0.250.33 ± 0.0821.24 ± 3.580.1 ± 0.010.00 ± 0.000.00 ± 0.000.78 ± 0.14
2720.08 ± 1.260.15 ± 0.05 0.00 ± 0.000.12 ± 0.210.38 ± 0.0721.69 ± 1.920.15 ± 0.030.00 ± 0.000.04 ± 0.080.88 ± 0.37
Total25.7 ± 23.270.12 ± 0.060.53 ± 0.690.09 ± 0.170.38 ± 0.1321.81 ± 4.330.14 ± 0.050.29 ± 0.500.07 ± 0.170.64 ± 0.20
Mean ± standard deviation; Larger t 0 values indicate slower initial tree growth.
Table A3. Spearman’s partial rank correlation matrix between DBH–age curve parameters and topographic conditions. Variable (VR). DBH–age curve parameters as upper limit of growth (A); curvature of tree growth curve (k); time lag of tree growth ( t 0 ). Stand density (SDE). Elevation (EV). Slope gradient (SG). Slope direction (SD). Slope form (SF). Slope position (SP).
VRAkt0SDEEVSDSFSGSP
A1
k−0.61 **1
t00.090.221
SDE−0.33 **−0.010.021
EV0.130.110.23 *−0.21
SD0.07−0.020.150.01−0.051
SF0.170.39 **−0.130.24 *−0.06−0.021
SG−0.23 *−0.210.2−0.24 *−0.180.070.28 *1
SP−0.12−0.04−0.25 *0.41 **0.60 **0.08−0.070.49 **1
* Correlation is significant at the 0.05 level (2-tailed); ** Correlation is significant at the 0.01 level (2-tailed).
Table A4. Spearman’s partial rank correlation matrix between height–age curve parameters and topographic conditions. Variable (VR). Height–age curve parameters as upper limit of growth (A); curvature of tree growth curve (k); time lag of tree growth ( t 0 ). Stand density (SDE). Elevation (EV). Slope gradient (SG). Slope direction (SD). Slope form (SF). Slope position (SP).
VRAkt0SDEEVSDSFSGSP
A1
k−0.61 **1
t00.200.201
SDE−0.41 **−0.100.051
EV−0.15−0.32 **0.06−0.221
SD0.140.210.220.010.061
SF0.41 **0.57 **−0.070.33 **0.15−0.171
SG−0.40 **−0.27 *0.34 **−0.32 **−0.220.060.33 **1
SP−0.100.05−0.170.38 **0.55 **0.07−0.070.45 **1
* Correlation is significant at the 0.05 level (2-tailed); ** Correlation is significant at the 0.01 level (2-tailed).

References

  1. Kaosa-ard, A. Teak its natural distribution and related factors. Nat. His. Bull. Siam. Soc. 1989, 29, 55–74. [Google Scholar]
  2. Tanaka, N.; Hamazaki, T.; Vacharangkura, T. Distribution, growth and site requirements of teak. Jpn. Agric. Res. Q. 1998, 32, 65–77. [Google Scholar]
  3. Kollert, W.; Kleine, M. CHAPTER 2: Introduction. In The Global Teak Study: Analysis, Evaluation and Future Potential of Teak Resources; Koller, W., Kleine, M., Eds.; International Union of Forest Research Organizations (IUFRO): Vienna, Austria, 2017; pp. 15–16. [Google Scholar]
  4. Sreekanth, P.M.; Balasundaran, M.; Nazeem, P.A. Genetic and morphological variation in natural teak (Tectona grandis) populations of the Western Ghats in Southern India. J. For. Res. 2014, 25, 805–812. [Google Scholar] [CrossRef]
  5. Goh, D.K.S.; Japarudin, Y.; Alwi, A.; Lapammu, M.; Flori, A.; Monteuuis, O. Growth differences and genetic parameter estimates of 15 teak (Tectona grandis L.f.) genotypes of various ages clonally propagated by microcuttings and planted under humid tropical conditions. Silvae Genet. 2013, 62, 196–206. [Google Scholar] [CrossRef] [Green Version]
  6. Hidayati, F.; Ishiguri, F.; Iizuka, K.; Makino, K.; Tanabe, J.; Marsoem, S.N.; Na’iem, M.; Yokota, S.; Yoshizawa, N. Growth characteristics, stress-wave velocity, and Pilodyn penetration of 15 clones of 12-year-old Tectona grandis trees planted at two different sites in Indonesia. J. Wood Sci. 2013, 59, 249–254. [Google Scholar] [CrossRef]
  7. Zahabu, E.; Raphael, T.; Chamshama, S.A.O.; Iddi, S.; Malimbwi, R.E. Effect of Spacing Regimes on Growth, Yield, and Wood Properties of Tectona grandis at Longuza Forest Plantation, Tanzania. Int. J. For. Res. 2015, 2015, 1–6. [Google Scholar]
  8. Pérez, D.; Kanninen, M. Effect of thinning on stem form and wood characteristics of teak (Tectona grandis) in a humid tropical site in Costa Rica. Silva Fenn. 2005, 39, 217–225. [Google Scholar] [CrossRef] [Green Version]
  9. Víquez, E.; Pérez, D. Effect of Pruning on Tree Growth, Yield, and Wood Properties of Tectona grandis Plantations in Costa Rica. Silva Fenn. 2005, 39, 381–390. [Google Scholar] [CrossRef]
  10. Pachas, A.N.A.; Sakanphet, S.; Soukkhy, O.; Lao, M.; Savathvong, S.; Newby, J.C.; Souliyasack, B.; Keoboualapha, B.; Dieters, M.J. Initial spacing of teak (Tectona grandis) in northern Lao PDR: Impacts on the growth of teak and companion crops. For. Ecol. Manag. 2019, 435, 77–88. [Google Scholar] [CrossRef]
  11. Jerez, M.; Coutinho, S. CHAPTER 5.1: Establishment and Management of Planted Teak Forests. In The Global Teak Study: Analysis, Evaluation and Future Potential of Teak Resources; Koller, W., Kleine, M., Eds.; International Union of Forest Research Organizations (IUFRO): Vienna, Austria, 2017; pp. 49–65. [Google Scholar]
  12. Kokutse, A.D.; Stokes, A.; Kokutse, N.K.; Kokou, K. Which factors most influence heartwood distribution and radial growth in plantation teak? Ann. For. Sci. 2010, 67, 10. [Google Scholar] [CrossRef]
  13. Watanabe, Y.; Owusu-Sekyere, E.; Masunaga, T.; Buri, M.M.; Oladele, O.I.; Wakatsuki, T. Teak (Tectona grandis) growth as influenced by soil physicochemical properties and other site conditions in Ashanti region, Ghana. J. Food Agric. Environ. 2010, 8, 1040–1045. [Google Scholar]
  14. Gogate, M.G.; Subramanian, K.; Ahmad, T.; Bhagat, S. Quality Timber Products from Teak Through Sustainable Forest Management in Maharashtra State, India. In Quality Timber Products of TEAK from Sustainable Forest Manage; Bhat, K.M., Nair, K.K., Bhat, K., Muralidharan, E.M., Sharma, J.K., Eds.; Kerala Forest Research Institute: Kerala, India, 2003; Volume 4, pp. 19–23. [Google Scholar]
  15. Kolmert, A. Teak in Northern Laos; Swedish University of Agricultural Sciences: Uppsala, Sweden, 2001. [Google Scholar]
  16. Hansen, P.K.; Sodarak, H.; Savathvong, S. Teak Production by Shifting Cultivators in Northern Lao PDR; Lao Swedish Forest Program: Luangprabang, Laos, 1997. [Google Scholar]
  17. Keonakhone, T. A Holistic Assessment of the Use of Teak at a Landscape Level in Luang Phrabang, Lao PDR. Master’s Thesis, Swedish University of Agricultural Sciences, Uppsala, Sweden, 2005. [Google Scholar]
  18. Phimmavong, S.; Ozarska, B.; Midgley, S.; Keenan, R. Forest and plantation development in Laos: History, development and impact for rural communities. Int. For. Rev. 2009, 11, 501–513. [Google Scholar] [CrossRef]
  19. Boer, K.; Seneanachack, H. Mapping and Characterisation of Plantation Teak in Luang Prabang Province, Lao PDR; Australian Centre for International Agricultural Research: Canberra, Australia, 2016.
  20. Pachas, A.N.A.; Sakanphet, S.; Midgley, S.; Dieters, M. Teak (Tectona grandis) silviculture and research: Applications for smallholders in Lao PDR. Aust. For. 2019, 82, 94–105. [Google Scholar] [CrossRef] [Green Version]
  21. Midgley, S.; Blyth, M.; Mounlamai, K.; Midgley, D.; Brown, A. Towards Improving Profitability of Teak in Integrated Smallholder Farming Systems in Northern Laos; Australian Centre for International Agricultural Research: Canberra, Australia, 2007.
  22. Kanninen, M.; Pérez, D.; Montero, M.; Víquez, E. Intensity and timing of the first thinning of Tectona grandis plantations in Costa Rica: Results of a thinning trial. For. Ecol. Manag. 2004, 203, 89–99. [Google Scholar] [CrossRef]
  23. Imaya, A.; Vongkhamho, S.; Sikhot, P. Soil suitability map for planted Teak (Tectona grandis L. f.) stand growth in the mountainous area of northern Lao People’s Democratic Republic. In Potential and Efficiency of Underused Agricultural and Fishery Resources in Laos; Morioka, S., Hasada, K., Eds.; Japan International Research Center for Agriculture Sciences (JIRCAS): Tsukuba, Japan, 2020; pp. 53–63. [Google Scholar]
  24. Dieters, M.; Newby, J.; Cramb, R.; Sexton, G. Enhancing on-Farm Incomes through Improved Silvicultural Management of Teak in Luang Prabang Province of Lao PDR; Australian Centre for International Agricultural Research: Canberra, Australia, 2014.
  25. Minoche, D.; Herrero, C.; Dominguez-Dominguez, M.; Martinez-Zurimendi, P. Determining the site index of Teak (Tectona grandis L.) plantations in Tabasco, Mexico. Cienc. E Investig. Agrar. 2017, 44, 154–167. [Google Scholar] [CrossRef] [Green Version]
  26. Vacharangkura, T. Variable density yield model for Teak plantations in the Northeast Thailand. In Approach to Sustainable Forestry of Indigenous Tree Species in Northeast Thailand Approach to Sustainable Forestry of Indigenous Tree Species in Northeast Thailand; Noda, I., Tosporn, V., Woraphun, H., Eds.; Japan International Research Center for Agricultural Sciences (JIRCAS): Tsukuba, Japan, 2012; pp. 33–40. [Google Scholar]
  27. Midgley, S.; Mounlamai, K.; Flanagan, A.; Phengsopha, K. Global Markets for Plantation Teak; Implications for Growers in Lao PDR; Australian Centre for International Agricultural Research: Canberra, Australia, 2015.
  28. Lao Statistic Bureau. Weather Statistic of Luang Prabang Province (2008–2017); Ministry of Natural Resources and Environment: Vientiane, Lao PDR, 2018.
  29. Lao Geographic Information System Unit. Mekong Geographic Information System Data; Department of Agricultural Land Management, Ministry of Agriculture and Forestry: Vientiane, Laos, 2020.
  30. Perez, D. Growth and volume equations developed from STEM analysis for Tectona grandis in Costa Rica. J. Trop. For. Sci. 2008, 20, 66–75. [Google Scholar]
  31. Nagumo, H.; Minowa, M. Sokujugaku [Dendrometry]; Chikyusha: Tokyo, Japan, 1990. [Google Scholar]
  32. Food and Agriculture Organization of the United Nations. Guidelines for Soil Description, 4th ed.; The Food and Agriculture Organization: Rome, Italy, 2006; pp. 9–19. [Google Scholar]
  33. Miranda, I.; Sousa, V.; Pereira, H. Wood properties of teak (Tectona grandis) from a mature unmanaged stand in East Timor. J. Wood Sci. 2011, 57, 171–178. [Google Scholar] [CrossRef]
  34. Kariuki, M. Height estimation in complete stem analysis using annual radial growth measurements. Forestry 2002, 75, 63–74. [Google Scholar] [CrossRef]
  35. Liao, C.Y.; Podráský, V.V.; Liu, G.B. Diameter and height growth analysis of White Pine trees in the area of Kostelec nad Černými lesy. J. For. Sci. 2003, 49, 544–551. [Google Scholar] [CrossRef] [Green Version]
  36. Luo, J.; Zhang, M.; Zhou, X.; Chen, J.; Tian, Y. Tree Height and DBH Growth Model Establishment of Main Tree Species in Wuling Mountain Small Watershed. IOP Conf. Ser. Earth Environ. Sci. 2018, 108, 042003. [Google Scholar] [CrossRef]
  37. Osumi, S.; Ishikawa, Y. Applicability of the RICHARDS’ growth function to analysis of growth of tree. Sci. Rep. Kyoto Prefect. Univ. Agric. 1983, 35, 49–76. [Google Scholar]
  38. Shimojo, M.; Nakano, Y.; Tobisa, M.; Shao, T. Deriving Five Growth Functions from Bertalanffy Function based on Symmetry and Complexity. J. Fac. Agric. Kyushu Univ. 2012, 57, 151–152. [Google Scholar] [CrossRef]
  39. Core Team, R. R: A Language and Environment for Statistical Computing; R Foundation for Statistical Computing: Vienna, Austria, 2020. [Google Scholar]
  40. Kim, S. Ppcor: An R Package for a Fast Calculation to Semi-partial Correlation Coefficients. Commun. Stat. Appl. Methods. 2015, 22, 665–674. [Google Scholar] [CrossRef] [PubMed] [Green Version]
  41. Friedman, J.; Hastie, T.; Tibshirani, R. Glasso: Graphical Lasso-Estimation of Gaussian Graphical Models. R Package Version 1.7. 2011. Available online: http://CRAN.R-project.org/package=glasso (accessed on 11 January 2021).
  42. Nagashima, I.; Inada, M. Stem Form Based on the MITSCHERLICH Growth Process. J. Jpn. For. Soc. 1987, 68, 10–15. [Google Scholar]
  43. Phongoudome, C.; Vongprasouvanh, S.; Ketphanh, S.; Vongkhamho, S.; Bounithiphon, C. Assessment on National and Regional Research Regarding Tree Species and Silviculture Techniques in Plantation Programs; National Agriculture and Forestry Research Institute, Ministry of Agriculture and Forestry: Vientiane, Laos, 2012.
  44. Newby, J.C.; Cramb, R.A.; Sakanphet, S.; McNamara, S. Smallholder Teak and Agrarian Change in Northern Laos. Small Scale For. 2012, 11, 27–46. [Google Scholar] [CrossRef]
  45. Larekeng, S.H.; Restu, M.; Arsyad, M.A.; Dermawan, R. Morphophysiological analyses on Teak (Tectona grandis Linn. f.) from three provenances. IOP Conf. Ser. Earth Environ. Sci. 2019, 235, 012048. [Google Scholar] [CrossRef] [Green Version]
  46. Rugmini, P.; Balagopalan, M.; Jayaraman, K. Modelling the Growth of Teak in Relation to Soil Conditions in the Kerala Part of the Western Ghats; Kerala Forest Research Institute: Kerala, India, 2007. [Google Scholar]
  47. Vaides-Lopez, E.; Alvarado, A.; Moya, R. Site characteristics that determine the growth and productivity of teak (Tectona grandis l. F.) of young plantations in Guatemala. Agron. Costarric. 2019, 43, 135–148. [Google Scholar]
  48. Kadambi, K. Silviculture and Management of Teak; School of Forestry, Stephen F. Austin State University: Nacogdoches, TX, USA, 1972. [Google Scholar]
  49. Kaosa-ard, A. Overview of Problems in Teak Plantation Establishment. In Teak for the Future; Kashio, M., White, K., Eds.; Food and Agriculture Organization, Regional Office for Asia and the Pacific: Bangkok, Thailand, 1998; pp. 49–60. [Google Scholar]
  50. Roder, W.; Keoboualapha, B.; Manivanh, V. Teak (Tectona grandis), fruit trees and other perenials used by hill farmers of northern Laos. In Slash-and-Burn Rice Systems in the Hills of Northern Lao PDR: Description, Challenges, and Opportunities in the Hills of Northern Lao PDR; Roder, W., Ed.; International Rice Research Institute: Los Banos, Phillippines, 2001; pp. 212–226. [Google Scholar]
  51. Vongkhamho, S.; Imaya, A.; Takenaka, C.; Yamamoto, K.; Yamamoto, H. Correlations among tree quality, stand characteristics, and site characteristics in plantation teak in mountainous areas of Lao PDR. Forests 2020, 11, 777. [Google Scholar] [CrossRef]
Figure 1. Research area showing transect line and sample plantation locations (left) and location within Lao PDR (right). Source: Drawn by the authors based on Mekong Geographic Information Systems data [29]. DEM, digital elevation model.
Forests 13 00118 g001
Figure 2. Relationship between tree height and age for 183 sample trees from 61 teak plantations (three trees per plot) located along the transect line. The solid line (Mitscherlich) and dashed line (Richards) indicate the tree height–age curve plotted according to the Mitscherlich (Equation (1)) and Richards (Equation (2)) growth functions.
Forests 13 00118 g002
Figure 3. Stem analysis profile plots; DBH versus age (a); tree height versus age (b).
Forests 13 00118 g003
Figure 4. Predicted tree size using Mitscherlich growth function; relationship between predicted DBH and observed DBH (a), between predicted tree height and observed tree height (b). R2 is the correlation coefficient.
Forests 13 00118 g004
Figure 5. Predicted tree size using Richards growth function; relationship between predicted DBH and observed DBH (a), between predicted tree height and observed tree height (b). R2 is the correlation coefficient.
Forests 13 00118 g005
Figure 6. Partial correlation network between DBH–age growth curve parameters and topographic conditions (a) and height–age growth curve parameters and topographic conditions (b). The green and red lines indicate positive and negative correlations, respectively. The line thickness indicates the strength of the Spearman’s partial rank correlation. The letters in white circles indicate variables of tree growth parameters A, k, t 0 ; stand density (SDE) and topographic conditions elevation (EV), slope gradient (SG), slope direction (SD), slope form (SF) and slope position (SP).
Forests 13 00118 g006
Table 1. Individual tree growth curve parameters of Mitscherlich growth function. RMSE: root mean square error. A (upper limit of tree growth), k (curvature of tree growth curve or parameter related to growth rate) and t 0 (time lag of tree growth) are fitted tree growth curve parameters.
SiteDBH–AgeHeight–Age
Ak t 0 RMSEAk t 0 RMSE
127.42 ± 6.050.07 ± 0.022.25 ± 0.980.36 ± 0.0726.16 ± 2.500.11 ± 0.022.11 ± 0.560.83 ± 0.08
241.04 ± 18.660.05 ± 0.040.00 ± 0.000.47 ± 0.1324.35 ± 2.970.11 ± 0.040.00 ± 0.000.78 ± 0.21
3100.58 ± 69.050.02 ± 0.011.51 ± 1.280.56 ± 0.1632.98 ± 11.050.06 ± 0.031.29 ± 1.381.18 ± 0.25
415.34 ± 1.200.14 ± 0.030.09 ± 0.160.35 ± 0.1117.91 ± 0.950.21 ± 0.020.64 ± 0.690.58 ± 0.07
522.02 ± 0.530.13 ± 0.021.59 ± 0.610.33 ± 0.1325.37 ± 0.810.09 ± 0.001.06 ± 0.460.61 ± 0.21
624.78 ± 8.280.06 ± 0.040.28 ± 0.480.30 ± 0.0220.83 ± 2.730.08 ± 0.020.01 ± 0.010.51 ± 0.06
734.74 ± 6.740.07 ± 0.020.04 ± 0.060.54 ± 0.2627.15 ± 1.710.10 ± 0.010.00 ± 0.000.74 ± 0.28
821.56 ± 1.290.13 ± 0.041.22 ± 0.870.43 ± 0.1220.17 ± 1.190.15 ± 0.030.89 ± 0.770.53 ± 0.15
925.25 ± 6.700.09 ± 0.040.37 ± 0.640.53 ± 0.0822.28 ± 1.420.13 ± 0.000.27 ± 0.390.63 ± 0.32
1019.33 ± 0.700.14 ± 0.020.99 ± 0.640.39 ± 0.0620.65 ± 1.130.17 ± 0.020.84 ± 0.480.46 ± 0.03
1119.59 ± 3.140.11 ± 0.030.63 ± 0.410.54 ± 0.1621.64 ± 2.380.11 ± 0.010.21 ± 0.280.65 ± 0.15
1220.92 ± 1.390.09 ± 0.011.87 ± 1.150.39 ± 0.1418.25 ± 1.630.15 ± 0.032.02 ± 0.680.56 ± 0.11
1322.18 ± 5.980.07 ± 0.030.74 ± 0.360.37 ± 0.0521.12 ± 1.180.11 ± 0.020.78 ± 0.360.65 ± 0.03
1419.45 ± 2.620.12 ± 0.030.14 ± 0.240.27 ± 0.0424.70 ± 0.880.12 ± 0.010.06 ± 0.050.53 ± 0.09
1523.80 ± 3.960.14 ± 0.010.37 ± 0.410.50 ± 0.0824.08 ± 0.530.16 ± 0.010.03 ± 0.050.68 ± 0.11
1613.35 ± 0.680.21 ± 0.040.00 ± 0.000.48 ± 0.2116.16 ± 0.350.23 ± 0.020.00 ± 0.000.69 ± 0.12
1727.45 ± 5.440.05 ± 0.030.22 ± 0.380.19 ± 0.0722.89 ± 0.830.10 ± 0.020.44 ± 0.400.46 ± 0.08
1816.46 ± 1.180.13 ± 0.040.32 ± 0.550.42 ± 0.1019.37 ± 1.600.13 ± 0.040.05 ± 0.080.53 ± 0.07
1916.80 ± 0.510.15 ± 0.041.72 ± 0.270.34 ± 0.1019.75 ± 1.210.17 ± 0.011.32 ± 0.540.66 ± 0.10
2016.50 ± 1.250.20 ± 0.011.40 ± 0.280.37 ± 0.0719.71 ± 0.750.19 ± 0.010.96 ± 0.400.58 ± 0.13
2119.68 ± 3.350.14 ± 0.030.82 ± 0.170.38 ± 0.1521.39 ± 1.020.15 ± 0.020.54 ± 0.480.66 ± 0.09
2230.12 ± 6.770.11 ± 0.031.54 ± 0.290.44 ± 0.1631.17 ± 1.360.08 ± 0.000.27 ± 0.330.78 ± 0.12
2320.22 ± 8.900.08 ± 0.020.84 ± 0.240.32 ± 0.2416.15 ± 2.760.08 ± 0.020.00 ± 0.000.37 ± 0.14
2418.34 ± 2.310.12 ± 0.030.65 ± 0.570.30 ± 0.0821.04 ± 1.290.10 ± 0.000.08 ± 0.130.53 ± 0.21
2518.35 ± 1.810.13 ± 0.030.23 ± 0.260.38 ± 0.0817.92 ± 1.140.15 ± 0.000.00 ± 0.000.64 ± 0.11
2660.24 ± 73.380.06 ± 0.050.65 ± 0.630.34 ± 0.1121.24 ± 3.580.10 ± 0.010.00 ± 0.000.78 ± 0.14
2720.36 ± 1.290.14 ± 0.050.32 ± 0.560.40 ± 0.0421.80 ± 2.100.15 ± 0.030.10 ± 0.180.89 ± 0.37
Total26.51 ± 23.970.11 ± 0.050.77 ± 0.790.40 ± 0.1422.08 ± 4.560.13 ± 0.040.52 ± 0.720.65 ± 0.21
Mean ± standard deviation; Larger t 0 values indicate slower time lag of tree growth.
Publisher’s Note: MDPI stays neutral with regard to jurisdictional claims in published maps and institutional affiliations.

