Article

Maxent Modelling Predicts a Shift in Suitable Habitats of a Subtropical Evergreen Tree (Cyclobalanopsis glauca (Thunberg) Oersted) under Climate Change Scenarios in China

1
College of Geography and Environmental Science, Henan University, Kaifeng 475004, China
2
National Demonstration Center for Environment and Planning, Henan University, Kaifeng 475004, China
*
Author to whom correspondence should be addressed.
Submission received: 18 October 2021 / Revised: 5 January 2022 / Accepted: 14 January 2022 / Published: 16 January 2022

Abstract

:
Climate change has caused substantial shifts in the geographical distribution of many species. There is growing evidence that many species are migrating in response to climate change. Changes in the distribution of dominant tree species induced by climate change can have an impact not only on organisms such as epiphytes and understory vegetation, but also on the whole ecosystem. Cyclobalanopsis glauca is a dominant tree species in the mingled evergreen and deciduous broadleaf forests of China. Understanding their adaptive strategies against climate change is important for understanding the future community structure. We employed the Maxent framework to model current suitable habitats of C. glauca under current climate conditions and predicted it onto the climate scenarios for 2041–2060 and 2081–2100 using 315 occurrence data. Our results showed that annual precipitation was the most critical factor for the distribution of C. glauca. In the future, increasing precipitation would reduce the limitation of water on habitats, leading to an expansion of the distribution to a higher latitude and higher altitude. At the same time, there were habitat contractions at the junction of the Jiangxi and Fujian Provinces. This study can provide vital information for the management of C. glauca, and serve as a reminder for managers to protect C. glauca in the range contraction areas.

1. Introduction

Climate is the most important ecological factor affecting plant distribution [1]. Climate change has become an increasingly important driver of species distribution shifts, inevitably affecting species composition and richness [2], and influencing ecosystem structure and functions [3,4,5,6]. In recent years, climate change driven by rapid anthropogenic disturbances is affecting the abundance and distribution of species [7]. Therefore, plants respond to climate change by changing their distribution, such as by migrating to higher latitudes or higher elevations to track suitable environment conditions [8,9,10]. Otherwise, they may face extinction [11]. Studies from both North America [12] and Europe [13] have shown that tree species would move north in the future under climate change. The intensifying changes in the climate have increased the vulnerability and the possibility of extinction in some plant species [14], leading to the extinction of nearly one-quarter of the world’s species [15,16]. In the face of this crisis, knowledge about the change in species distribution and the strategies to protect the species is becoming more important.
Different species respond differently to climate change. Many species have shifted their geographic distributions to higher latitudes and higher elevations to avoid local or global extinction in response to the decrease in suitable habitats under climate change [14]. Researchers undertook a meta-analysis to estimate latitudinal and elevational range shifts of species and found that 764 individual species from 17 taxonomic groups showed a shift to higher latitudes at a median rate of 16.9 km/decade, and 1367 species from 18 taxonomic groups showed a shift to higher elevations at a median rate of 11 m/decade [8]. A study of 14 European tree species showed that 12 tree species among them would move northward under climate warming; meanwhile, most of these species would face severe habitat contraction [13]. Another study modelled 1996 woody plant species distributed in Yunnan Province, China; although only 6% of them were predicted to become extinct, 70% of the species would lose more than one third of their current distribution ranges under the most extreme climate change scenario for the years 2070–2099 [17].
In recent years, species distribution models (SDMs) have been utilized to simulate species distributions by establishing relationships between species occurrences and environmental factors [18,19]. By incorporating future climate data under different climate change scenarios into models, the potential distributions of suitable habitats can be predicted and habitat suitability can be evaluated [20,21]. Various SDMs have been used to make these predictions more precise, including Domain Model [22], Ecological Niche Factor Analysis (ENFA) [23], Bioclimatic Prediction System (Bioclim) [24], Genetic Algorithm for Rule-set Production (GARP) [25], and Maximum Entropy Model (Maxent) [26]. SDMs have been used to forecast changes in species suitable habitats [27,28], access habitat suitability [29,30] and extinction risk [17], estimate the spatial variation of species richness [31], and determine possible migration directions under future scenarios [32]. Among these, Maxent is a very prevalent and widely accepted tool for species distribution modelling. Phillips et al. (2006) performed a case study using two Neotropical mammals (Bradypus variegatus and Microryzomys minutus) to compare the efficacy of Maxent with GARP, and showed that Maxent outperformed GARP [32]. Elith et al. (2006) compared 16 SDMs over 226 species and also showed that Maxent performed better [33]. Maxent is suitable for all existing applications involving presence-only datasets and is suitable even with a small sample size [34]. Moreover, Maxent uses a receiver operating characteristic curve (ROC) analysis to evaluate model performance [35]. Recently, many research studies have employed Maxent to predict the species future potential distribution change affected by climate change [19,36].
Cyclobalanopsis glauca (Thunberg) Oersted is a typical subtropical evergreen tree. C. glauca is thermophilic, hygrophilous, cold-resistant, shade-enduring, and has a strong adaptability to environmental change [37]. The species is distributed in central and south-eastern of Yunnan, Jingxi, Debao of Guangxi, northern Guangdong, southern Fujian, and Mount Yu of Taiwan in China [38]. C. glauca represents the dominant tree species or constructive species in the mingled evergreen and deciduous broadleaf forests. It is reported that dominant tree species have an effect on nutrient cycling [39], light availability [40], and microclimate [41]. Hence, the changes in dominant tree distributions induced by climate change can not only affect organisms that depend on dominant species, such as epiphytes and understory vegetation, but also alter ecosystem function [3]. For example, the stand diversity level and composition of bryophyte assemblages were correlated to dominant tree species diversity and composition [39]. The change of dominant species had an effect on the herbaceous layer composition mainly through their litter quality, and the canopy density enhanced species diversity in favor of indifferent herb species [39,42]. Therefore, changes in the distribution pattern of C. glauca caused by climate change may alter not only the dependent species, but also the entire ecosystem. We need to focus on how are the suitable habitats of C. glauca changing and what the impact is of these changes. It was predicted using GLM, GAM, and CART models that its geographical distribution in China would shift to the northwest under the influence of climate change; however, they focused more on the comparison of the three species distribution models [43]. Therefore, its elevational movement range and the climatic factors that led to the habitat changes remain undetermined. To evaluate the properties of suitable habitats and environmental factors affecting the suitability of those habitats, we predicted the potential distribution of C. glauca in China. We aimed to (a) project the potential climate change impacts on the suitable habitats of C. glauca, (b) determine the climatic factors that affect habitat change, (c) and determine the latitudinal and elevational migration range under climate change.

2. Materials and Methods

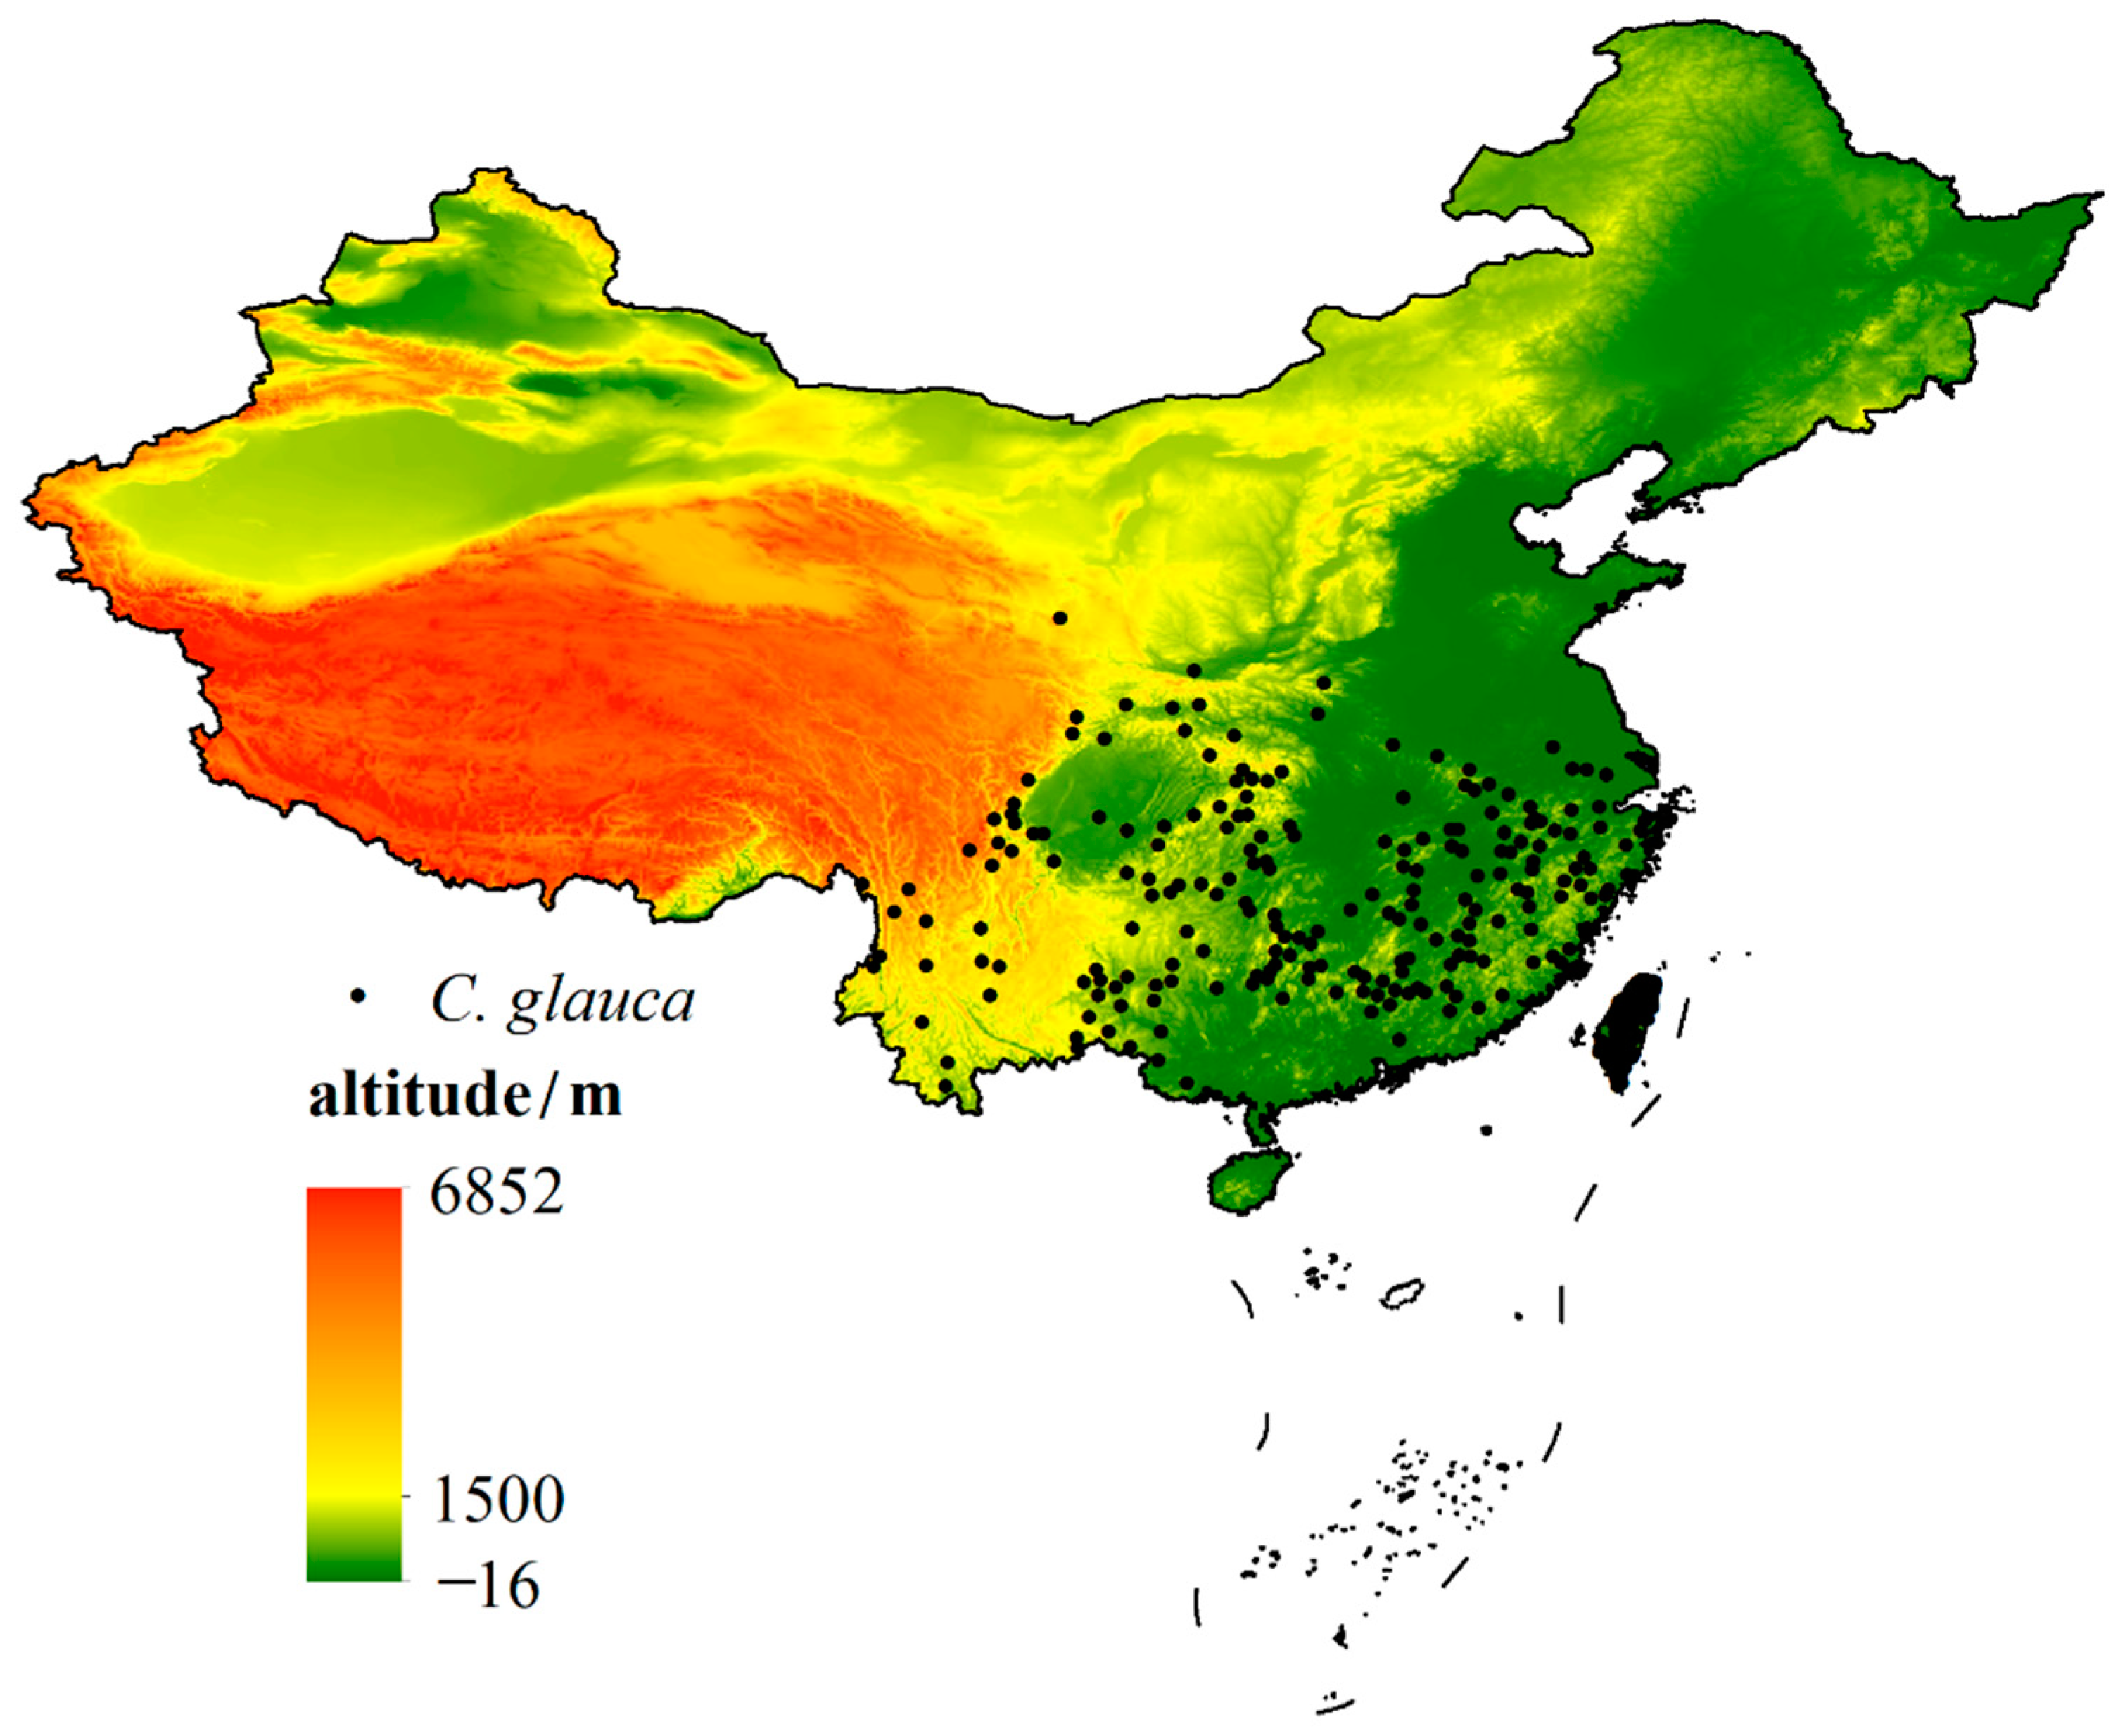
2.1. Occurrence Collection

Occurrence data for C. glauca were compiled from the Global Biodiversity Information Facility (www.gbif.org, accessed on 24 July 2021) [44] and the literature [38,45,46,47]. In total, we collected 902 geo-referenced occurrences. The accuracy of the model could be affected by the distance between occurrences. Therefore, we measured the spatial heterogeneity of climate factors using SDM-Toolbox [48] and rarefied the occurrence data according to the climate heterogeneity. Finally, 315 presence points were used in the modelling (Figure 1).

2.2. Environmental Variables

Twenty environmental variables related to the distribution of C. glauca were collected, namely altitude (ALT) and 19 bioclimatic variables (Table S1), because it has been indicated that these variables had great impact on the distribution of C. glauca [38]. ALT variables were selected from the Harmonized World Soil Database v1.2 [49] (http://www.fao.org/soils-portal/soil-survey/soil-maps-and-databases, accessed on 11 March 2019), which was jointly developed by the Food and Agriculture Organization (FAO) of the United Nations; the International Institute for Applied Systems Analysis (IIASA); the Institute of Soil Science, Chinese Academy of Sciences; and the European Commission’s joint research center. The resolution of ALT variables was at 30 arc seconds (~1 km). The 19 bioclimatic variables, at a resolution of 2.5 arc minutes (~5 km), were obtained from WorldClim version 2.1 [50] (https://www.worldclim.org/data/worldclim21.html, accessed on 25 July 2021). In order to ensure all the variables had the same resolution, we resampled ALT variables to 2.5 arc minutes, and all the variables were defined projection as WGS1984 in ArcGIS 10.2 before modelling.
The Scenario Model Intercomparison Project (ScenarioMIP) is a new climate change scenario proposed by the sixth phase of the Coupled Model Intercomparison Project (CMIP6). ScenarioMIP combines different shared socio-economic pathways with recent trends in anthropogenic emissions (SSP-RCP) [51,52]. SSP126 represents a green development pathway, it will produce a multi-model mean of significantly less than 1.5℃ warming by 2100. SSP245 represents an intermediate development pathway, and the radiation forcing is approximately 4.5 W/m2 in 2100. SSP370 represents the combination of high social vulnerability and relatively high anthropogenic radiation forcing. SSP585 represents the high end of the range of future pathways, with a radiation forcing of 8.5 W/m2 in 2100. In this paper, the potential suitable habitats of C. glauca were predicted by using the BCC-CSM2-MR climate model under four SSP-RCPs scenarios (SSP126, SSP245, SSP370, and SSP585) for three periods, namely current (1970–2000), mid-term (2041–2060), and long-term (2081–2100).
To avoid multicollinearity between environment variables that can lead to overfit of the model [36], the SDM-Toolbox was employed to remove highly correlated bioclimatic variables. For variables that had a correlation coefficient greater than 0.75, only one was used in the projection [48] ( Table S1).

2.3. Potential Habitat Evaluation

We employed Maxent to predict the potential distribution of C. glauca in China. Maxent uses environment variables as a constraint to infer the response of species potential distribution to environmental factors. Then, present and future potential distribution maps and habitat suitability can be calculated. We presented species occurrences and environmental variables into Maxent 3.4.1 and randomly selected 75% of the distribution points as training data to build a model and the remaining 25% as test data for model verification [36]. The Maxent model includes a jack-knife method to analyze the percentual contribution and importance of environment variables, and it uses the area under the receiver operating characteristic curve (AUC) to estimate the model accuracy. The model accuracy can be rated as failed when the AUC value is between 0.5 and 0.6, poor when the AUC value is between 0.6 and 0.7, fair when the AUC value is between 0.7 and 0.8, good when the AUC value is between 0.8 and 0.9, and excellent when the AUC value is between 0.9 and 1 [53].
Although AUC has been widely used in evaluating the accuracy of SDMs, it has been criticized because the spatial distribution errors are ignored and AUC varies with the spatial extent of background points and so on [54]. Hence, an improved method (the partial AUC) was recommended to assess the accuracy of SDMs [55]. We employed Niche Analyst 3.0 [56] to calculate the partial AUC (AUCratio) in order to evaluate the accuracy of our model. We began with defining the parameter E, which refers to how much omission errors can be acceptable in our study. Peterson et al. (2008) suggested to set 5–20% when using found data [55]. Therefore, we selected 5%, 10%, and 20% as our parameter E, according to our occurrence data, to calculate the AUCratio.
The logistic output was used in Maxent; therefore, a continuous existence probability grid map of species was obtained by processing the simulated results in ArcGIS10.2, and the existence probability of presence ranged from 0 to 1. A higher probability value corresponds to a greater likelihood of species distribution. We set 10 percentile training presence as the threshold value to evaluate the potential habitats. A threshold value higher than 10 percentile training presence was selected as the total suitable habitats. The total suitable habitat was further divided into three kinds of suitability: marginally suitable habitats, moderately suitable habitats, and highly suitable habitats. Maps of suitable habitats under the present and future climate scenarios were drawn in ArcGIS10.2. The SDM-Toolbox was applied to calculate the movement trajectory of suitable habitats by comparing the centroid changes in the present and future total suitable habitats [48]. The coordinate system was projected to the Albers Equal Area Projection before the centroid changes were calculated.
Finally, we used ArcGIS 10.2 to calculate the mean altitude of suitable habitats to determine the elevational migration of C. glauca in the future.

3. Results

3.1. Model Performance

Models for C. glauca performed well with the given set of training and test data. The AUC training values were 0.925 for both of the training data and the test data (Figure S1). Moreover, the AUCratio were all greater than 1 when the omission error (E) was set to 0.05, 0.1 and 0.2 (Table 1) indicating that the models performed well [55] and generated reliable predictions for C. glauca.

3.2. Contribution of Environmental Variables

After removing highly correlated bioclimatic variables by SDM-Toolbox, altitude and six bioclimatic variables (Bio3, Bio7, Bio10, Bio11, Bio12, and Bio15) were selected as the environment variables for the prediction of C. glauca. The results revealed the annual precipitation (Bio12), which contributed to 78.9%, was the most important environmental variable that affected the distribution of C. glauca (Table S2). This was followed by the temperature annual range (Bio7, 10.3%) and the mean temperature of coldest quarter (Bio11, 5.9%), which meant that Bio7 and Bio11 also made the great contributions to the distribution model for C. glauca. The cumulative contributions of the above factors reached 95.1%. In summary, the annual precipitation was the dominant environmental variable predicted to limit the distribution of C. glauca.

3.3. Current Suitable Habitat

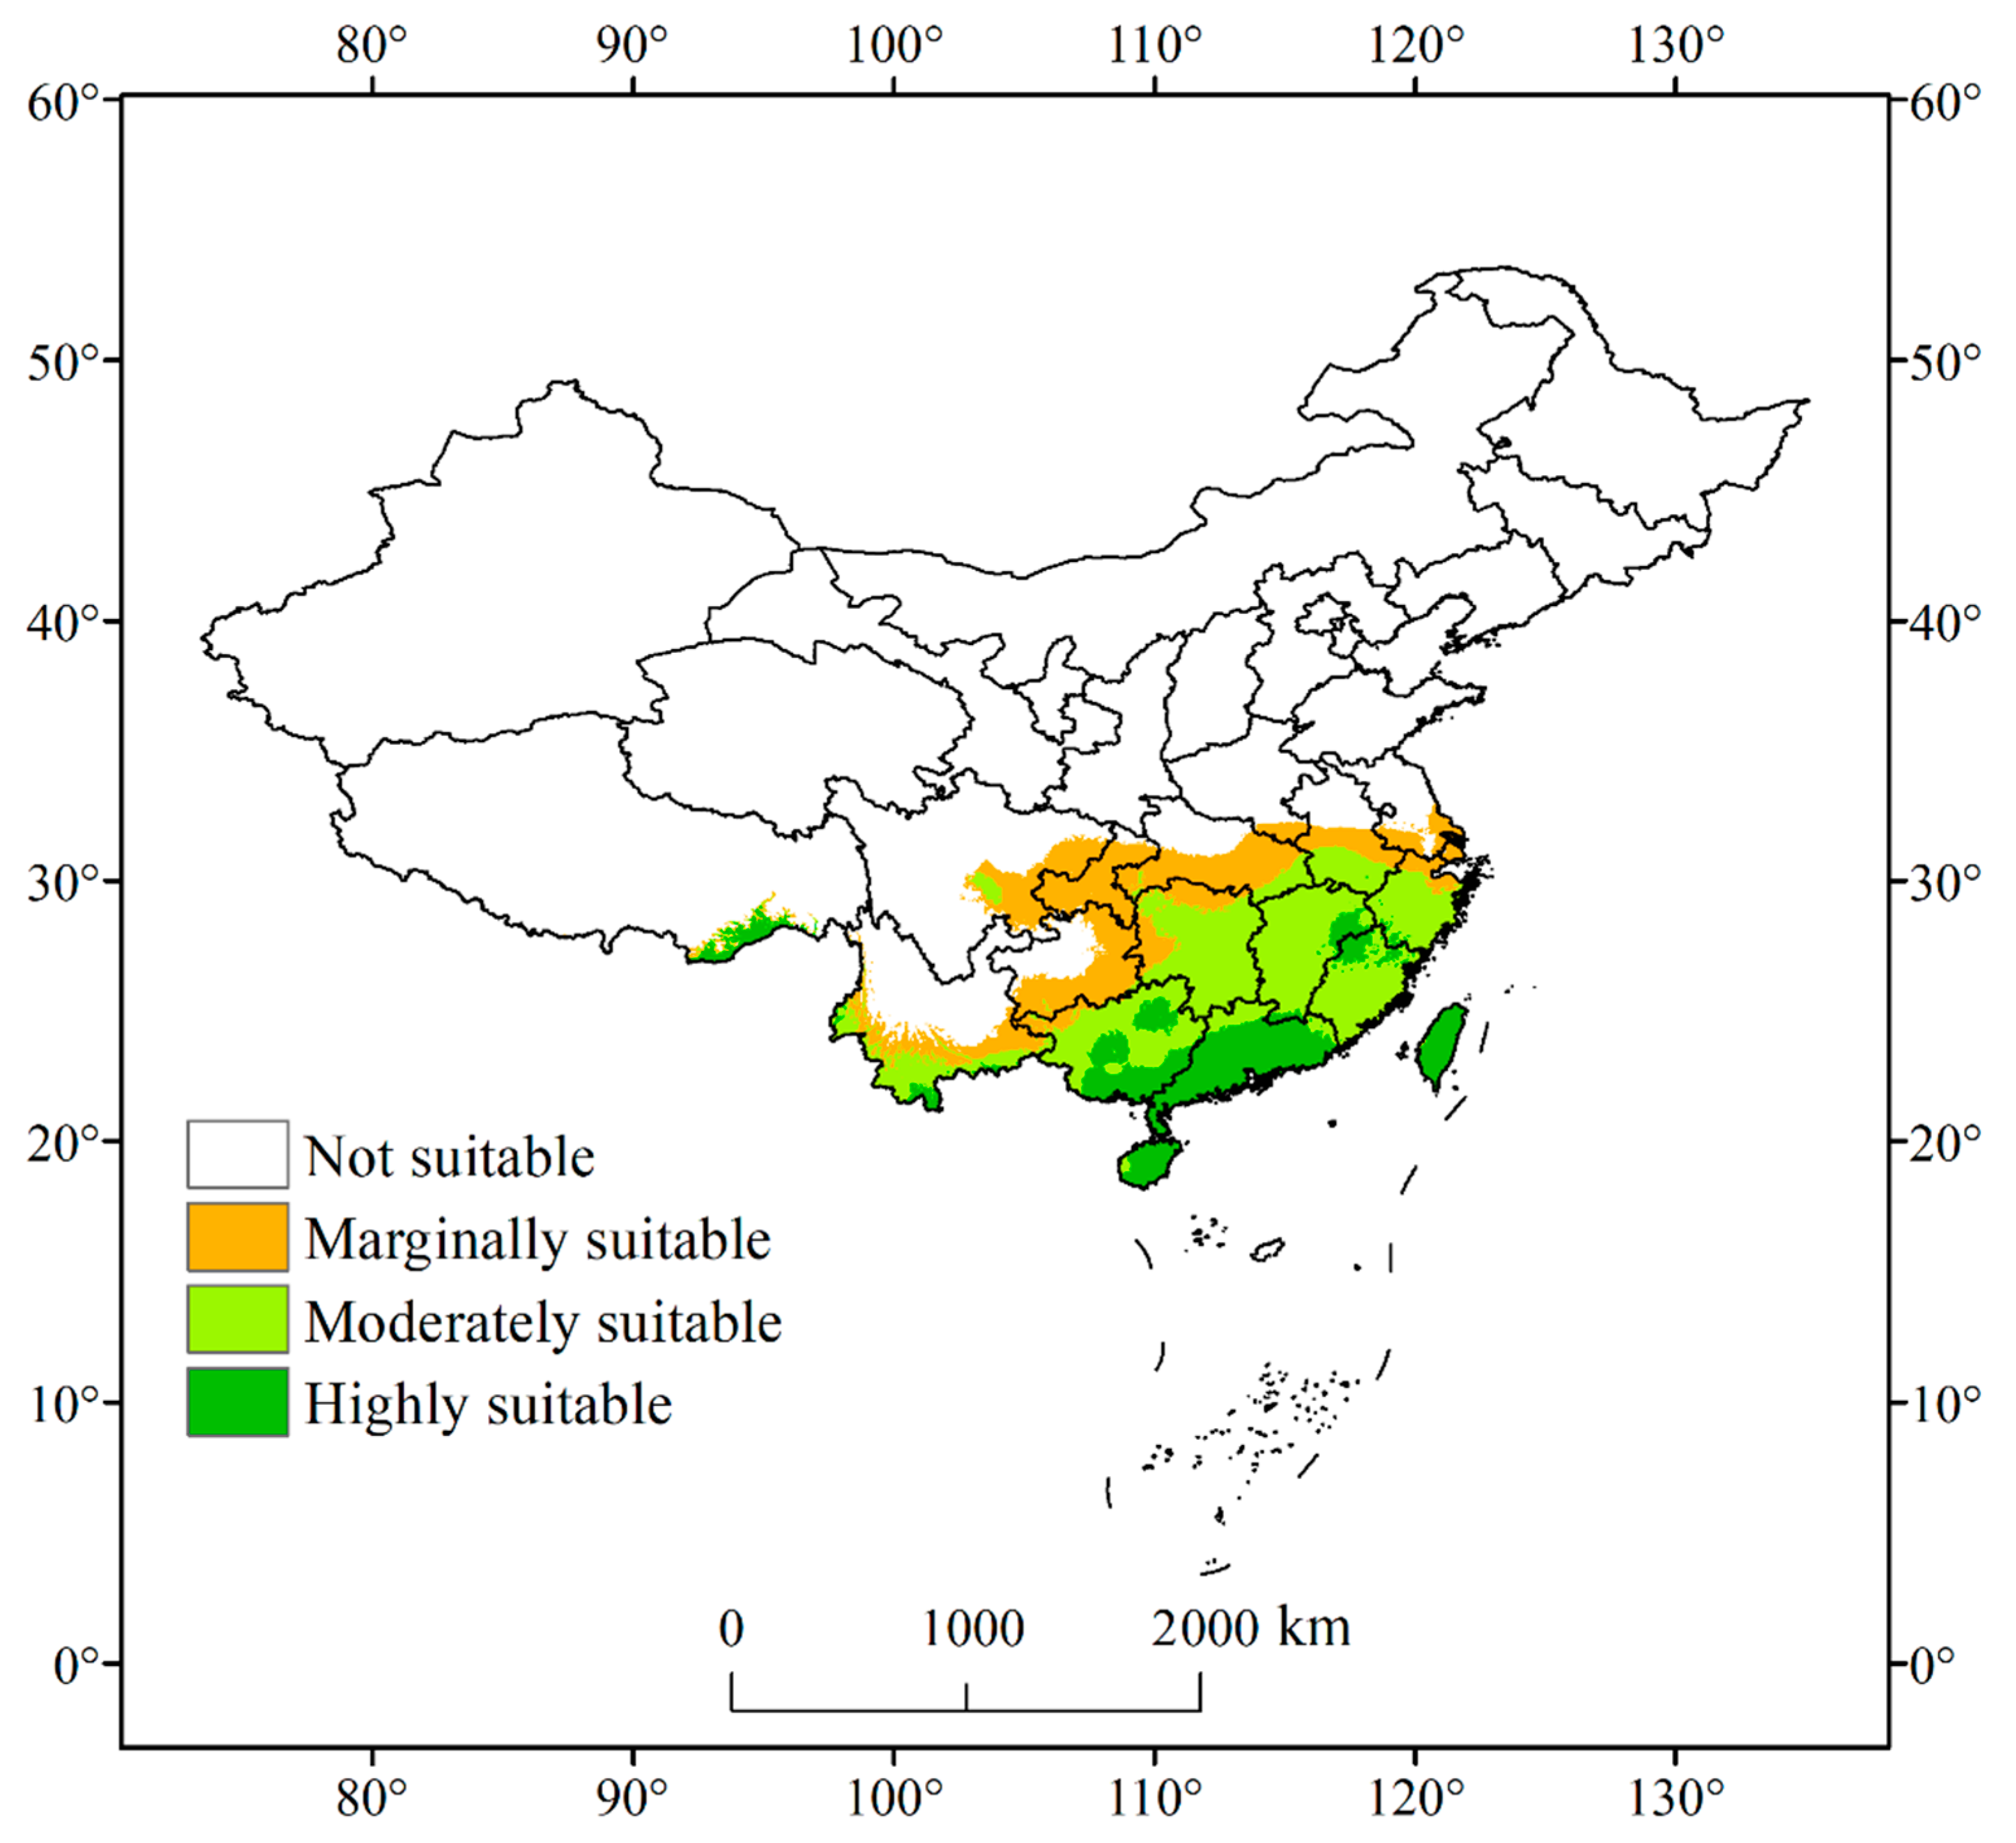
3.3.1. Distribution of Current Suitable Habitat

We identified the total suitable habitats according to the threshold of 10 percentile training presence (>0.247), and further divided the total suitable habitats into three kinds of suitability: marginally suitable habitats (0.247~0.4), moderately suitable habitats (0.4~0.6), and highly suitable habitats (>0.6).
The total suitable habitats were evaluated to occur in the whole Taiwan, Hainan, Zhejiang, Fujian, Guangdong, Guangxi, Jiangxi, Hunan, and Shanghai; the southern of Jiangsu, Henan, and Yunnan; central and the southern of Anhui, Hubei, and Chongqing; the eastern of Sichuan and Guizhou; and a small part of Tibet (Figure 2). The areas of the total suitable habitats for C. glauca encompass 162.93 × 10⁴ km2.
Within the total suitable habitats, the highly suitable habitats were distributed to the south, while the marginally suitable habitats were distributed to the north. The highly suitable habitats for C. glauca in China comprised 33.09 × 10⁴ km2, and accounted for 20% of the total suitable habitats. The highly suitable habitats were found to be primarily located in most of Taiwan, Hainan, and Guangdong; central and south-eastern Yunnan; and the northern border of Fujian and Jiangxi. The moderately suitable habitats comprised 74.66 × 10⁴ km2, and accounted for 46% of the total suitable habitat area. The marginally suitable habitats comprised 55.18 × 10⁴ km2, and accounted for 34% of the total suitable habitats area (Table 2).

3.3.2. The Altitude of Current Suitable Habitats

The predictions of the altitude of suitable habitat for C. glauca in the current period are shown in Figure 3.
Under the current climate, the mean altitude of the total suitable habitat for C. glauca was 494.82 m. Among the three types of suitable habitats, the highly suitable habitat had the lowest mean altitude, which was predicted to be 348.97 m; conversely, the low suitable habitats had the highest mean elevation, which was predicted to be 644.55 m.

3.4. Potential Suitable Habitats under Future Climate

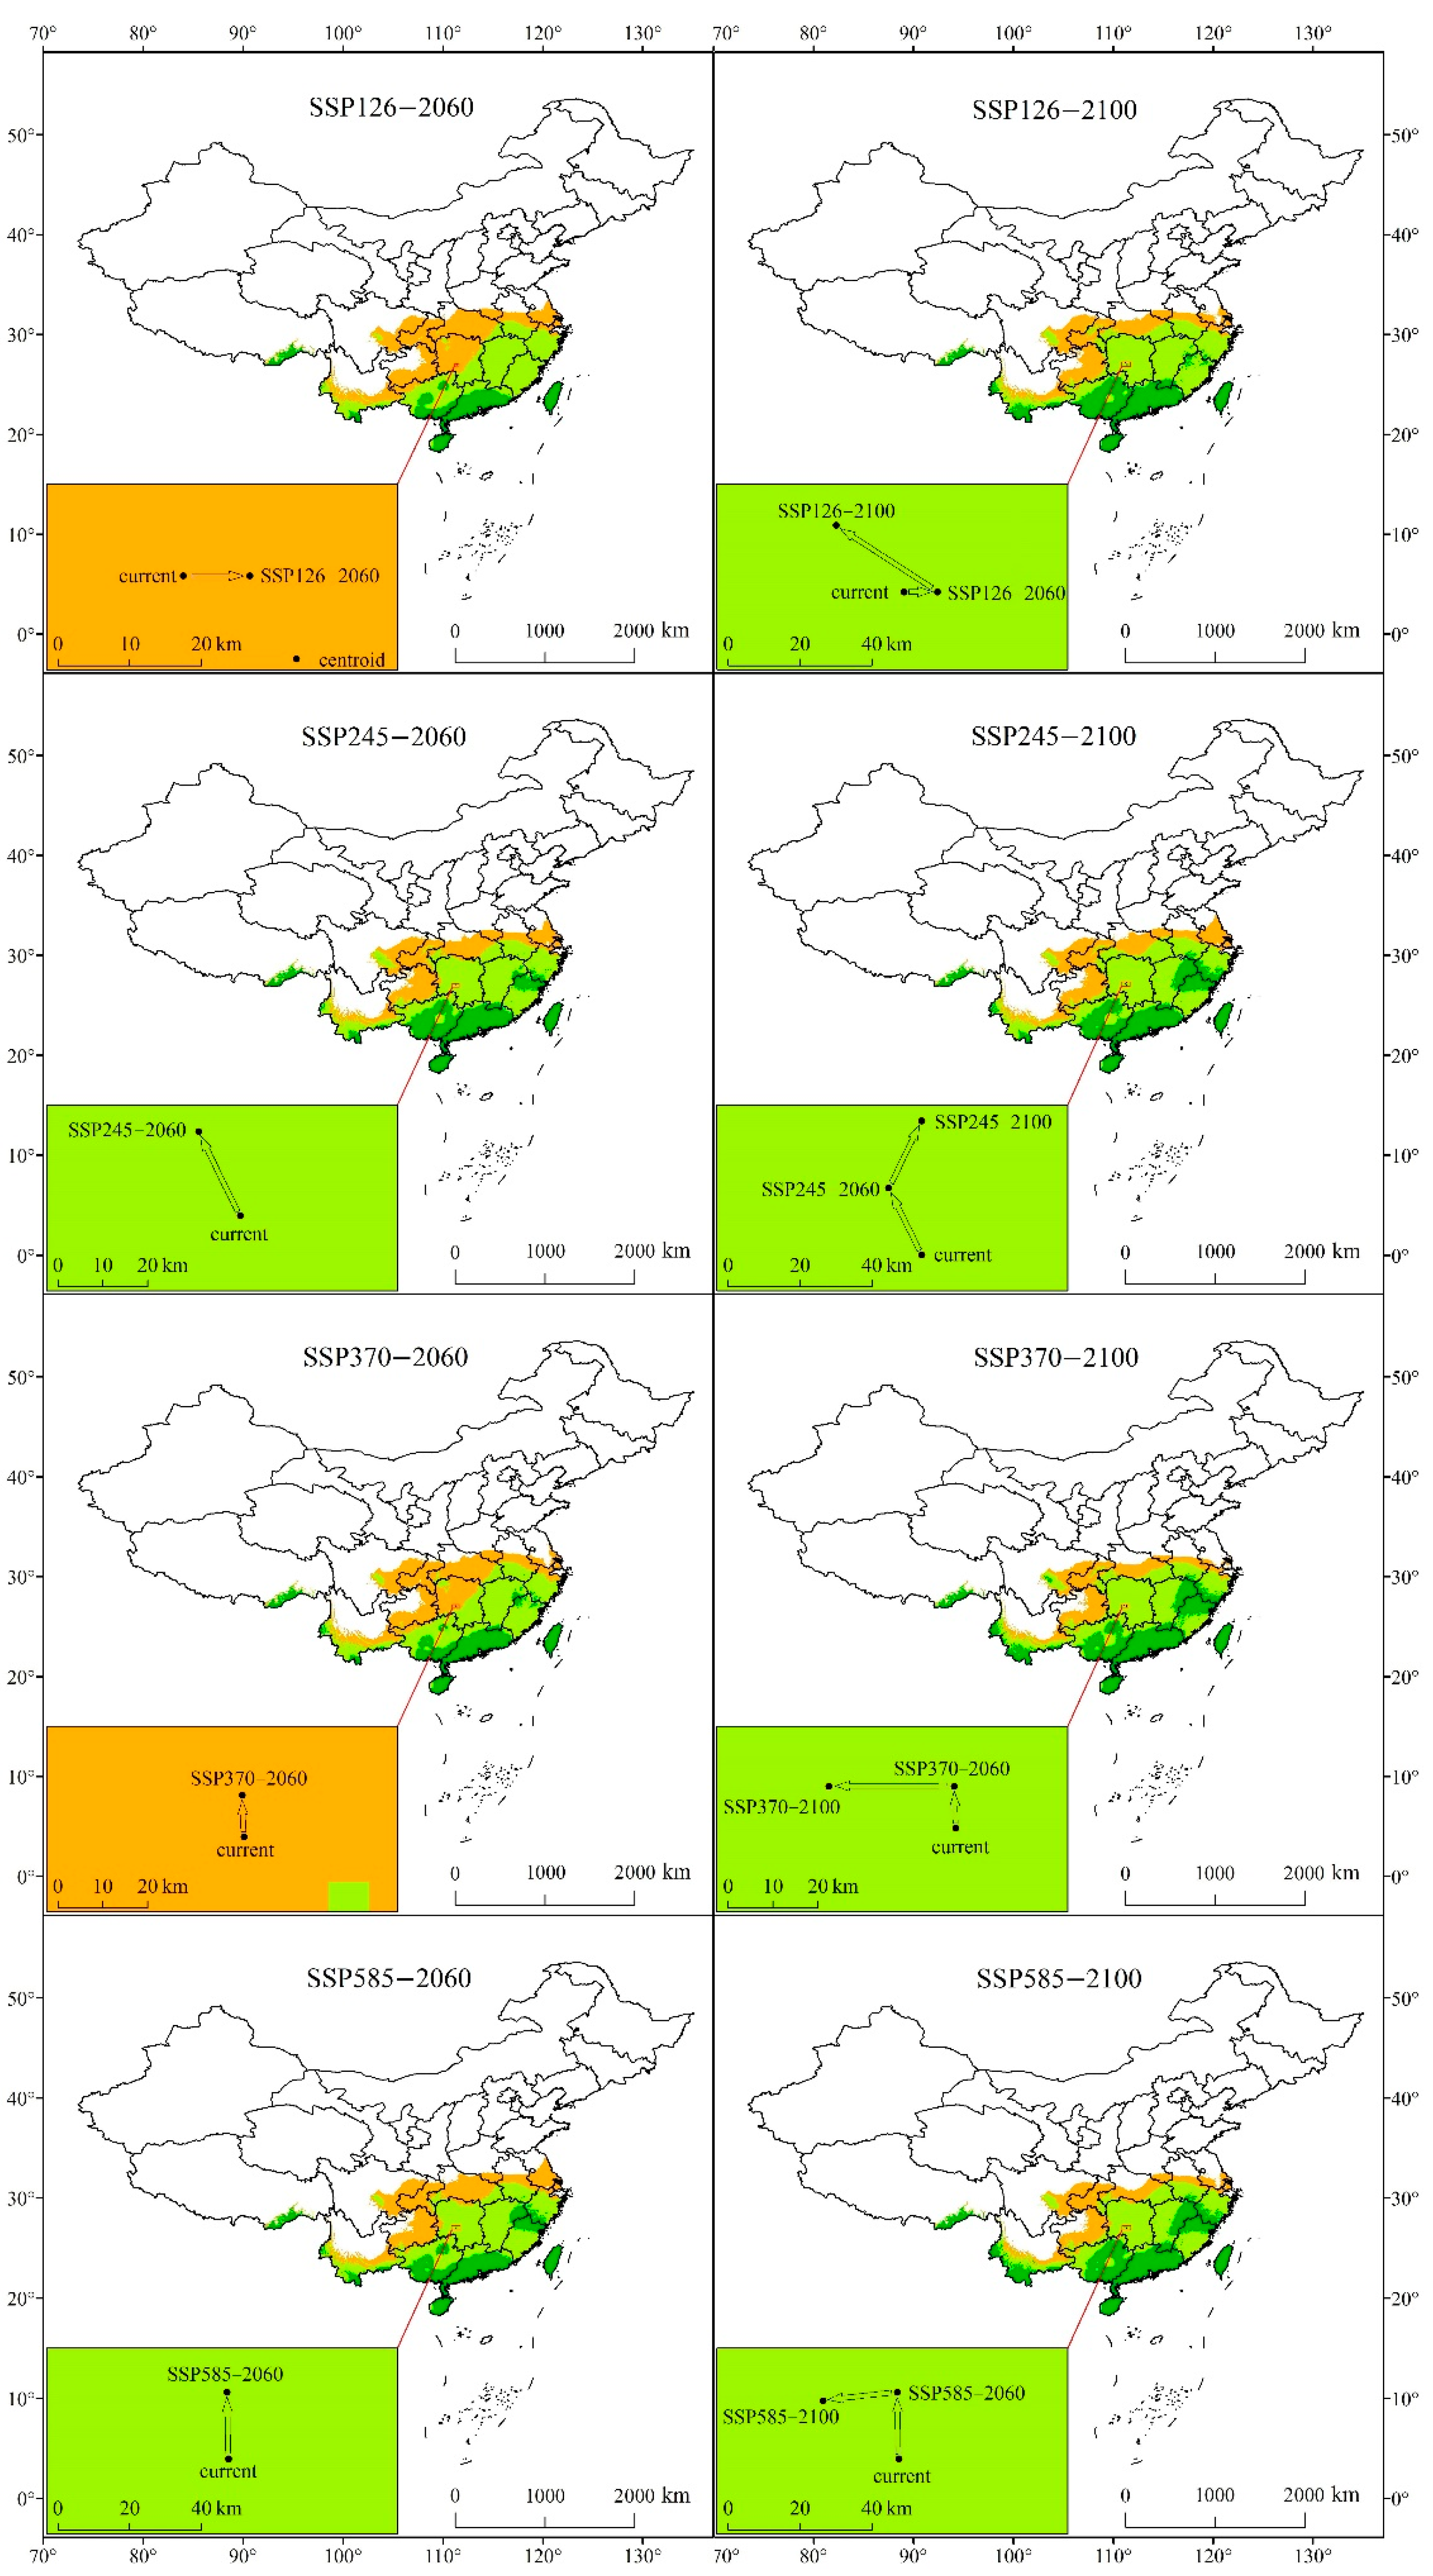
3.4.1. Potential Suitable Habitat Distribution under Future Climate

In the future, the suitable habitat of C. glauca would expand under all the four scenarios (Figure 4).
Under the SSP126-2060 climate scenario, Maxent predicted C. glauca gains in total suitable habitat in central Anhui and Yunnan, southern Henan, northern Hubei; while the area of total suitable habitats would lost in the eastern Sichuan, and central and western Guizhou. In the three-classified suitable habitats, the marginally suitable habitat would expand by 17.69 × 10⁴ km2; however, the moderately and highly suitable habitat had a trend of contraction. Under SSP126-2060, the total suitable habitats exhibited an expansion, amounting to 8.33 × 10⁴ km2. Under SSP126-2100, the moderately and highly suitable habitats were predicted to increase, and the area of marginally suitable habitats would reduce due to its transformation to moderately suitable habitats. The total suitable habitats were predicted to expand in the northward and westward regions along the boundary of the current habitats. The range expansion was expected to be 8.36 × 10⁴ km2.
Under the SSP245 climate scenario, Maxent predicted a range expansion in the northward and westward direction along the boundary of the current habitats both in 2041–2060 and 2081–2100. Under SSP245-2060, with the increase of the moderately and highly suitable habitats, the total suitable habitats would expand by 10.56 × 10⁴ km2. Under SSP245-2100, a larger expansion was predicted in northward along the current habitats. The total habitat would expand by 8.92 × 10⁴ km2.
Under the SSP370-2060 climate scenario, Maxent predicted C. glauca gains in the total suitable habitat in northern Anhui, southern Henan, and northern Hubei. Moreover, there were sporadic increases in Jiangsu, Sichuan, Yunnan, and Guizhou, while in Jiangsu, Sichuan, and Guizhou, there were sporadic decreases. Overall, the total suitable habitat would expand by 3.94 × 10⁴ km2. Under the SSP370-2100 climate scenario, Maxent predicted an expansion in northern Hubei, western Guizhou, and central Yunnan, and there were sporadic increases in Jiangsu, Anhui, Henan, Chongqing, and Tibet. Overall, the total suitable habitats would expand by 1.69 × 10⁴ km2.
Under the SSP585 climate scenario, Maxent predicted a range expansion in the northward and westward directions along the boundary of the current habitats both in 2041–2060 and 2081–2100. The difference is that the range expansion in 2041–2060 was mainly distributed northward, and the total range expansion was expected to be 11.75 × 10⁴ km2, while the westward expansion became more obvious in 2081–2100. Overall, the total suitable habitat would expand by 3.97 × 10⁴ km2.
In general, in all the future scenarios we used, the total suitable habitat was predicted to expand, and it exhibited a trend of expansion to the northwest. We inferred that it may be related to the increase of precipitation in the future. It is worth mentioning that the total suitable habitat tended to expand to areas with a higher altitude in the west, which suggests that although Bio12 (a precipitation variable) was predicted to be the most important factor in controlling the distribution of C. glauca, the rise of temperature could not be ignored in areas with higher altitude.

3.4.2. Altitude of Potential Suitable Habitat under Future Climate

The predictions of the altitude of suitable habitat for C. glauca in the future are shown in Figure 3.
The mean altitude of the total suitable habitat of C. glauca was 494.82 m under the current climate. It was predicted to migrate upward about 2.67 m to 497.49 m in 2041–2060, and then kept moving upward to 515.66 m in 2081–2100 under SSP126. Specifically, only the moderately suitable habitat had an upward trend in 2041–2060, while all of the three-classified suitable habitats showed an upward trend in 2081–2100 under SSP126.
There was the same pattern for the mean altitude changes of the total suitable habitat under SSP245, SSP370, and SSP585 to SSP126. The mean altitude was predicted to migrate upward in 2041–2060, and then kept moving upward by 2081–2100.
Under SSP245, the mean altitude of the total suitable habitat was predicted to migrate upward about 6.51 m to 501.33 m in 2041–2060, and then it would keep moving upward to 501.91 m until 2081–2100. Different from SSP126, all of the three classified suitable habitats under SSP245 showed an upward trend both in 2041–2060 and 2081–2100.
Under SSP370, the mean altitude of the total suitable habitat was predicted to migrate upward about 2.59 m to 497.41 m in 2041–2060, and then it would keep moving upward to 522.46 m until 2081–2100. Different from SSP126 and SSP245, the marginally suitable habitat showed a downward trend in 2041–2060. Meanwhile, all of the three classified suitable habitats showed an upward trend in 2081–2100.
Under SSP585, the mean altitude of the total suitable habitat was predicted to migrate upward 4.16 m to 498.98 m in 2041–2060, and then kept moving upward to 522.79 m until 2081–2100. There was the same pattern of change for the three classified suitable habitats under SSP585 to SSP370 both in 2041–2060 and 2081–2100.
In general, the mean altitude of the suitable habitats showed an increasing trend in the future, and the rise in 2081–2100 would be greater than that in 2041–2060.

3.4.3. Spatial Shifts of Centroids in the Future

The geographical centroid of the total suitable habitat of C. glauca was located at 111.32° E and 26.95° N under the current climate scenario, migrated eastward about 7.93 km to the position of 111.40° E and 26.95° N in 2041–2060, and then shifted northwestward about 31.25 km to 111.15° E and 27.12° N in 2081–2100 under SSP126 scenario (Figure 4).
The geographical centroid of the total suitable habitat migrated northwestward about 20.50 km to the position of 111.24° E and 27.12° N in 2041–2060, and then shifted northeastward about 20.49 km to the 111.32° E and 27.29° N in 2081–2100 under SSP245 scenario.
Under the SSP370 scenario, the geographical centroid migrated northward about 8.90 km to the position of 111.32° E and 27.03° N in 2041–2060, and then shifted westward about 20.49 km to the 111.07° E and 27.03° N in 2081–2100.
Under the SSP585 scenario, the geographical centroid of the total suitable habitat migrated northward about 18.90 km to the position of 111.32° E and 27.12° N in 2041–2060, and then shifted southeastward about 18.94 km to the 111.13° E and 27.10° N in 2081–2100.
However, the magnitude and direction of the geographical centroid movement were slightly different under different climate scenarios. In general, the centroid would migrated northward or westward in the future.

4. Discussion

The knowledge of species potential distribution pattern variations under climate change is essential as a measurement of its impact on species and to develop conservation strategies to maintain ecological balance [18]. Therefore, we employed Maxent models to evaluate the suitable habitats of C. glauca in China. This study inferred species potential suitable habitats for C. glauca in China under current and future climate scenarios; we believed that the Maxent performance was robust and reliable to understanding the potential distribution for C. glauca.
In this study, we found that the most critical environmental factor determining the suitable habitat distribution of C. glauca was the annual precipitation (Bio12). C. glauca was predicted to be suitable for regions with Bio12 ranging from 731 mm to 5095 mm. This finding suggested that precipitation was critical for the survival of C. glauca. Our prediction supported previous studies, in that, because of precipitation, the northern boundary of evergreen broadleaf forest in coastal China was more southward than that in Japan [57].
The main factors affecting plant distribution are climate [1], soil composition [58], orography [59], biotic interactions [60], and so on. Climate is one of the important ecological factors. Plants respond to climate change by changing their distribution, such as migrating to higher latitudes or higher altitudes to track suitable environment conditions [8,9,10]. We quantified the suitable habitat change of C. glauca under four climate scenarios, and found that the total suitable habitat would expand to the northwest and the mean altitude showed an upward trend both in 2041–2060 and 2081–2100 under the four climate scenarios; moreover, the mean altitude of the total suitable habitat in 2081–2100 was significantly higher than that in 2041–2060. The results were consistent with the prediction that the northern boundary of the suitable habitats would expand northward in the future [43]. We analyzed the annual precipitation changes in the habitat expansion area and found that under four climate scenarios, the annual precipitation increased significantly in both 2041–2060 and 2081–2100, and the increase in 2081–2100 was significantly greater than that in 2041–2060. Accordingly, the increase of precipitation promoted the northward and upward shift of the total suitable habitat. It should be noted that the total suitable habitat would be lost in parts of Sichuan, Guizhou, and Jiangsu under SSP126 and SSP370 in 2041–2060, and more habitat would be lost under SSP126. According to our analysis, the annual precipitation showed a decreasing trend in 2041–2060 relative to current climate scenario in the areas that experienced a range contraction. It decreased by 23.99 mm under SSP126 and 4.1 mm under SSP370 on average. The results from the previous projection of climate zone shifts in the twenty-first century in China were contrary to ours; they found that precipitation in Sichuan and Guizhou would increase less than 2% compared to that in 1981–2000. However, they also predicted that the temperature in these areas would increase more than 1.3 °C [61]. This imbalance in temperature change and precipitation change would also lead to intense evaporation, which could result in drought. This was extremely detrimental for the growth of hygrophilous plants. Overall, we believe that the increase of the annual precipitation in the future would reduce the limitation of precipitation on the distribution of C. glauca, which would cause suitable habitats to move northward and upward, while the decreasing precipitation along with increasing temperature would strengthen the limitations and lead to a contraction of suitable habitats.
In addition, we found that the geographical centroid of the total habitat of C. glauca was located at 111.32° E and 26.95° N, which was in south-western Hunan. Although the direction of centroid movement was slightly different at different periods, it would move northward (SSP245) or northwestward (SSP126, SSP370, and SSP585) in 2081–2100, relative to the current climate, with an average movement range of 23.86 km. The movement of the centroid reflected the movement of the core habitats of C. glauca. The future movement of the suitable habitats was partly caused by the northward and westward movement of the core habitat, and also by the fragmentation and disappearance of the highly suitable habitat at the junction of Jiangxi and Fujian, especially under the climate scenarios of SSP126-2060, SSP126-2100, and SSP370-2060. This suggests that an increase in efforts to protect and cultivate C. glauca at the junction of Jiangxi and Fujian is necessary and critical in order to protect the understory vegetation and ecosystem structure.
This paper adopted Maxent to simulate the suitable habitat changes of C. glauca in 2041–2060 and 2081–2100. We mainly considered the biological climate factors (Bio1-19) and the effects of altitude. However, the road distribution, the distance to residential areas, and land use also greatly affect the distribution of plants, and all these factors should be taken into consideration in the future. Furthermore, Qiao et al. (2015) tested eight niche modelling algorithms and found there was no algorithm that could perform best in all species distribution modelling [62]. They suggested that various algorithms should be tested before simulation and the final approach should be chosen based on the results of the test. Therefore, in future work, we need to fully test the accuracy of the modelling methods.

5. Conclusions

Assessing the impact of climate change on the distribution of C. glauca is of critical importance for the conservation of the understory vegetation and ecosystem structure. Our results indicated that with the increasing precipitation, the total suitable habitat for C. glauca tended to expand under SSP126, SSP245, SSP370, and SSP585 climate scenarios, and the total suitable habitats showed a north-westward and upward trend both in 2041–2060 and 2081–2100. Nevertheless, in parts of Sichuan, Guizhou, and Jiangsu, the reduction of precipitation in 2041–2060 under SSP126 and SSP370 was predicted to result in the reduction of highly suitable habitats, which meant that the dominant species in these areas were likely to change, and it would have an important impact on the understory vegetation. This reminds us that it is useful to predict the spatial and temporal patterns of the range shifts for C. glauca. This study can provide vital information for the management of C. glauca and serve as a reminder for managers to protect biodiversity in areas where C. glauca could be lost in the future.

Supplementary Materials

The following are available online at https://0-www-mdpi-com.brum.beds.ac.uk/article/10.3390/f13010126/s1, Figure S1: The Maxent predicted ROC curve of C. glauca, Table S1: Correlation matrix for different environmental variables, Table S2: Percent contributions of variables included in Maxent, Table S3: Geographical distribution and data sources of C. glauca population occurrences.

Author Contributions

Conceptualization, L.Z. (Lijuan Zhang) and L.Z. (Lianqi Zhu); methodology, L.Z. (Lijuan Zhang); formal analysis, L.Z. (Lianqi Zhu); software: Y.L. and Y.C.; writing—original draft preparation, L.Z. (Lijuan Zhang); writing—review and editing, L.Z. (Lianqi Zhu) and W.Z.; visualization, Y.C.; supervision, L.Z. (Lianqi Zhu); project administration, L.Z. (Lijuan Zhang); funding acquisition, L.Z. (Lianqi Zhu) and Y.C. All authors have read and agreed to the published version of the manuscript.

Funding

This research was funded by the National Key Research and Development Program (grant number 2021YFE0106700) and the Key Scientific Research Projects for Higher Education of Henan Province (grant number 18A170003).

Data Availability Statement

Not applicable.

Acknowledgments

We thank to Ming Xu, from the College of Geography and Environmental Science, Henan University, China, for his assistance and suggestions on the Maxent modelling.

Conflicts of Interest

The authors declare no conflict of interest.

References

  1. Woodward, F.I.; Williams, B.G. Climate and plant distribution at global and local scales. Vegetatio 1987, 69, 189–197. [Google Scholar] [CrossRef]
  2. Thapa, A.; Wu, R.; Hu, Y.; Nie, Y.; Singh, P.; Khatiwada, J.R.; Yan, L.; Gu, X.; Wei, F. Predicting the potential distribution of the endangered red panda across its entire range using MaxEnt modeling. Ecol. Evol. 2018, 8, 10542–10554. [Google Scholar] [CrossRef]
  3. Mccarty, J.P. Ecological Consequences of Recent Climate Change. Conserv. Biol. 2001, 15, 320–331. [Google Scholar] [CrossRef]
  4. Hughes, L. Biological consequences of global warming: Is the signal already. Trends Ecol. Evol. 2000, 15, 56–61. [Google Scholar] [CrossRef]
  5. Lindner, M.; Maroschek, M.; Netherer, S.; Kremer, A.; Barbati, A.; Garcia-Gonzalo, J.; Seidl, R.; Delzon, S.; Corona, P.; Kolström, M. Climate change impacts, adaptive capacity, and vulnerability of European forest ecosystems. For. Ecol. Manag. 2010, 259, 698–709. [Google Scholar] [CrossRef]
  6. Keshtkar, H.; Voigt, W. Potential impacts of climate and landscape fragmentation changes on plant distributions: Coupling multi-temporal satellite imagery with GIS-based cellular automata model. Ecol. Inform 2016, 32, 145–155. [Google Scholar] [CrossRef]
  7. Li, R. Protecting rare and endangered species under climate change on the Qinghai Plateau, China. Ecol. Evol. 2018, 9, 1–10. [Google Scholar] [CrossRef] [PubMed] [Green Version]
  8. Chen, I.C.; Hill, J.K.; Ohlemuller, R.; Roy, D.B.; Thomas, C.D. Rapid range shifts of species associated with high levels of climate warming. Science 2011, 333, 1024–1026. [Google Scholar] [CrossRef]
  9. Lehikoinen, A.; Virkkala, R. North by north-west: Climate change and directions of density shifts in birds. Glob. Chang. Biol. 2016, 22, 1121–1129. [Google Scholar] [CrossRef] [Green Version]
  10. Qin, A.; Liu, B.; Guo, Q.; Bussmann, R.W.; Ma, F.; Jian, Z.; Xu, G.; Pei, S. Maxent modeling for predicting impacts of climate change on the potential distribution of Thuja sutchuenensis Franch., an extremely endangered conifer from southwestern China. Glob. Ecol. Conserv. 2017, 10, 139–146. [Google Scholar] [CrossRef]
  11. Mclaughlin, J.F.; Hellmann, J.J.; Boggs, C.L.; Ehrlich, P.R. Climate change hastens population extinctions. Proc. Natl. Acad. Sci. USA 2002, 99, 6070–6074. [Google Scholar] [CrossRef] [Green Version]
  12. Mckenney, D.W.; Pedlar, J.H.; Lawrence, K.; Campbell, K.; Hutchinson, M.F. Potential impacts of climate change on the distribution of North American trees. Bioscience 2007, 57, 939–948. [Google Scholar] [CrossRef]
  13. Thurm, E.A.; Hernandez, L.; Baltensweiler, A.; Ayan, S.; Rasztovits, E.; Bielak, K.; Zlatanov, T.M.; Hladnik, D.; Balic, B.; Freudenschuss, A.; et al. Alternative tree species under climate warming in managed European forests. For. Ecol. Manag. 2018, 430, 485–497. [Google Scholar] [CrossRef]
  14. Feeley, K. Distributional migrations, expansions, and contractions of tropical plant species as revealed in dated herbarium records. Glob. Chang. Biol. 2012, 18, 1335–1341. [Google Scholar] [CrossRef]
  15. Vermeiren, P.; Reichert, P.; Schuwirth, N.; Fath, B.D. Integrating uncertain prior knowledge regarding ecological preferences into multi-species distribution models: Effects of model complexity on predictive performance. Ecol. Model. 2020, 420, 1–15. [Google Scholar] [CrossRef]
  16. Smeraldo, S.; Bosso, L.; Salinas-Ramos, V.B.; Ancillotto, L.; Sánchez-Cordero, V.; Gazaryan, S.; Russo, D. Generalists yet different: Distributional responses to climate change may vary in opportunistic bat species sharing similar ecological traits. Mammal Rev. 2021, 51, 571–584. [Google Scholar] [CrossRef]
  17. Zhang, M.G.; Zhou, Z.K.; Chen, W.Y.; Cannon, C.H.; Raes, N.; Slik, J.W.F. Major declines of woody plant species ranges under climate change in Yunnan, China. Divers. Distrib. 2014, 20, 405–415. [Google Scholar] [CrossRef]
  18. Deb, J.C.; Phinn, S.; Butt, N.; Mcalpine, C.A. The impact of climate change on the distribution of two threatened Dipterocarp trees. Ecol. Evol. 2017, 7, 2238–2248. [Google Scholar] [CrossRef]
  19. Lv, Z.; Li, D. The Potential Distribution of Juniperus rigida Sieb. et Zucc. Vary Diversely in China under the Stringent and High GHG Emission Scenarios Combined Bioclimatic, Soil, and Topographic Factors. Forests 2021, 12, 1140. [Google Scholar] [CrossRef]
  20. Austin, M. Species distribution models and ecological theory: A critical assessment and some possible new approaches. Ecol. Model. 2007, 200, 1–19. [Google Scholar] [CrossRef]
  21. Xin, F.; Liu, J.; Chang, C.; Wang, Y.; Jia, L. Evaluating the Influence of Climate Change on Sophora moorcroftiana (Benth.) Baker Habitat Distribution on the Tibetan Plateau Using Maximum Entropy Model. Forests 2021, 12, 1230. [Google Scholar] [CrossRef]
  22. Carpenter, G.; Gillison, A.N.; Winter, J. DOMAIN: A flexible modelling procedure for mapping potential distributions of plants and animals. Biodivers. Conserv. 1993, 2, 667–680. [Google Scholar] [CrossRef]
  23. Xue, Y.; Guan, L.; Tanaka, K.; Li, Z.; Chen, Y.; Ren, Y. Evaluating effects of rescaling and weighting data on habitat suitability modeling. Fish. Res. 2017, 188, 84–94. [Google Scholar] [CrossRef]
  24. Lecocq, T.; Harpke, A.; Rasmont, P.; Schweiger, O. Integrating intraspecific differentiation in species distribution models: Consequences on projections of current and future climatically suitable areas of species. Divers. Distrib. 2019, 25, 1088–1100. [Google Scholar] [CrossRef]
  25. Jiang, Z. Spatial Structured Prediction Models: Applications, Challenges, and Techniques. IEEE Access 2016, 4, 1–14. [Google Scholar] [CrossRef]
  26. Bradie, J.; Leung, B. A quantitative synthesis of the importance of variables used in MaxEnt species distribution models. J. Biogeogr. 2017, 44, 1344–1361. [Google Scholar] [CrossRef]
  27. Jose, V.S.; Nameer, P.O. The expanding distribution of the Indian Peafowl (Pavo cristatus) as an indicator of changing climate in Kerala, southern India: A modelling study using MaxEnt. Ecol. Indic. 2020, 110, 105930. [Google Scholar] [CrossRef]
  28. Wu, Y.; Yang, Y.; Liu, C.; Hou, Y.; Yang, S.; Wang, L.; Zhang, X. Potential Suitable Habitat of Two Economically Important Forest Trees (Acer truncatum and Xanthoceras sorbifolium) in East Asia under Current and Future Climate Scenarios. Forests 2021, 12, 1263. [Google Scholar] [CrossRef]
  29. Freeman, B.G.; Scholer, M.N.; Ruiz-Gutierrez, V.; Fitzpatrick, J.W. Climate change causes upslope shifts and mountaintop extirpations in a tropical bird community. Proc. Natl. Acad. Sci. USA 2018, 115, 11982–11987. [Google Scholar] [CrossRef] [PubMed]
  30. Freeman, B.G.; Class Freeman, A.M. Rapid upslope shifts in New Guinean birds illustrate strong distributional responses of tropical montane species to global warming. Prac. Natl. Acad. Sci. USA 2014, 111, 4490–4494. [Google Scholar] [CrossRef] [Green Version]
  31. Testolin, R.; Attorre, F.; Borchardt, P.; Brand, R.F.; Bruelheide, H.; Chytry, M.; De Sanctis, M.; Dolezal, J.; Finckh, M.; Haider, S.; et al. Global patterns and drivers of alpine plant species richness. Glob. Ecol. Biogeogr. 2021, 30, 1218–1231. [Google Scholar] [CrossRef]
  32. Phillips, S.J.; Anderson, R.P.; Schapire, R.E. Maximum entropy modeling of species geographic distributions. Ecol. Model. 2006, 190, 231–259. [Google Scholar] [CrossRef] [Green Version]
  33. Elith, J.; Graham, C.H.; Anderson, R.P.; Dudík, M.; Ferrier, S.; Guisan, A.; Hijmans, R.J.; Huet Tm Ann, F.; Leathwick, J.R.; Lehmann, A. Novel methods improve prediction of species’ distributions from occurrence data. Ecography 2006, 29, 129–151. [Google Scholar] [CrossRef] [Green Version]
  34. Saupe, E.; Qiao, H.; Hendricks, J.; Portell, R.; Hunter, S.; Soberón, J.; Lieberman, B. Niche breadth and geographic range size as determinants of species survival on geological time scales: Determinants of species survival. Glob. Ecol. Biogeogr. 2015, 24, 1159–1169. [Google Scholar] [CrossRef]
  35. Wang, Y.; Xie, B.; Wan, F.; Xiao, Q.; Dai, L. Application of ROC curve analysis in evaluating the performance of alien species’ potential distribution models. Biodiv. Sci. 2007, 15, 365–372. [Google Scholar]
  36. Zhang, K.; Yao, L.; Meng, J.; Tao, J. Maxent modeling for predicting the potential geographical distribution of two peony species under climate change. Sci. Total Environ. 2018, 634, 1326–1334. [Google Scholar] [CrossRef]
  37. Ni, J.; Song, Y. Relationships between geographical distribution of Cyclobalanopsis glauca and climate in China. Acta Bot. Sin. 1997, 5, 451–460. [Google Scholar]
  38. Ni, J.; Song, Y. Climate and geographical distribution of dominants and companions of fagaceae for broadleaved forest in China. J. East China Norm. Univ. (Nat. Sci. Ed.) 1997, 2, 100–107. [Google Scholar]
  39. Dyderski, M.K.; Paź, S.; Frelich, L.E.; Jagodziński, A.M. How much does climate change threaten European forest tree species distributions? Glob. Chang. Biol. 2018, 24, 1150–1163. [Google Scholar] [CrossRef]
  40. Canham, C.D.; Finzi, A.C.; Pacala, S.W.; Burbank, D.H. Causes and consequences of resource heterogeneity in forests: Interspecific variation in light transmission by canopy trees. Can. J. For. Res. 1994, 24, 337–349. [Google Scholar] [CrossRef]
  41. Von Arx, G.; Dobbertin, M.; Rebetez, M. Spatio-temporal effects of forest canopy on understory microclimate in a long-term experiment in Switzerland. Agric. For. Meteorol. 2012, 166–167, 144–155. [Google Scholar] [CrossRef]
  42. Augusto, L.; Dupouey, J.L.; Ranger, J. Effects of tree species on understory vegetation and environmental conditions in temperate forests. Ann. For. Sci. 2003, 60, 823–831. [Google Scholar] [CrossRef]
  43. Cao, M.; Zhou, G.; Weng, E. Application and comparison of generalized models and classification and regression tree in simulating tree species distribution. Acta Ecol. Sin. 2005, 25, 2031–2040. [Google Scholar]
  44. GBIF.org. GBIF Occurrence Download. Available online: https://www.gbif.org (accessed on 24 July 2021).
  45. Chen, X.; Song, Y. Relationships between environmental factors and allozymic variation of Cyclobalanopsis glauca populations in east China. J. Xiamen Univ. (Nat. Sci. Ed.) 1997, 36, 774–780. [Google Scholar]
  46. Cai, Y.; Wang, X. Anecoanatomical study on leaves of Cyclobalanopsis glauca populations in the eastern subtropical zone, China. Acta Ecol. Sin. 1999, 19, 844–849. [Google Scholar]
  47. Huang, S.; Li, T.; Wen, S.; He, G.; Peng, Y. Study on growth rule and biomass distribution pattern of Cyclobalanopsis glauca. J. Cent. South Univ. For. Tech. (Nat. Sci. Ed.) 2017, 37, 57–62. [Google Scholar]
  48. Brown, J.L.; Bennett, J.R.; French, C.M. SDMtoolbox 2.0: The next generation Python-based GIS toolkit for landscape genetic, biogeographic and species distribution model analyses. Peerj 2017, 5, 694–700. [Google Scholar] [CrossRef] [Green Version]
  49. FAO; IIASA; ISRIC; ISSCAS; JRC. Harmonized World Soil Database (Version 1.2); FAO: Rome, Italy; IIASA: Laxenburg, Austria, 2012. [Google Scholar]
  50. Fick, S.E.; Hijmans, R.J. WorldClim 2: New 1km spatial resolution climate surfaces for global land areas. Int. J. Climatol. 2017, 37, 4302–4315. [Google Scholar] [CrossRef]
  51. Eyring, V.; Bony, S.; Meehl, G.A.; Senior, C.A.; Stevens, B.; Stouffer, R.J.; Taylor, K.E. Overview of the Coupled Model Intercomparison Project Phase 6 (CMIP6) experimental design and organization. Geosci. Model Dev. 2016, 9, 1937–1958. [Google Scholar] [CrossRef] [Green Version]
  52. Jones, C.D.; Arora, V.; Friedlingstein, P.; Bopp, L.; Brovkin, V.; Dunne, J.; Graven, H.; Hoffman, F.; Ilyina, T.; John, J.G.; et al. C4MIP—The Coupled Climate–Carbon Cycle Model Intercomparison Project: Experimental protocol for CMIP6. Geosci. Model Dev. 2016, 9, 2853–2880. [Google Scholar] [CrossRef] [Green Version]
  53. Araújo, M.; Pearson, R.; Thuiller, W.; Erhard, M. Validation of species-climate impact models under climate change. Glob. Chang. Biol. 2010, 11, 1504–1513. [Google Scholar] [CrossRef] [Green Version]
  54. Lobo, J.M.; Jimenez-Valverde, A.; Real, R. AUC: A misleading measure of the performance of predictive distribution models. Glob. Ecol. Biogeogr. 2008, 17, 145–151. [Google Scholar] [CrossRef]
  55. Peterson, A.T.; Papes, M.; Soberon, J. Rethinking receiver operating characteristic analysis applications in ecological niche modeling. Ecol. Model. 2008, 213, 63–72. [Google Scholar] [CrossRef]
  56. Qiao, H.; Peterson, A.T.; Campbell, L.P.; Soberón, J.; Ji, L.; Escobar, L.E. NicheA: Creating virtual species and ecological niches in multivariate environmental scenarios. Ecography 2016, 39, 805–813. [Google Scholar] [CrossRef] [Green Version]
  57. Fang, J.Y. Arrangement of east-Asian vegetation-climate types on coordinates of temperature and precipitation. Acta Ecol. Sin. 1994, 14, 290–294. [Google Scholar]
  58. Real, R.; Márquez, A.L.; Estrada, A.; Muoz, A.R.; Vargas, J.M. Modelling chorotypes of invasive vertebrates in mainland Spain. Divers. Distrib. 2010, 14, 364–373. [Google Scholar] [CrossRef]
  59. Márquez, A.L.; Real, R.; Olivero, J.; Estrada, A. Combining climate with other influential factors for modelling the impact of climate change on species distribution. Clim. Chang. 2011, 108, 135–157. [Google Scholar] [CrossRef]
  60. Guisan, A.; Thuiller, W. Predicting species distribution: Offering more than simple habitat models. Ecol. Lett. 2005, 8, 993–1009. [Google Scholar] [CrossRef]
  61. Cheng, Z.; Zhang, Y.; Xu, Y. Projection of climate zone shifts in the 21st century in China based on CMIP5 model data. Clim. Chang. Res. 2015, 11, 93–101. [Google Scholar]
  62. Qiao, H.J.; Soberón, J.; Peterson, A. No Silver Bullets in Correlative Ecological Niche Modeling: Insights from Testing among Many Potential Algorithms for Niche Estimation. Methods Ecol. Evol. 2015, 6, 1–11. [Google Scholar] [CrossRef]
Figure 1. Occurrence data of C. glauca employed in Maxent.
Forests 13 00126 g001
Figure 2. Predicted current distribution model by Maxent. Orange refers to marginally suitable habitat; light green refers to moderately suitable habitat; dark green refers to highly suitable habitat; blank refers to not suitable areas.
Forests 13 00126 g002
Figure 3. Altitude changes under current and future climate scenarios. Blue refers to total suitable habitat; orange refers to marginally suitable habitat; gray refers to moderately suitable habitat; yellow refers to highly suitable habitat.
Forests 13 00126 g003
Figure 4. Predicted suitable habitats under different climate scenarios/year for C. glauca. The black dot indicates the centroid, and the arrow indicates the magnitude and direction of the predicted change trough time. Orange refers to marginally suitable habitat; light green refers to moderately suitable habitat; dark green refers to highly suitable habitat; blank refers to not suitable areas.
Forests 13 00126 g004
Table 1. AUC ratio values based on the estimation of different E values for Maxent.
AUCratio
E = 0.05E = 0.1E = 0.2
Maxent1.0361.0341.027
Table 2. Suitable habitat areas for C. glauca in present and future climate scenarios (×104 km2).
HabitatsCurrentSSP126SSP245SSP370SSP585
2041–20602081–21002041–20602081–21002041–20602081–21002041–20602081–2100
Marginally suitable55.1872.8745.7351.5345.5765.0338.6680.1440.97
Moderately suitable74.6671.9481.6679.3380.7871.9974.2756.8771.46
Highly suitable33.0926.4543.9042.6445.5129.8651.6937.6854.48
Total suitable162.93171.26171.29173.50171.86166.88164.63174.69166.91
Publisher’s Note: MDPI stays neutral with regard to jurisdictional claims in published maps and institutional affiliations.

