Article

Response of Poplar Leaf Transcriptome to Changed Management and Environmental Conditions in Pure and Mixed with Black Locust Stands

by
Oleksandra Kuchma
1,2,
Jessica Rebola-Lichtenberg
2,3,
Dennis Janz
4,
Konstantin V. Krutovsky
1,5,6,7,8,
Christian Ammer
2,3,
Andrea Polle
2,4,5 and
Oliver Gailing
1,2,5,*
1
Forest Genetics and Forest Tree Breeding, University of Goettingen, Buesgenweg 2, 37077 Goettingen, Germany
2
Center of Biodiversity and Sustainable Land Use (CBL), University of Goettingen, Buesgenweg 1, 37077 Goettingen, Germany
3
Silviculture and Forest Ecology of the Temperate Zones, University of Goettingen, Buesgenweg 1, 37077 Goettingen, Germany
4
Forest Botany and Tree Physiology, University of Goettingen, Buesgenweg 2, 37077 Goettingen, Germany
5
Center for Integrated Breeding Research (CiBreed), University of Goettingen, Albrecht-Thaer-Weg 3, 37075 Goettingen, Germany
6
Laboratory of Population Genetics, N. I. Vavilov Institute of General Genetics, Russian Academy of Sciences, 119333 Moscow, Russia
7
Laboratory of Forest Genomics, Genome Research and Education Center, Department of Genomics and Bioinformatics, Institute of Fundamental Biology and Biotechnology, Siberian Federal University, 660036 Krasnoyarsk, Russia
8
Scientific and Methodological Center, G. F. Morozov Voronezh State University of Forestry and Technologies, Timiryazeva Str. 8, 394036 Voronezh, Russia
*
Author to whom correspondence should be addressed.
Submission received: 21 December 2021 / Revised: 12 January 2022 / Accepted: 14 January 2022 / Published: 19 January 2022
(This article belongs to the Special Issue Mixed Species Forests: Risks, Resilience and Management)

Abstract

:
Mixed cropping in short rotation coppice can be an alternative to monocultures. To design optimized mixtures, field trials are needed. Poplar, as an economically important and fast-growing species, and black locust, as a nitrogen-fixing species, are promising candidates for such studies. RNA sequencing (RNA-seq) was used to monitor effects of mixed and pure cultivations on the gene expression of poplar along with growth measurements during 2017 and 2018. Both biomass production and leaf transcriptomes revealed a strong competition pressure of black locust and the abiotic environment on poplar trees. Gene expression differed between the two study sites and pure and mixed stands. Shading effects from black locust caused the downregulation of photosynthesis and upregulation of shade avoidance genes in mixed stands in 2017. As a result of higher light availability after cutting black locust, plant organ development genes were upregulated in mixed stands in 2018. Drought conditions during the summer of 2018 and competition for water between the two species caused the upregulation of drought stress response genes in mixed stands and at the unfavorable growing site. Further investigations are required to discover the mechanisms of interspecific competition and to develop stand designs, which could increase the success and productivity of mixed plantations.

1. Introduction

Modern forestry is challenged to meet different and growing demands of society. On the one hand, it has to be highly productive and efficient, and on the other hand, it should take care to protect environment and biodiversity. In the 20th century, monocultures were dominating in plantation forestry, but increasing evidence for negative effects of monocultures on soil conditions, water balance, species diversity and facilitation of spreading of biotic (pests, diseases) and abiotic disturbances (storms, fire) [1,2,3,4,5] call for alternative forestry systems to be developed and implemented. Mixed plantations could offer such an alternative (see [6,7] for review).
Mixing different species and growing them together to achieve a positive effect in productivity has been practiced by humans for centuries on a small scale. Now, these practices need to be tested before implementing them into industrial forestry. Many studies were conducted to identify conditions for high productivity of mixed stands. This includes testing species mixtures, planting schemes, interspecific competition effects, soil, climate, etc. [8,9,10,11,12,13,14,15]. There is also evidence that mixed stands can produce wood with comparable or even higher quality compared to pure stands [16,17,18,19]. One of the mixed planting strategies to be tested is the co-cultivation of a fast growing tree species together with a nitrogen-fixing one [20]. Nitrogen is one of the most important elements for plant growth and development. If one species is able to naturally enrich the soil with this element, it would allow a reduction in the application of fertilizers and enrich poor soils and make them more usable. Observed effects on stand productivity of such mixtures varied broadly in different studies from 50% less to three times higher productivity than in pure stands [8,9,20,21,22,23,24]. Here, we tested how combinations of poplar genotypes (mostly poplar hybrids) growing together with black locust (a nitrogen-fixing species) in mixed forest experimental stands influenced gene expression.
Mixed stands of poplar and black locust have already been tested in several recent studies [22,24,25,26,27,28,29,30,31]. Black cottonwood (Populus trichocarpa Torr. and A.Gray ex Hook.) and its hybrids are among the most often used and well-studied tree species in monoculture propagation. Fast growth, adaptation potential to different environments and multiple industrial applications (paper, energy and biofuels industry) make it an important species for agroforestry and genetic studies. Black locust (Robinia pseudoacacia L.) is a nitrogen-fixing tree species, which has also been tested in mixtures in recent decades. This species has a good tolerance to drought and poor soil conditions, and its crown shape and root system are complementary to poplar [32,33]. At the same time, black locust is quite an aggressive competitor and can quickly occupy available territories, a trait which should be taken into account where the invasiveness of this species may cause problems [34,35].
Current RNA sequencing (RNA-seq) methods offer a powerful method to study the transcriptome and detect any changes in gene expression levels quickly and reliably. Sequencing of the P. trichocarpa genome in 2006 [36] created good opportunities for genetic studies of tree species using a tree model organism [37,38]. Since then, many studies have been conducted to learn about response mechanisms and functions of genes involved in different abiotic and biotic stresses in trees [39,40,41,42,43,44,45,46,47,48,49]. Most of these studies were performed under controlled greenhouse conditions to assure equal treatment of plants and reproducibility of results. Transcriptome studies in field conditions are more challenging but necessary to reveal and confirm complex gene responses to different environmental factors. They were carried out with different agricultural plants (see [50] for review). With the development of sequencing technologies, more transcriptome studies were also performed for trees [42,49,51,52,53,54,55,56].
In the present study, the results of transcriptome analyses and growth measurements performed over two years in pure poplar stands and mixed stands with black locust are reported. Experimental plots were established at two different sites to observe the influence of abiotic conditions on tree growth and development. The following hypotheses were tested: (1) environmental conditions have a strong influence on the growth performance of poplar and black locust in mixed and pure stands; (2) differences in gene expression levels between pure and mixed stands reflect the impact of environment and mixed propagation; (3) consistent patterns of gene expression can be observed across the years under field conditions.

2. Materials and Methods

2.1. Experimental Design

Poplar cuttings and black locust seedlings were planted at two ecologically different study sites near Goettingen, Germany, in April 2014 to test for differences in the growth performance of eight commercially used poplar clones in monoculture and in mixture with black locust, representing three provenances (Table 1). The first study site, Reinshof (51.484° N/9.923° E), has young fertile soil of Gleyic Fluvisol type with high water storage capacity of available water for plants (21% clay, 11% sand and 68% silt; according to the FAO classification). The second site, Deppoldshausen (51.581° N/9.967° E), is characterized by shallow (<60 cm deep) and stony soil with low ability to hold water of Calcaric Leptosol type (34% clay, 2% sand and 55% silt, according to the FAO classification). According to the field evaluation index [57], Reinshof was classified as a “fertile” site with values ranging from 81 to 89 and Deppoldshausen as a “poor” site with values from 38 to 48 (NIBIS® Kartenserver 2014). Both sites have been used as arable farmland for many decades. Farming included conventional cropping with arable crops such as sugar beet, winter wheat and winter barley in Reinshof and winter oilseed rape and winter wheat in Deppoldshausen. In 2017, Reinshof had higher total nitrogen content (2.1 ± 0.4 mg g−1 dry soil, p < 0.001) than Deppoldshausen (1.6 ± 0.2 mg g−1 dry soil). Mixtures had higher concentrations of inorganic nitrate in soil solution than monocultures [31]. Weather data between 2014 and 2018 were obtained from the DWD Climate Data Center (1 April 2014–30 June 2015, https://www.dwd.de/DE/leistungen/cdcftp/cdcftp.html?nn=17626, accessed on 18 April 2020) and for both study sites from on-site stations providing daily measurements (from July 2015, Adolf Thies GmbH & Co. KG, Goettingen, Germany) (Table S1). Volumetric water content was measured continuously (one measurement every 10 min) with soil moisture sensor Trime-Pico 32 (from July 2015, Adolf Thies GmbH and Co. KG, Goettingen, Germany) inserted 10 cm into the soil at both study sites. Sensors were placed in the central buffer areas of the experimental plots.
At both study sites four blocks (replications) were established. The design of the four blocks was exactly replicated at each site. One block consisted of 40 plots (8 rows × 5 columns). The area of one plot was 5 m × 5 m (1 m × 1 m spacing between trees), with 25 trees per plot in total. In each row, one out of the eight poplar clones was planted in a pure plot and in three plots, each mixed with one of the three black locust provenances. One of the plots in each row represented a pure black locust provenance. Each of the four blocks (repetitions) at one site consisted of the same 40 plots with a random distribution within and between the rows. The black locust provenances “HKG81901” (R1) and “HKG81902” (R2) showed no significant differences in their growth performance [28], so they were handled as one provenance throughout the whole experiment. All plots (mixed and pure) planted with the black locust provenance “Nagybudmry” were excluded from the final analysis due to low quality of the nurslings and consequently high tree mortality in this provenance (>50%) right after planting.

2.2. Stem Volume Measurements

Height and root collar diameter were measured for each tree in dormancy at the field once every year. Height was measured using a measuring pole for bigger trees and a ruler for smaller (<200 cm) trees. Root collar diameter was measured at 3 cm above ground using a digital caliper. Röhle et al. [58] stated that there is a linear correlation between root collar diameter and diameter at breast height (DBH). For this reason and for higher consistency of measurements we continued root collar diameter measurements throughout the whole experiment [59]. Stem volume was estimated using a simplified equation, V = D2H, which very well approximates wood biomass [60], where D and H are root collar diameter and height, respectively. The poplar trees sampled in August 2017 for RNA-seq were removed from the stand. In March 2018, trees of black locust provenance R1 were clipped in the same mixed stands, leaving ~30 cm tall stumps to reduce competition effects of black locust on poplar trees. Within two months, newly grown shoots reached the height of poplar trees but did not overgrow them. These plots were opened from above and received more sunlight, in contrast to 2017 and other plots where Robinia trees were not cut. An additional problem was the strong damage of poplar leaves by black locust thorns on newly grown shoots. Taking into account these changes in the plots, we used the plots with the black locust provenance R2 as intact reference plots demonstrating advanced continuous growth of black locust and its competition pressure on poplar. R1 data were excluded from the stem volume measurements, and only R2 provenance data are presented here. For practical reasons, we did not measure height for all black locust trees in 2018. Instead, we measured the height (H) of 29 sampled trees, covering the whole range of root collar diameter (D), and for the other trees the height was inferred using the following function H = a ln ( D ) b (R2 = 0.82), where a and b are fitted coefficients with the values 188.74 and 299.63, respectively, calculated from the trees with the measured height and root collar diameter using Microsoft Excel 2019 (Version 16.34 for Mac).
Statistical analysis was performed using R software version 3.5.1 [61]. Stem volume of the trees was calculated for single trees. All data compared were normally distributed. First, we compared the variances between stand types by using Fisher’s F test. In the case of lack of significance, we used ANOVA with post hoc Tukey test to compare the differences between the stand types. If the variances were significantly different, we applied the Welch test [29].

2.3. Sampling for Transcriptome Studies

Clone “Max 1” (P7, P. nigra × P. maximowiczii), which shows a very good growth performance [29] was selected for the transcriptome experiments in 2017 and 2018 (4th and 5th growing year, respectively). Only stands with Robinia R1 were selected. Fresh mature leaves from the middle part of a tree were collected in August and immediately frozen in the field in liquid nitrogen and stored at −60 °C until RNA extraction. Samples were collected from one clonal tree per plot in pure and mixed stands in all four repetitions, and both study sites, resulting in 16 samples for 2017 and 2018.

2.4. RNA Extraction

Total mRNA was extracted from 16 deeply frozen poplar leaf samples (1 clone × 2 types of stands (pure and mixed) × 2 sites × 4 samples (one sample from each block)) using a modified TRIzol protocol [62]. Quality of RNA samples was tested with NanoDrop 2000 (Thermo Fisher Scientific, Waltham, MA, USA) and 1% agarose gel electrophoresis with 1× TAE running buffer. The extracted RNA was stored for further RNA-seq and gene expression validation using quantitative real-time reverse transcription PCR (qRT-PCR). In total, 16 samples (4 samples per type of stand and site) for 2017 and 12 samples (3 samples per type of stand and site) for 2018 were prepared in this study.

2.5. RNA Sequencing

RNA-seq was performed in the NGS Integrative Genomics Core Unit (NIG), a central research service facility at the University Medical Center Goettingen (UMG). Quality and integrity of RNA was assessed with the Fragment Analyzer instrument (Advanced Analytical, Ankeny, IA, USA) by using the standard sensitivity RNA Analysis Kit DNF-471 (Agilent Technologies, Inc., Santa Clara, CA, USA). RNA-seq libraries were prepared using the TruSeq RNA Library Preparation Kit from Illumina (New England BioLabs, Frankfurt am Main, Germany). Libraries were sequenced on an Illumina HiSeq 4000 (Illumina, San Diego, CA, USA), which produced read lengths of 100 bp for 2017 and 50 bp for 2018 samples.
Shortening of 100 bp reads to 50 bp and processing of raw sequence data were performed with fastq [63] using default parameters. The processed sequences were mapped against the transcriptome of P. trichocarpa ([36]; version 3.1, downloaded from https://phytozome.jgi.doe.gov/pz/portal.html, accessed on 27 November 2019) using Bowtie 2 [64]. Bowtie mapping files were summarized to count tables of the gene models in R [61]. RNA-seq data have been deposited in the ArrayExpress database at EMBL-EBI under accession numbers E-MTAB-9040 (2017) and E-MTAB-9039 (2018).

2.6. Principal Component Analysis (PCA)

PCA based on gene expression data (number of annotated RNA transcripts) was conducted for each year of the study to monitor the overall transcriptome changes in pure vs. mixed stands. PCA was performed using the prcomp function in the stats R package [61]. PCA results were visualized using the ggbiplot function in the ggbiplot R package [65].

2.7. Identification of Differently Expressed Genes (DEGs) and Sequence Annotation

DEGs were identified using the DESeq2 R package [66] in comparisons between pure and mixed stands within a study site, total comparison of pure and mixed stands, and total comparison between study sites at a false discovery rate threshold (FDR) < 0.05 [67]. The Populus gene sequence matches for the DEGs and gene ontology (GO) terms [68] were obtained from Phytozome 12.1 and the NCBI GenBank databases [69]. The BLAST2GO software was used for annotation of DEGs and GO enrichment analysis with Fisher’s exact test [70]. Among significantly “enriched” (overrepresented) GO terms only DEGs with FDR < 0.05 were finally considered.

2.8. Quantitative Real-Time Reverse Transcription PCR (qRT-PCR)

qRT-PCR was performed to verify differences in gene expression levels between pure and mixed stands in Reinshof and Deppoldshausen using 12 individual tree samples from 2018 (three samples per type of stand and study site). cDNA synthesis was performed using 500 ng RNA and the SuperScript III First-Strand Synthesis System for RT-PCR (Invitrogen, Carlsbad, CA, USA) and Oligo(dT)20 primer. Three biological and three technical replicates and one housekeeping gene were amplified with a TOptical Gradient 96 Real-Time PCR Thermocycler (Biometra, Analytik Jena AG, Jena, Germany). Actin 2 was chosen as a reference housekeeping gene (forward primer: 5′-CCCATTGAGCACGGTATTGT-3′, reverse primer: 5′-TACGACCACTGGCATACAGG-3′; [71].
Eight genes showing strong differences in the expression rates between pure and mixed stands for both study sites and in total between Reinshof and Deppoldshausen in 2018 were selected for validation (Table S2). Gene specific primers were designed using Primer-BLAST [72]. Primers were checked for self-complementarity using Oligo Calc 3.27 [73].
The qRT-PCR mix included 4 μL of HPCL-grade H2O, 10 μL of innuMIX qPCR DSGreen Standard (Analytik Jena AG, Jena, Germany), 2.5 μL of forward and reverse primers (5 pmol/µL) and 1 μL of diluted cDNA (1:10). The PCR program was run with the following steps: pre-incubation for 3 min at 95 °C, 45 cycles of amplification with 5 s at 95 °C, 5 s at 58 °C and 15 s at 72 °C per cycle. Primer efficiencies for the analyzed genes were evaluated by dilution series. Relative gene expression was calculated with the 2−ΔΔC(T) method [74].

3. Results

3.1. Weather Data

According to the measurement during the vegetation periods (April–October from 2015 to 2018), the Deppoldshausen growing site was cooler and drier than the Reinshof site (Table S1). DWD weather data show that April 2014, when trees were planted, was unusually warm (11.4 °C) and dry (22.9 mm). Large differences between weather conditions were observed in 2017 and 2018 for this period. In Deppoldshausen, mean monthly temperature during the vegetation period differed by 2.3 °C (13.4 °C vs. 15.7 °C) and precipitation by a factor of three (84.9 vs. 28.6 mm) between the years. In Reinshof, mean monthly temperatures differed by 1.4 °C (14.3 °C vs. 15.7 °C) and precipitation by a factor of three (84.6 vs. 24.8 mm) between the years. The very wet year 2017 was followed by the very hot and dry year 2018.
Low amounts of precipitation in 2018 caused a strong decrease in soil moisture in comparison to 2017. In Deppoldshausen, mean soil moisture differed by 62.4% (19.4 vs. 12.1%) between the years. In Reinshof, mean soil moisture differed by 61.5% (16.1 vs. 9.9%) between the years (Table S1).

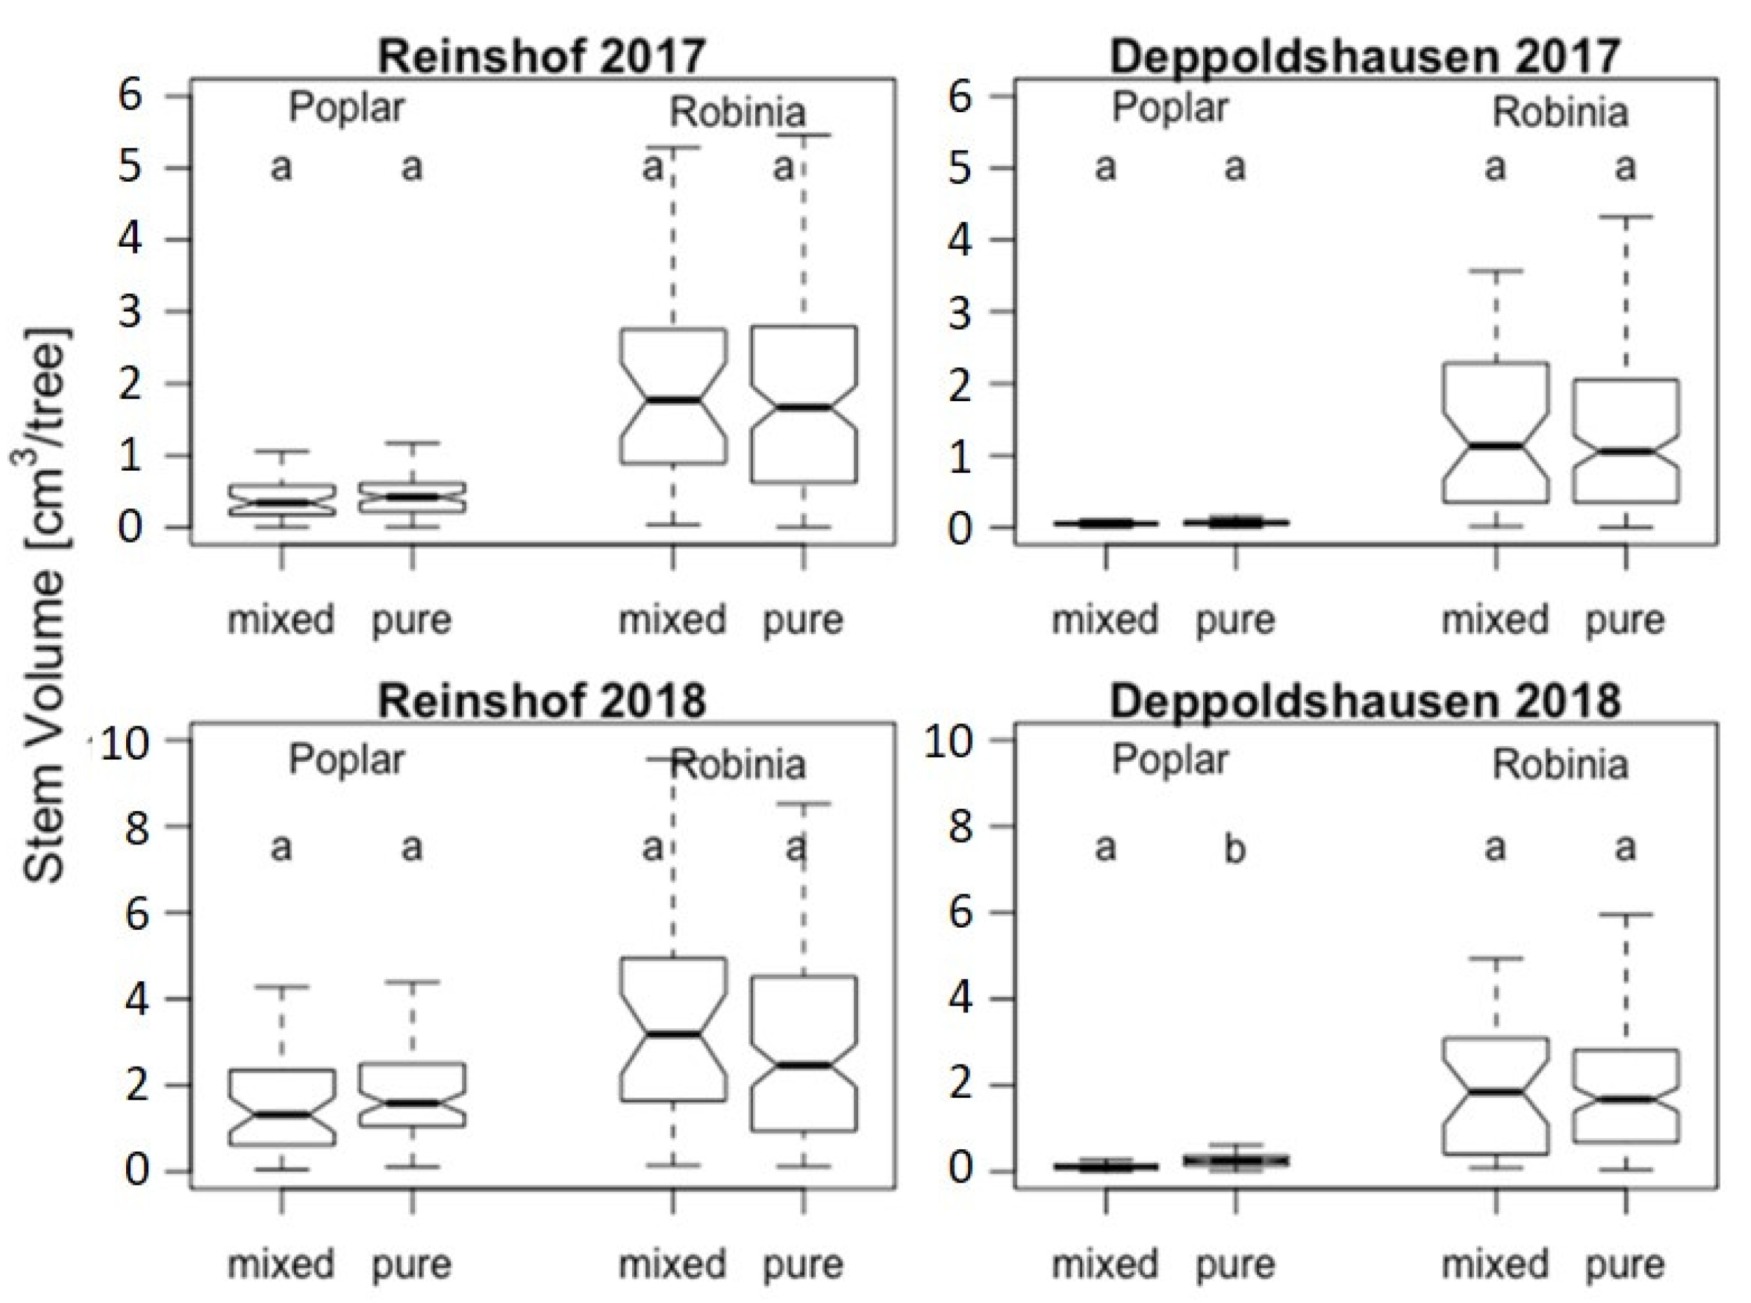
3.2. Stem Volume Measurements

Tree growth in Reinshof was much more advanced than in Deppoldshausen (Figure 1 and Table 2). In 2017, the average of poplar’s stem volume in Reinshof was more than 6.5 times higher than in Deppoldshausen (10,129 vs. 1546 cm3). A less drastic difference, but still highly significant, was observed for black locust. The average of Robinia’s stem volume in 2017 was 1.6 times higher in Reinshof than in Deppoldshausen (43,487 vs. 27,658 cm3). In 2018 the difference in growth performance between the sites became even higher for poplar (Figure 1 and Table 2). Poplar trees in Reinshof had on average a 9.3 times larger stem volume than poplar trees in Deppoldshausen (36,363 vs. 3897 cm3). Black locusts’ growth performance, in contrast, maintained the same levels as in 2017—1.7 times higher in Reinshof than in Deppoldshausen (66,923 vs. 38,306 cm3).
There were no significant differences in stem volume between black locust trees growing in pure stands and mixtures (Table 2). Poplars showed a significantly different mean stem volume per tree in stand types only in Deppoldshausen in 2018. Poplars’ mean stem volume was twice as high in pure stands than in mixtures (Figure 1 and Table 2) and strongly progressed from 2017 to 2018 with much higher increases in Reinshof than in Deppoldshausen in both pure and mixed stands. Black locust stands also showed continuous growth in both sites and stand types. Robinia’s mean stem volume was much higher than poplars’ at both sites and stand types (Figure 1 and Table 2), ranging from 1.6 times in pure stands in Reinshof in 2018 to a 19 times higher average stem volume in mixtures in Deppoldshausen in 2017 (Table 2).

3.3. RNA Sequencing Output and Sequence Annotation

The RNA-seq of the 16 poplar samples from 2017 resulted in 637,978,826 nucleotide reads after quality trimming in total, ranging from 28,312,231 to 67,188,501 reads per individual library (39,873,676.63 reads on average). In 2018, the sequencing of the 12 poplar samples resulted in 323,287,700 reads after quality trimming in total, ranging from 15,845,017 to 31,383,939 reads per individual library (26,940,641.67 reads on average). Mapping success to the P. trichocarpa transcriptome varied from 41.4 to 74.8% (66.2% on average) for 2017 samples and from 40.4 to 73.4% (59.4% on average) for 2018 samples (Table S3).

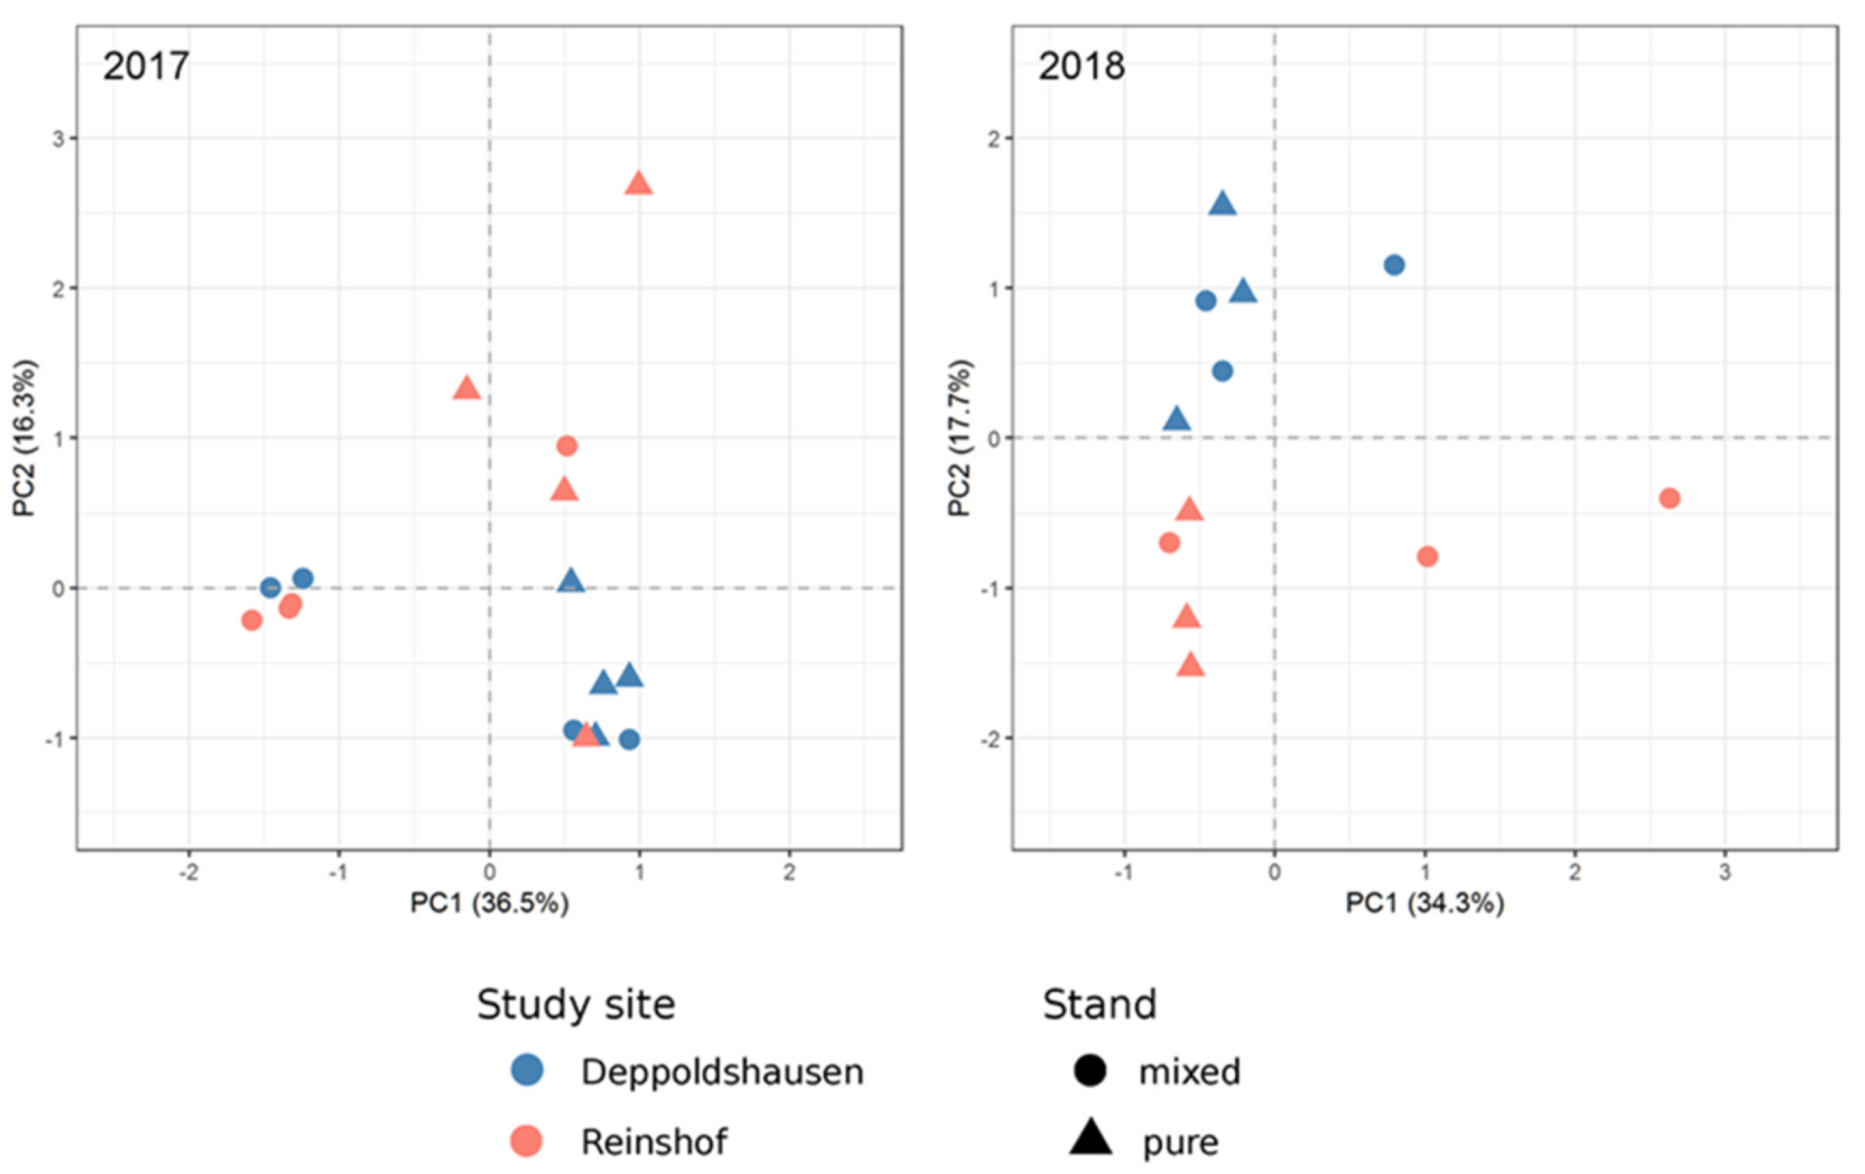
3.4. Principal Component Analysis (PCA)

A PCA of 2017 samples (Figure 2) showed stronger separation between pure and mixed samples than between study sites. In 2018, a clear separation according to study site was found, in contrast to the 2017 results (Figure 2).

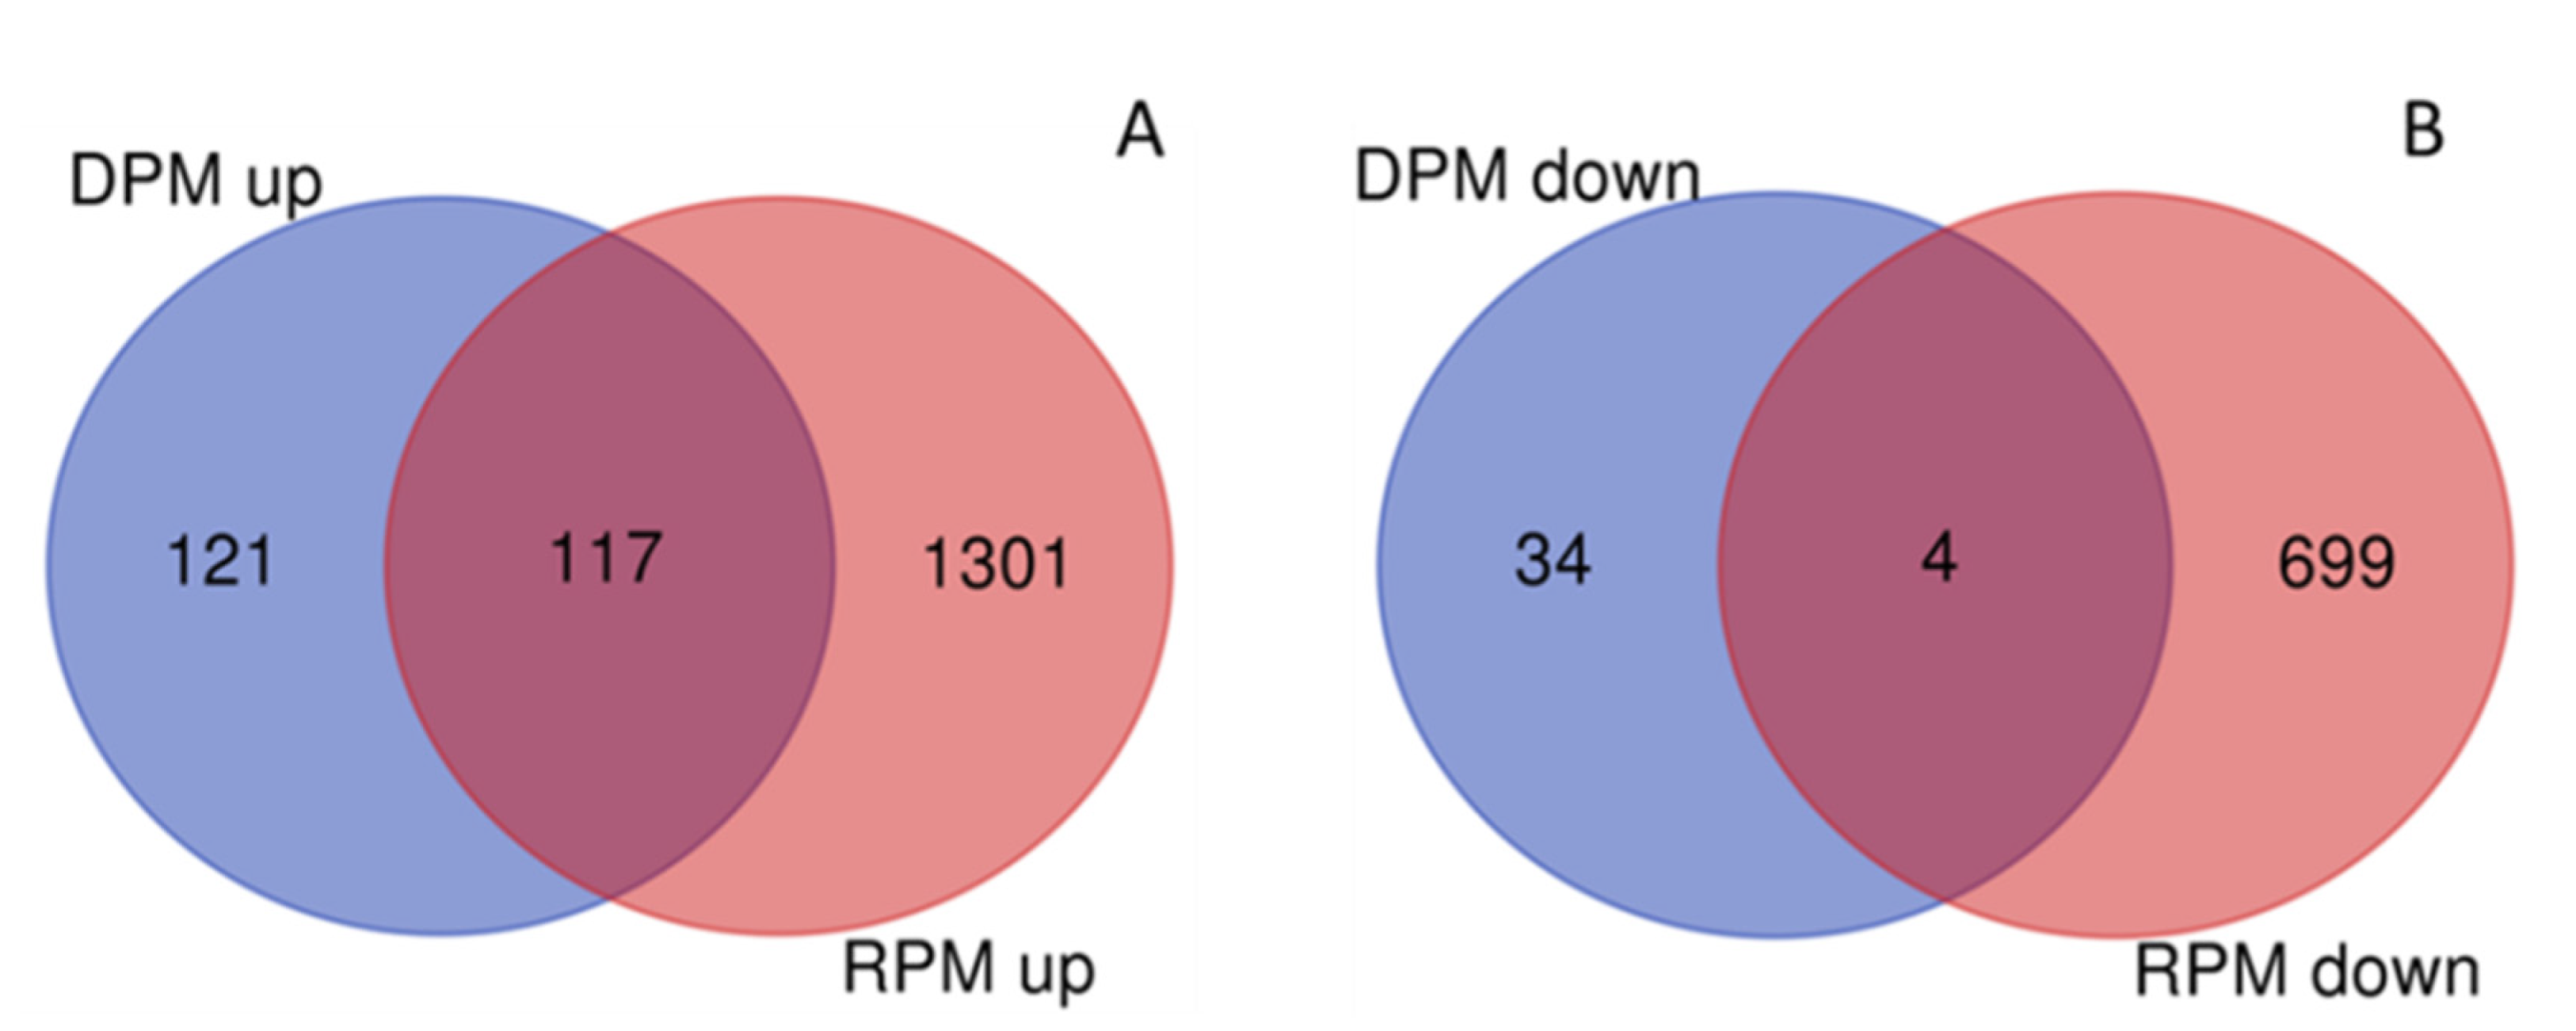
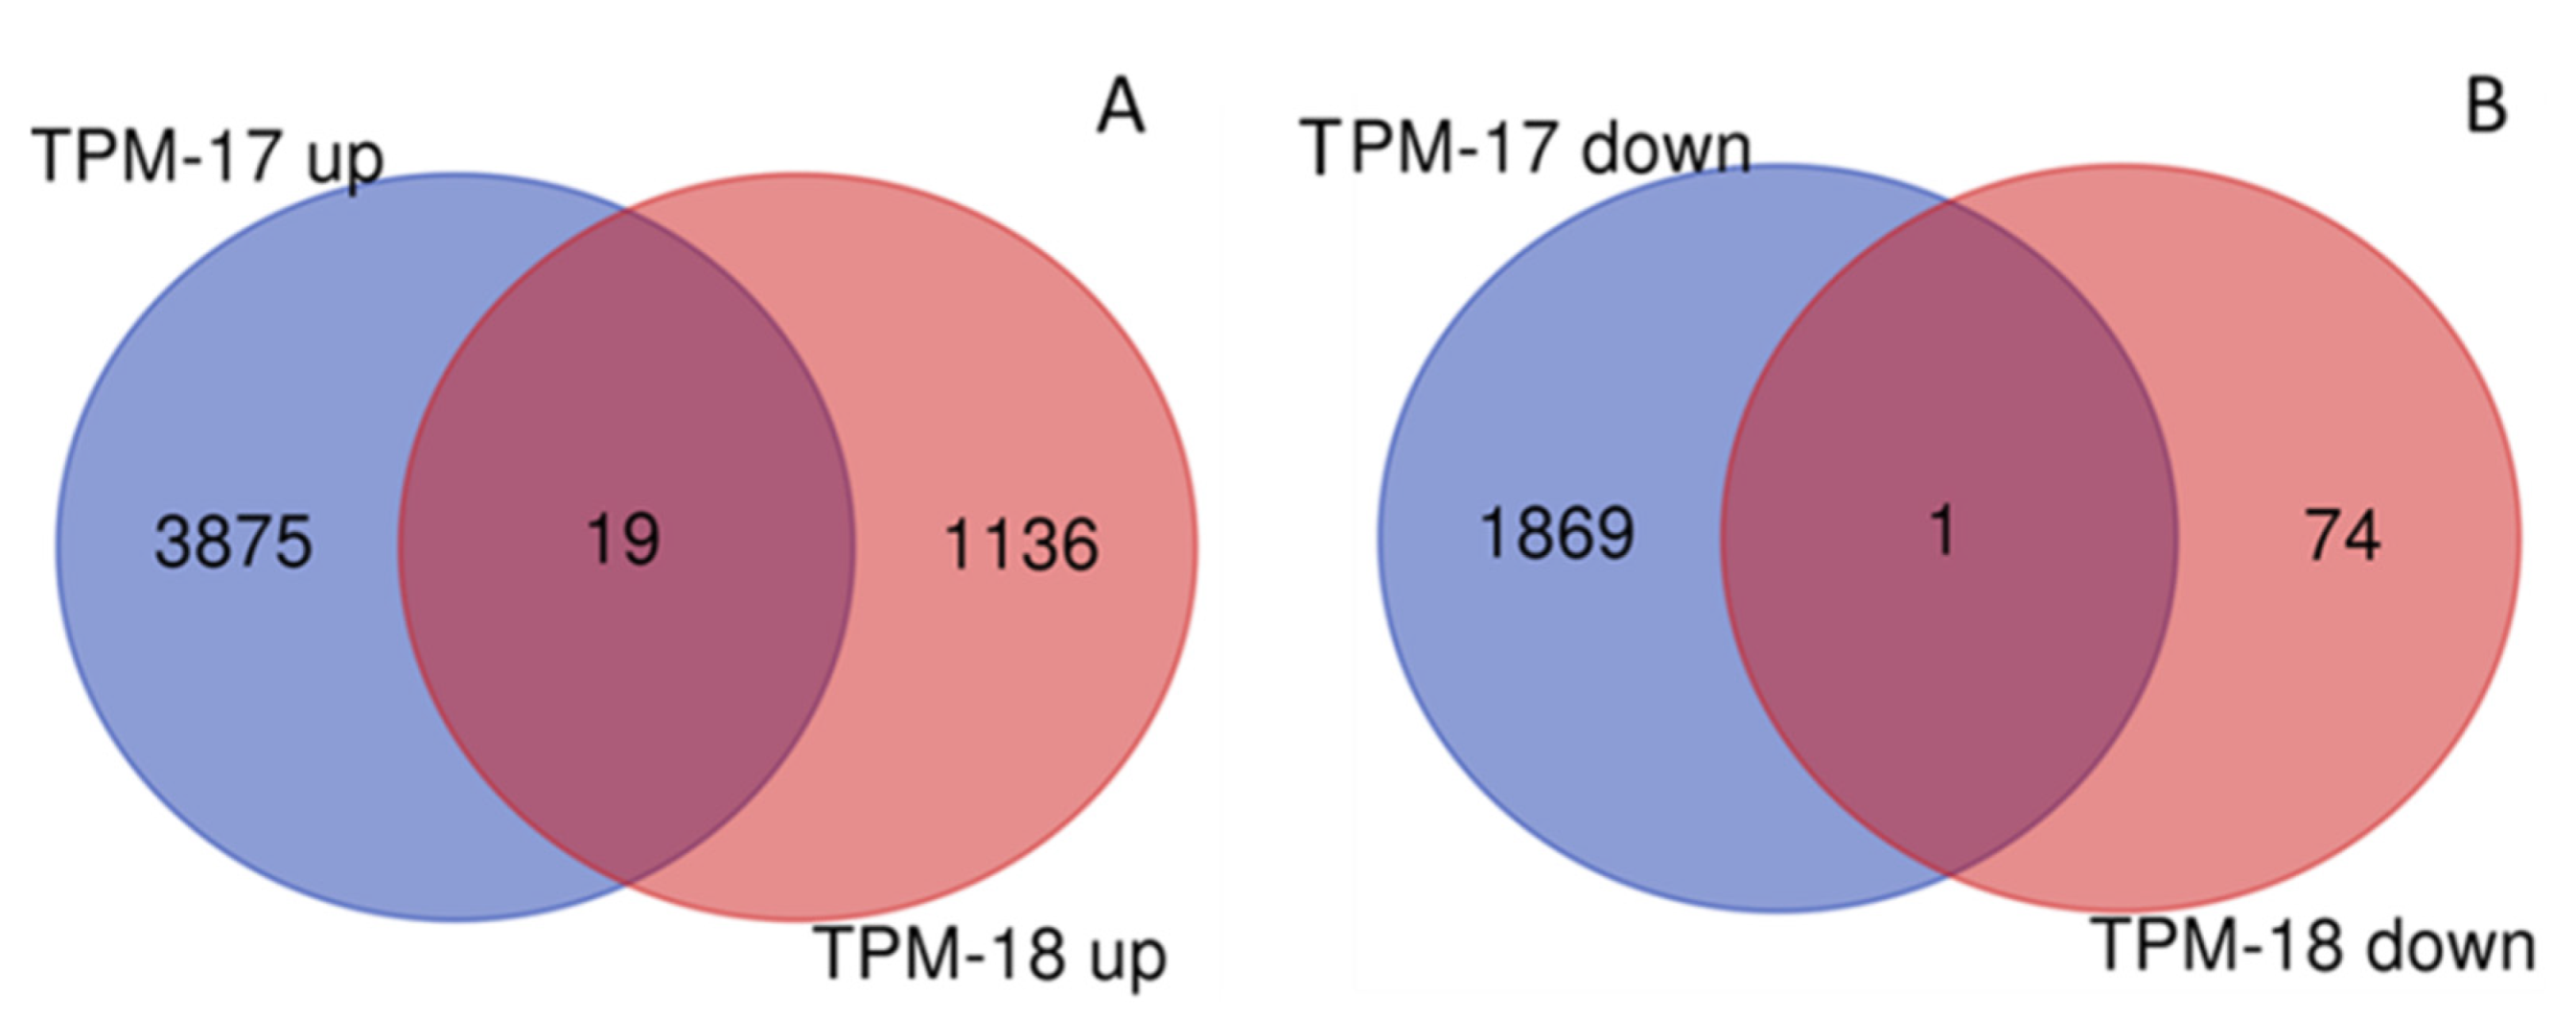
3.5. DEGs between Study Sites and Pure and Mixed Stands

Comparisons of 2017 samples for DEGs according to type of stand and study site were in accordance with PCA figures. There were 5764 DEGs in the total pure vs. mixed (TPM) stands comparison across study sites with 3894 up- and 1870 downregulated genes in mixed samples. No DEGs were observed in the total comparison of study sites (TSS, Reinshof vs. Deppoldshausen). Comparisons of differences between pure and mixed samples within each study site were also performed (Table 3 and Tables S4–S6). Among all genes, the same 117 genes were upregulated and four genes were downregulated in both DPM and RPM (Figure 3).
In 2018, comparisons of samples for DEGs according to type of stand and study site were also in accordance with PCA figures. In total, 2496 DEGs were observed in TSS with 1139 and 1357 upregulated genes in Deppoldshausen and Reinshof, respectively. There were 1230 DEGs in TPM with 1155 up- and 75 downregulated genes in mixed samples. The results of comparisons between pure and mixed samples within each study site were quite different from the results of 2017. In Deppoldshausen, no up- and only one downregulated gene in mixed samples were detected. In Reinshof, 1765 DEGs with 1654 up- and 111 downregulated genes in mixed samples were observed (Table 3 and Tables S7–S10).
Comparing 2017 and 2018 for overlapping genes between years, 100 DEGs were revealed in TPM and 82 DEGs in RPM (Figure 4, Table S11). Most of the overlapping genes demonstrated opposite expression profiles between years, but some DEGs showed the same expression profile in mixed stands for both years: Nineteen upregulated genes in TPM (with seven genes involved in response to stress or defense response), one downregulated gene in TPM, and one gene in RPM. No overlapping DEGs were observed for DPM.

3.6. GO Term Enrichment Analysis

GO term enrichment analysis was performed to study the response of the poplar transcriptome during 2017 and 2018 to the observed overgrowth and competition pressure of black locust in mixtures in comparison to pure stands (field observation). We aimed to reveal specific gene groups, which could indicate a response to competition and environmental conditions. In addition, changes in the poplar transcriptome caused by the clipping of R1 Robinia in mixed stands were observed. The analyses were performed for genes overrepresented in the “biological process” GO category, for up- and downregulated genes separately and for all comparisons—TPM, DPM, RPM, and TSS.

3.6.1. 2017 Samples

From the results of GO term enrichment analysis several gene groups were selected that demonstrate the influence of black locust on the performance of poplar in mixed stands (TPM) and differences between the study sites (DPM and RPM) (Table 4). In the TPM downregulated gene set in mixed stands gene groups such as “photosynthesis” and “generation of precursor metabolites and energy” were enriched, which also had the highest significance according to the FDR values. These two groups were also present in DPM. Various biosynthetic processes gene groups (pigments, lipids, organophosphates, polysaccharides) were enriched in the downregulated data set in TPM and DPM, too (Table 4, Tables S12 and S14). No enriched gene groups were detected in the downregulated gene set in mixed stands in Reinshof.
In TPM, DPM and RPM, “response to stress” with the subgroup “response to wounding”, “response to biotic stimulus” and “hormone metabolic process” groups were enriched in the upregulated gene set in mixed stands (Tables S13, S15 and S16). The subgroup “response to starvation” was overrepresented in TPM and DPM. In TPM and RPM “leaf senescence”, “shade avoidance” and the subgroups “response to water deprivation”, “response to fungus” and “response to bacterium” were enriched.

3.6.2. 2018 Samples

According to the PCA and the gene expression data, the separation between study sites became stronger in 2018, and these data were used in the GO term enrichment analysis (TSS). In general, the results of the 2018 analysis differed strongly from the 2017 data. Partly different GO term groups were enriched in three comparisons (TSS, TPM and RPM) and far fewer overlapping groups were observed (Table 4). The groups “photosynthesis” and “NADPH regeneration” (belong to “generation of precursor metabolites and energy” GO term), in contrast to 2017, were not enriched in TPM at all, but upregulated and enriched in Deppoldshausen (TSS-D). The group “response to wounding” was enriched only in RPM, and “shade avoidance” was present only in TSS-R. Hormone-involved groups, in some form, were present in all comparisons except TSS-D similar to 2017 data. New gene groups in the 2018 enrichment analysis were “nitrate transport”, and many growth and developmental processes involved groups which appeared in TPM and RPM (Table 4 and Tables S17–S21). Various gene groups involved in biosynthetic processes were present in RTM, too. In TSS, both study sites showed different sets of enriched gene groups, overlapping only by “response to stress” and pigment-involved processes, but different genes were included in the “response to stress” group in TSS-R and TSS-D. Poplar plants in Deppoldshausen (TSS-D) demonstrated signs of abiotic stress with “response to heat” and “response to water deprivation” gene groups, while trees in Reinshof (TSS-R) were apparently more affected by biotic stress with a high number of genes involved in “response to biotic stimulus”. Various biosynthetic process gene groups (lipids, chlorophyll, organophosphates and polysaccharides) were additionally enriched in the upregulated data in TSS-D (Tables S17–S21). Unlike TSS-D, various gene groups involved in growth and development processes (anatomical structure morphogenesis, tissue development and cell maturation) were enriched in TSS-R.

3.7. Quantitative Real-Time Reverse Transcription PCR (qRT-PCR)

Eight genes showing differences in expression in RPM, DPM and TSS were selected for qRT-PCR to validate the RNA-seq data. The qRT-PCR results confirmed expression profiles for all genes (Table S22).

4. Discussion

The results of observations during the first three years (2014–2016) of stands’ establishment showed that Robinia was growing continuously faster than Populus in both mixed and pure stands. Black locust growth was significantly higher in the mixture than in the monoculture in the first three years. The poplars did not show any significant differences in growth between pure stands and mixtures during the first year, but in the next two years a significantly higher mean stem volume was measured in mixed stands, and starting from the fourth year (2017), the opposite trend with lower mean stem volume in mixtures was registered [29]. In the study of Marron et al. [27] partly different effects were observed. According to their observations, after continuous growth of poplars in the mixed and the pure stands, starting from the third growth year the black locusts stagnated, and tree height in the mixed stands was lower than in the pure one. The faster growth of black locust can partly be explained by the hot and dry weather conditions during planting (April 2014), which black locust can tolerate better than water-dependent poplar [75]. Under these conditions, most probably, rooted seedlings of black locust also had an advantage over poplar cuttings, facilitating the establishment of Robinia trees. The results of transcriptome analysis obtained in our study in May 2016 [76] were similar with the obtained results based on poplar growth performance in 2016 [29]. However, according to our data, differences between study sites were stronger than between pure and mixed stands, showing that at the start of the vegetation period in 2016 black locust did not influence poplar plants strongly. Nevertheless, towards the end of the vegetation period in 2016, an increasing competition pressure of Robinia on Populus trees became clearly visible [29]. We assume that first signs of interspecific competition could have become detectable at this time at the gene level, too. Therefore, it was decided that future sampling for transcriptome studies in the second half of the vegetation period would be performed.

4.1. Stem Volume Measurements

The more rapid growth of Robinia in comparison to Populus continued in 2017–2018. Robinia maintained faster growth regardless of site and stand type (Figure 1 and Table 2). A higher amount of precipitation during the vegetation season in 2017 in comparison to the same period in 2016 (80 mm vs. 50 mm, respectively, for both study sites; Table S1) might have additionally facilitated the growth of black locust, and being a drought-resistant species [32,33], Robinia was easily able to tolerate drought conditions during the vegetation season in 2018 (a reduction in precipitation amount from 80 mm in 2017 to less than 30 mm in 2018). Mean stem volume of poplars also increased in 2017 and 2018 at both study sites and stands. This also might be an effect of higher water availability in 2017. We did not find any significant differences between pure and mixed stands in the stem volume data for either species during either year or towards the end of 2018, except for a significantly higher stem volume measured in pure poplar stands in Deppoldshausen in 2018, which might be explained by a weaker growth of black locust in the surrounding blocks and less shading effects.
Our results confirm the importance of appropriate site selection for the establishment of mixed plantations, which has already been pointed out in several studies [8,77,78]. We observed large differences between growth performance of poplar trees in Reinshof and Deppoldshausen in 2017 and 2018 (six and nine times, respectively), and at the same time, relatively stable and less pronounced differences in black locust growth for both sites and years (Table 2). In addition, black locust growth was much more advanced in comparison to poplar growth in Deppoldshausen (in both mixture and pure stands) than in Reinshof (for example, mean stem volume of Robinia was 19 times higher than poplar in the mixture in 2017 in Deppoldshausen vs. 4.7 times in Reinshof). The significantly advanced growth of black locust in Deppoldshausen is a result of its high tolerance to poor soil conditions (leptosols soil type) in comparison to poplar [79].
The proportion of trees in the mixture also plays an important role in the stand performance [22,24,77,78]. Although working with the same species (Populus alba and Robinia pseudoacacia), Rédei et al. [22] showed maximum growth for a mixture composed of about 50% of each species, and Oliveira et al. [24] observed increased yield for the mixture with 25% of black locust. In our experiment with 50% of each species and better starting growth conditions, black locust developed strong competition pressure on poplar trees [30].

4.2. PCA and DEG Analyses

The PCA results based on the transcriptome sequencing data of poplar samples in 2017 and 2018 showed a similar pattern as the results for growth performance of poplar. In 2017, stronger differences in gene expression between pure and mixed stands were observed according to the PCA results as compared to 2016, which could reflect the competition pressure of black locust to poplars at the gene expression level (e.g., downregulation of photosynthesis and upregulation of shade avoidance genes). At the same time, the mean stem volume of 2017 showed no significant differences between pure and mixed stands but large differences between the study sites (Table 2). Opposite to the 2017 results, the PCA demonstrated complete separation between Reinshof and Deppoldshausen samples in 2018. This corresponded with the mean stem volume in 2018 and gene expression patterns in 2016 where differences between both study sites were much stronger than those between pure and mixed stands. In summary, over three years we observed the changing effects of competition with black locust and study site effects on poplar gene expression patterns, discovering the following trends: 2016—weak competition effects and influence of study sites in still-establishing stands, 2017—stronger competition effects due to the advanced growth of black locust and 2018—stronger influence of study sites after removing black locust and reducing competition.
The clustering of samples in the PCA plot was mirrored by DEG numbers in DESeq analysis (Table 3). In 2017 the highest number of DEGs was detected between pure and mixed stands (TPM), and no DEGs were found between study sites (TSS). In separate comparisons for each study site, a much higher number of DEGs was revealed between pure and mixed stands in Reinshof than in Deppoldshausen. In 2018, we observed a two times higher number of DEGs between study sites (TSS) than between pure and mixed stands (TPM). The study site analysis revealed a high number of DEGs in RPM but only one DEG in DPM. A small number of DEGs overlapped between the years in TPM and RPM, but most of them had opposite expression profiles (Table S11). In Arabidopsis [80] and Oryza [81] it was shown that the same genes can be up- or downregulated depending on stress conditions or stress type. Few stress-response genes in TPM were found to be upregulated in mixed stands in both years—including defense response to bacterium and fungus (six genes) and response to drought (one gene)—showing that these stress factors had a continuous influence. In total, the DEG results also indicate a stronger influence of the study site on the total stand performance in 2018. It seems that response of trees was more uniform in Deppoldshausen with its harsher growing conditions, in contrast to Reinshof where we observed higher individual tree variation.

4.3. GO Term Enrichment

4.3.1. 2017 Samples

Obvious dominance of Robinia over Populus from the end of 2016 and through the 2017 vegetation season affected the transcriptome response of poplar trees in mixtures in comparison to pure stands (Table 4 and Tables S12–S16). Different environmental conditions at the growing sites additionally promoted them. Genes involved in photosynthesis and generation of metabolites and energy were overrepresented among the downregulated genes in mixed stands in TPM and DPM. Cohen and Leach [81] clearly showed in their comparative study of core transcriptome responses in rice that the downregulation of photosynthesis is a universal response to any type of stress. Generation of metabolites and energy is directly connected with photosynthesis. Both of these processes influence further metabolic processes, which was also reflected in our data by the downregulation of gene groups involved in biosynthesis of lipids (GO: 0008610), pigments (GO: 0046148), organophosphates (GO: 0090407, GO: 0034654) and polysaccharides (GO: 0000271) (Table 4, Tables S12 and S14). At the same time, shade avoidance genes were enriched in the upregulated gene set in TPM and RPM. Shade avoidance syndrome (SAS) is a complex reaction of plants to competition for light with neighboring vegetation [82,83]. SAS promotes excessive growth and elongation of plant organs [84] that can affect stem sturdiness and reduce the yield. Differences between study sites for photosynthesis and shade avoidance genes can possibly be explained by the intensity of black locust growth in mixtures. The mean stem volume of Robinia was up to 19 times higher than that of Populus in Deppoldshausen. This difference was also observed in Reinshof but with less impact (4.7 times higher mean stem volume for Robinia in comparison with Populus) (Table 2). While poplar trees in Reinshof were still able to respond with “shade avoidance” mechanisms, the trees in Deppoldshausen were completely overtopped by black locust, and their photosynthesis and biosynthesis processes were massively downregulated. In response to mixture and study site similar groups of genes were enriched such as “response to stress” and “response to biotic stimulus” indicating high abiotic and biotic stress on the poplar plants caused by environmental stressors in addition to Robinia competition pressure. However, stress subgroup distribution between the study sites was quite different. Only the “response to wounding” subgroup was represented in both gene sets, probably as a result of the wounding of poplar leaves by black locust thorns and damage through other pests. Poor soil conditions could be a reason for overrepresented upregulated “response to starvation” genes in DPM. Higher temperature and lower soil moisture, in comparison to Deppoldshausen, might be responsible for the upregulation of “response to water deprivation” genes in RPM. The upregulation of response genes to a biotic stimulus, including fungus and bacterium response genes, indicates that the Reinshof mixed stands were more affected by biotic stress than those at Deppoldshausen. The Deppoldshausen study site is surrounded by forests and the Reinshof study site by extensive agricultural fields that might facilitate pests’ spreading. Many studies also demonstrated an influence of low light availability on abiotic and biotic stress response in plants, which, in most of the cases, increases negative effects on plant growth (see for review Courbier and Pierik [85]). It can be especially problematic in conditions of high plant density, such as agricultural propagation, if SAS and other stress factors are combined. Together with the upregulation of stress-response genes we observed an enrichment for hormone-involved genes in mixed stands in all comparisons. Plant disease resistance and stress response are complex, multicomponent systems regulated by a complex network of defense signaling pathways including plant hormones [86]. The upregulation of genes controlling phytohormone metabolism and responsive pathways also belongs to the core transcriptome reactions to any type of stress [81]. Leaf senescence is a part of the plant life cycle, a preceding stage before the end of the vegetation period. However, it can also occur as a response to stress conditions and helps the tree redistribute available nutrient resources, allowing the plant to survive [87]. Drought is one of the most well-studied stress factors provoking early leaf senescence [88]. Therefore, enrichment for “leaf senescence” genes might be directly connected to the observed upregulation of the “response to water deprivation” gene group.

4.3.2. 2018 Samples

We can only speculate that further development of transcriptome responses in stands in 2018 would continue approximately in the same direction as growth development of the R2 reference stands—with growing competition pressure from black locust on poplar and increasing differences in poplar growth between both study sites. With clipping R1 trees in an attempt to reduce competition pressure and, possibly, stimulate the growth of poplar trees in mixtures, we could observe changes in the gene expression profile in 2018. Although clipped Robinia quickly developed new shoots reaching the size of poplar trees, they did not overgrow them. The poplar trees were exposed to more light than in 2017. Extreme weather conditions in summer 2018 (heat and drought) enhanced even more the differentiation between study sites. While in 2017 mean stem volume of poplar in mixed stands in Reinshof was 7 times higher than in Deppoldshausen, in 2018 the difference was 13 times higher (Table 2). Enrichment of “photosynthesis” and “NADPH regeneration” groups in the upregulated gene set in TSS-D might be a reaction to higher light availability and compensation of photosynthesis downregulation in 2017. “Shade avoidance” genes appeared in Reinshof in 2018 possibly as a result of black locust resprouting. The mean stem volume difference between Robinia and Populus was 14.2 times in Deppoldshausen vs. 2 times in Reinshof in 2018. With higher light availability in both study sites pigment-involved genes were upregulated. At both study sites, as in 2017, “response to stress” genes were also overrepresented. As a cooler study site, Deppoldshausen demonstrated a stronger response to heat and—in contrast to 2017—to a drought that was possibly caused by the lower amount of precipitation it received than in Reinshof in August 2018. Similar to 2017, Reinshof stands were more affected by biotic stress and showed the upregulation of phytohormone metabolic processes. Auxin is one of the most important plant hormones involved in the growth and development of plant organs. So, simultaneous enrichment for “response to auxin” and “plant organ development” can be expected. Better total growing conditions in Reinshof resulted in overexpression of involved genes, in contrast to Deppoldshausen.
Changed light and weather conditions also influenced differentiation between pure and mixed stands. Trees from mixed stands demonstrated very different (more diffuse, especially in Reinshof samples) individual gene expression profiles than in 2017. There were no differences in gene expression between pure and mixed stands in Deppoldshausen. It is possible that better light conditions promoted the growth of trees in mixed stands at least to the level of pure stands and upregulation of “photosynthesis” and “NADPH regeneration” gene groups observed in TSS-D, before negative effects of weather conditions accumulated. So, differences in gene expression in TPM and RPM were mostly influenced by Reinshof samples and clearly seen in the strong overlapping of enriched gene groups in both comparisons. Better light conditions promoted the growth of poplar in mixed stands (upregulation of “plant organ development” gene group in TPM). A combined positive effect of light availability and fertile soil in Reinshof explains the upregulation of this gene group in RPM and TSS-R. This suggestion is additionally supported by the enrichment of upregulated genes in groups of hormone-involved genes, “nitrate transport”, “cell wall organization or biogenesis” and “cell growth” in mixed stands. Noteworthily, in poplar stems in this experiment, N metabolism was also induced [31]. Similar to 2017, the “response to wounding” gene group is still overrepresented in RPM, indicating continuous damage by black locust thorns and pests reflected in the upregulation of “response to biotic stimulus” genes in TSS-R.
In our study, strong interspecific competition, unfavorable climate and contrasting soil conditions resulted in the worse growth performance of poplar than black locust in both pure and mixed types of stands. The leaf transcriptome analysis of poplar samples from pure and mixed stands allowed us to observe environmental and competition influences at the gene expression level.

5. Conclusions

Adverse climate conditions during the planting most likely induced interspecific competition between black locust and poplar trees in the first years of stands’ development, which the poplars were not able to overcome until 2018. Unfavorable climate conditions in later years worsened the situation. Large differences in performance between study sites for poplar and black locust again highlighted the importance of optimal growing conditions for both partner species. At the marginal site, the growth performance of the mixture was the same as the black locust in the monoculture. The results of leaf transcriptome analyses correspond well with the field observations. The influence of study site conditions, effects from the black locust competition pressure in 2017 and higher light availability for poplars in 2018 were reflected in gene expression levels. Changes in growing conditions produced differing expression patterns between the years, which were also detectable under field conditions. Further investigations are required to discover the mechanisms and to develop stand designs that could increase the success and productivity of mixed plantations.

Supplementary Materials

The following supporting information can be downloaded at: https://0-www-mdpi-com.brum.beds.ac.uk/article/10.3390/f13020147/s1, Table S1: Weather data for the period of April–October for 2014–2018, Table S2: Genes used for qRT-PCR validation, Table S3: Quality and quantity of sequenced reads for all samples before and after trimming, mapping and coverage values for all poplar samples, Table S4: List of DEGs in comparison of the total pure vs. mixed (TPM) stands in 2017, Table S5: List of DEGs in comparison of pure vs. mixed stands in Deppoldshausen (DPM) in 2017, Table S6: List of DEGs in comparison of pure vs. mixed stands in Reinshof (RPM) in 2017, Table S7: List of DEGs in comparison of the total pure vs. mixed (TPM) stands in 2018, Table S8: List of upregulated genes in comparison of total study sites (TSS) for Deppoldshausen and Reinshof in 2018, Table S9: List of DEGs in comparison of pure vs. mixed stands in Deppoldshausen (DPM) in 2018, Table S10: List of DEGs in comparison of pure vs. mixed stands in Reinshof (RPM) in 2018, Table S11: List of overlapping DEGs in 2017 and 2018 across different stand types, Table S12: GO terms significantly enriched in “biological process” GO category in comparison of the total pure vs. mixed (TPM) stands for downregulated genes in 2017, Table S13: GO terms significantly enriched in “biological process” GO category in comparison of the total pure vs. mixed (TPM) stands for upregulated genes in 2017, Table S14: GO terms significantly enriched in “biological process” GO category in comparison of pure vs. mixed stands in Deppoldshausen (DPM) for downregulated genes in 2017, Table S15: GO terms significantly enriched in “biological process” GO category in comparison of pure vs. mixed stands in Deppoldshausen (DPM) for upregulated genes in 2017, Table S16: GO terms significantly enriched in “biological process” GO category in comparison of pure vs. mixed stands in Reinshof (RPM) for upregulated genes in 2017, Table S17: GO terms significantly enriched in “biological process” GO category in comparison of total study sites (TSS) for upregulated genes in Deppoldshausen in 2018, Table S18: GO terms significantly enriched in “biological process” GO category in comparison of total study sites (TSS) for upregulated genes in Reinshof in 2018, Table S19: GO terms significantly enriched in “biological process” GO category in comparison of the total pure vs. mixed (TPM) stands for upregulated genes in 2018, Table S20: GO terms significantly enriched in “biological process” GO category in comparison of pure vs. mixed stands in Reinshof (RPM) for downregulated genes in 2018, Table S21: GO terms significantly enriched in “biological process” GO category in comparison of pure vs. mixed stands in Reinshof (RPM) for upregulated genes in 2018, Table S22: Differences in expression based on RNA-seq and qRT-PCR of eight genes in comparison of comparison of pure vs. mixed stands in Reinshof (RPM), Deppoldshausen (DPM) and total study sites (TSS)

Author Contributions

Conceptualization, A.P., C.A., K.V.K. and O.G.; formal analysis and investigation, O.K., J.R.-L. and D.J.; writing—original draft preparation, O.K., J.R.-L. and D.J.; writing—review and editing, A.P., C.A., K.V.K. and O.G.; supervision, K.V.K. and O.G.; project administration, A.P., C.A. and O.G.; funding acquisition, A.P., C.A. and O.G. All authors have read and agreed to the published version of the manuscript.

Funding

This research was funded by the German Federal Ministry of Education and Research (BMBF; FKZ 031A351C) within the framework of the IMPAC3 project (“Novel genotypes for mixed cropping allow for improved sustainable land use across arable land, grassland and woodland”) carried out at the Centre of Biodiversity and Sustainable Land Use of the University of Goettingen.

Informed Consent Statement

Not applicable.

Data Availability Statement

RNA-seq data have been deposited in the ArrayExpress database at EMBL-EBI (https://www.ebi.ac.uk/arrayexpress/ accessed on 18 April 2020) under accession numbers E-MTAB-9040 (2017) and E-MTAB-9039 (2018).

Acknowledgments

We thank Gabriela Salinas for the RNA-seq (NGS Integrative Genomics Core Unit (NIG), the University Medical Center, Goettingen, Germany), Christine Radler for help with the sampling and Larissa Kunz and Alexandra Dolynska for help in conducting the laboratory work. We are grateful for the valuable administrative support provided by Horst Steinmann (Centre of Biodiversity and Sustainable Land Use, CBL). We acknowledge support from the Open Access Publication Funds of the University of Goettingen.

Conflicts of Interest

The authors declare no conflict of interest.

References

  1. Baltodano, J. Monoculture forestry: A critique from an ecological perspective. In Tree Trouble: A Compilation of Testimonies on the Negative Impact of Large-Scale Monoculture Tree Plantations; Prepared for the 6th COP of the FCCC.; Friends of the Earth International: Amsterdam, The Netherlands, 2000; pp. 2–10. [Google Scholar]
  2. Bowyer, J. Forest plantations Threatening or Saving Natural Forests? Arborvitae (IUCN/WWF For. Conserv. Newsl.) 2006, 31, 8–9. [Google Scholar]
  3. Morris, J.; Ningnan, Z.; Zengjiang, Y.; Collopy, J.; Daping, X. Water use by fast-growing Eucalyptus urophylla plantations in southern China. Tree Physiol. 2004, 24, 1035–1044. [Google Scholar] [CrossRef] [PubMed] [Green Version]
  4. Carnus, J.M.; Parrotta, J.; Brockerhoff, E.; Arbez, M.; Jactel, H.; Kremer, A.; Lamb, D.; O’Hara, K.; Walters, B. Planted forests and biodiversity. J. For. 2006, 104, 65–77. [Google Scholar] [CrossRef]
  5. Brockerhoff, E.G.; Jactel, H.; Parrotta, J.A.; Ferraz, S.F.B. Role of eucalypt and other planted forests in biodiversity conservation and the provision of biodiversity-related ecosystem services. For. Ecol. Manag. 2013, 301, 43–50. [Google Scholar] [CrossRef]
  6. Liu, C.L.C.; Kuchma, O.; Krutovsky, K.V. Mixed-species versus monocultures in plantation forestry: Development, benefits, ecosystem services and perspectives for the future. Glob. Ecol. Conserv. 2018, 15, e00419. [Google Scholar] [CrossRef]
  7. Ammer, C. Diversity and forest productivity in a changing climate. New Phytol. 2019, 221, 50–66. [Google Scholar] [CrossRef] [Green Version]
  8. Forrester, D.I.; Bauhus, J.; Cowie, A.L.; Vanclay, J.K. Mixed-species plantations of Eucalyptus with nitrogen-fixing trees: A review. For. Ecol. Manag. 2006, 233, 211–230. [Google Scholar] [CrossRef] [Green Version]
  9. Sayyad, E.; Hosseini, S.M.; Mokhtari, J.; Mahdavi, R.; Jalali, S.G.; Akbarinia, M.; Tabari, M. Comparison of growth, nutrition and soil properties of pure and mixed stands of Populus deltoides and Alnus subcordata. Silva Fenn. 2006, 40, 27–35. [Google Scholar] [CrossRef] [Green Version]
  10. Piotto, D. A meta-analysis comparing tree growth in monocultures and mixed plantations. For. Ecol. Manag. 2008, 255, 781–786. [Google Scholar] [CrossRef]
  11. Pretzsch, H.; Block, J.; Dieler, J.; Dong, P.H.; Kohnle, U.; Nagel, J.; Spellmann, H.; Zingg, A. Comparison between the productivity of pure and mixed stands of Norway spruce and European beech along an ecological gradient. Ann. For. Sci. 2010, 67, 712. [Google Scholar] [CrossRef] [Green Version]
  12. Pretzsch, H.; Dieler, J.; Seifert, T.; Rötzer, T. Climate effects on productivity and resource-use efficiency of Norway spruce (Picea abies [L.] Karst.) and European beech (Fagus sylvatica [L.]) in stands with different spatial mixing patterns. Trees Struct. Funct. 2012, 26, 1343–1360. [Google Scholar] [CrossRef]
  13. Pretzsch, H.; Schütze, G.; Uhl, E. Resistance of European tree species to drought stress in mixed versus pure forests: Evidence of stress release by inter-specific facilitation. Plant Biol. 2013, 15, 483–495. [Google Scholar] [CrossRef]
  14. Benomar, L.; DesRochers, A.; Larocque, G.R. Comparing growth and fine root distribution in monocultures and mixed plantations of hybrid poplar and spruce. J. For. Res. 2013, 24, 247–254. [Google Scholar] [CrossRef]
  15. Grossiord, C.; Gessler, A.; Granier, A.; Pollastrini, M.; Bussotti, F.; Bonal, D. Interspecific competition influences the response of oak transpiration to increasing drought stress in a mixed Mediterranean forest. For. Ecol. Manag. 2014, 318, 54–61. [Google Scholar] [CrossRef]
  16. Saha, S.; Kuehne, C.; Kohnle, U.; Brang, P.; Ehring, A.; Geisel, J.; Leder, B.; Muth, M.; Petersen, R.; Peter, J.; et al. Growth and quality of young oaks (Quercus robur and Quercus petraea) grown in cluster plantings in Central Europe: A weighted meta-analysis. For. Ecol. Manag. 2012, 283, 106–118. [Google Scholar] [CrossRef]
  17. Pretzsch, H.; Rais, A. Wood quality in complex forests versus even-aged monocultures: Review and perspectives. Wood Sci. Technol. 2016, 50, 845–880. [Google Scholar] [CrossRef]
  18. Petráš, R.; Mecko, J.; Bošelâ, M.; Šebeň, V. Wood quality and value production in mixed fir-spruce-beech stands: Long-term research in the Western Carpathians. For. J. 2016, 62, 98–104. [Google Scholar] [CrossRef] [Green Version]
  19. Russo, D.; Marziliano, P.A.; Macrì, G.; Zimbalatti, G.; Tognetti, R.; Lombardi, F. Tree growth and wood quality in pure vs. mixed-species stands of European beech and Calabrian pine in Mediterranean mountain forests. Forests 2020, 11, 6. [Google Scholar] [CrossRef] [Green Version]
  20. Marron, N.; Epron, D. Are mixed-tree plantations including a nitrogen-fixing species more productive than monocultures? For. Ecol. Manag. 2019, 441, 242–252. [Google Scholar] [CrossRef]
  21. DeBell, D.S.; Cole, T.G.; Whitesell, C.D. Growth, development, and yield in pure and mixed stands of Eucalyptus and Albizia. For. Sci. 1997, 43, 286–298. [Google Scholar] [CrossRef]
  22. Rédei, K.; Veperdi, I.; Meilby, H. Stand structure and growth of mixed white poplar (Populus alba L.) and black locust (Robinia pseudoacacia L.) plantations in Hungary. Acta Silv. Lignaria Hung. 2006, 2, 23–32. [Google Scholar]
  23. Moukoumi, J.; Farrell, R.E.; Van Rees, K.J.C.; Hynes, R.K.; Bélanger, N. Intercropping Caragana arborescens with Salix miyabeana to satisfy nitrogen demand and maximize growth. Bioenergy Res. 2012, 5, 719–732. [Google Scholar] [CrossRef] [Green Version]
  24. Oliveira, N.; del Río, M.; Forrester, D.I.; Rodríguez-Soalleiro, R.; Pérez-Cruzado, C.; Cañellas, I.; Sixto, H. Mixed short rotation plantations of Populus alba and Robinia pseudoacacia for biomass yield. For. Ecol. Manag. 2018, 410, 48–55. [Google Scholar] [CrossRef]
  25. Tanaka-Oda, A.; Kenzo, T.; Koretsune, S.; Sasaki, H.; Fukuda, K. Ontogenetic changes in water-use efficiency (δ13C) and leaf traits differ among tree species growing in a semiarid region of the Loess Plateau, China. For. Ecol. Manag. 2010, 259, 953–957. [Google Scholar] [CrossRef]
  26. Rédei, K.; Keseru, Z.; Rásó, J.; Juhász, L.; Gyori, J.; Antal, B. Growth and yield of mixed black locust (Robinia pseudoacacia L.) and white poplar (Populus alba L.) stands under sandy soil conditions in Hungary: A case study. Silva Balc. 2012, 13, 20–29. [Google Scholar]
  27. Marron, N.; Priault, P.; Gana, C.; Gérant, D.; Epron, D. Prevalence of interspecific competition in a mixed poplar/black locust plantation under adverse climate conditions. Ann. For. Sci. 2018, 75, 23. [Google Scholar] [CrossRef] [Green Version]
  28. Rebola-Lichtenberg, J.; Schall, P.; Annighöfer, P.; Ammer, C.; Leinemann, L.; Polle, A.; Euring, D. Mortality of different Populus genotypes in recently established mixed short rotation coppice with Robinia pseudoacacia L. Forests 2019, 10, 410. [Google Scholar] [CrossRef] [Green Version]
  29. Rebola-Lichtenberg, J.; Streit, J.; Schall, P.; Ammer, C.; Seidel, D. From facilitation to competition: The effect of black locust (Robinia pseudoacacia L.) on the growth performance of four poplar-hybrids (Populus spp.) in mixed short rotation coppice. New For. 2021, 52, 639–656. [Google Scholar] [CrossRef]
  30. Rebola-Lichtenberg, J.; Schall, P.; Ammer, C. Biomass production in mixed short rotation coppice with poplar-hybrids (Populus spp.) and black locust (Robinia pseudoacacia L.). GCB Bioenergy 2021, 13, 1924–1938. [Google Scholar] [CrossRef]
  31. Euring, D.; Janz, D.; Polle, A. Wood properties and transcriptional responses of poplar hybrids in mixed cropping with the nitrogen-fixing species Robinia pseudoacacia. Tree Physiol. 2021, 41, 865–881. [Google Scholar] [CrossRef]
  32. Grünewald, H.; Böhm, C.; Quinkenstein, A.; Grundmann, P.; Eberts, J.; von Wühlisch, G. Robinia pseudoacacia L.: A lesser known tree species for biomass production. Bioenergy Res. 2009, 2, 123–133. [Google Scholar] [CrossRef]
  33. Mantovani, D.; Veste, M.; Freese, D. Effects of drought frequency on growth performance and transpiration of young black locust (Robinia pseudoacacia L.). Int. J. For. Res. 2014, 2014, 821891. [Google Scholar] [CrossRef] [Green Version]
  34. Nicolescu, V.N.; Rédei, K.; Mason, W.L.; Vor, T.; Pöetzelsberger, E.; Bastien, J.C.; Brus, R.; Benčať, T.; Đodan, M.; Cvjetkovic, B.; et al. Ecology, growth and management of black locust (Robinia pseudoacacia L.), a non-native species integrated into European forests. J. For. Res. 2020, 31, 1081–1101. [Google Scholar] [CrossRef] [Green Version]
  35. Vítková, M.; Müllerová, J.; Sádlo, J.; Pergl, J.; Pyšek, P. Black locust (Robinia pseudoacacia) beloved and despised: A story of an invasive tree in Central Europe. For. Ecol. Manag. 2017, 384, 287–302. [Google Scholar] [CrossRef] [PubMed]
  36. Tuskan, G.A.; DiFazio, S.; Jansson, S.; Bohlmann, J.; Grigoriev, I.; Hellsten, U.; Putnam, M.; Ralph, S.; Rombauts, S.; Salamov, A.; et al. The genome of black cottonwood, Populus trichocarpa (Torr.&Gray). Science 2006, 313, 1596–1604. [Google Scholar] [CrossRef]
  37. Neale, D.B.; Kremer, A. Forest tree genomics: Growing resources and applications. Nat. Rev. Genet. 2011, 12, 111–122. [Google Scholar] [CrossRef]
  38. Joshi, C.P.; DiFazio, S.P.; Kole, C. Genetics, Genomics and Breeding of Poplar; CRC Press: Boca Raton, FL, USA, 2011. [Google Scholar]
  39. Cohen, D.; Bogeat-Triboulot, M.B.; Tisserant, E.; Balzergue, S.; Martin-Magniette, M.L.; Lelandais, G.; Ningre, N.; Renou, J.P.; Tamby, J.P.; Le Thiec, D.; et al. Comparative transcriptomics of drought responses in Populus: A meta-analysis of genome-wide expression profiling in mature leaves and root apices across two genotypes. BMC Genom. 2010, 11, 630. [Google Scholar] [CrossRef] [PubMed] [Green Version]
  40. Gugger, P.F.; Peñaloza-Ramírez, J.M.; Wright, J.W.; Sork, V.L. Whole-transcriptome response to water stress in a California endemic oak, Quercus lobata. Tree Physiol. 2017, 37, 632–644. [Google Scholar] [CrossRef]
  41. Yu, D.; Janz, D.; Zienkiewicz, K.; Herrfurth, C.; Feussner, I.; Chen, S.; Polle, A. Wood formation under severe drought invokes adjustment of the hormonal and transcriptional landscape in Poplar. Int. J. Mol. Sci. 2021, 22, 9899. [Google Scholar] [CrossRef]
  42. Hess, M.; Wildhagen, H.; Junker, L.V.; Ensminger, I. Transcriptome responses to temperature, water availability and photoperiod are conserved among mature trees of two divergent Douglas-fir provenances from a coastal and an interior habitat. BMC Genom. 2016, 17, 682. [Google Scholar] [CrossRef] [Green Version]
  43. Janz, D.; Behnke, K.; Schnitzler, J.P.; Kanawati, B.; Schmitt-Kopplin, P.; Polle, A. Pathway analysis of the transcriptome and metabolome of salt sensitive and tolerant poplar species reveals evolutionary adaption of stress tolerance mechanisms. BMC Plant Biol. 2010, 10, 150. [Google Scholar] [CrossRef] [Green Version]
  44. Lane, T.; Best, T.; Zembower, N.; Davitt, J.; Henry, N.; Xu, Y.; Koch, J.; Liang, H.; McGraw, J.; Schuster, S.; et al. The green ash transcriptome and identification of genes responding to abiotic and biotic stresses. BMC Genom. 2016, 17, 702. [Google Scholar] [CrossRef] [PubMed] [Green Version]
  45. Müller, M.; Seifert, S.; Lübbe, T.; Leuschner, C.; Finkeldey, R. De novo transcriptome assembly and analysis of differential gene expression in response to drought in European beech. PLoS ONE 2017, 12, e0184167. [Google Scholar] [CrossRef] [Green Version]
  46. Philippe, R.N.; Ralph, S.G.; Külheim, C.; Jancsik, S.I.; Bohlmann, J. Poplar defense against insects: Genome analysis, full-length cDNA cloning, and transcriptome and protein analysis of the poplar Kunitz-type protease inhibitor family. New Phytol. 2009, 184, 865–884. [Google Scholar] [CrossRef] [PubMed]
  47. Euring, D.; Bai, H.; Janz, D.; Polle, A. Nitrogen-driven stem elongation in poplar is linked with wood modification and gene clusters for stress, photosynthesis and cell wall formation. BMC Plant Biol. 2014, 14, 391. [Google Scholar] [CrossRef] [PubMed] [Green Version]
  48. Luo, J.; Zhou, J.; Li, H.; Shi, W.; Polle, A.; Lu, M.; Sun, X.; Luo, Z.-B. Bin Global poplar root and leaf transcriptomes reveal links between growth and stress responses under nitrogen starvation and excess. Tree Physiol. 2015, 35, 1283–1302. [Google Scholar] [CrossRef] [Green Version]
  49. Behnke, K.; Grote, R.; Brüggemann, N.; Zimmer, I.; Zhou, G.; Elobeid, M.; Janz, D.; Polle, A.; Schnitzler, J.P. Isoprene emission-free poplars—A chance to reduce the impact from poplar plantations on the atmosphere. New Phytol. 2012, 194, 70–82. [Google Scholar] [CrossRef] [PubMed]
  50. Izawa, T. Deciphering and prediction of plant dynamics under field conditions. Curr. Opin. Plant Biol. 2015, 24, 87–92. [Google Scholar] [CrossRef] [PubMed]
  51. Brosché, M.; Vinocur, B.; Alatalo, E.R.; Lamminmäki, A.; Teichmann, T.; Ottow, E.A.; Djilianov, D.; Afif, D.; Bogeat-Triboulot, M.B.; Altman, A.; et al. Gene expression and metabolite profiling of Populus euphratica growing in the Negev desert. Genome Biol. 2005, 6, R101. [Google Scholar] [CrossRef] [PubMed] [Green Version]
  52. Holliday, J.A.; Ralph, S.G.; White, R.; Bohlmann, J.; Aitken, S.N. Global monitoring of autumn gene expression within and among phenotypically divergent populations of Sitka spruce (Picea sitchensis). New Phytol. 2008, 178, 103–122. [Google Scholar] [CrossRef]
  53. Ning, K.; Ding, C.; Huang, Q.; Zhang, W.; Yang, C.; Liang, D.; Fan, R.; Su, X. Transcriptome profiling revealed diverse gene expression patterns in poplar (Populus × euramericana) under different planting densities. PLoS ONE 2019, 14, e0217066. [Google Scholar] [CrossRef] [PubMed]
  54. Yan, X.; Qian, C.; Yin, X.; Fan, X.; Zhao, X.; Gu, M.; Wang, T.; Ma, X.F. A whole-transcriptome approach to evaluate reference genes for quantitative diurnal gene expression studies under natural field conditions in Tamarix ramosissima leaves. Electron. J. Biotechnol. 2018, 35, 48–56. [Google Scholar] [CrossRef]
  55. Allwright, M.R.; Payne, A.; Emiliani, G.; Milner, S.; Viger, M.; Rouse, F.; Keurentjes, J.J.B.B.; Bérard, A.; Wildhagen, H.; Faivre-Rampant, P.; et al. Biomass traits and candidate genes for bioenergy revealed through association genetics in coppiced European Populus nigra (L.). Biotechnol. Biofuels 2016, 9, 195. [Google Scholar] [CrossRef] [PubMed] [Green Version]
  56. Kaling, M.; Schmidt, A.; Moritz, F.; Rosenkranz, M.; Witting, M.; Kasper, K.; Janz, D.; Schmitt-Kopplin, P.; Schnitzler, J.-P.P.; Polle, A. Mycorrhiza-triggered transcriptomic and metabolomic networks impinge on herbivore fitness. Plant Physiol. 2018, 176, 2639–2656. [Google Scholar] [CrossRef] [PubMed] [Green Version]
  57. BodSchätzG. Gesetz zur Schätzung des Landwirtschaftlichen Kulturbodens [Law on the Estimation of Soil Fertility]. 2007. Available online: http://www.gesetze-im-internet.de/bodsch_tzg_2008/BodSch%C3%A4tzG.pdf) (accessed on 18 April 2020).
  58. Röhle, H.; Hartmann, K.U.; Gerold, D.; Steinke, C.; Schröder, J. Biomass functions for short rotation forestry. Allg. Forst- und Jagdzeitung 2006, 177, 178–187. [Google Scholar]
  59. Ammer, C.; Brang, P.; Knoke, T.; Wagner, S. Methoden zur waldbaulichen Untersuchung von Jungwüchsen. Forstarchiv 2004, 75, 83–110. [Google Scholar]
  60. Annighöfer, P.; Ameztegui, A.; Ammer, C.; Balandier, P.; Bartsch, N.; Bolte, A.; Coll, L.; Collet, C.; Ewald, J.; Frischbier, N.; et al. Species-specific and generic biomass equations for seedlings and saplings of European tree species. Eur. J. For. Res. 2016, 135, 313–329. [Google Scholar] [CrossRef] [Green Version]
  61. Urbanek, S.; Bibiko, H.-J.; Stefano, M.L. R: A Language and Environment for Statistical Computing. The R Foundation for Statistical Computing. Available online: http://www.r-project.org/ (accessed on 22 November 2019).
  62. Chomczynski, P.; Sacchi, N. The single-step method of RNA isolation by acid guanidinium thiocyanate-phenol-chloroform extraction: Twenty-something years on. Nat. Protoc. 2006, 1, 581–585. [Google Scholar] [CrossRef] [PubMed]
  63. Chen, S.; Zhou, Y.; Chen, Y.; Gu, J. FASTQ: An ultra-fast all-in-one FASTQ preprocessor. Bioinformatics 2018, 34, 884–890. [Google Scholar] [CrossRef] [PubMed]
  64. Langmead, B.; Salzberg, S.L. Fast gapped-read alignment with Bowtie 2. Nat. Methods 2012, 9, 357–359. [Google Scholar] [CrossRef] [Green Version]
  65. Vu, V.Q. Ggbiplot: A Ggplot2 Based Biplot. R Package, Version 0.55. Available online: http://github.com/ (accessed on 22 November 2019).
  66. Love, M.I.; Huber, W.; Anders, S. Moderated estimation of fold change and dispersion for RNA-seq data with DESeq2. Genome Biol. 2014, 15, 1–21. [Google Scholar] [CrossRef] [PubMed] [Green Version]
  67. Benjamini, Y.; Hochberg, Y. Controlling the false discovery rate: A practical and powerful approach to multiple testing. J. R. Stat. Soc. Ser. B 1995, 57, 289–300. [Google Scholar] [CrossRef]
  68. Ashburner, M.; Ball, C.A.; Blake, J.A.; Botstein, D.; Butler, H.; Cherry, J.M.; Davis, A.P.; Dolinski, K.; Dwight, S.S.; Eppig, J.T.; et al. Gene ontology: Tool for the unification of biology. Nat. Genet. 2000, 25, 25–29. [Google Scholar] [CrossRef] [PubMed] [Green Version]
  69. Benson, D.A.; Cavanaugh, M.; Clark, K.; Karsch-Mizrachi, I.; Lipman, D.J.; Ostell, J.; Sayers, E.W. GenBank. Nucleic Acids Res. 2013, 41, 36–42. [Google Scholar] [CrossRef] [PubMed] [Green Version]
  70. Conesa, A.; Götz, S.; García-Gómez, J.M.; Terol, J.; Talón, M.; Robles, M. Blast2GO: A universal tool for annotation, visualization and analysis in functional genomics research. Bioinformatics 2005, 21, 3674–3676. [Google Scholar] [CrossRef] [PubMed] [Green Version]
  71. Brunner, A.M.; Yakovlev, I.A.; Strauss, S.H. Validating internal controls for quantitative plant gene expression studies. BMC Plant Biol. 2004, 4, 14. [Google Scholar] [CrossRef] [Green Version]
  72. Ye, J.; Coulouris, G.; Zaretskaya, I.; Cutcutache, I.; Rozen, S.; Madden, T.L. Primer-BLAST: A tool to design target-specific primers for polymerase chain reaction. BMC Bioinform. 2012, 13, 134. [Google Scholar] [CrossRef] [PubMed] [Green Version]
  73. Kibbe, W.A. OligoCalc: An online oligonucleotide properties calculator. Nucleic Acids Res. 2007, 35, 43–46. [Google Scholar] [CrossRef] [PubMed]
  74. Livak, K.J.; Schmittgen, T.D. Analysis of relative gene expression data using real-time quantitative PCR and the 2ΔΔCT method. Methods 2001, 25, 402–408. [Google Scholar] [CrossRef]
  75. Monclus, R.; Dreyer, E.; Villar, M.; Delmotte, F.M.; Delay, D.; Petit, J.M.; Barbaroux, C.; Le Thiec, D.; Bréchet, C.; Brignolas, F. Impact of drought on productivity and water use efficiency in 29 genotypes of Populus deltoides x Populus nigra. New Phytol. 2006, 169, 765–777. [Google Scholar] [CrossRef]
  76. Kuchma, O.; Janz, D.; Leinemann, L.; Polle, A.; Krutovsky, K.V.; Gailing, O. Hybrid and environmental effects on gene expression in poplar clones in pure and mixed with black locust stands. Forests 2020, 11, 1075. [Google Scholar] [CrossRef]
  77. Boyden, S.; Binkley, D.; Senock, R. Competition and facilitation between Eucalyptus and nitrogen-fixing Falcataria in relation to soil fertility. Ecology 2005, 86, 992–1001. [Google Scholar] [CrossRef]
  78. Bouillet, J.P.; Laclau, J.P.; de M. Gonçalves, J.L.; Voigtlaender, M.; Gava, J.L.; Leite, F.P.; Hakamada, R.; Mareschal, L.; Mabiala, A.; Tardy, F.; et al. Eucalyptus and Acacia tree growth over entire rotation in single- and mixed-species plantations across five sites in Brazil and Congo. For. Ecol. Manag. 2013, 301, 89–101. [Google Scholar] [CrossRef]
  79. Vítková, M.; Tonika, J.; Müllerová, J. Black locust–successful invader of a wide range of soil conditions. Sci. Total Environ. 2015, 505, 315–328. [Google Scholar] [CrossRef]
  80. Wu, J.; Liu, Z.; Zhang, Z.; Lv, Y.; Yang, N.; Zhang, G.; Wu, M.; Lv, S.; Pan, L.; Joosten, M.H.A.J.; et al. Transcriptional regulation of receptor-like protein genes by environmental stresses and hormones and their overexpression activities in Arabidopsis thaliana. J. Exp. Bot. 2016, 67, 3339–3351. [Google Scholar] [CrossRef] [Green Version]
  81. Cohen, S.P.; Leach, J.E. Abiotic and biotic stresses induce a core transcriptome response in rice. Sci. Rep. 2019, 9, 6273. [Google Scholar] [CrossRef]
  82. Ballaré, C.L.; Pierik, R. The shade-avoidance syndrome: Multiple signals and ecological consequences. Plant Cell Environ. 2017, 40, 2530–2543. [Google Scholar] [CrossRef]
  83. Casal, J.J. Photoreceptor signaling networks in plant responses to shade. Annu. Rev. Plant Biol. 2013, 64, 403–427. [Google Scholar] [CrossRef] [PubMed]
  84. Roig-Villanova, I.; Martínez-García, J.F. Plant responses to vegetation proximity: A whole life avoiding shade. Front. Plant Sci. 2016, 7, 236. [Google Scholar] [CrossRef] [Green Version]
  85. Courbier, S.; Pierik, R. Canopy light quality modulates stress responses in plants. iScience 2019, 22, 441–452. [Google Scholar] [CrossRef] [Green Version]
  86. Andersen, E.J.; Ali, S.; Byamukama, E.; Yen, Y.; Nepal, M.P. Disease resistance mechanisms in plants. Genes 2018, 9, 339. [Google Scholar] [CrossRef] [PubMed] [Green Version]
  87. Gan, S.; Amasino, R.M. Making sense of senescence: Molecular genetic regulation and manipulation of leaf senescence. Plant Physiol. 1997, 113, 313–319. [Google Scholar] [CrossRef] [PubMed] [Green Version]
  88. Munné-Bosch, S.; Alegre, L. Die and let live: Leaf senescence contributes to plant survival under drought stress. Funct. Plant Biol. 2004, 31, 203–216. [Google Scholar] [CrossRef] [PubMed]
Figure 1. Stem volume (cm3 per tree) for Populus “Max 1” and Robinia pseudoacacia R2 in 2017 and 2018 in mixed and pure stands. Solid lines in the boxes represent the median, and the bottom and the top of the box represent first and third quartile (interquartile range—IQR). Each whisker represents 1.5 IQR. Letters “a” and “b” indicate significant differences between the stand types for the given tree species at significance level p < 0.05. The numbers on the vertical axes should be multiplied by 104.
Forests 13 00147 g001
Figure 2. Principal component analysis (PCA) based on annotated transcripts in 16 and 12 poplar samples in 2017 and 2018, respectively.
Forests 13 00147 g002
Figure 3. Differentially expressed genes (DEGs) in upregulated (A) and downregulated (B) gene sets for Reinshof (R) and Deppoldshausen (D) in response to mixed cropping in 2017 generated using the online tool on http://bioinformatics.psb.ugent.be/webtools/Venn accessed on 18 April 2020. RPM and DPM: pure vs. mixed stands in Reinshof and Deppoldshausen, respectively.
Forests 13 00147 g003
Figure 4. Differentially expressed genes (DEGs) in upregulated (A) and downregulated (B) gene sets for total comparison of stands in response to mixed cropping in 2017 and 2018 generated using the online tool on http://bioinformatics.psb.ugent.be/webtools/Venn accessed on 18 April 2020. TPM: total pure vs. mixed stands (all samples).
Forests 13 00147 g004
Table 1. Poplar clones and black locust provenances used in the study.
NameAbbreviationSpecies or Hybrid
Poplar clones
AF2P1Populus deltoides × P. nigra
Fritzi PauleyP2P. trichocarpa
Hybride 275P3P. maximowiczii × P. trichocarpa
I214P4P. deltoides × P. nigra
Matrix 11P5P. maximowiczii × P. trichocarpa
Matrix 49P6P. maximowiczii × P. trichocarpa
Max 1P7P. nigra × P. maximowiczii
Muhle LarsenP8P. trichocarpa
Black locust provenances
HGK 81901, GermanyR1Robinia pseudoacacia
HGK 81902, GermanyR2R. pseudoacacia
Nagybudmry, HungaryR3R. pseudoacacia
Table 2. Mean tree stem volume (cm3) in 2017 and 2018 at Reinshof and Deppoldshausen.
YearSpeciesReinshofDeppoldshausen
MixedPurepMixedPurep
2017Populus “Max 1”492452050.796918550.06
Robinia p.23,00920,4780.4413,12714,5310.49
2018Populus “Max 1”16,72219,6410.28129226059.5 × 10−8
Robinia p.35,56431,3590.7718,33719,9690.59
Table 3. Number of the differentially expressed genes (DEGs) in comparisons of total pure vs. mixed stands (TPM), total study sites (TSS, Reinshof vs. Deppoldshausen), pure vs. mixed stands in Reinshof (RPM) and in Deppoldshausen (DPM).
YearDEGsTPM aTSSRPM aDPM a
2017Upregulated389401418238
Downregulated1870070338
Total576402121276
2018Upregulated11551139 b16540
Downregulated751357 c1111
Total1230249617651
a Upregulated or downregulated in mixed samples, b upregulated in Deppoldshausen, c upregulated in Reinshof.
Table 4. Common GO term enrichment groups with the number of overrepresented genes in comparisons of total pure vs. mixed stands (TPM), total study sites (TSS) in Deppoldshausen (TSS-D) or Reinshof (TSS-R), pure vs. mixed stands in Reinshof (RPM) and in Deppoldshausen (DPM) for down- and upregulated gene sets in 2017 and 2018.
GO TermTPMDPMRPMTSS-DTSS-R
20172018201720182017201820182018
Downregulated
photosynthesis (GO: 0015979)176-13-----
generation of precursor metabolites and energy (GO: 0006091)205-13-----
pigment biosynthetic process (GO: 0046148)77-------
Upregulated
response to stress (GO: 0006950)927-72-368-270317
response to wounding (GO: 0009611)103-14-5550--
response to starvation (GO: 0042594)99-15-----
response to water deprivation (GO: 0009414)116---59-54-
response to biotic stimulus (GO: 0009607)459-39-170--185
response to fungus (GO: 0009620)140---64---
response to bacterium (GO: 0009617)146---65--85
hormone metabolic process (GO:0042445)210-9-86---
leaf senescence (GO:0010150)32---15---
shade avoidance (GO: 0009641)10---6--8
photosynthesis (GO: 0015979)------43-
NADPH regeneration (GO: 0006740)------27-
response to heat (GO: 0009408)------92-
pigment biosynthetic process (GO: 0046148)------36-
pigment accumulation (GO: 0043476)-----31-15
hormone metabolic process (GO: 0042445)-------103
response to auxin (GO: 0009733)-37---48-43
hormone transport (GO: 0009914)-26---36--
shade avoidance (GO: 0009641)-------8
nitrate transport (GO: 0015706)-21---26--
plant organ development (GO: 0099402)-105---149-134
cell wall organization or biogenesis (GO: 0071554)-93---164--
cell growth (GO: 0016049)-59---92--
Publisher’s Note: MDPI stays neutral with regard to jurisdictional claims in published maps and institutional affiliations.

