Article

Development and Validation of a 36K SNP Array for Radiata Pine (Pinus radiata D.Don)

1
Scion (New Zealand Forest Research Institute Ltd.), 49 Sala Street, Whakarewarewa, Rotorua 3010, New Zealand
2
Livestock Improvement Corporation Ltd., 605 Ruakura Road, Hamilton 3216, New Zealand
*
Author to whom correspondence should be addressed.
Submission received: 16 December 2021 / Revised: 10 January 2022 / Accepted: 14 January 2022 / Published: 24 January 2022

Abstract

:
Radiata pine (Pinus radiata D.Don) is one of the world’s most domesticated pines and a key economic species in New Zealand. Thus, the development of genomic resources for radiata pine has been a high priority for both research and commercial breeding. Leveraging off a previously developed exome capture panel, we tested the performance of 438,744 single nucleotide polymorphisms (SNPs) on a screening array (NZPRAD01) and then selected 36,285 SNPs for a final genotyping array (NZPRAD02). These SNPs aligned to 15,372 scaffolds from the Pinus taeda L. v. 1.01e assembly, and 20,039 contigs from the radiata pine transcriptome assembly. The genotyping array was tested on more than 8000 samples, including material from archival progenitors, current breeding trials, nursery material, clonal lines, and material from Australia. Our analyses indicate that the array is performing well, with sample call rates greater than 98% and a sample reproducibility of 99.9%. Genotyping in two linkage mapping families indicated that the SNPs are well distributed across the 12 linkage groups. Using genotypic data from this array, we were also able to differentiate representatives of the five recognized provenances of radiata pine, Año Nuevo, Monterey, Cambria, Cedros and Guadalupe. Furthermore, principal component analysis of genotyped trees revealed clear patterns of population structure, with the primary axis of variation driven by provenance ancestry and the secondary axis reflecting breeding activities. This represents the first commercial use of genomics in a radiata pine breeding program.

1. Introduction

Genomics has the potential to change forest tree breeding from traditional backward selection approaches based on progeny test results to faster and earlier forward selections based on genomic predictions [1]. In addition, it has the potential to increase the rate of genetic gain through shortening radiata pine’s long generation intervals through predicting unobserved phenotypes and early selection of superior genotypes [2,3,4]. The rate of generational turnover will need to accelerate as forestry encounters new economic, social, and climatic challenges, in parallel with increasing demand for wood and fiber products [5,6,7] to meet the need of a growing global population [8]. Afforestation is also being held up as one of the key strategies for climate change mitigation, but if forests are to sequester sufficient carbon to deliver these effects, we need to select trees that are well adapted to a changing environment [9,10,11,12].
Radiata pine (Pinus radiata D.Don) is the primary forestry species in New Zealand, comprising nearly 90% of the 1.7 million hectares of planted forest [13]. Globally, it is regarded as the world’s most widely planted exotic conifer [14]. Current genetic research in radiata pine has been focused on the development of genomic resources to enable new genomics-based breeding approaches for this species [15,16,17,18]. The extensive size and complexity of conifer genomes (25 Gbp in radiata pine) has hindered whole genome sequencing approaches; thus, genotyping platforms based on reduced representation of the genome have been preferred [19,20,21,22]. In radiata pine, exome capture genotyping-by-sequencing (GBS) [23] has allowed for the simultaneous discovery and genotyping of more than 80K single nucleotide polymorphisms (SNPs) with minor allele frequencies (MAF) greater than 0.03 across several breeding populations [15,24,25]. It has also demonstrated the value of using DNA marker-corrected pedigrees [26]. Reproducibility ranged from 86.9–93.3% [15], with higher read depths generally improving the detection of heterozygotes and thus improving reproducibility. However, maintaining sufficient read depths to detect both alleles (if present) limits the ability to reduce genotyping costs through higher degrees of multiplexing during sequencing.
The resulting lack of robust and affordable genotyping platforms has been one of the biggest obstacles to wide-scale adoption of genomics into forest tree breeding [1,27]. Where such resources have been made available [28], this has stimulated innovation and application of numerous genomic-based methods [3,29,30]. For example, forest genetic studies have begun to unravel the genetic architecture of complex traits through genome-wide association mapping [31,32,33]; find associations between changes in allelic frequencies along gradients of important climatic variables [34]; model historical pathways in species’ demography [35]; reconstruct genealogies in both wild and captive populations through parentage assignment [36,37]; and predict unobserved phenotypes through genomic methods [38,39]. Furthermore, access to tools to better manage population structure and retain sufficient diversity [40] are critical for exotic species, such as radiata pine, where no further introductions of germplasm into New Zealand are possible due to biosecurity restrictions.
Developing a suite of genotyping tools for a range of applications has therefore been required. Higher density exome capture GBS panels still have utility when higher numbers of markers are needed, and the larger probe size (120 nt) gives a greater tolerance for non-target polymorphisms and a much greater level of specificity, which is key when dealing with complex conifer mega-genomes. These panels can also detect new variants not previously reported, and are not limited to the polymorphisms present in the initial discovery population. However, routine testing in commercial breeding programs does not necessarily require as many markers nor ongoing marker discovery, but does require a much more competitive price.
As part of an international Conifer SNP Consortium (CSC) [27,41,42,43], we have developed a 36K SNP array for radiata pine using the Axiom™ platform. Fixed array platforms are regarded as the gold standard for robust and reliable high throughput genotyping. However, they do not allow for ongoing SNP discovery, can be impacted by off-target polymorphisms, and may have specificity issues because of shorter probe lengths (e.g., 30–50 nt) compared with exome capture GBS (e.g., 120 nt). As such, greater care must be applied with selecting SNP content, because space is limited and amendments to designs are less trivial. We describe the development of a 440 K screening array and 36K SNP genotyping array, and compare the performance of the latter to that of our previously reported exome capture GBS. We also report on early applications of this tool, including distinguishing radiata pine provenances and describing the population structure of the New Zealand breeding program.

2. Materials and Methods

2.1. Development of the SNP Screening Array

Candidate SNPs

SNPs were derived from previous exome capture GBS across more than 4000 individuals, including three progeny trials and ancestral archive material, as described by Telfer et al. [15]. Minor allele frequencies (MAF) were estimated for 1,354,472 SNPs, which were classified as either “common” (MAF > 0.03) or “rare” (MAF < 0.03). Flanking sequences (35 nucleotides on either side of the target SNPs) were retrieved for all candidate SNPs, producing 71-mer sequences with the target SNPs in the middle. Where non-target SNPs (termed “wobble” SNPs) were present in these flanking regions, those that were considered common (MAF > 0.03) were retained in the flanking sequence, and those considered rare (MAF < 0.03) were removed and replaced with the major allele. Thereafter, target SNPs were categorized as “single” or “multi” according to the respective presence or absence of any remaining non-target SNPs in the flanking regions (Table 1). As the draft genome available for radiata pine was still undergoing assembly and annotation, the genomic context of the SNPs was unknown (e.g., position of SNPs within coding or promotor regions).
SNPs were excluded when non-target SNPs occurred within 20 bases of the target SNP. Deprioritization of A/T or C/G SNPs, which require two probe sets for interrogation, ensured maximum utility of the available space on the array. All SNPs were scored bioinformatically by Thermo Fisher Scientific (Waltham, MA, USA) for compatibility with Axiom array technology. This included parsing all potential probes into 8-mers and mapping these to an unpublished draft assembly of the radiata pine genome to determine which probes are likely to produce high background noise due to cross-hybridization. An additional set of 3000 37-mer sequences were supplied to Thermo Fisher Scientific (hereafter abbreviated as TFS) for the design of Dish Quality Control (DQC) probes. These probes help assess fundamental sample quality metrics, such as the signal to background noise ratio for each sample.

2.2. Plant Material for Testing the Screening Array

We selected a diverse range of samples (n = 480, Table 2) to evaluate the performance of the screening array, including triplicates (to assess reproducibility) and paired samples from different tissue types (reproducibility of genotyping results can be affected by varying levels of background noise among different tissue types). Haploid megagametophyte samples were included to facilitate the identification of probes with potential multiple targets, a common risk when dealing with complex and repetitive genomes, such as radiata pine. For example, specificity may decline when moving from longer 120 nt exome capture probes to shorter 30 nt Axiom probes. Trios (mother, father, and progeny) and duos (mother and megagametophyte) were included to ensure Mendelian inheritance patterns were observed.
DNA for all samples was extracted using previously described methods [44], namely Nucleospin 96 Plant II (Machery-Nagel, Düren, Germany) for needle and cambium tissue, and a modified CTAB method for megagametophytes. Samples were required to meet TFS’s minimum quantity threshold of 500 ng, at a concentration of no less than 10 ng/µL in a minimum volume of 15 µL. Samples were placed into 96-well barcoded plates, and dried down prior to shipping to minimize the risk of cross-contamination. Sealed plates were shipped via courier on frozen icepacks to TFS’s facility in Santa Clara, CA, USA.
On arrival, samples were resuspended for 2 h on a shaking incubator (1100 rpm, 55 °C) in 50 µL nuclease-free water. However, subsequent quantification checks indicated that about half the DNA had not resuspended. Thus, multiple samples did not pass threshold requirements. These samples were re-extracted shipped frozen in Nucleospin elution buffer.

2.3. Genotyping Array Design and Testing

2.3.1. SNP Selection

Data from the screening array were processed as a service by TFS in consultation with Scion, using default settings. Candidates for the genotyping array were chosen based on SNP performance on the screening array. Markers that produced heterozygous calls in two or more of the haploid samples were removed from further consideration, as well as markers that did not satisfy expected Mendelian inheritance patterns in trios or duos. Remaining SNPs that fell within the following Axiom classification categories (https://tools.thermofisher.com/content/sfs/manuals/SNPolisher_User_Guide.pdf, accessed on 15 December 2021) were deemed suitable candidates for the genotyping array (~80K SNPs): Poly High Resolution (PHR); homozygous but with cluster variance in the X or Y dimension (AA/BB variance X/Y); heterozygous but with variance in the X dimension (AB var X); and No Minor Homozygote (NMH) with a minimum of 5 heterozygous calls.
The genotyping array could accommodate a maximum of 50–55K probe sets; therefore, further exclusions were necessary. As the draft genome was still highly fragmented, the relative positions of SNPs were known only to the contig level. However, where there were SNPs that appeared to be within 200 nucleotides of another SNP according to their contig positions, only one was retained. A/T or C/G SNPs require two probe sets for genotyping, and some SNPs required a second probe set to give additional confidence in genotype calls. Thus, candidate SNPs could have 1, 2, or 4 probe sets required for successful genotyping. No SNPs have to date been identified as “must haves”; therefore, to maximize efficient use of space on the array, we removed all SNPs that required 4 probe sets. The remaining candidate SNPs were ranked based primarily on their frequency (MAF > 0.03) and number of probe sets required (i.e., 1 or 2). After several iterations, 36,285 SNPs were selected for the final genotyping array, NZPRAD02 (Table 3).

2.3.2. Plant Material for Testing on the Genotyping Array

Samples for testing on the genotyping array (NZPRAD02) are summarized in Table 4. Samples were collected from a subset of progenitors in Scion archives and DNA isolated from either needle tissue or cambium tissue, depending on canopy height and accessibility of the foliage, using Nucleospin 96 Plant II kits as described in Telfer at al. [44].
Needle tissue was collected from stoolbeds at two nurseries in New Zealand and DNA was extracted by Slipstream Automation (Palmerston North, New Zealand) using their proprietary methods. These samples represented genotypes currently being tested in various progeny trials across New Zealand. Selected industry clonal lines and several older control-pollinated and open-pollinated progeny trials were also included. A selection of clonal and control pollinated progeny trials were also sampled from a third nursery and other industry partners in Australia, with DNA isolated from these samples by the Australian Genome Research Facility (University of Adelaide, Australia).
The DNA concentration requirements for the genotyping array were slightly higher due to the array format (i.e., 384 wells vs 96 wells for the screening array). Thus, a minimum concentration of 17.2 ng/µL and a minimum volume of 25 µL were applied.
A set of pooled DNA samples was included for which one pair of unrelated individuals, and one pair of full-sibs, were deliberately combined in various DNA ratios (20:1, 15:1, 12:1, 10:1, 8:1, 5:1, 2:1, and 1:1) to determine the point at which the second contributor could no longer be detected. This was performed in duplicate for each of the two pairs of samples, and the total DNA concentration kept at 40 ng/µL. For each of the pure samples, markers that were inconsistent between replicates were removed, and initially only markers that were homozygous and different for each of the contributors were used in the analysis. The occurrence of heterozygous calls for these markers thus indicated the detection of the contaminant. We considered contamination to be detected once 1% or more of these markers had changed from homozygote in the original pure sample to heterozygote in the pooled sample.
DNA from all extraction service providers was collated by Scion into 96-well barcoded plates and shipped frozen and on ice packs for genotyping at TFS’s Santa Clara facility.

2.4. Genotyping Array Data Analysis

Raw SNP data and associated files were downloaded from TFS, loaded into the Axiom Analysis Suite v4.0.1 and the Best Practices Workflow was performed. All default settings were used, apart from the call rate threshold, which was reduced to 80%.

Population Structure Analysis

The population structure was assessed through an individual-based principal component analysis (PCA) of data from the genotyping array, using the smartpca.perl script of the EIGENSOFT package [45]. We also estimated ancestries as admixture proportions using fastStructure [46], varying the assumed number of genetic groups (K) from 3 to 20.

3. Results

3.1. Design and Performance of the Screening Array

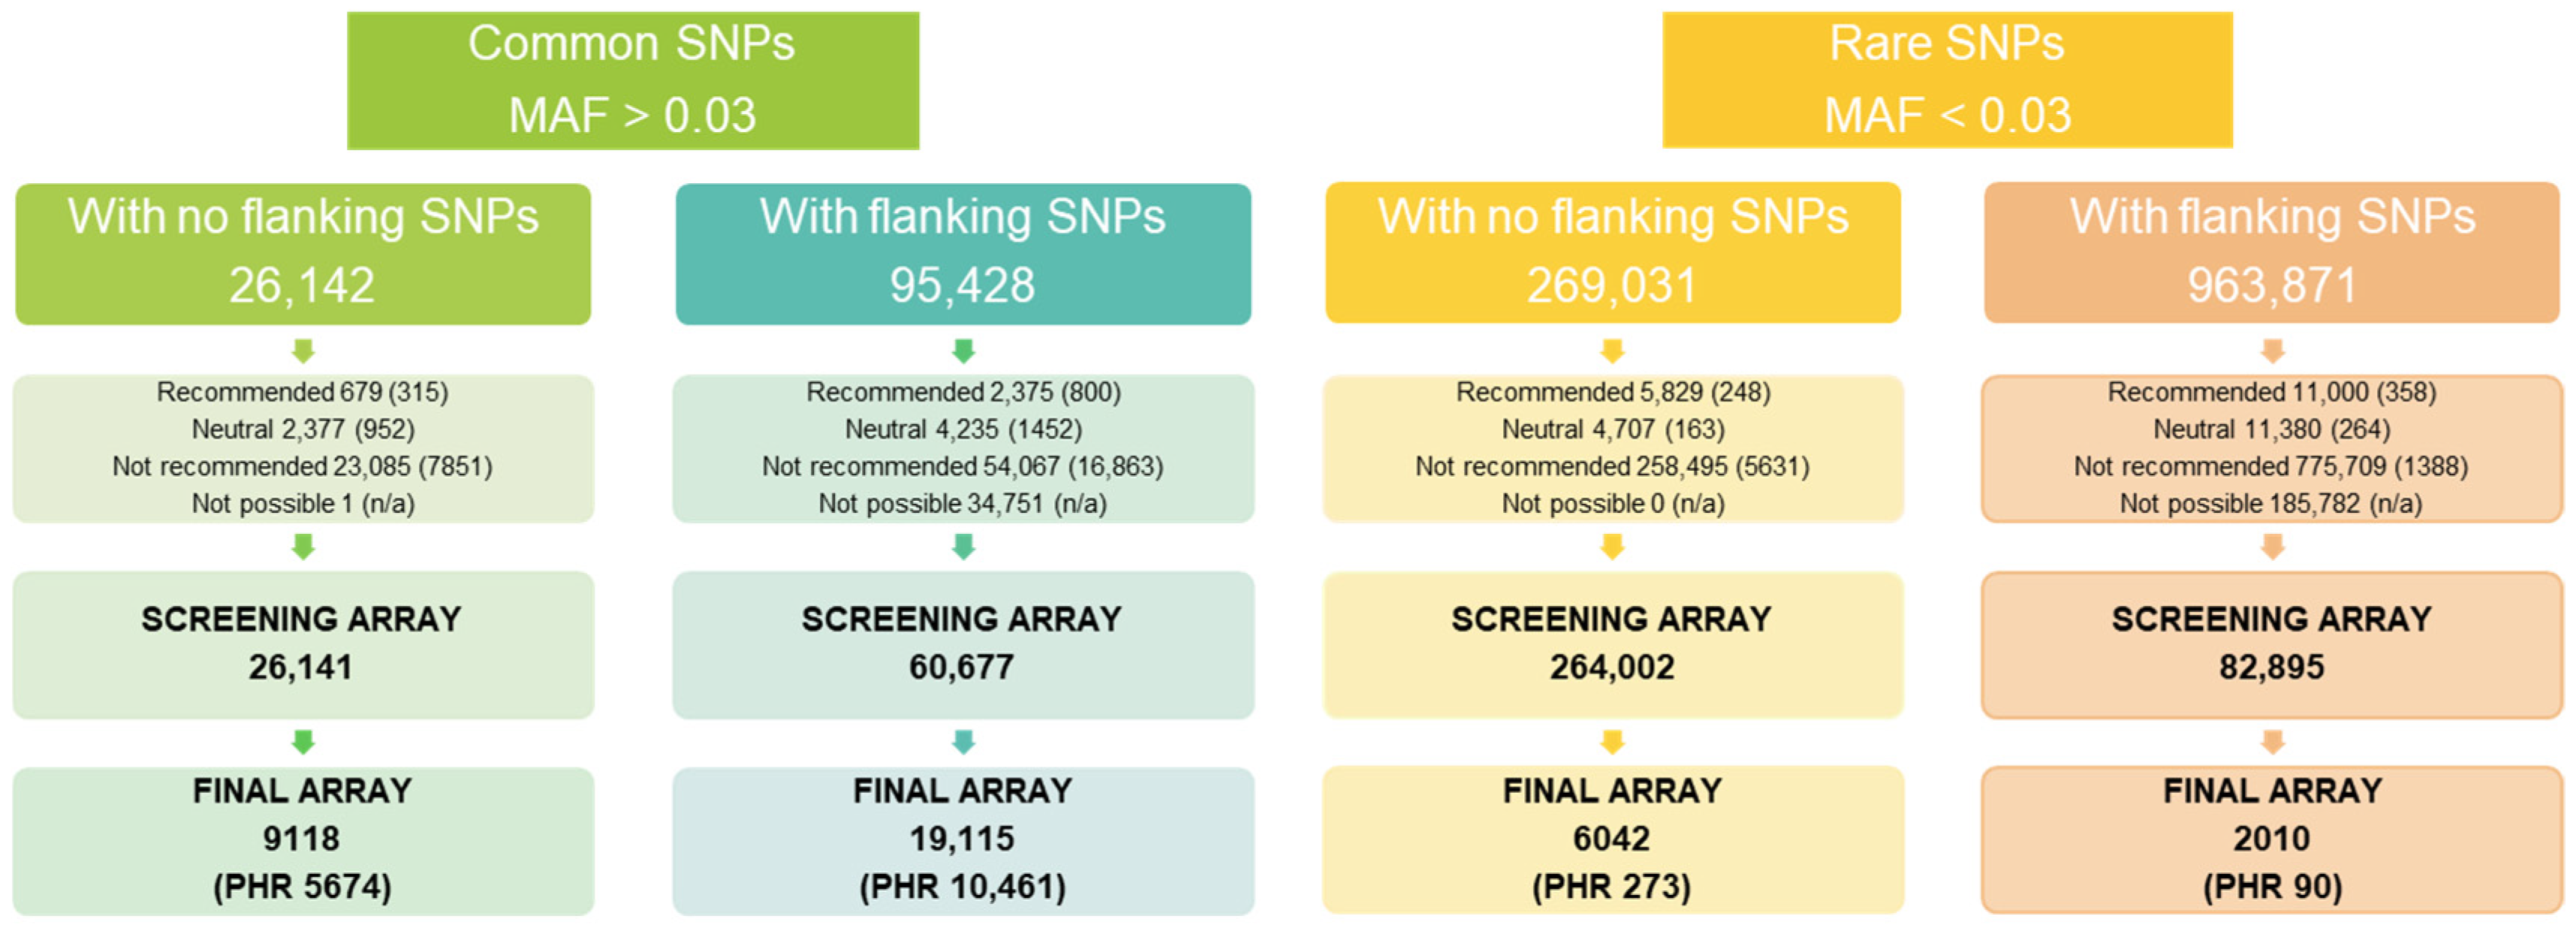
3.1.1. SNP Selection

All 1,354,472 submitted SNPs were ranked as potential targets and assigned by TFS to the following categories: recommended, neutral, not recommended, and not possible (Figure 1). There were a large proportion of markers in the “not recommended” category; however, this is common with species with complex genomes, such as radiata pine. Therefore, we used TFS’s secondary conversion (i.e., pconvert) scores, which relaxes the threshold for repetitive sequence.
We selected all recommended and neutral markers (see Figure 1) for inclusion on the screening array. Thereafter, we prioritized markers within the not recommended category in terms of MAF (MAF > 0.03 with no flanking SNPs, followed by those with flanking SNPs). Only those markers with a secondary conversion (p-convert) score > 0 were considered.

3.1.2. Screening Array Genotyping

We included 438,744 SNPs on the screening array, NZPRAD01, and assayed 480 samples (Table 2). Using the default Affymetrix QC settings, 411 (95.6%) of the 430 diploid samples passed sample QC thresholds, and of the 50 haploid samples, 48 (96%) passed sample QC thresholds. SNPs were categorized based on the allele clusters from these 480 samples (Table 5). Generally, the most desirable category is PolyHighResolution (PHR) as this class represents SNPs for which all three combinations of alleles have been detected within the population (AA, AB, BB), with good signal separation between the clusters. The second most desirable category is the NoMinorHom (NMH), for which there are less than two observations of homozygotes for the minor allele, and predominantly AA and AB clusters. The high frequency (38.7%) of MonoHighResolution (MHR) SNPs (only one allele observed) could have resulted from the small number of individuals sampled combined with the fact that the majority of SNPs are likely to be rare, resulting in the alternative allele not being detected. The high number of SNPs falling within the CallRateBelowThreshold, OffTargetVariant, and Other categories could be due to off-target binding and other probe performance issues that result in spurious clustering patterns and preclude the generation of usable data. These categories were not further investigated at this stage as there were sufficient SNPs in the PHR, NMH, and MHR categories. Descriptions of all SNP categories are available in the Axiom™ Genotyping Solution Data Analysis User Guide (https://assets.thermofisher.com/TFS-Assets/LSG/manuals/axiom_genotyping_solution_analysis_guide.pdf, accessed on 15 December 2021).
For the PHR SNPs, the average call rate for diploid samples was high at 99.4%, with an average sample reproducibility of 99.8%. These analyses included 115 samples and 46 sets of either needle triplicates or needle/cambium pairs. Average sample Mendelian inheritance accuracy, determined by TFS over these PHR SNPs, was also high at 99.9%.

3.2. Design and Performance of the Genotyping 50K Array

3.2.1. Selection of SNPs for the Genotyping Array

To confirm even distribution of these markers across the genome, we examined the SNPs that had been previously mapped from exome capture data in either of the two mapping populations (Wilcox et al.; in prep). Supplementary Data Figures S1 and S2 show the number of SNPs that mapped per cM for each of the 12 linkage groups, which shows relatively even representation across the genome for this subset of mappable SNPs. The SNPs included on the genotyping array aligned to 15,372 scaffolds from the Pinus taeda L. v. 1.01e assembly [47], and 20,039 contigs from the radiata pine transcriptome assembly [16].

3.2.2. Sample and SNP Performance

Needle and cambium samples performed comparably (Table 6), with most samples passing the sample concentration and quality criteria. Sample reproducibility, assessed by looking at a subset of the PHR markers in 31 sets of duplicate samples, was high for both cambium and needles.
The performance of the array across this batch of samples is summarized in Table 7. More than 80% of the markers are delivering usable data (PHR, NMH, and MHR) using the default software settings with an adjusted call rate threshold of 80%, with 70% of the markers in the preferred categories of PHR and NMH.

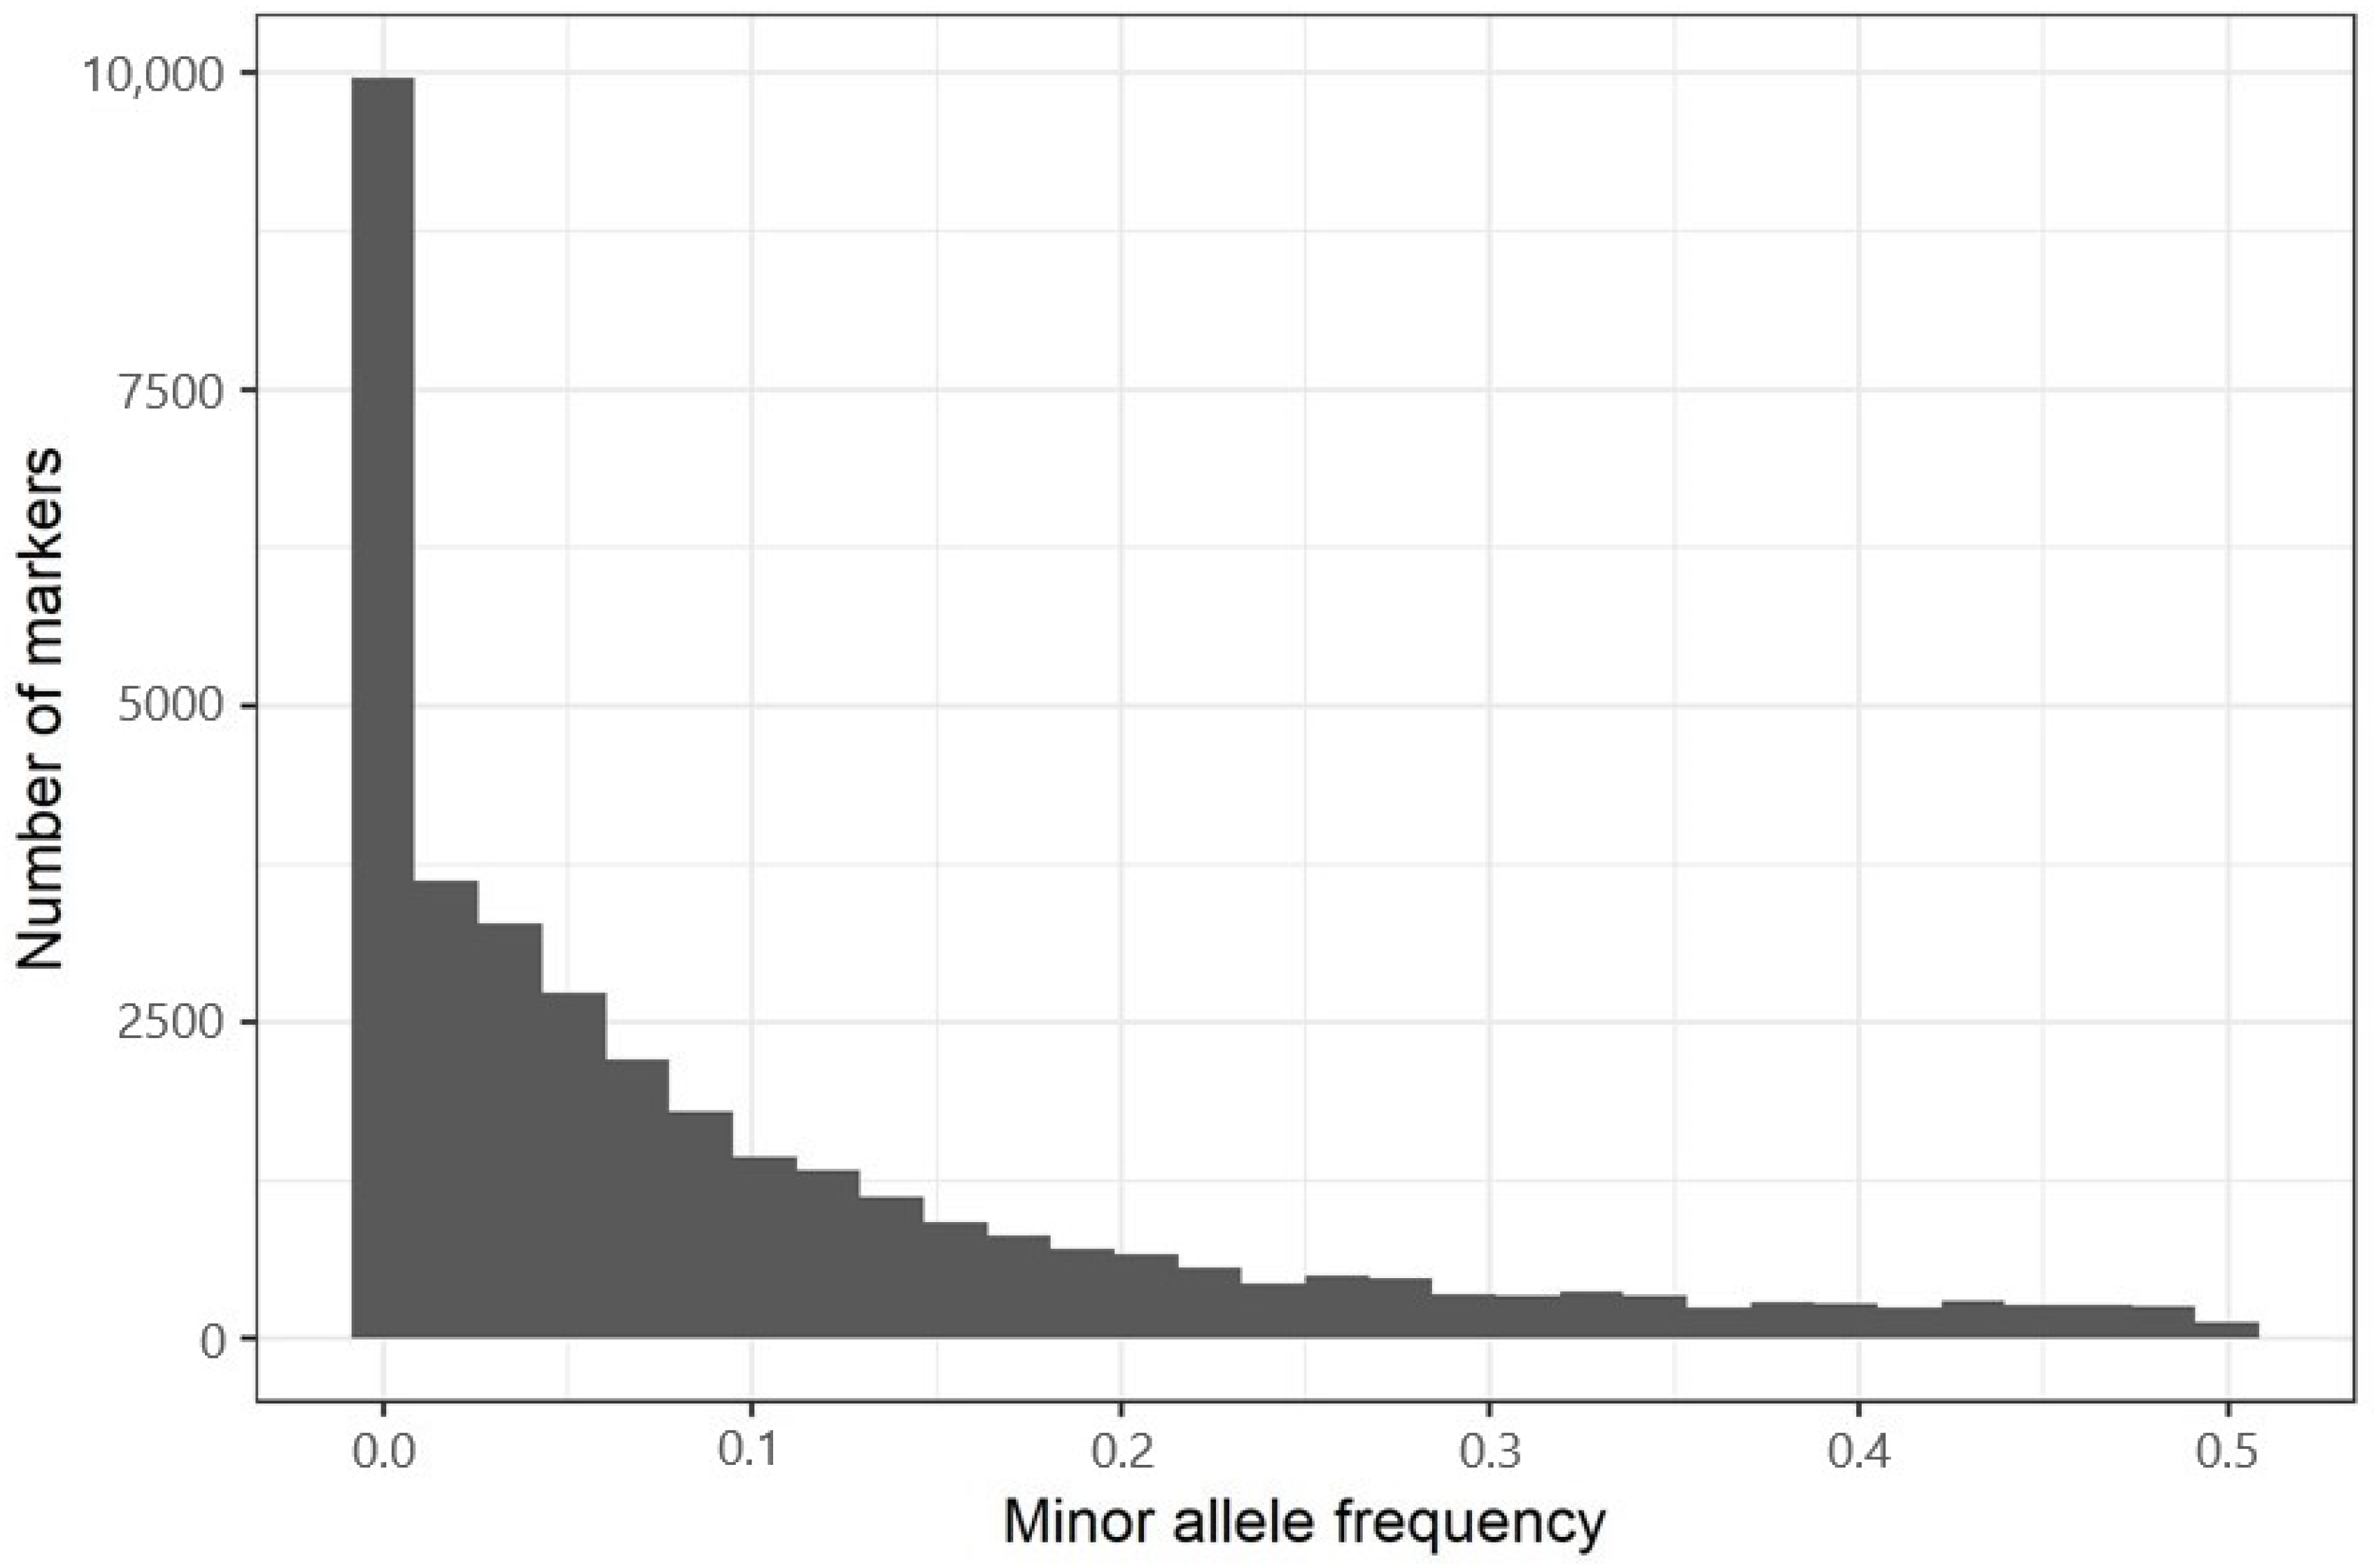
3.2.3. Minor Allele Frequencies and Heterozygosity

Minor allele frequencies for all PHR, NMH, and MHR SNPs across the full dataset (average MAF 0.098) are summarized in Figure 2. Observed sample heterozygosity ranged from 8.0% to 30.3% across the samples tested in this dataset, with an average of 18.8 ± 1.0%. This was within range of the expected heterozygosity of 18.6 ± 0.1%. The samples from Australian populations were comparable with an average observed heterozygosity of 18.5 ± 0.9%.

3.2.4. Detection of Contaminating DNA

We deliberately introduced DNA from one sample to another in increasing proportions to ascertain the point at which alleles contributed by this contaminant could be detected. In our two sets of pooled samples, detection of contamination was only possible where samples were pooled at ratios of 8:1 or less for both related and unrelated pairs (Table 8, column 2 and 5). There was a noticeable shift in the number of contaminating alleles detected as heterozygous calls when more than ~30% of the DNA was derived from the second genotype (i.e., diluted at 2:1 or 1:1) (Table 8). We subsequently explored cases where markers were homozygous in the original sample but heterozygous in the contaminant, or vice versa (Table 8, columns 3–4 and 5–6). These mixtures effectively halved the concentration of the contaminating allele that we were trying to detect. In both cases, contamination had to exceed 17% (dilution ratio of 5:1) to be detectable (i.e., for more than 1% of SNP genotypes to be affected). There was no apparent difference in any of the scenarios between the related and unrelated pairs, apart from there being fewer than half the number of SNPs that varied between the related individuals.

3.2.5. Native Provenance Performance

We evaluated the performance of the array across material that represented the five native provenances of radiata pine. Compared to the other samples we genotyped, these provenances are regarded as more distant from the New Zealand landraces and breeding populations used for initial SNP discovery. The average sample heterozygosities for the Cedros and Guadalupe provenances were lowest (13.5 ± 0.8% and 15.3 ± 0.4%, respectively), Cambria was moderate (16.7 ± 0.6%), and Año Nuevo and Monterey (from which the New Zealand landraces are derived) showed the highest average heterozygosities at 17.1 ± 0.6% and 18.1 ± 0.2%, respectively.

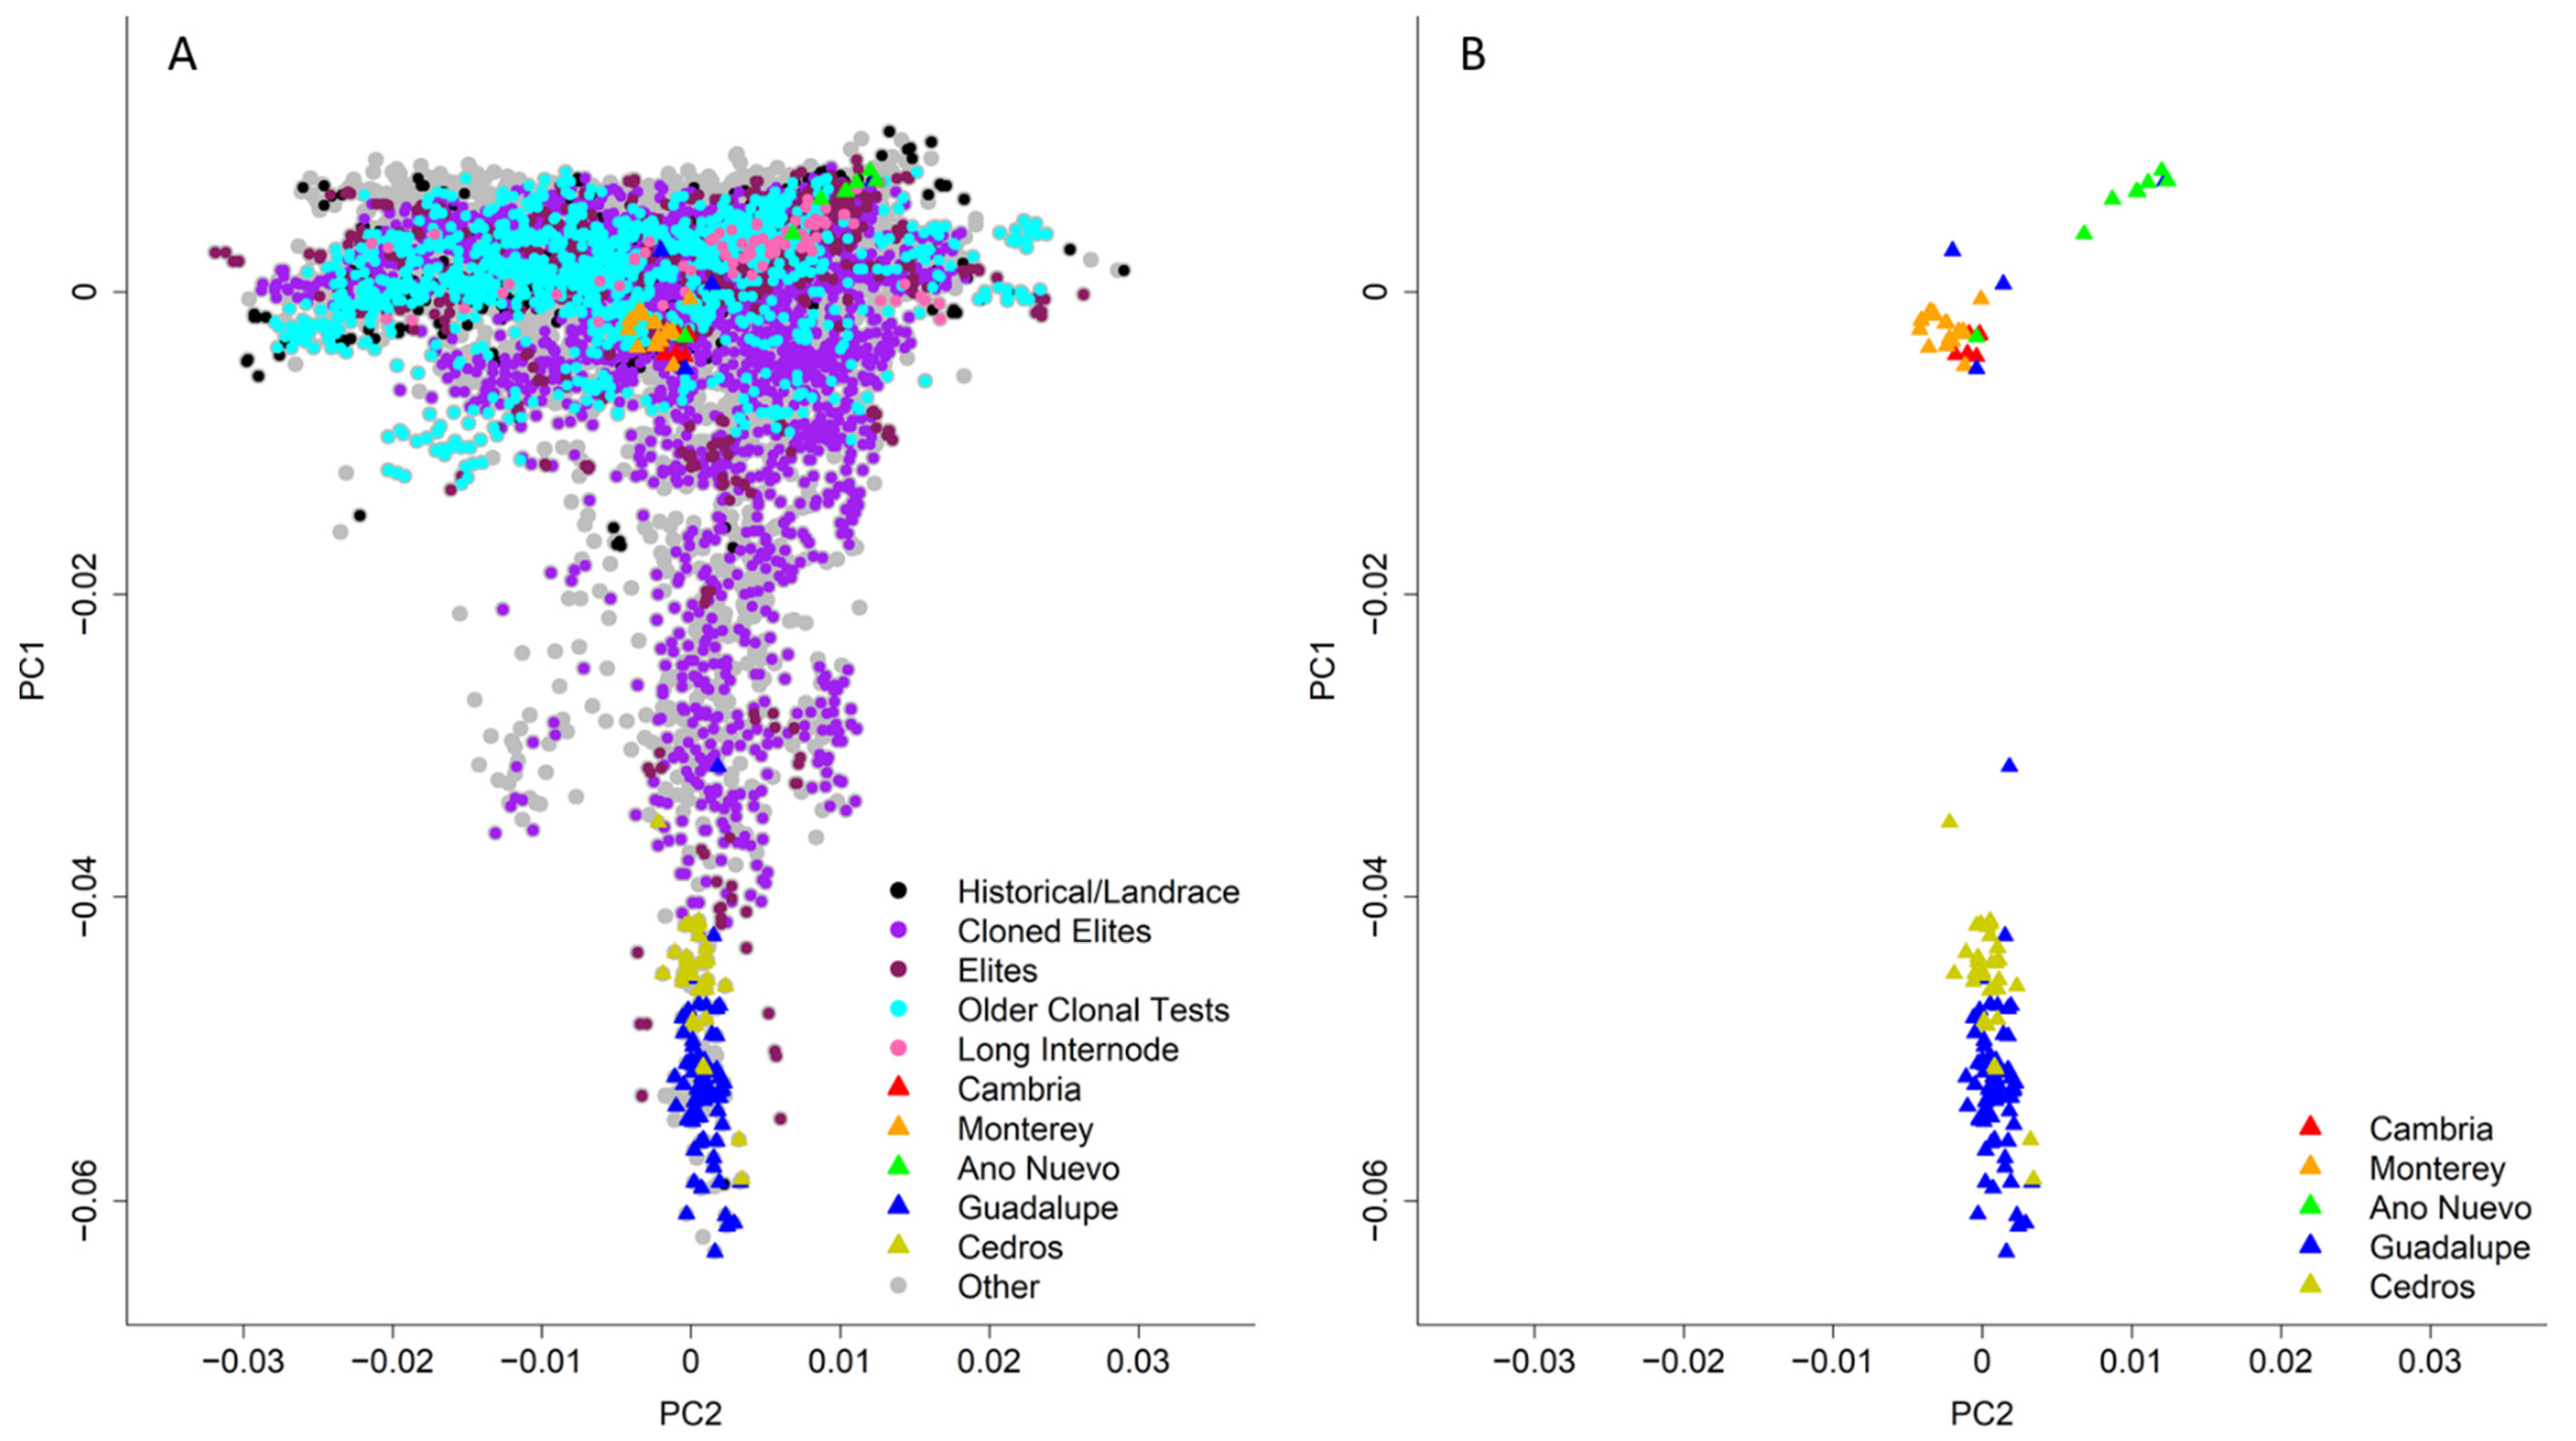
3.3. Population Structure

SNP-based principal component analysis (PCA) of all trees genotyped with the genotyping array (Figure 3) revealed several important patterns. There was clear separation of the native provenances, in particular, the more geographically and morphologically distant Cedros and Guadalupe provenances. As previously reported [48], the ancestries of some of New Zealand’s founder populations were roughly equally balanced between the Monterey and Año Nuevo provenances, with as much as 10% of the founder individuals showing second-degree or higher levels of relatedness. The breeding population is well distributed across the y-axis (PC1 in Figure 3), indicating a substantial amount of genetic variation has been captured compared with the native radiata pine provenances in North America. Genotypes with “island ancestry” (i.e., Cedros or Guadalupe) were surprisingly widespread in the progeny trials. Finally, while the overall genetic variation of the historical/landrace populations is adequately captured by the new generation of trials, there are some individual ‘extreme’ genotypes from these groups, which should receive special consideration to ensure this diversity is retained within the breeding program. These results indicate that the SNP genotyping array will be highly informative when reconstructing the ancestries of genotypes included in breeding populations, helping to improve the accuracy of germplasm records and guide interpretation of results from genomic predictions.

4. Discussion

We successfully designed and validated a 36K SNP array for radiata pine using Axiom array technology. Taking advantage of TFS’s screening array option, we first tested 438,744 SNPs from a starting pool of 1,354,472 SNPs, that were discovered using exome capture GBS, to deliver a genotyping array of 36,285 gene-based SNPs. The primary driver behind the design of this array was to deliver a robust and affordable genotyping solution for commercial application in the New Zealand radiata pine breeding program. As such, all samples were selected to give good representation of the genetic diversity available in New Zealand for this exotic species. This is the first reported medium-density array for this species, and will be an efficient tool for understanding the connectedness of radiata pine populations within New Zealand and Australia. The excellent performance of both needle and cambium tissue DNA, with call rates in excess of 98.5%, and reproducibility of 99.9%, is a substantial improvement over the exome capture GBS panel, with reproducibility rates of 86.9%–93.3% [15]. Reproducibility of genotyping results can be affected by varying levels of background noise among different tissue types, however we see no evidence of this in our cambium and needles samples.

4.1. Performance of the Genotyping Array

The presence of non-target SNPs in the flanking region resulted in many SNPs not progressing from the original SNP pool through to the genotyping array, which is to be expected as bioinformatic screening would automatically eliminate many of these markers. However, with highly polymorphic species, finding SNPs without nearby flanking SNPs can be difficult. This makes SNP discovery particularly important, to deliver a sufficiently large starting pool of SNPs such that enough suitable SNPs can be identified. Understanding which SNPs are more common and therefore likely to be polymorphic in tested populations was an important factor when weighting which markers to progress to the final genotyping array. As shown in Figure 1, the common SNPs delivered far more PHR SNPs than the rare SNPs, despite having many fewer SNPs to begin with. The bioinformatic scoring of SNPs by TFS (i.e., recommended, neutral, and not recommended) was less informative for predicting which SNPs would perform well, with many SNPs classed as neutral or not recommended performing well in both the screening and genotyping arrays. The conversion rate of SNPs on the screening array (i.e., SNPs categorized as PHR, NMH, and MHR) was 50.2%, which is comparable to what has been reported for several other forest tree arrays [42,49,50,51]. After refining the selection of SNPs to include on the genotyping array, and with a reduced call rate threshold of 80% as per Howe et al. [51], the conversion rate improved substantially to 80.8%. More than 45% of SNPs are within the PHR category, which are considered the most informative markers. This highlights the benefit of prior evaluation of candidate SNPs on a screening array, similar to what has been reported by other conifer groups [27,42,43] where conversion rates have improved from 39% on the screening array to 96% on the genotyping array.
Because conifers have large, complex, and repetitive genomes, they are highly prone to off-target hybridization. We used in silico mapping of potential probes to an unpublished draft genome assembly of radiata pine to check for multi-locus interference. We also tested haploid megagametophyte tissue on the screening array to identify and eliminate probes with off-target hybridization. Finally, we used trios and duos to test for anomalies in Mendelian inheritance patterns. To identify and remove problematic probes, we highly recommend that both haploid samples and confirmed trios be used to develop new genotyping tools.

4.2. Native Provenances

We clearly distinguished five native provenances of radiata pine using the SNP genotyping array. Two samples labelled as Cedros clustered with the Guadalupe material. However, informal investigations into the origins of these samples revealed the original seed had been supplied by a group that was working with both provenances at the time, making it likely that Guadalupe seed was mislabeled as Cedros. Without the SNP array, such errors would remain undetected. Although our sample sizes for the provenances were small, some SNPs failed more frequently in some provenances than others. These SNPs likely represent regions of the genome that are more diverged in some provenances. Marker discovery focused on the New Zealand landraces, which are considered an admixture of Monterey and Año Nuevo provenances. This almost certainly introduced ascertainment bias, which likely explains the lower rates of heterozygosity for more distantly related native provenances.

4.3. Population Structure within the Breeding Program

In general, forest tree species occupy geographically extensive and environmentally heterogeneous environments. Studies of genotypes from across species’ natural distributions have demonstrated clinal variability in adaptive traits along environmental gradients ([52,53]. Therefore, to fully exploit a species’ adaptive potential for conservation or domestication, it is important to capture as much genetic diversity as possible [32,54,55]. We used the SNP genotyping array to study population structure in the New Zealand radiata pine breeding program and found a substantial amount of genetic variation has been captured. Clear patterns of population structure were evident in the principal component analysis, with the primary axis of variation driven by provenance ancestry and the secondary axis reflecting breeding activities. As expected, the Monterey and Año Nuevo provenances were the main contributors to the current breeding population [14], however, there was surprisingly high representation of the island provenances (i.e., Cedros and Guadalupe) in the latest breeding material. In addition, about 10% of the founders showed second-degree or higher levels of relatedness. These analyses will inform ongoing conservation management decisions in terms of which material to retain and which material to cull from clonal archives [40,56].

5. Conclusions

We successfully developed a radiata pine screening array using SNP markers discovered using exome capture GBS. Next, we developed the first medium-density SNP array for radiata pine, containing 36,285 SNPs. The accuracy and quality of the SNP data from the Axiom genotyping array greatly outperformed our original GBS data. For the Axiom data, reproducibility between replicates was 99.9%, which should help overcome problems with pedigree reconstruction that occur when higher levels of genotyping error are present. The Axiom genotyping array can also be accessed at a highly competitive rate, negotiated through the CSC. The ability to access robust and affordable genotyping is enabling the commercial implementation of genomic selection and improved management of genetic diversity for New Zealand’s radiata pine breeding program.

Supplementary Materials

The following are available online at https://0-www-mdpi-com.brum.beds.ac.uk/article/10.3390/f13020176/s1, Figure S1: Distribution of genotyping array SNPs that map to linkage groups in radiata pine mapping population 268,405 × 268,345, and Figure S2: Distribution of genotyping array SNPs that map to linkage groups in radiata pine mapping population 850,055 × 850,096.

Author Contributions

Conceptualization, N.G., E.T., J.K. and H.D.; methodology, N.G., E.T., J.K. and T.F.; analysis, N.G., J.K., G.S. and A.I.; original draft preparation, N.G.; writing—review and editing, N.G., J.K., T.F. and G.S. All authors have read and agreed to the published version of the manuscript.

Funding

This study was financially supported through New Zealand’s Ministry of Business and Innovation, contract RPBC1301.

Institutional Review Board Statement

Not applicable.

Informed Consent Statement

Not applicable.

Data Availability Statement

The data presented in this study are available on request from the corresponding author. The data are not publicly available due to their commercial sensitivity for the Radiata Pine Breeding Company.

Acknowledgments

We thank Steffi Fritsche, Celine Mercier, John McEwan and Glenn Howe for reviewing this manuscript. We acknowledge the Radiata Pine Breeding Company for their involvement in the program, and for discussions on what material to include, Dagmar Cheeseman for preparing and coordinating DNA extractions and shipments, Scion and AWA Management Ltd. field teams for collecting samples, Suzanne Gallagher and Cyriele Fromonot at Slipstream Automation and Nicole Burtt at AGRF for DNA extractions, Hannah Woo at TFS for her handling of the laboratory aspects of this project, Ali Pirani and Tanya Makeev at TFS for bioinformatic support and data analysis. We also acknowledge Fikret Isik for his leadership in establishing the Conifer SNP Consortium.

Conflicts of Interest

The authors declare no conflict of interest.

References

  1. Grattapaglia, D.; Silva-Junior, O.B.; Resende, R.T.; Cappa, E.P.; Müller, B.S.; Tan, B.; Isik, F.; Ratcliffe, B.; El-Kassaby, Y.A. Quantitative genetics and genomics converge to accelerate forest tree breeding. Front. Plant Sci. 2018, 9, 1693. [Google Scholar] [CrossRef] [PubMed]
  2. Li, Y.; Dungey, H.S. Expected benefit of genomic selection over forward selection in conifer breeding and deployment. PLoS ONE 2018, 13, e0208232. [Google Scholar] [CrossRef] [Green Version]
  3. Suontama, M.; Klápště, J.; Telfer, E.; Graham, N.; Stovold, T.; Low, C.; McKinley, R.; Dungey, H. Efficiency of genomic prediction across two Eucalyptus nitens seed orchards with different selection histories. Heredity 2019, 122, 370–379. [Google Scholar] [CrossRef] [PubMed] [Green Version]
  4. Isik, F.; Bartholome, J.; Farjat, A.; Chancerel, E.; Raffin, A.; Sanchez, L.; Plomion, C.; Bouffier, L. Genomic selection in maritime pine. Plant Sci. 2016, 242, 108–119. [Google Scholar] [CrossRef] [PubMed]
  5. Food and Agriculture Organization of the United Nations. Available online: http://www.fao.org/3/i0350e/i0350e02a.pdf (accessed on 15 December 2021).
  6. McEwan, A.; Marchi, E.; Spinelli, R.; Brink, M. Past, present and future of industrial plantation forestry and implication on future timber harvesting technology. J. For. Res. 2020, 31, 339–351. [Google Scholar] [CrossRef] [Green Version]
  7. Neagoe, M.; Taskhiri, M.; Turner, P. North and North-West Tasmania: Supply Chain and Infrastructure; Northern Tasmania Regional Forestry Hub: Hobart, Tasmania, 2020. [Google Scholar]
  8. Brooks, D.J. The outlook for demand and supply of wood: Implications for policy and sustainable management. Commonw. For. Rev. 1997, 76, 31–36. [Google Scholar]
  9. Bastin, J.-F.; Finegold, Y.; Garcia, C.; Mollicone, D.; Rezende, M.; Routh, D.; Zohner, C.M.; Crowther, T.W. The global tree restoration potential. Science 2019, 365, 76–79. [Google Scholar] [CrossRef]
  10. Bastin, J.-F.; Finegold, Y.; Garcia, C.; Mollicone, D.; Rezende, M.; Routh, D.; Zohner, C.M.; Crowther, T.W. Erratum for the Report: “The global tree restoration potential” by J.-F. Bastin, Y. Finegold, C. Garcia, D. Mollicone, M. Rezende, D. Routh, CM Zohner, TW Crowther and for the Technical Response “Response to Comments on ‘The global tree restoration potential’” by J.-F. Bastin, Y. Finegold, C. Garcia, N. Gellie, A. Lowe, D. Mollicone, M. Rezende, D. Routh, M. Sacande, B. Sparrow, C.M. Zohner, T.W. Crowther. Science 2020, 368, eabc8905. [Google Scholar]
  11. Cook-Patton, S.C.; Leavitt, S.M.; Gibbs, D.; Harris, N.L.; Lister, K.; Anderson-Teixeira, K.J.; Briggs, R.D.; Chazdon, R.L.; Crowther, T.W.; Ellis, P.W.; et al. Mapping carbon accumulation potential from global natural forest regrowth. Nature 2020, 585, 545–550. [Google Scholar] [CrossRef]
  12. Domke, G.M.; Oswalt, S.N.; Walters, B.F.; Morin, R.S. Tree planting has the potential to increase carbon sequestration capacity of forests in the United States. Proc. Natl. Acad. Sci. USA 2020, 117, 24649–24651. [Google Scholar] [CrossRef]
  13. New Zealand Forest Owners Association. New Zealand Plantation Forest Industry Facts and Figures 2019/2020. Available online: https://www.nzfoa.org.nz/images/Facts_Figures_2019_20_Web_FA3-updated.pdf (accessed on 15 December 2021).
  14. Burdon, R.; Libby, W.; Brown, A. Domestication of Radiata Pine; Springer: Berlin/Heidelberg, Germany, 2017; Volume 83. [Google Scholar]
  15. Telfer, E.; Graham, N.; Macdonald, L.; Li, Y.; Klápště, J.; Resende, M., Jr.; Neves, L.G.; Dungey, H.; Wilcox, P. A high-density exome capture genotype-by-sequencing panel for forestry breeding in Pinus radiata. PLoS ONE 2019, 14, e0222640. [Google Scholar] [CrossRef] [PubMed] [Green Version]
  16. Telfer, E.; Graham, N.; Macdonald, L.; Sturrock, S.; Wilcox, P.; Stanbra, L. Approaches to variant discovery for conifer transcriptome sequencing. PLoS ONE 2018, 13, e0205835. [Google Scholar] [CrossRef] [PubMed] [Green Version]
  17. Klápště, J.; Dungey, H.S.; Telfer, E.J.; Suontama, M.; Graham, N.J.; Li, Y.; McKinley, R. Marker Selection in Multivariate Genomic Prediction Improves Accuracy of Low Heritability Traits. Front. Genet. 2020, 11, 499094. [Google Scholar] [CrossRef]
  18. Klápště, J.; Dungey, H.S.; Graham, N.J.; Telfer, E.J. Effect of trait’s expression level on single-step genomic evaluation of resistance to Dothistroma needle blight. BMC Plant Biol. 2020, 20, 205. [Google Scholar] [CrossRef] [PubMed]
  19. Neves, L.G.; Davis, J.M.; Barbazuk, W.B.; Kirst, M. A high-density gene map of loblolly pine (Pinus taeda L.) based on exome sequence capture genotyping. G3 Genes Genomes Genet. 2014, 4, 29–37. [Google Scholar] [CrossRef] [Green Version]
  20. Acosta, J.J.; Fahrenkrog, A.M.; Neves, L.G.; Resende, M.F.; Dervinis, C.; Davis, J.M.; Holliday, J.A.; Kirst, M. Exome resequencing reveals evolutionary history, genomic diversity, and targets of selection in the conifers Pinus taeda and Pinus Elliottii. Genome Biol. Evol. 2019, 11, 508–520. [Google Scholar] [CrossRef] [Green Version]
  21. Suren, H.; Hodgins, K.; Yeaman, S.; Nurkowski, K.; Smets, P.; Rieseberg, L.H.; Aitken, S.N.; Holliday, J.A. Exome capture from the spruce and pine giga-genomes. Mol. Ecol. Resour. 2016, 16, 1136–1146. [Google Scholar] [CrossRef]
  22. Azaiez, A.; Pavy, N.; Gérardi, S.; Laroche, J.; Boyle, B.; Gagnon, F.; Mottet, M.-J.; Beaulieu, J.; Bousquet, J. A catalog of annotated high-confidence SNPs from exome capture and sequencing reveals highly polymorphic genes in Norway spruce (Picea abies). BMC Genom. 2018, 19, 942. [Google Scholar] [CrossRef]
  23. Neves, L.G.; Davis, J.M.; Barbazuk, W.B.; Kirst, M. Whole-exome targeted sequencing of the uncharacterized pine genome. Plant J. 2013, 75, 146–156. [Google Scholar] [CrossRef]
  24. Liu, J.J.; Schoettle, A.W.; Sniezko, R.A.; Yao, F.; Zamany, A.; Williams, H.; Rancourt, B. Limber pine (Pinus flexilis James) genetic map constructed by exome-seq provides insight into the evolution of disease resistance and a genomic resource for genomics-based breeding. Plant J. 2019, 98, 745–758. [Google Scholar] [CrossRef]
  25. Rellstab, C.; Dauphin, B.; Zoller, S.; Brodbeck, S.; Gugerli, F. Using transcriptome sequencing and pooled exome capture to study local adaptation in the giga-genome of Pinus Cembra. Mol. Ecol. Resour. 2019, 19, 536–551. [Google Scholar] [CrossRef] [PubMed]
  26. Li, Y.; Klápště, J.; Telfer, E.; Wilcox, P.; Graham, N.; Macdonald, L.; Dungey, H.S. Genomic selection for non-key traits in radiata pine when the documented pedigree is corrected using DNA marker information. BMC Genom. 2019, 20, 1026. [Google Scholar] [CrossRef] [PubMed]
  27. Bernhardsson, C.; Zan, Y.; Chen, Z.; Ingvarsson, P.K.; Wu, H.X. Development of a highly efficient 50K SNP genotyping array for the large and complex genome of Norway spruce (Picea abies L. Karst) by whole genome re-sequencing and its transferability to other spruce species. Mol. Ecol. Resour. 2020, 21, 880–896. [Google Scholar]
  28. Silva-Junior, O.B.; Faria, D.A.; Grattapaglia, D. A flexible multi-species genome-wide 60K SNP chip developed from pooled resequencing of 240 Eucalyptus tree genomes across 12 species. New Phytol. 2015, 206, 1527–1540. [Google Scholar] [CrossRef] [Green Version]
  29. Müller, B.S.; Neves, L.G.; de Almeida Filho, J.E.; Resende, M.F.; Muñoz, P.R.; dos Santos, P.E.; Paludzyszyn Filho, E.; Kirst, M.; Grattapaglia, D. Genomic prediction in contrast to a genome-wide association study in explaining heritable variation of complex growth traits in breeding populations of Eucalyptus. BMC Genom. 2017, 18, 524. [Google Scholar] [CrossRef] [PubMed] [Green Version]
  30. Ukrainetz, N.K.; Mansfield, S.D. Assessing the sensitivities of genomic selection for growth and wood quality traits in lodgepole pine using Bayesian models. Tree Genet. Genomes 2020, 16, 14. [Google Scholar] [CrossRef]
  31. Müller, B.S.; de Almeida Filho, J.E.; Lima, B.M.; Garcia, C.C.; Missiaggia, A.; Aguiar, A.M.; Takahashi, E.; Kirst, M.; Gezan, S.A.; Silva-Junior, O.B. Independent and Joint-GWAS for growth traits in Eucalyptus by assembling genome-wide data for 3373 individuals across four breeding populations. New Phytol. 2019, 221, 818–833. [Google Scholar] [CrossRef] [Green Version]
  32. Dubos, C.; Plomion, C. Identification of water-deficit responsive genes in maritime pine (Pinus pinaster Ait.) roots. Plant Mol. Biol. 2003, 51, 249–262. [Google Scholar] [CrossRef]
  33. Baison, J.; Vidalis, A.; Zhou, L.; Chen, Z.Q.; Li, Z.; Sillanpää, M.J.; Bernhardsson, C.; Scofield, D.; Forsberg, N.; Grahn, T. Genome-wide association study identified novel candidate loci affecting wood formation in Norway spruce. Plant J. 2019, 100, 83–100. [Google Scholar] [CrossRef]
  34. Rellstab, C.; Gugerli, F.; Eckert, A.J.; Hancock, A.M.; Holderegger, R. A practical guide to environmental association analysis in landscape genomics. Mol. Ecol. 2015, 24, 4348–4370. [Google Scholar] [CrossRef] [Green Version]
  35. Ma, Y.; Wang, J.; Hu, Q.; Li, J.; Sun, Y.; Zhang, L.; Abbott, R.J.; Liu, J.; Mao, K. Ancient introgression drives adaptation to cooler and drier mountain habitats in a cypress species complex. Commun. Biol. 2019, 2, 213. [Google Scholar] [CrossRef] [PubMed]
  36. Doerksen, T.K.; Herbinger, C.M. Impact of reconstructed pedigrees on progeny-test breeding values in red spruce. Tree Genet. Genomes 2010, 6, 591–600. [Google Scholar] [CrossRef]
  37. Cros, D.; Sánchez, L.; Cochard, B.; Samper, P.; Denis, M.; Bouvet, J.-M.; Fernández, J. Estimation of genealogical coancestry in plant species using a pedigree reconstruction algorithm and application to an oil palm breeding population. Theor. Appl. Genet. 2014, 127, 981–994. [Google Scholar] [CrossRef] [PubMed]
  38. Resende, M.; Munoz, P.; Acosta, J.; Peter, G.; Davis, J.; Grattapaglia, D.; Resende, M.; Kirst, M. Accelerating the domestication of trees using genomic selection: Accuracy of prediction models across ages and environments. New Phytol. 2012, 193, 617–624. [Google Scholar] [CrossRef] [Green Version]
  39. Bartholomé, J.; Van Heerwaarden, J.; Isik, F.; Boury, C.; Vidal, M.; Plomion, C.; Bouffier, L. Performance of genomic prediction within and across generations in maritime pine. BMC Genom. 2016, 17, 604. [Google Scholar] [CrossRef]
  40. Meuwissen, T.H.; Sonesson, A.K.; Gebregiwergis, G.; Woolliams, J.A. Management of Genetic Diversity in the Era of Genomics. Front. Genet. 2020, 11, 880. [Google Scholar] [CrossRef]
  41. Isik, F.; Acosta, J.J.; Eckert, A.J.; Sniezko, R.; Wegrzyn, J. Pine SNP Chip Consortium: Progress on Pine SNP Discovery and Array Design in Loblolly Pine. In Proceedings of the Plant and Animal Genome XXVI Conference (PAG 2018), San Diego, CA, USA, 13–17 January 2018. [Google Scholar]
  42. Caballero, M.; Lauer, E.; Bennett, J.; Zaman, S.; McEvoy, S.; Acosta, J.; Jackson, C.; Townsend, L.; Eckert, A.; Whetten, R.W. Toward genomic selection in Pinus taeda: Integrating resources to support array design in a complex conifer genome. Appl. Plant Sci. 2021, 9, e11439. [Google Scholar] [CrossRef]
  43. Jackson, C.; Christie, N.; Reynolds, S.M.; Marais, G.C.; Tiikuzu, Y.; Caballero, M.; Kampman, T.; Visser, E.A.; Naidoo, S.; Kain, D. A genome-wide SNP genotyping resource for tropical pine tree species. Mol. Ecol. Resour. 2021, 22, 695–710. [Google Scholar] [CrossRef]
  44. Telfer, E.J.; Graham, N.; Stanbra, L.K.; Manley, T.; Wilcox, P.L. Extraction of high purity genomic DNA from pine for use in a high-throughput Genotyping Platform. N. Z. J. For. Sci. 2013, 43, 3. [Google Scholar] [CrossRef] [Green Version]
  45. Patterson, N.; Price, A.L.; Reich, D. Population Structure and Eigenanalysis. PLoS Genet. 2006, 2, e190. [Google Scholar] [CrossRef]
  46. Raj, A.; Stephens, M.; Pritchard, J.K. fastSTRUCTURE: Variational inference of population structure in large SNP data sets. Genetics 2014, 197, 573–589. [Google Scholar] [CrossRef] [PubMed] [Green Version]
  47. Zimin, A.; Stevens, K.A.; Crepeau, M.W.; Holtz-Morris, A.; Koriabine, M.; Marçais, G.; Puiu, D.; Roberts, M.; Wegrzyn, J.L.; de Jong, P.J.; et al. Sequencing and assembly of the 22-Gb loblolly pine genome. Genetics 2014, 196, 875–890. [Google Scholar] [CrossRef] [PubMed] [Green Version]
  48. Burdon, R.; Broekhuizen, P.; Zabkiewicz, J. Comparison of native-population and New Zealand land-race samples of Pinus radiata using cortical oleoresin monoterpenes. FRI Bull. 1997, 203, 50–56. [Google Scholar]
  49. Perry, A.; Wachowiak, W.; Downing, A.; Talbot, R.; Cavers, S. Development of a single nucleotide polymorphism array for population genomic studies in four European pine species. Mol. Ecol. Resour. 2020, 20, 1697–1705. [Google Scholar] [CrossRef] [PubMed]
  50. Plomion, C.; Bartholomé, J.; Lesur, I.; Boury, C.; Rodríguez-Quilón, I.; Lagraulet, H.; Ehrenmann, F.; Bouffier, L.; Gion, J.M.; Grivet, D.; et al. High-density SNP assay development for genetic analysis in maritime pine (Pinus pinaster). Mol. Ecol. Resour. 2016, 16, 574–587. [Google Scholar] [CrossRef] [PubMed]
  51. Howe, G.T.; Jayawickrama, K.; Kolpak, S.E.; Kling, J.; Trappe, M.; Hipkins, V.; Ye, T.; Guida, S.; Cronn, R.; Cushman, S.A.; et al. An Axiom SNP genotyping array for Douglas-fir. BMC Genom. 2020, 21, 9. [Google Scholar] [CrossRef] [Green Version]
  52. Mimura, M.; Aitken, S. Adaptive gradients and isolation-by-distance with postglacial migration in Picea Sitchensis. Heredity 2007, 99, 224–232. [Google Scholar] [CrossRef] [Green Version]
  53. Vitasse, Y.; Delzon, S.; Bresson, C.C.; Michalet, R.; Kremer, A. Altitudinal differentiation in growth and phenology among populations of temperate-zone tree species growing in a common garden. Can. J. For. Res. 2009, 39, 1259–1269. [Google Scholar] [CrossRef] [Green Version]
  54. Lopes, M.S.; El-Basyoni, I.; Baenziger, P.S.; Singh, S.; Royo, C.; Ozbek, K.; Aktas, H.; Ozer, E.; Ozdemir, F.; Manickavelu, A.; et al. Exploiting genetic diversity from landraces in wheat breeding for adaptation to climate change. J. Exp. Bot. 2015, 66, 3477–3486. [Google Scholar] [CrossRef]
  55. Funk, W.C.; Forester, B.R.; Converse, S.J.; Darst, C.; Morey, S. Improving conservation policy with genomics: A guide to integrating adaptive potential into U.S. Endangered Species Act decisions for conservation practitioners and geneticists. Conserv. Genet. 2019, 20, 115–134. [Google Scholar] [CrossRef]
  56. de Cara, M.Á.R.; Villanueva, B.; Toro, M.Á.; Fernández, J. Using genomic tools to maintain diversity and fitness in conservation programmes. Mol. Ecol. 2013, 22, 6091–6099. [Google Scholar] [CrossRef] [PubMed]
Figure 1. Flow diagram showing number of SNPs submitted, scored, and selected from common and rare SNP pools, with and without SNPs in the flanking regions, for the screening and genotyping arrays. Values in parentheses indicate how many SNPs from each sub-category were selected for the genotyping array. PHR indicates how many SNPs were deemed as high resolution polymorphic on the genotyping array.
Forests 13 00176 g001
Figure 2. Minor allele frequency of SNPs (classes PolyHighRes, No Minor Homozygote, and MonoHighRes) included on the genotyping array.
Forests 13 00176 g002
Figure 3. Population structure of Pinus radiata in New Zealand (A), including both native provenances and New Zealand breeding populations as captured by the first and second principal components (PC1 and PC2) of SNP data. Native provenances are shown as a subset in (B) to highlight the correspondence between PC1 and ancestry.
Forests 13 00176 g003
Table 1. Subsets of SNPs submitted for the screening array.
SNP SubsetMAFNon-Target SNPs (MAF > 0.03)No. of SNPs
Common_single>0.03No26,142
Common_multi>0.03Yes95,428
Rare_single<0.03No269,031
Rare_multi<0.03Yes963,871
Table 2. Types of samples tested on the radiata pine screening array.
Category *No. of Samples (Total = 480) *Purpose
Haploids50Identify multilocus (off-target) binding
Paired samples from needle and cambium34 (17 pairs)Identify probes affected by tissue type, assess reproducibility
Triplicates72 (25 sets)Assess reproducibility
Breeding program and client favourites334Assess general probe performance and allele frequencies, compare to exome capture data
Trios/duos79Assess inheritance pattern of SNPs
* Note—several samples appeared in more than one category.
Table 3. Subsets of SNPs included on the genotyping array (NZPRAD02).
SNP CategoryMAFProbe SetsNo. of SNPs
Common>0.03116,608
Common>0.03211,625
Rare<0.0316748
Rare<0.0321304
TOTAL 36,285
Table 4. Samples tested on the genotyping array. Progenitors are breeding program first-generation selections and progeny are their advanced-generation progeny.
Sample CategoryNo. of Samples
NZ progenitors (archive)784
NZ progeny (clonal trials)2863
NZ progeny (control pollinated trials)1309
NZ progeny (open-pollinated trials)1182
Australian progeny (clonal and open-pollinated trials)2110
Quality control samples (miscellaneous)200
TOTAL8448
Table 5. Categorization of SNPs detected in 115 diploid samples using the screening array (NZPRAD01).
SNP Category *TotalPercentage
PolyHighResolution21,0784.8%
NoMinorHom29,2456.7%
MonoHighResolution169,58238.7%
CallRateBelowThreshold16,5323.8%
OffTargetVariant51181.2%
Other195,88544.7%
AAvarianceX910.02%
AAvarianceY1480.03%
ABvarianceX2130.1%
ABvarianceY1800.04%
BBvarianceX1490.03%
BBvarianceY1860.04%
HomHomResolution3370.1%
TOTAL438,744100.0%
Table 6. Sample quality control summary and genotyping metrics using Affymetrix default settings with an adjusted call rate threshold of 80%.
StatisticCambium and NeedlesCambiumNeedles
Total sample number84483668082
Passed samples8397 (99.4%)365 (99.7%)8032 (99.4%)
Failed samples51150
Average Cluster Call Rate98.5%98.8%98.5%
Sample Reproducibility99.9%99.7%99.9%
Table 7. SNP quality control summary using an adjusted 80% call rate threshold.
SNP CategoryNo. of Markers% of Markers
PolyHighResolution16,49845.5
NoMinorHom880224.3
MonoHighResolution404411.1
CallRateBelowThreshold50.0
OffTargetVariant3461.0
Other659018.2
TOTAL36,285100.0
Table 8. Percentage of heterozygous SNP genotypes in samples of DNA mixed in proportions of 1:1 to 20:1 original (O) to contaminating (C) DNA (averaged across duplicates) (pure sample genotype:contaminant).
Unrelated SamplesRelated Samples
(1)(2)(3)(1)(2)(3)
DNA Mixture (O:C)O = AA
C = BB
O = AA
C = AB
O = AB
C = AA
O = AA
C = BB
O = AA
C = AB
O = AB
C = AA
1:199.7%49.3%52.9%98.2%48.9%39.1%
2:191.3%9.1%87.9%88.3%11.8%84.6%
5:14.9%0.3%99.4%5.6%0.5%99.0%
8:11.0%0.2%99.5%1.9%0.3%99.6%
10:10.0%0.3%99.5%0.4%0.2%99.8%
12:10.0%0.1%99.7%0.3%0.2%100.0%
15:10.0%0.2%99.8%0.1%0.2%99.8%
20:10.0%0.1%99.8%0.1%0.3%100.0%
Publisher’s Note: MDPI stays neutral with regard to jurisdictional claims in published maps and institutional affiliations.

