Article

Study of the Vertical Structures, Thermal Comfort, Negative Air Ions, and Human Physiological Stress of Forest Walking Spaces in Summer

College of Landscape Architecture, Zhejiang A&F University, Hangzhou 311300, China
*
Author to whom correspondence should be addressed.
These authors contributed equally to this work.
Submission received: 4 December 2021 / Revised: 15 February 2022 / Accepted: 15 February 2022 / Published: 18 February 2022
(This article belongs to the Section Forest Economics, Policy, and Social Science)

Abstract

:
Forest walking is a popular, healthy, and light outdoor activity. The potential comprehensive relationships between the vertical structures, thermal comfort, negative air ions (NAI), and human physiological stress in forest walking spaces have not been determined. We performed an experiment in the Baishuihe National Nature Reserve, Sichuan Province, China. Thirty-two college students recruited as subjects completed a forest walk (approximately one kilometer) on the same trail divided into three vertical structure type subsections, namely: A (dense herb and shrub layers with a sparse tree layer), B (dense tree, herb and shrub layers), and C (dense tree and herb layers with a sparse shrub layer). When the subjects passed preset environmental measurement points, staff measured climatic indexes (air temperature, relative humidity, wind velocity, surface temperature and global radiation) and NAI levels, and these data were input into the Rayman model to form a comprehensive thermal comfort index, the physiologically equivalent temperature (PET). PET and NAI differences and dynamic data among the subsections were analyzed. The subjects’ brain waves, heart rates (HRs), and walking speed (S) were digitally recorded. We selected brain wave θ, γ and β-high/α rates, neuroemotional indexes (stress and relaxation) and HR as physiological indicators, and S as an auxiliary indicator. The correlations between PET and NAI with physiological and auxiliary indexes were analyzed. Forest type C showed the lowest PETs and highest NAIs along with the most stable dynamic changes. PET was negatively correlated with HR and positively correlated with γ (12 channels). NAI was positively correlated with S and relaxation and negatively correlated with γ (two channels) and the β-high/α ratio (five channels). These comprehensive relationships suggest that dense tree, sparse shrub, and high-coverage herb layers combined with optimal temporal conditions (before noon or after a light rain) form the best thermal comfort and NAI conditions conducive to reducing human physiological pressures during summer daytime forest walking. These results provide theoretical references for forest walking and spatial regulation.

1. Introduction

1.1. Forest Walking and Physiological Stress

Stress is a common problem among urban people, and physiological indicators related to stress can reflect an individual’s health status in this regard [1,2]. Forests are widespread natural environments, and walking is an easy mode of exercise. The combination of forests with walking has health value [3,4]. An increasing number of people have begun walking in forests in large parks, suburban forests, and natural forests to achieve relaxation and pleasure. Forest walking is becoming a widespread health activity.
A link has been established between forest therapy and reduced stress. Previous empirical studies have been conducted on various subjects, usually consisting of forest therapy over a period of three days or more [5,6]. Other studies have focused on the stress-reducing effects of short-term forest landscape visual stimulation [7,8]. Such visual studies also used photographs to simulate forest landscapes and physiological indicators, such as heart rate (HR), blood pressure (BP), and brain waves, to reflect physiological stress.
However, in addition to visible elements, invisible elements, such as microclimate conditions and air compositions, exist on forest trails. Studying the microclimates and air compositions of forest walking spaces is thus of great value. However, it is difficult to study real spaces due to their complexity and variability at the microscale level. Previous studies have shown that in actual forests, microclimates and beneficial air compositions may provide positive physiological benefits, including reduced physiological stress [9,10]. More importantly, at the microscale level, the microclimatic conditions and air environments of forest walking spaces may also be affected by local vegetation structures [9,11,12]. The possible response relationships of forest spatial structures, microclimates and air compositions with physiological pressures thus need to be further revealed. Based on this need, the empirical research carried out in this study integrated these three aspects to support the implementation of scientific forest walking space construction and management practices.

1.2. Vertical Structure–Thermal Comfort and Negative Air Ions

The microclimates of forest walking spaces are affected by spatiotemporal factors. Temporal factors are mainly determined by diurnal and yearly variations in solar exposure, while spatial factors mainly concern differences in plant species and vegetation structures [13,14]. Vegetation structures can generally be divided into vertical and horizontal dimensions. Previous studies have consistently indicated that forest space microclimates are mainly influenced by spatial structure factors such as the top cover, plant density, and plant area index (PAI) [9,10,15]. In a walking space, plant communities are located on both sides of the trail, and the vertical forest vegetation structure is thus easier to recognize than the horizontal structure. Studies on the microclimate and air composition of vertical vegetation structures have given more attention to the canopy characteristics and heights of trees and less attention to the shrub and herb layers [13,16]. In other observational or simulation-based studies, shrubs and herbs have also been shown to influence the local climate and air composition [17,18,19]. Since the vertical structure of vegetation in the forest exists as a whole, we attempted to simultaneously consider the three layers of trees, shrubs, and herbs in this empirical study. Additionally, the vertical structure and vegetation composition are the main factors affecting forest microclimates. Therefore, the microclimate conditions can be considered basically stable in a forest walking space with a consistent spatial structure and plant species.
What kind of specific indicators reflect the impacts of microclimate conditions on the human body? Researchers have used thermal comfort as an evaluation metric to represent the comprehensive feeling in the human body with respect to all climate parameters [20,21,22]. The physiological equivalent temperature (PET), predicted mean volume (PMV), and thermal climate index (UTCI) have also often been used to evaluate environmental thermal comfort [23,24,25,26]. Among these commonly used thermal comfort indexes, PET has a wide application range and has been applied by a large number of researchers to study the thermal comfort level of green spaces [14,27,28,29]. The PET index is based on the Munich Energy Balance Model for Individuals (MEMI) proposed by Höppe [30]. The MEMI combines climatic parameters, body parameters, clothing, activity, and environmental factors. The PET converts the actual complex thermal conditions of any outdoor location into the equivalent air temperature in a typical indoor environment; thus, the unit of PET is °C. This temperature value reflects the heat budget of the human body in an outdoor environment at constant core and skin temperatures [30]. Moreover, PET calculations can be estimated using the Rayman software developed by the Institute of Meteorology at the University of Freiburg [31,32].
As another invisible index in forest environments, air composition has important impacts on human health. Some air components, including negative air ions (NAI), the air oxygen content, and the relative phytoncide content, have positive effects [33,34], while other air elements, such as particulate matter (PM 2.5), have negative impacts [35,36]. Based on forest characteristics, the PET and NAI are widely used to reflect thermal comfort and beneficial air components, and these indexes may be closely related to the physiological stress factors considered in this study.

1.3. Thermal Comfort and Negative Air Ion–Physiological Stress

With the progress of biomedicine, psychophysiological indicators have become an important way to evaluate the status of the human body and have been widely used in the nature and health research fields. Based on the improvement and popularization of measurement technologies, the stress-related physiological indicators used in health studies include electroencephalograms (EEG), BP, HR, and HR variability (HRV). Wu studied the relationships between thermal environmental climatic indicators and brainwaves by means of an adjustable indoor thermal environment space, confirming the possibility that multichannel brainwaves can indicate thermal comfort [37]. Similarly, indoor research has increasingly used the relationship between EEGs and the indoor thermal environment to evaluate thermal comfort and emotional changes in subjects and establish EEG models [38,39,40]. Choi established 12 indoor climate chambers using temperature, odorant stimuli, and sound as variables, and proposed the validity of using brain waves (α and β) as pressure criteria [41]. However, these indoor studies did not consider factors such as wind or sunlight and instead focused more on temperature or humidity. More interestingly, Ko found that under the same indoor temperature and humidity conditions, subjects in a room with a window (with a view of natural outdoor scenery) had better subjective thermal comfort and mood outputs than subjects in a room without a window [42]. In addition, a correlation between NAI and EEG was proven by laboratory experiments with adjustable air compositions [43,44].
These previous studies have proven that physiological indicators, such as brain waves, are indeed correlated with thermal comfort and NAI and emphasized the importance of studying natural environmental conditions. As stress reduction theory (SRT) states, the natural environment has the potential to reduce stress [45]. At the same time, as determined in other researchers’ empirical studies on urban walking, it is more difficult to measure physiological indicators in subjects on the move than in still subjects, as subjects need to wear mobile measuring devices to collect physiological indicator data [46,47]. The data of some samples may be lost due to various outdoor interference factors. In addition, the study of Horiuchi proved that outdoor walking speed (S) is another indicator associated with physiological indicators such as HR [48].

1.4. Objective and Hypotheses

Since the microclimate and air composition are greatly affected by seasonal factors at the microscale level, this study first required defining a targeted season. Summer is the main season in which people perform outdoor activities. Forests are usually located some distance from people’s homes, and forest walking often occurs neither too early nor too late. Based on these considerations, the following research objective was proposed: during the daytime period in summer, forest walking spaces with different spatial vertical structures at the same research site were selected to study the resulting differences in the PET and NAI. The physiological stress responses to the PET and NAI were studied synchronously.
Additionally, we formed the following hypotheses: (1) the forest walking space with the most abundant vegetation in the vertical structure will result in better thermal comfort and negative oxygen ion performances (lower PET values and higher NAI values), and (2) a relatively low PET and relatively high NAI will lead to lower physiological stress states in subjects.

2. Materials and Methods

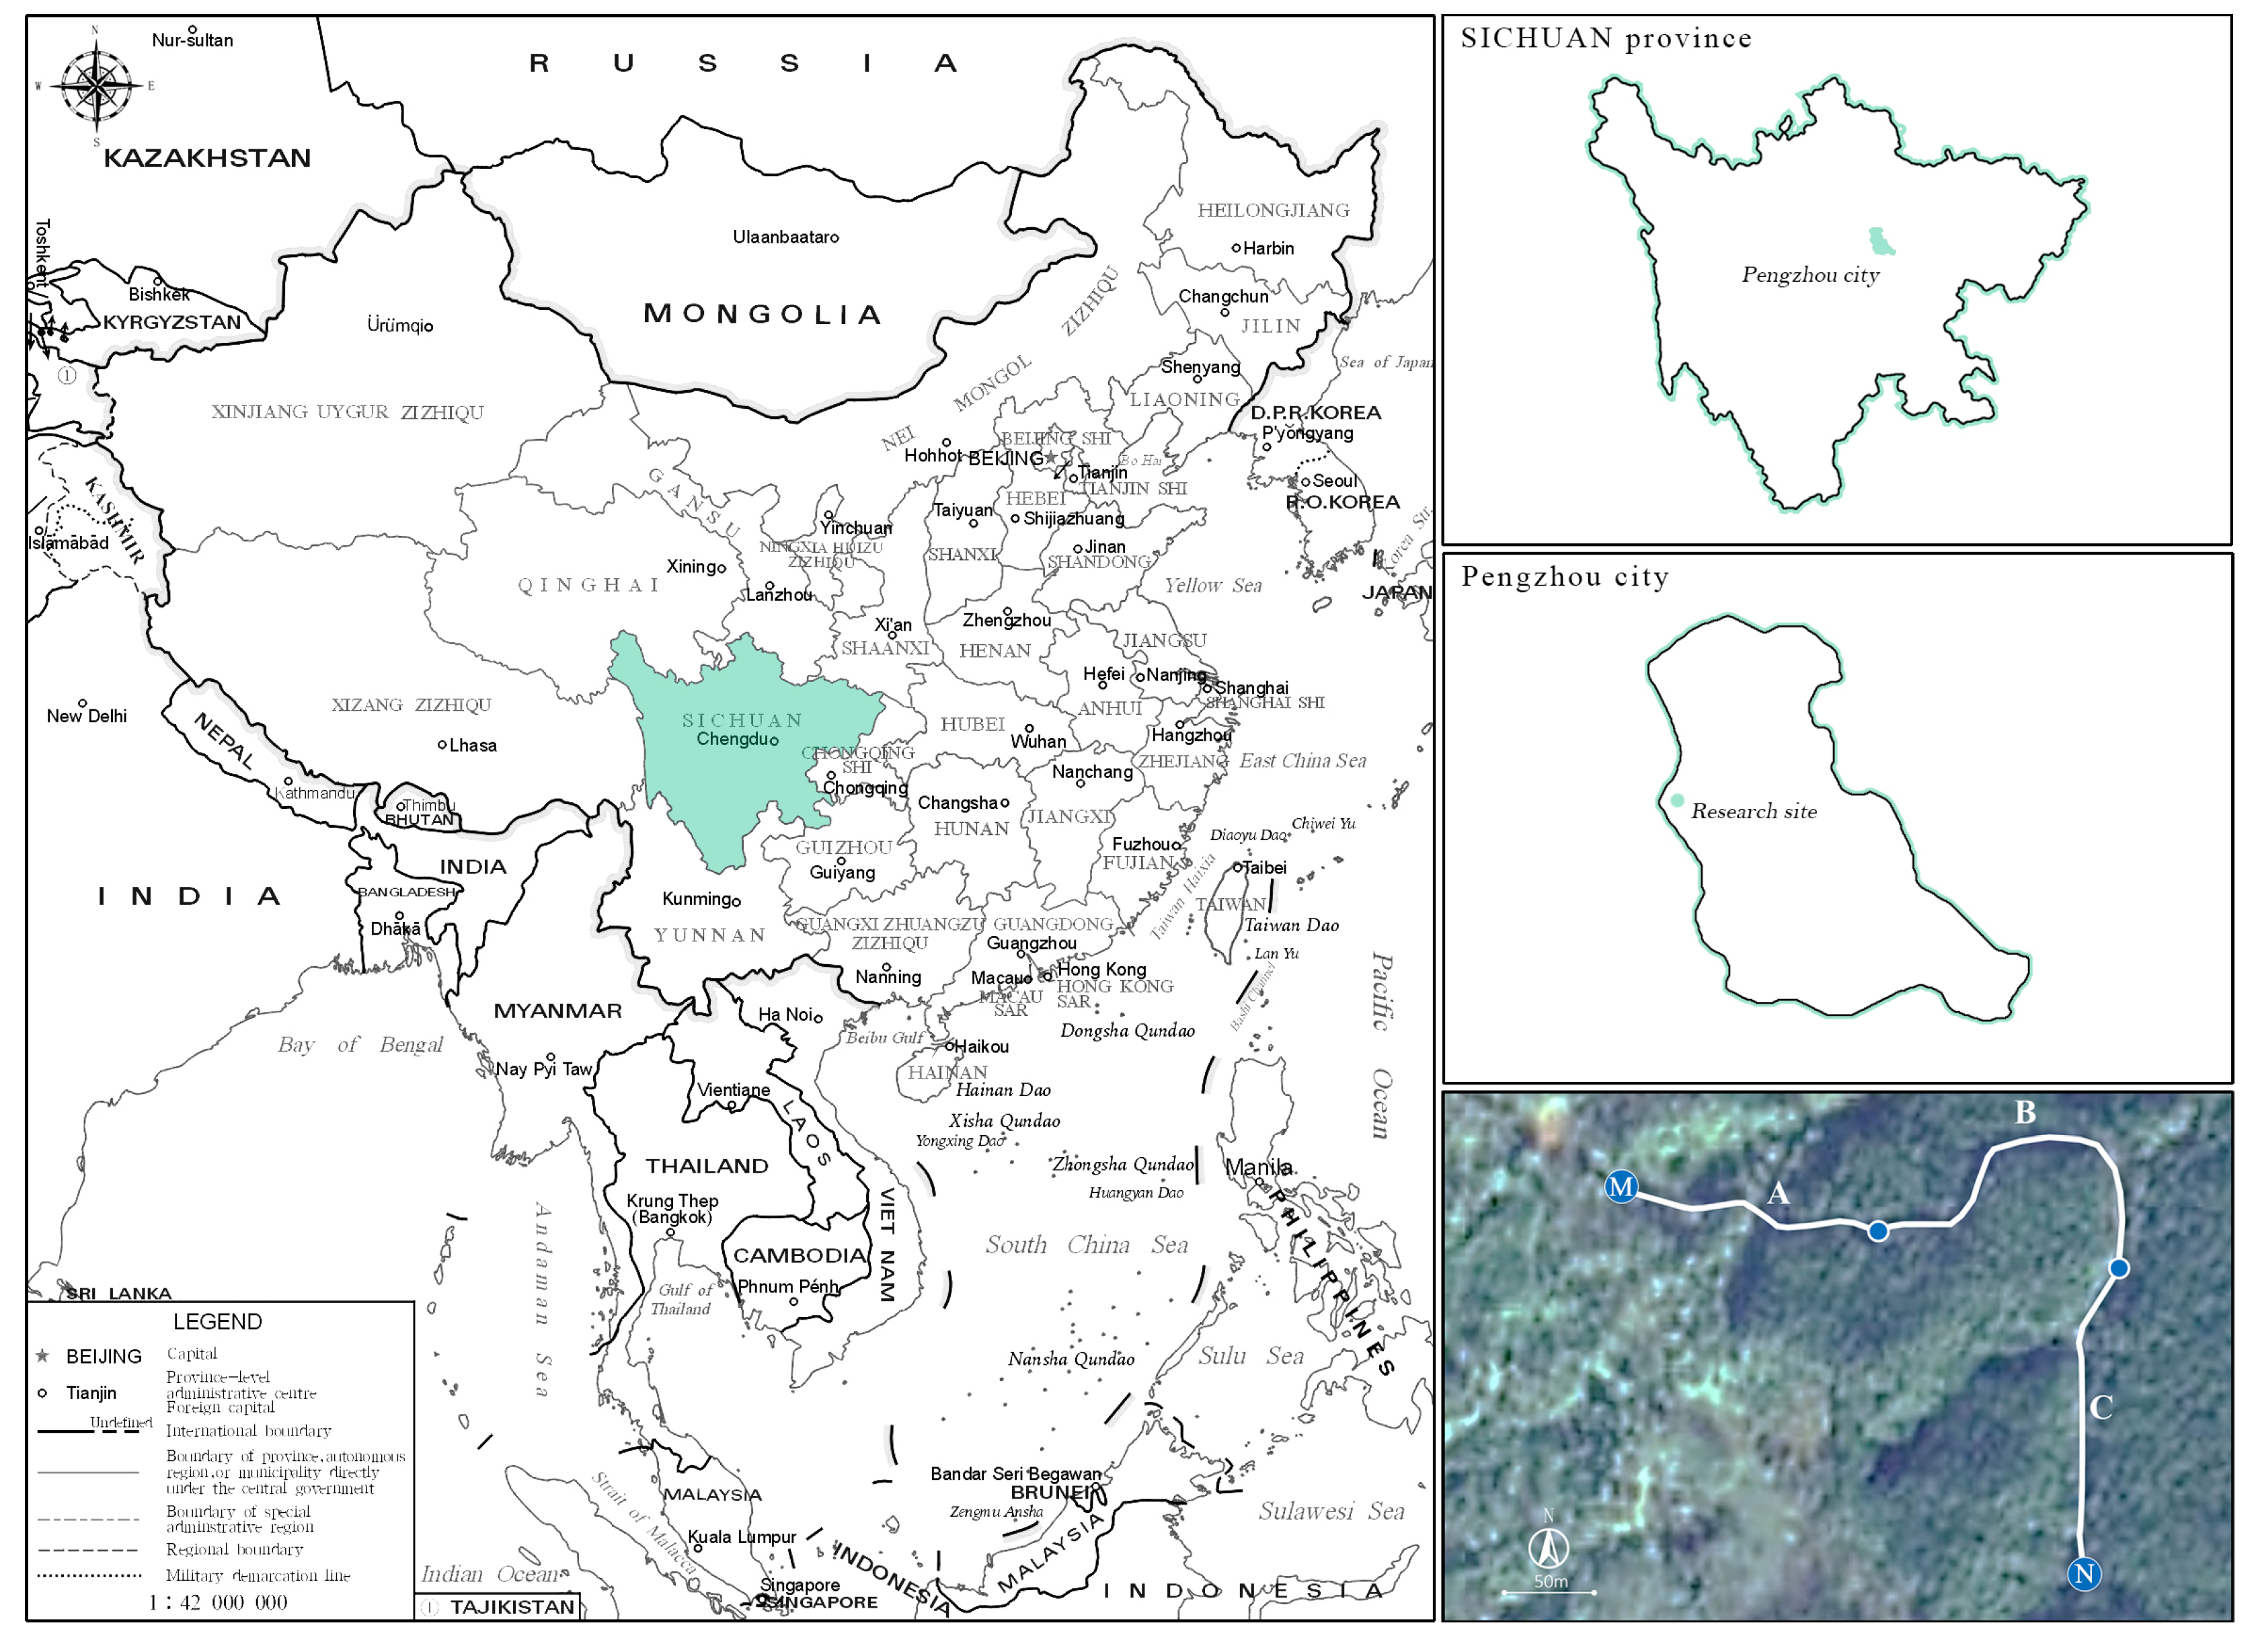
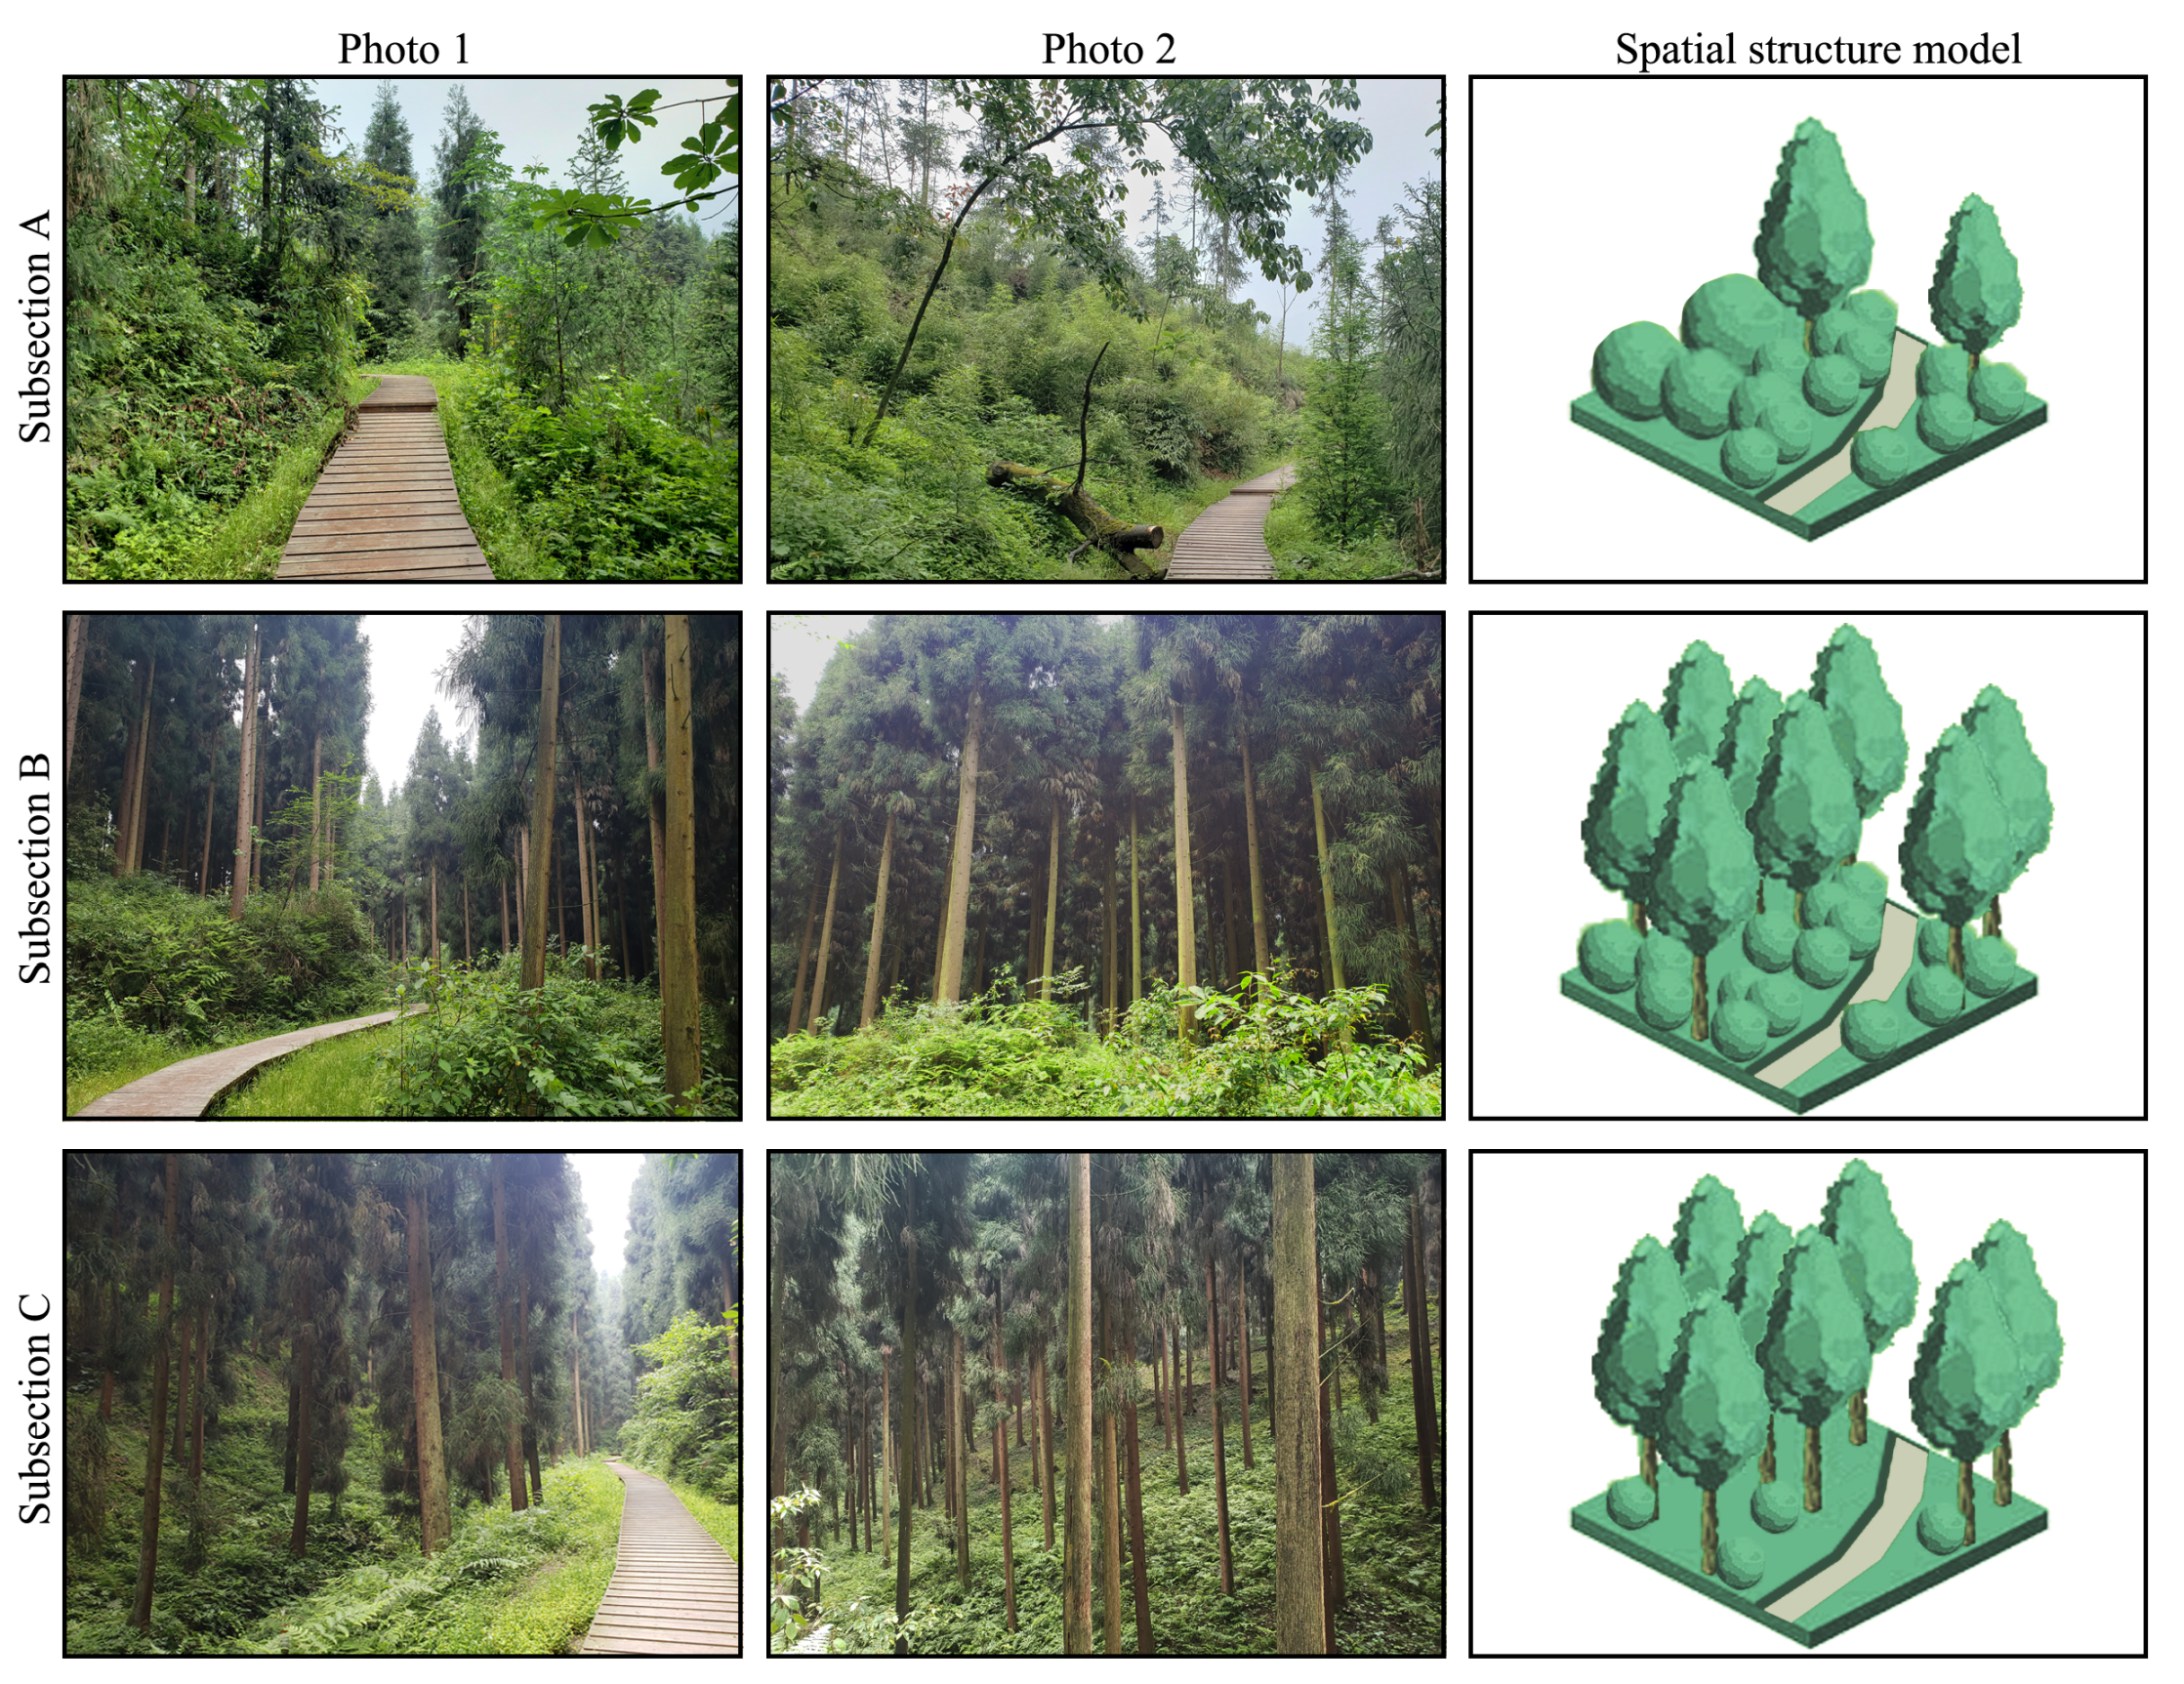
2.1. Experimental Site

This study was conducted from 31 May to 1 June 2021 at the Zhongba Conservation Station of Baishuihe National Nature Reserve, Sichuan Province, China. The nature reserve is located in northern Pengzhou city, Sichuan Province, with a total area of 30,150 hectares. Various types of vegetation can be found in the study area, and the forest walking spaces are of excellent quality. We chose an approximate one-kilometer section of forest walking space as the experimental site (the starting point coordinates were 31°13′21″ N, 103°44′54″ E) (Figure 1). The average daytime temperature of this forest walking space on these two days was 24.6 °C. The vertical structure of the vegetation in the analyzed forest walking space has three layers: trees, shrubs, and herbs. Cryptomeria Fortunei is the dominant tree species in this forest. By analyzing the vertical structure of the study space before the experiment, the forest trail was divided into three subsections. The three subsections included subsection A (128 m one way), B (194 m one way), and C (153 m one way).
The vertical structures and types of vegetation in these three subsections are shown below in Figure 2. In subsection A, the tree layer is very sparse, the herb layer has high coverage, and the shrub layer grows very densely because no shelter is provided by the tree layer. The three layers in subsection B are very dense, with high coverage. Subsection C is distinguished from subsection B by its sparse shrub layer. The vertical structure of subsection C basically retains only two layers: trees and herbs.

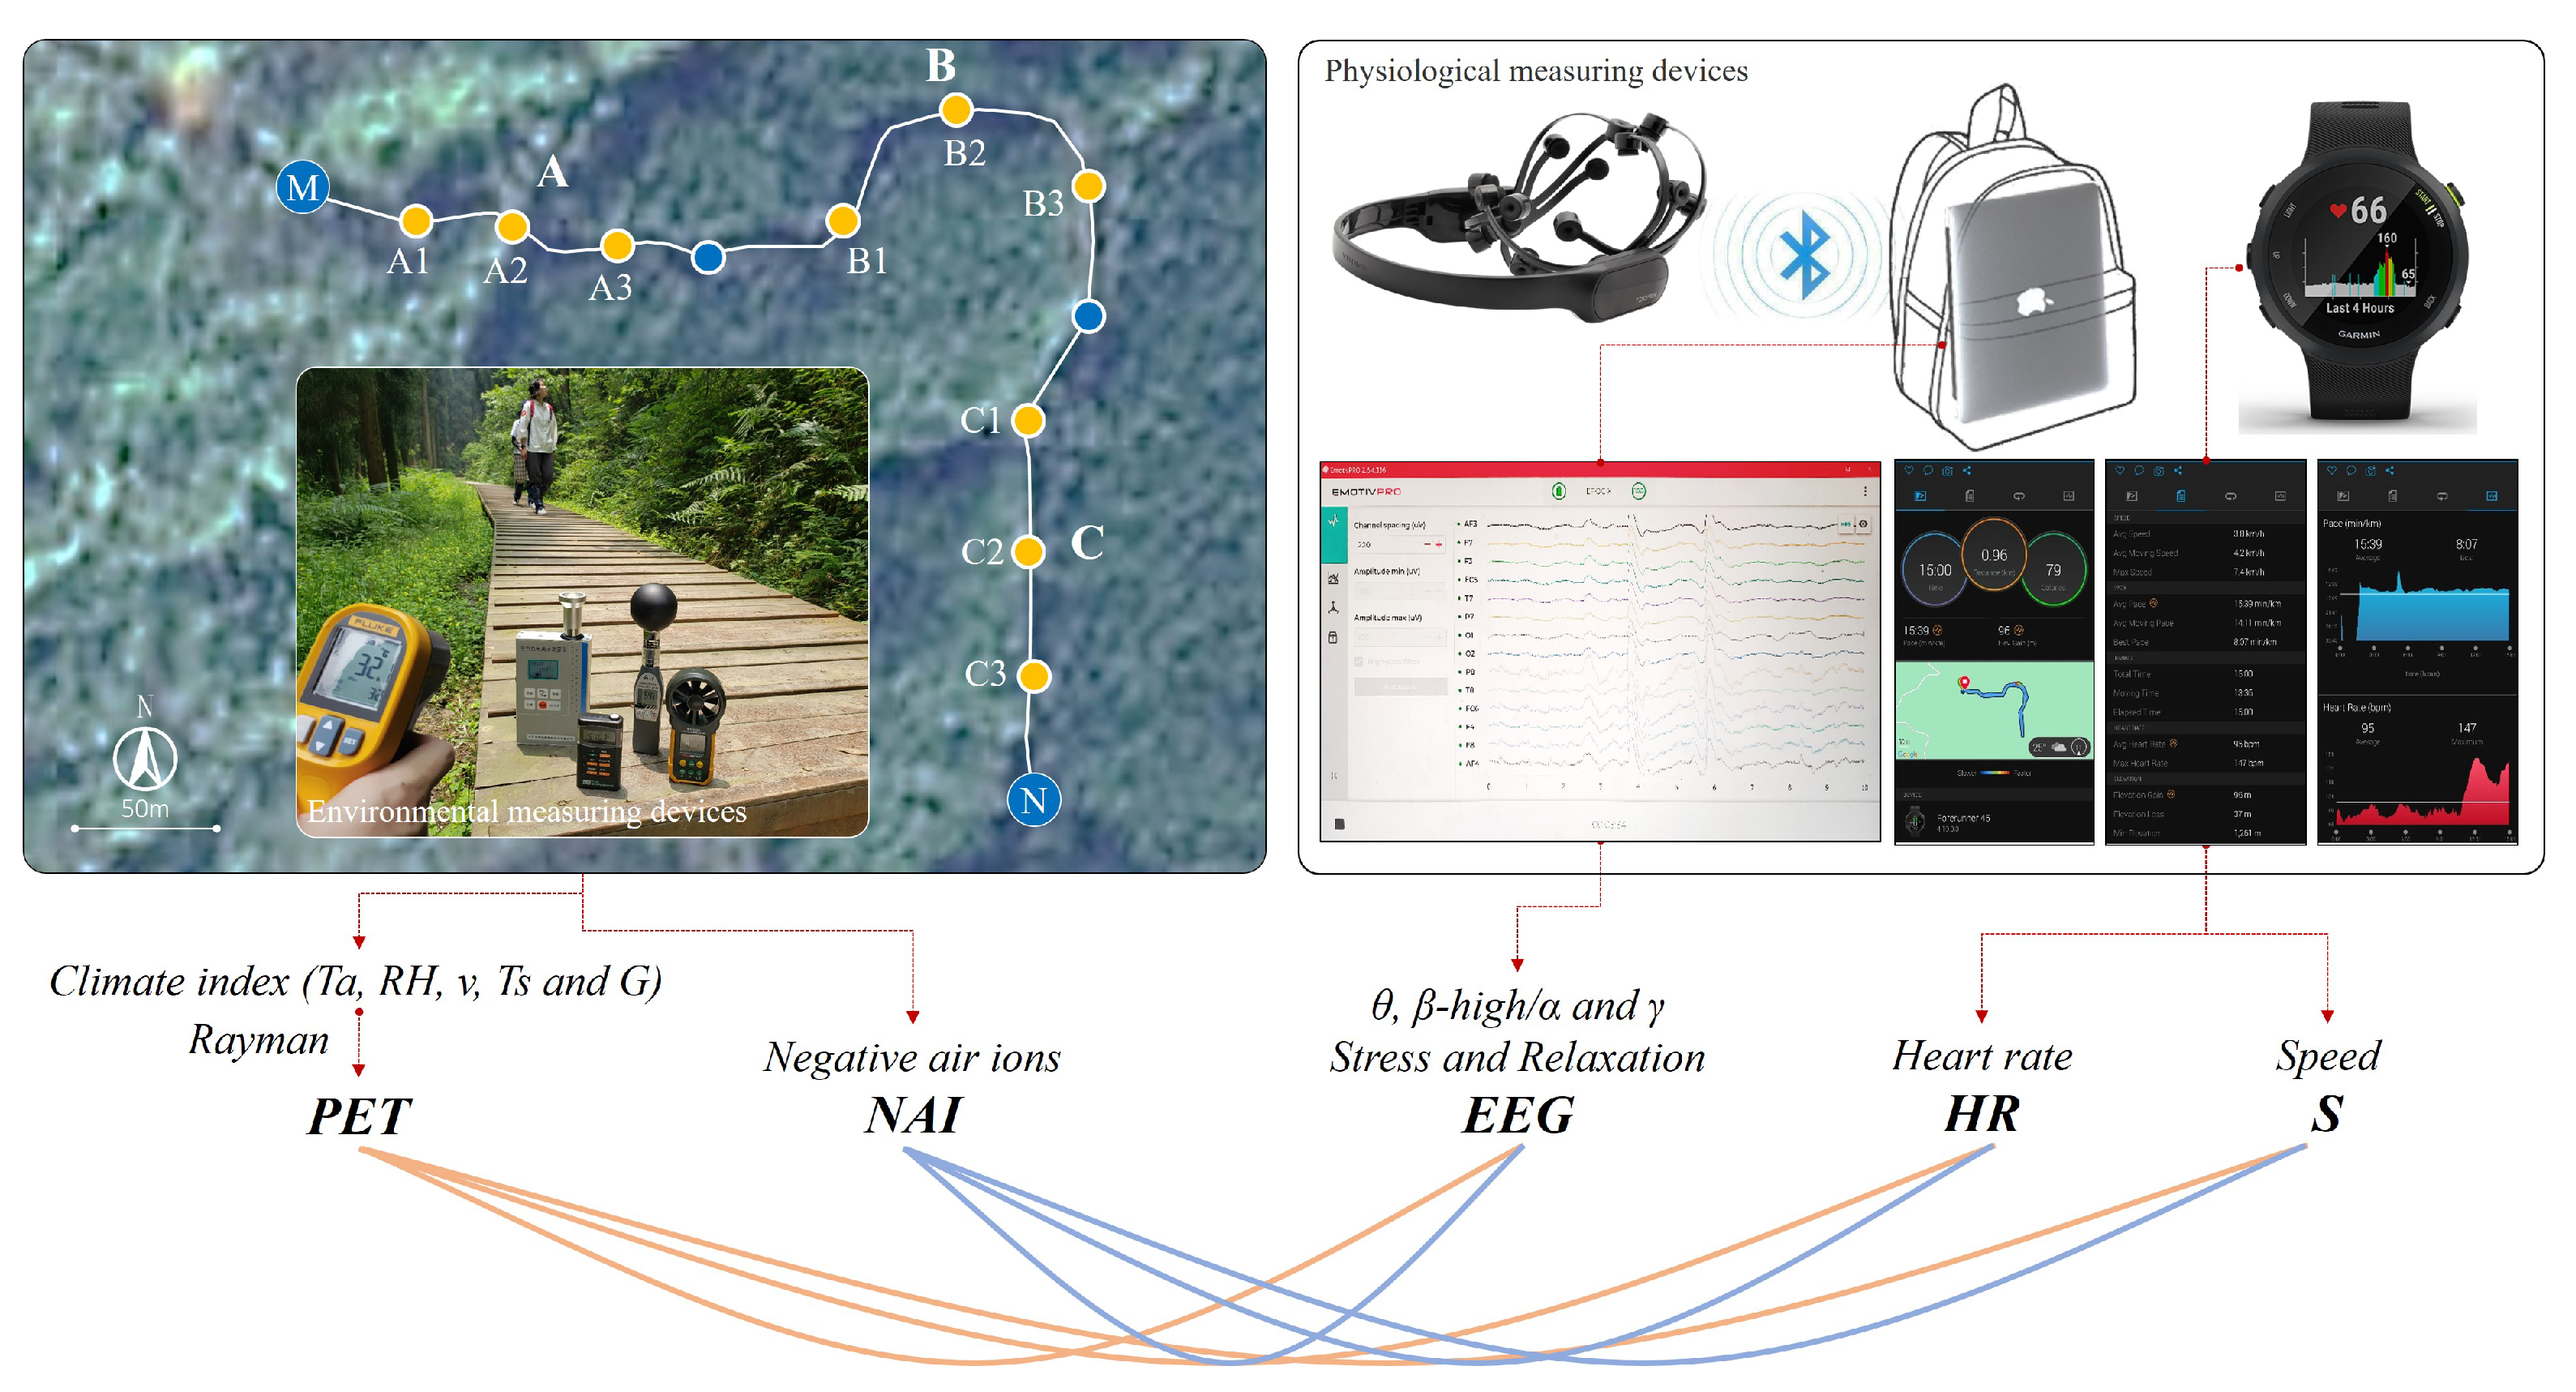
2.2. Data Measurement

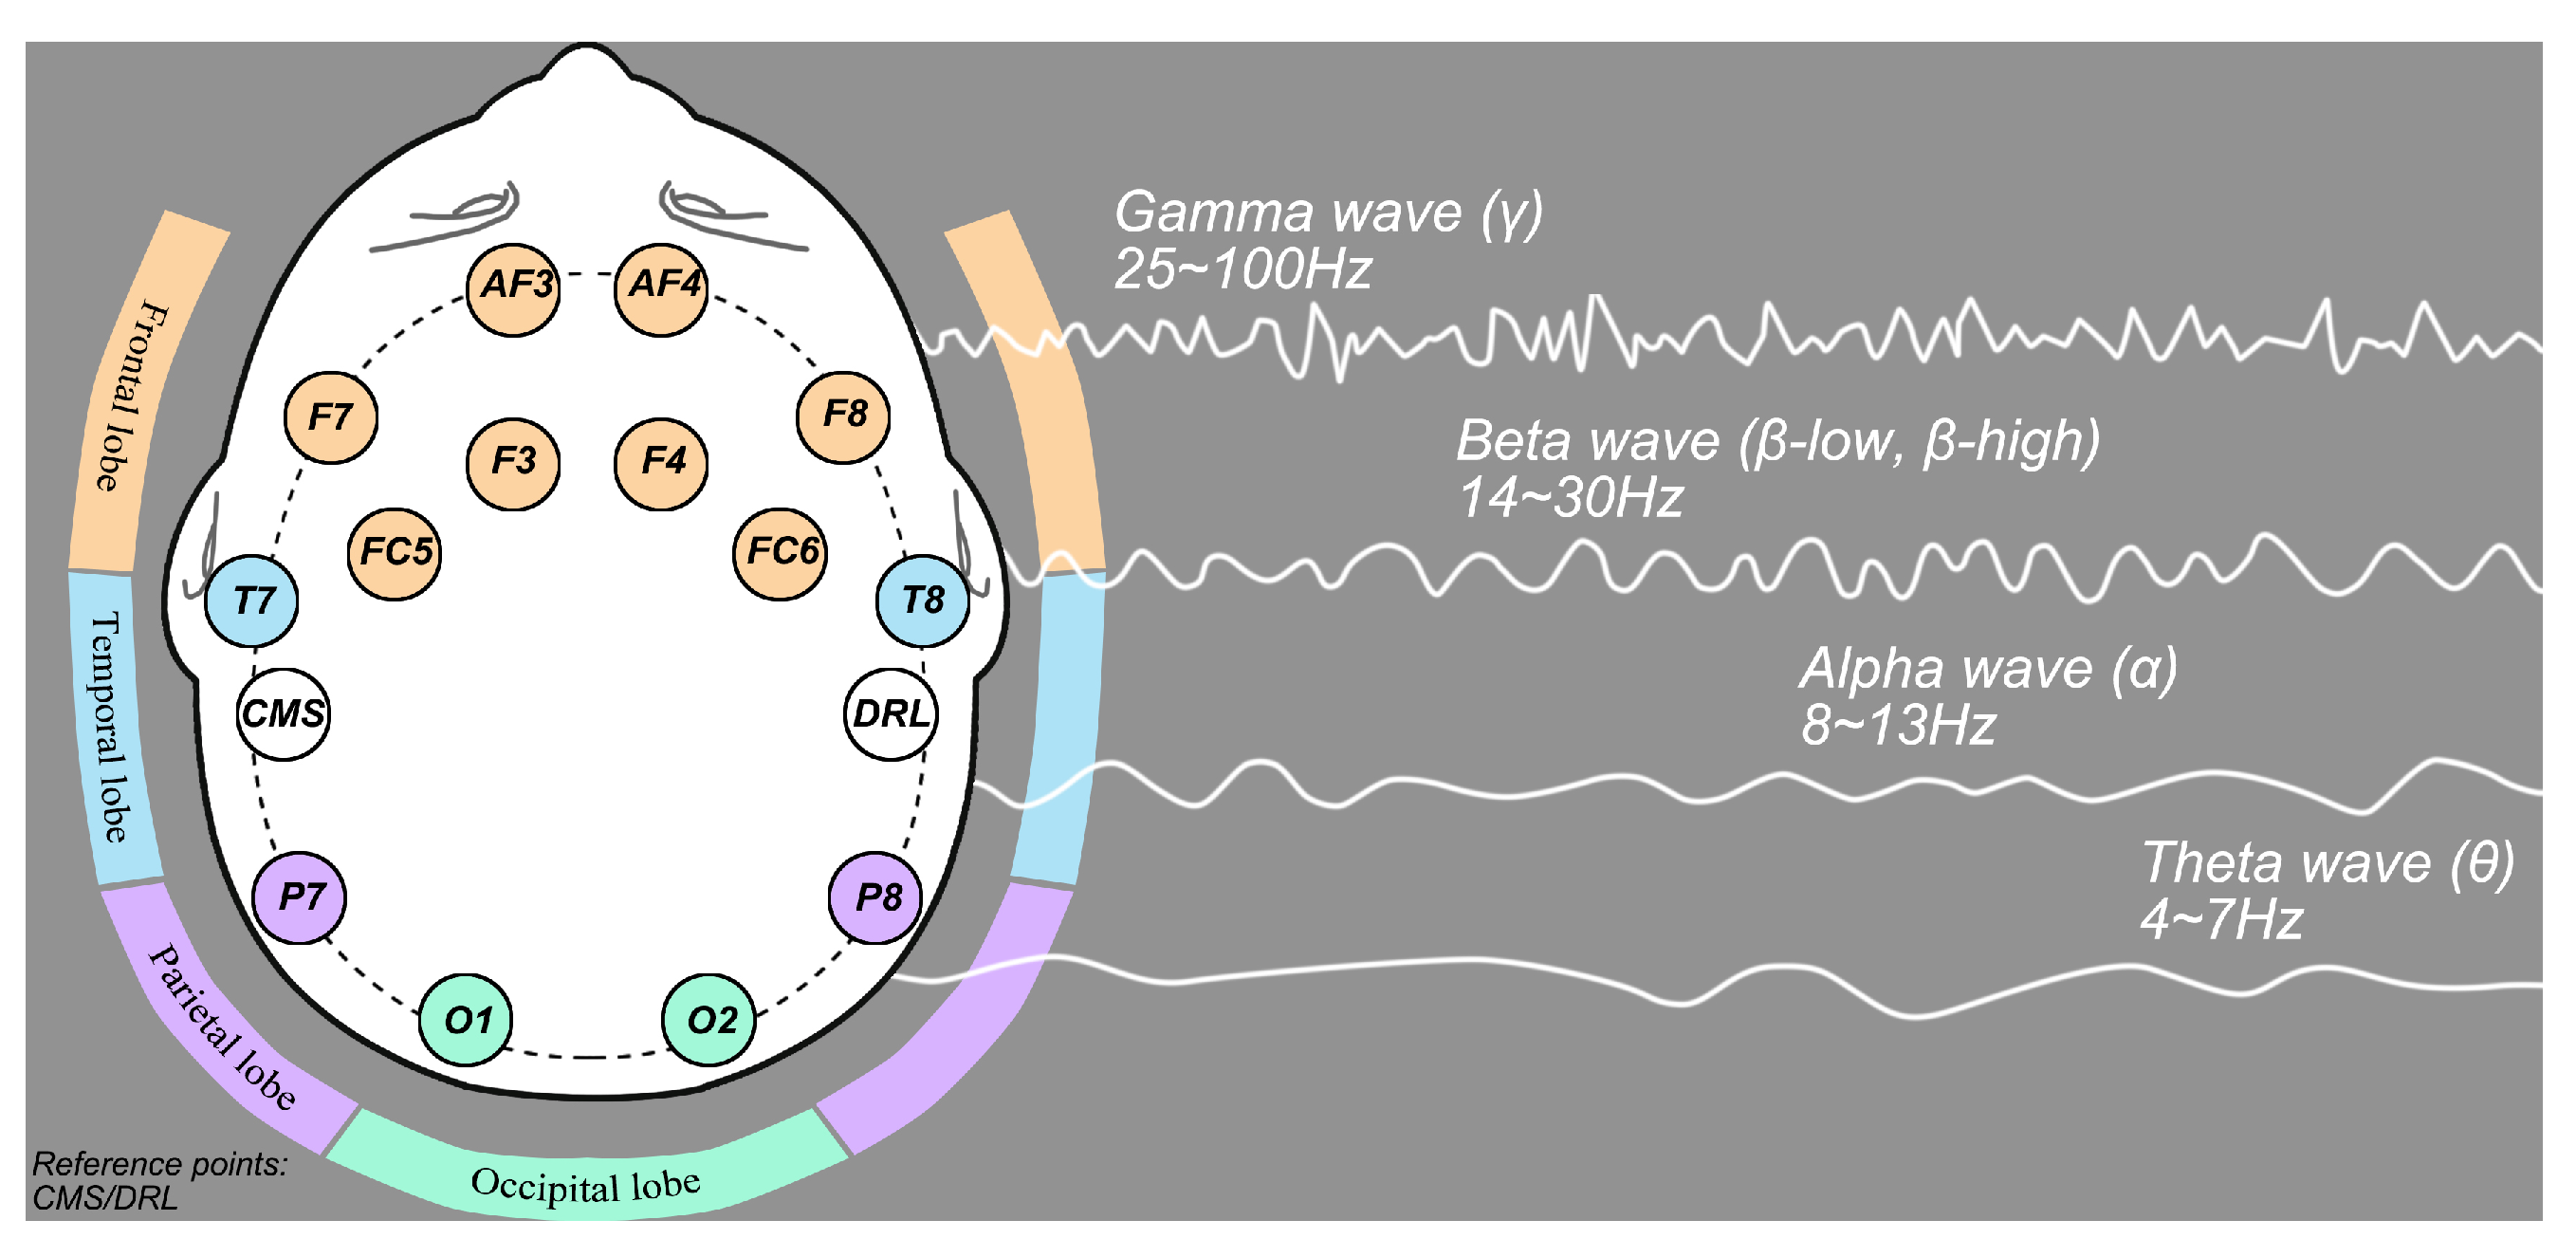
2.2.1. Physiological Stress

We recruited 32 college students (the male-to-female ratio was 1:1) as the subjects of this study by posting recruitment information on the university online platform. The mean age of all subjects was 20.3 (range = 18 to 22). Their body mass index (BMI) values ranged from 18.9 to 22.9. The subjects had no history of smoking or mental illness. All subjects had a detailed understanding of the experimental procedure and signed informed consent forms before the experiment. Each subject was randomly assigned a time period between 10:30 and 12:30 (typically, half an hour was required for each subject to complete the experiment). Each subject wore a mobile brainwave device (Emotiv EPOC X) and an exercise watch (Garmin Forerunner 45), both of which collected physiological data. The scientific reliability of these two devices has been confirmed by previous researchers [49,50]. The EEG device uses 14 channels (AF3, AF4, F3, F4, F7, F8, FC5, FC6, T7, T8, P7, P8, O1, and O2) to collect the brain waves released by the subjects’ four brain lobes (frontal, temporal, parietal, and occipital) and transmits the data via Bluetooth to a portable computer. As shown in Figure 3, the instrument can collect four types of brainwaves. Brainwaves with higher frequencies, such as gamma (γ) and beta (especially β-high) waves, indicate higher levels of excitement; in contrast, brain waves with lower frequencies, such as alpha (α) and theta (θ) waves, indicate greater relaxation.
In previous studies, the β/α ratio has often been used to describe relaxation degrees [51,52]. Therefore, in this study, we chose to analyze two separate brainwaves, γ and θ, and one ratio, namely, the β-high/α ratio. Among these metrics, γ and β-high/α are inversely proportional to the degree of relaxation, while θ is directly proportional to the degree of relaxation. Emotiv software provides researchers with more intuitive neural emotional indicators by further processing brain waves using algorithms. We selected the stress and relaxation indicators related to stress for subsequent analyses. The exercise watches worn by the subjects collected data on the subjects’ heart rate (HR, in bmp) and the auxiliary indicator walking speed (S, in m/s) and recorded the walking path based on global positioning system (GPS) data. Subjects started at point “M”, walked to point “N”, and then returned to point “M” according to their walking habits (there was no limit placed on the speed of each subject in this study). After the experiment, the staff combined and segmented the GPS and time data and calculated the average values for each subsection.

2.2.2. PET and NAI

While the physiological indicators were measured, the PET and NAI were measured in the three subsections. Since mobile climate measurement methods are not common, this study adopted the fixed-point measurement method and then calculated the average values. Measuring points (A1, A2, A3, B1, B2, B3, C1, C2, and C3) were set in the three subsections (Figure 4). When subjects passed a certain measuring point, the staff recorded the index data, including the air temperature (Ta, °C), relative humidity (RH, %), wind velocity (v, m/s), surface temperature (Ts, °C), global radiation (G, W/m2), and NAI (ion/cm3). These index values were measured by a Hengxin temperature and humidity meter AZ8778 (accuracy: ±0.8 °C, ±3%), Huayi anemometer PM6252B (accuracy: ±2%), Fluke infrared thermometer MT4 MAX (accuracy: ±1.5 °C), Taishi solar radiometer TES1333 (accuracy: ±10 W/m2), and IMH-01 NAI meter (accuracy: ±10%). The measurement process should not have affected the normal walking of the subjects. After the experiment, the Ta, RH, v, Ts, and G data were input into the Rayman model to calculate the PET at each measuring point. Finally, the average PET and NAI values corresponding to the times at which the subjects passed the subsections were obtained by averaging the measurement point values.
Light rain fell at the study site during the night between the first and second days of the experiment. Changes in external climatic conditions may affect the PET and NAI at the microscale level, which is the focus of this study. Therefore, “whether it rained before walking” was also considered an auxiliary factor in this study. The climate indicators and PET and NAI values obtained for each subsection are shown in Table A1 of the Appendix.
Correlation analysis requires obtaining multiple complete groups of data. Each group of data represented the physiological parameters of a subject when they passed through a certain subsection and the environmental parameters at that time, including the subjects’ θ, β-high/α, γ, stress, relaxation, HR, and S metrics, as well as the PET and NAI values of the environment. Thirty-two subjects in this study each walked through three subsections, theoretically yielding 96 groups of data. However, the physiological measurement equipment utilized in this study could be disturbed by outdoor movement. We finally obtained 44 groups of effective and complete physiological stress indicator data. The main reason for the loss of sample data was the disconnection of the EEG equipment during walking. The signal interruptions may have been due to slight body and head movements during walking, or the equipment may have been disturbed by other signals. In this study, subjects’ walking could not be affected by other events; thus, the staff could only check whether the data were complete after completion of the whole walk. These 44 groups of complete corresponding data were paired to analyze the relationships among the indicators (Figure 4).

2.3. Statistical Analysis

First, analysis of variance (ANOVA) was used to observe whether the differences in the vertical structures of forest walking spaces affected the thermal comfort of subjects or NAI. Rainfall was measured as a secondary factor, and ANOVA was used to compare the difference between the day before (Be.) and the day after (Af.) rain. Second, we presented the data that changed dynamically over time and provided further interpretations based on the ANOVA results.
Next, we focused on the effects of the PET and NAI on physiological stress indicators (including S). By taking the PET and NAI as independent variables and θ, β-high/α, γ, stress, relaxation, HR, and S as dependent variables, a one-to-one correlation analysis (two-tailed test) was conducted.
Finally, comprehensive relationships were used to evaluate whether the vertical structures of forest walking spaces were conducive to physiological stress reduction.

3. Results

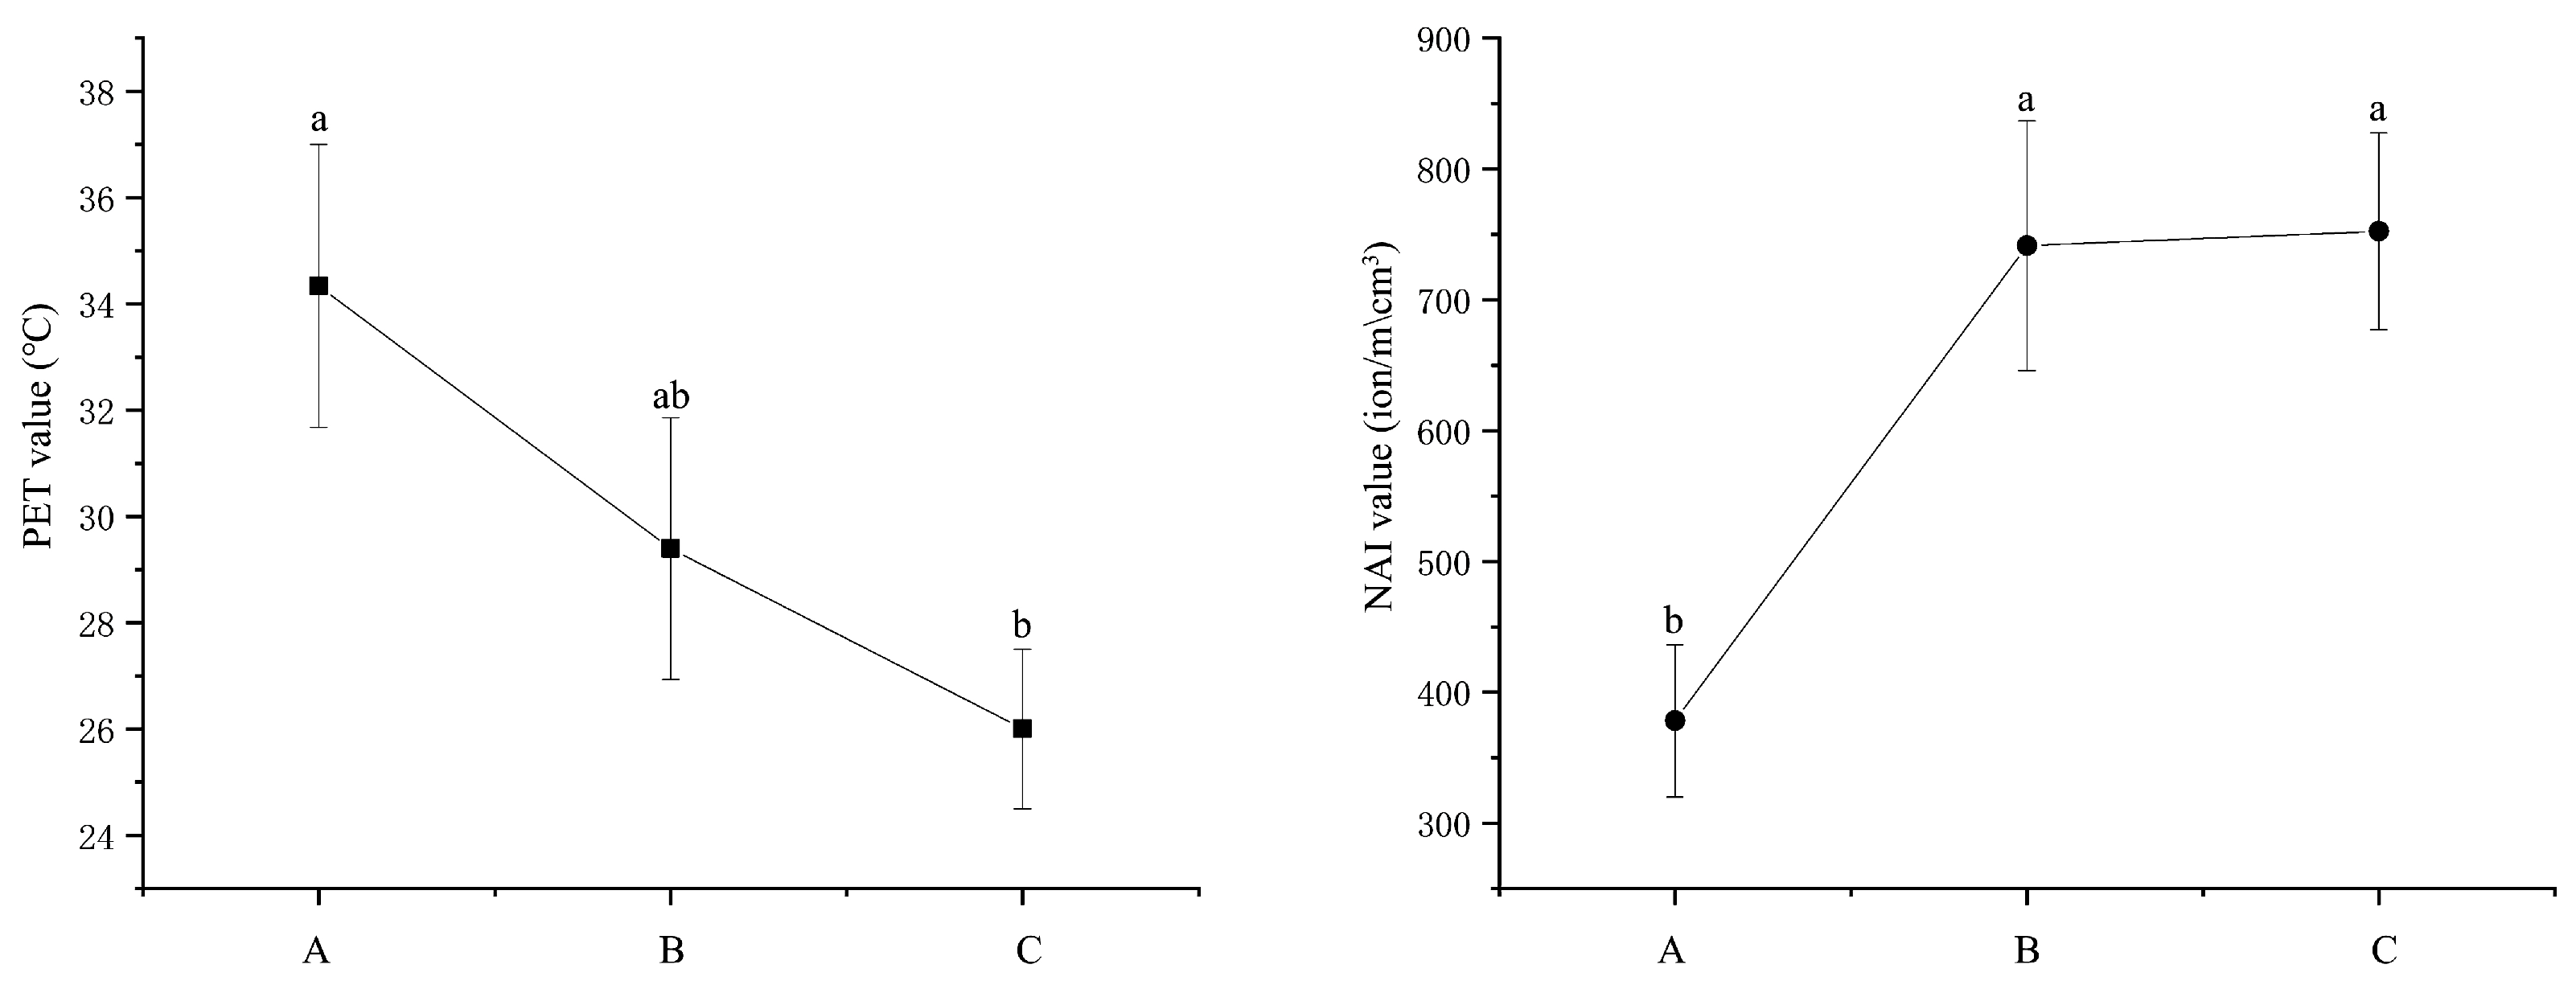
3.1. Differences in PET and NAI among Forest Walking Spaces with Three Vertical Structure Types

The ANOVA results could be divided into two parts. First, the measurement results obtained over two days were integrated to obtain the average PET and NAI values in each period to investigate the PET and NAI differences among the three forest types. The results showed significant differences in the PET (p = 0.002) and NAI (p = 0.042) among the three types. In further pairwise comparisons, the PET of subsection A was significantly higher than that of subsection C (p = 0.033). No significant difference in PET was found between subsections A and B or between subsections B and C. NAI in subsection B and subsection C were significantly higher than those in subsection A (p = 0.005 and p = 0.004, respectively). There was no significant difference in NAI between subsections B and C. The ANOVA results are presented in Figure 5, and the information is summarized in Table A2 of the Appendix A.
Second, we combined the measurements collected in the three segments each day to compare the differences in the PET and NAI between Be. and Af. The results showed that the PET of Be. was significantly higher than that of Af. (p < 0.001), while NAI in Be. were significantly lower than those in Af. (p < 0.001). The ANOVA results are presented in Figure 6, and the information is summarized in Table A3 of the Appendix A.
In addition, we analyzed the interaction effects of the two variables “type” and “rain or not”, and the results were not significant. The p values obtained for the PET and NAI data were 0.886 and 0.829, respectively.

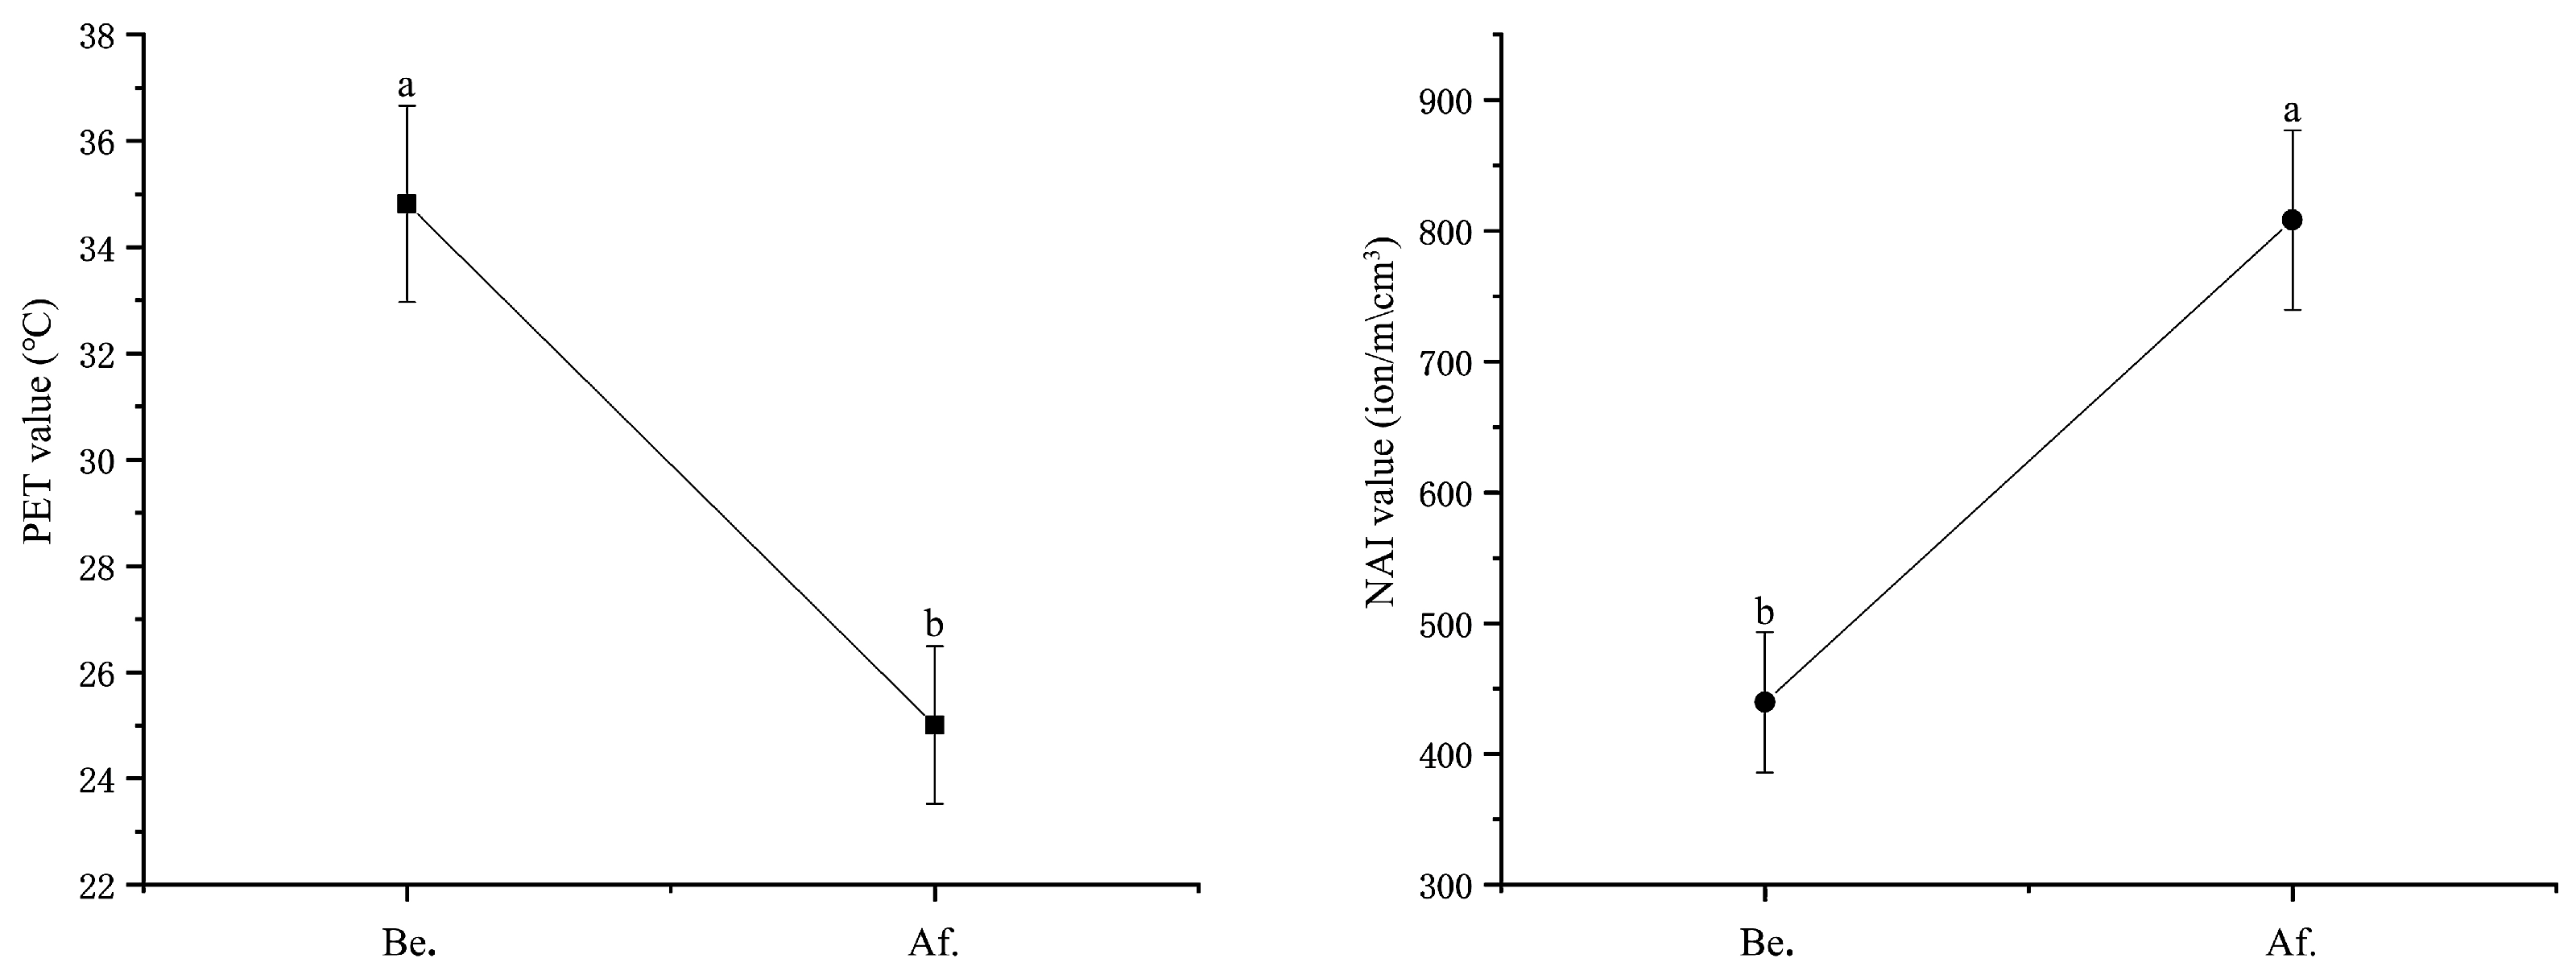
3.2. PET and NAI Values of Each Period

The data characterizing each period were further presented to facilitate a comprehensive discussion concerning the ANOVA results. Figure 7 shows the mean PET and NAI values obtained in each period. The results of the dynamic values and the ANOVA results were basically consistent. For both Be. and Af., the PET of subsection A was the highest, and its NAI was the lowest most of the time. Moreover, among the three forest types, the changes in the PET and NAI in subsection C were relatively stable, while subsections A and B showed sudden increases and decreases in the PET and NAI at certain points.
According to the comprehensive ANOVA results and the dynamic mean values obtained for each period, in the forest walking space on summer days, subsection A had the highest PET, subsection C had the lowest PET, and subsection B had a moderate PET. NAI in subsection A were the lowest, while NAI in subsections B and C were not substantially different and were both very high. According to the dynamic change results, the PET and NAI values obtained in subsection C were relatively stable. Overall, subsection C had the best comprehensive results, followed by subsection B, and subsection A had the worst comprehensive results. The vegetation in the spatial vertical forest structure of subsection C was not the most abundant; thus, this result does not support hypothesis 1.

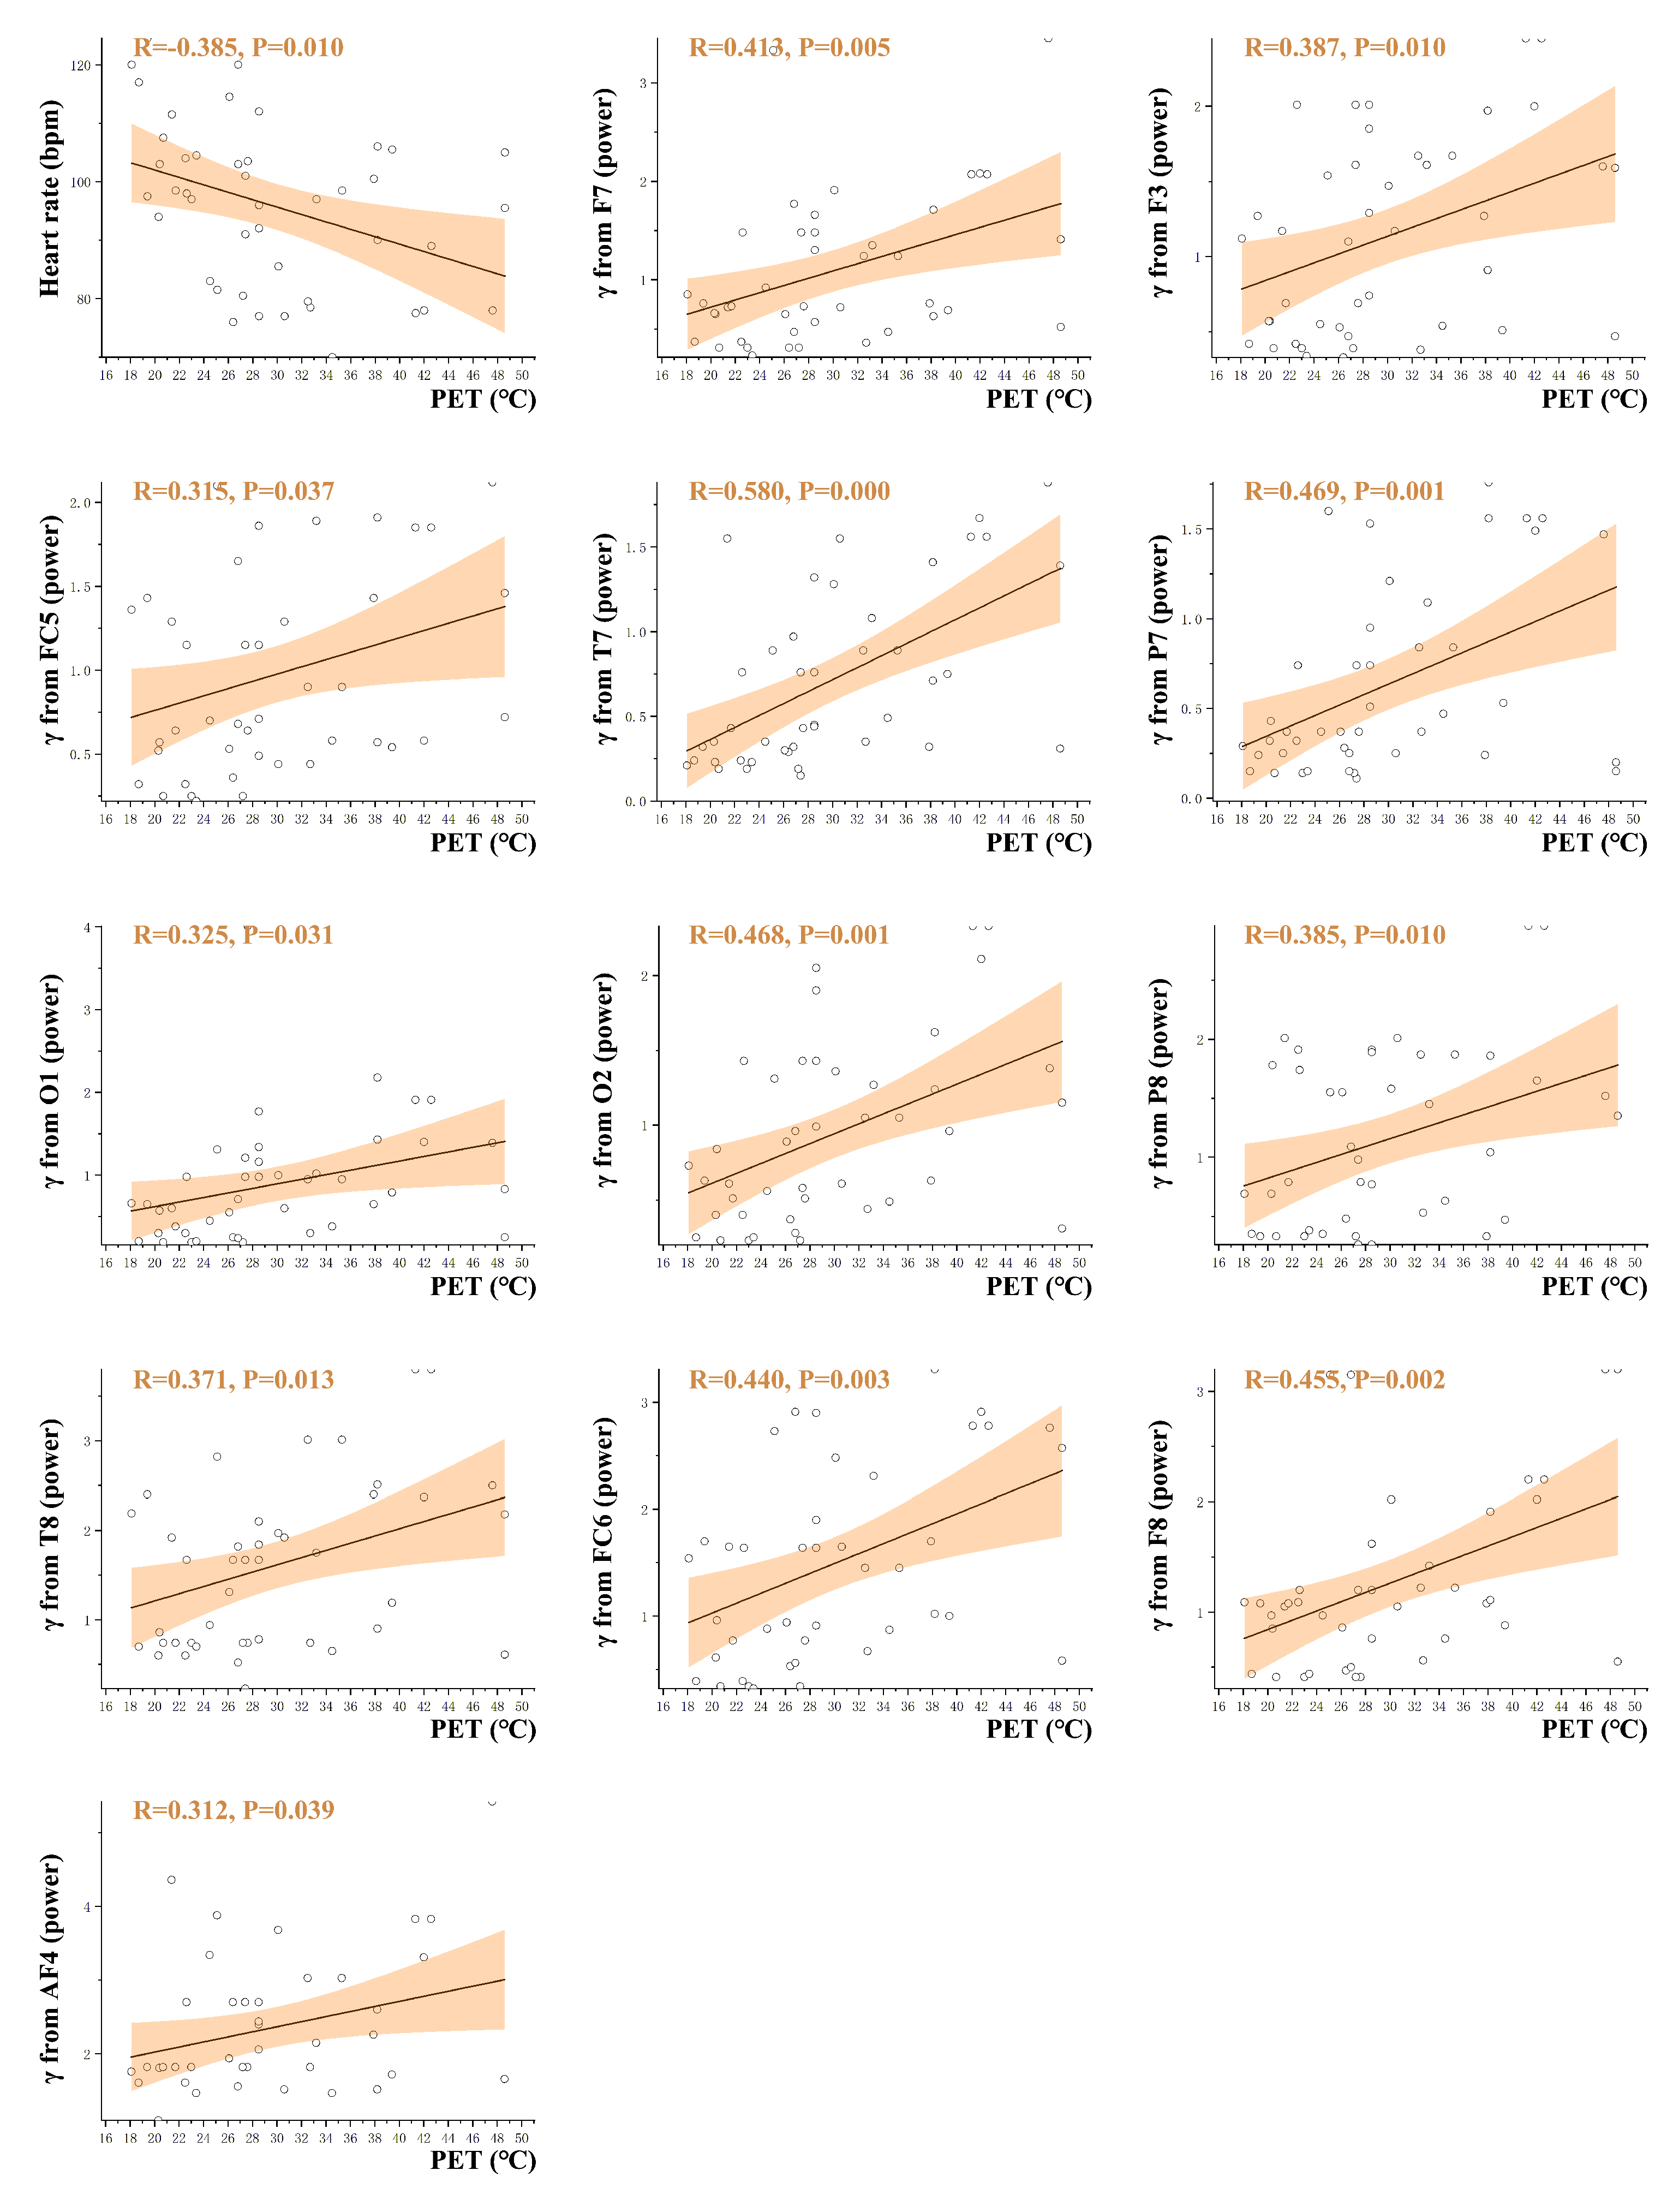
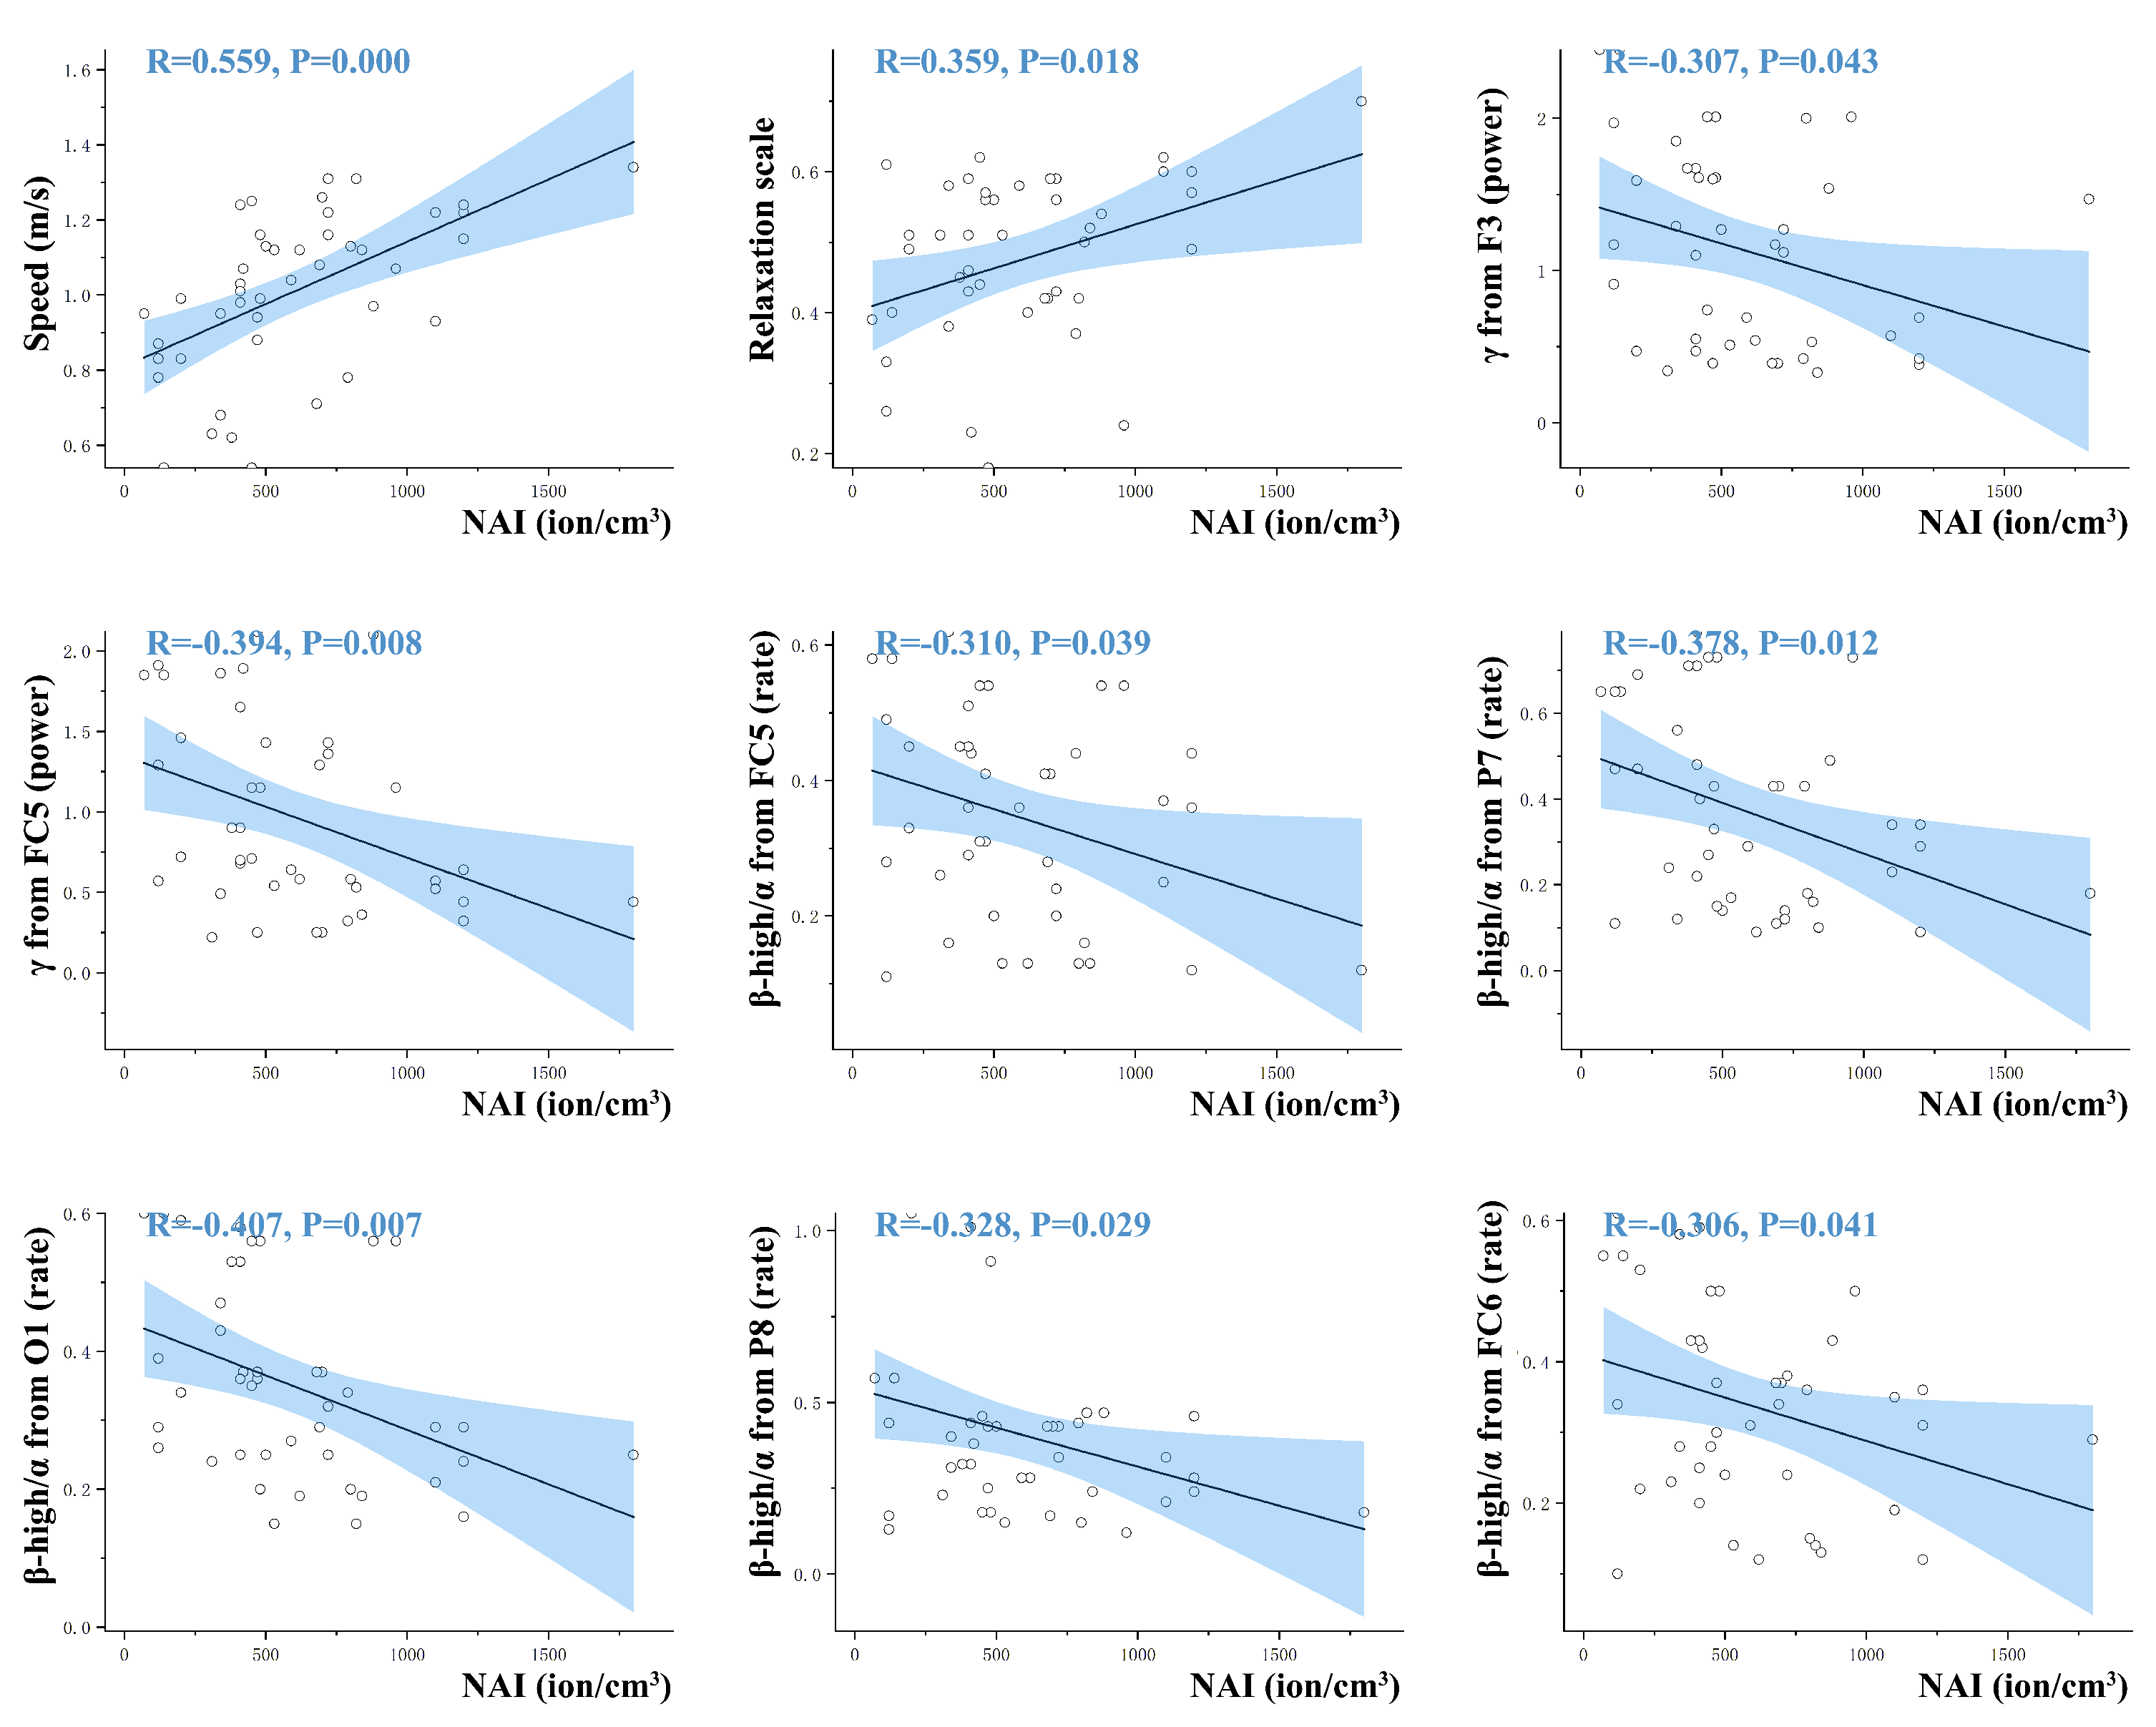
3.3. Correlations among PET, NAI and Physiological Stress Indicators

Through correlation analysis, we obtained a total of 22 groups with significant results. Significant correlations were found between the PET and HR and between the PET and γ. NAI were significantly correlated with S, relaxation, γ, and β-high/α. The term θ was not significantly correlated with NAI or the PET. The correlation coefficient (R) values of most of the results were at a low level (0.3~0.5), and those of a few results were at a medium level (0.5~0.8).
There was a significant positive correlation between the PET and γ (12 channels) and a significant negative correlation between the PET and HR (Figure 8). The PET is a comprehensive thermal comfort index that represents the comfort degree of forest walking thermal environments. The γ wave is a high-frequency brain wave, and an increase in this wave type indicates the expression of increased neuronal excitement. From a physiological relaxation point of view, γ reductions are beneficial. This result supports hypothesis 2: when PET is lower in forest walking environments, subjects experience less high-frequency γ brain wave activity, and the physiological excitation state of subjects is reduced, which is conducive to neural relaxation. Second, the relationship between the PET and HR must be considered. As shown in Figure 8, the lower the PET was, the higher the HR was in this study. Generally, a lower HR indicates a more relaxed physiological state. Therefore, this result does not support hypothesis 2.
NAI were positively correlated with S and relaxation and negatively correlated with γ and β-high/α (Figure 9). NAI are a component of air that is beneficial to human health. The results of this study showed that a higher NAI value was associated with lower brainwave γ activity, which was observed significantly in the two channels. In addition, five channels showed significant negative correlations between NAI and β-high/α. When the NAI value was higher, both EEG indicators were lower, which was conducive to physiological relaxation. These results support hypothesis 2.

4. Discussion

4.1. Effect of the Vertical Forest Structure on Thermal Comfort and NAI

4.1.1. Vertical Structure and the PET

A large number of previous studies have confirmed that tree canopies significantly affect radiation shielding and local environmental heat reduction [13,16,53]. This is consistent with the results of this study. The PET values obtained in subsections B and C, which had denser tree layers in the vertical structure, were lower than those obtained in subsection A. Larger tree canopies can more effectively block radiation in summer, thus inducing better thermal comfort conditions. When we continued to focus on the effects of the shrub and herb layers, we observed that subsection C had a lower PET than subsection B. Although this difference was not significant according to the ANOVA results, the difference in the mean PET was greater than 3 °C. Lin explored the regression relationship between a number of forest spatial structure indicators and PET values and found that the height and coverage of herbs and shrubs were positively correlated with the PET [18]. In his research on the relationship between urban tree canopies and thermal radiation, Wang also pointed out that the nighttime “radiative trapping effect” of the canopy increases the spatial temperature [53]. We believe that the PET in forests reflects the dual effects of energy absorption and energy loss. In this study, the dense shrub layer of subsection B was not conducive to heat losses, resulting in a higher average PET value of subsection B than that of subsection C. Subsection C benefited from a relatively sparse shrub layer.
Light rain at night was a secondary factor discussed in this study, and nighttime rain resulted in significant decreases in the PET values measured the day after rain. By further comparing the climate indicators measured on the two days, a significant difference was found to result from temperature (mean of Be. = 26.533, mean of Af. = 22.683, p < 0.001) and humidity (mean of Be. = 58.000, mean of Af. = 70.738, p < 0.001). Apparently, light summer rain affects the air temperature and humidity, resulting in lower PET values.

4.1.2. Vertical Structure and NAI

The spatiotemporal distribution of NAI contents established for urban forests in China shows that the NAI values in summer are the highest during the year, and in areas with urban forests, NAI are not significantly affected by urbanization [54]. This supports the selection of summertime for this study. Kim used the forest environment on a campus as the object to conduct an analysis of the NAI difference induced by spatial environmental structures. The results showed the following ranking: single-layer structure (934 ion/cm3) > multi-layer structure (794 ion/cm3) > grass (553 ion/cm3) > bare land (529 ion/cm3) [17]. These results reflect that the vertical structure level was too singular and that the lack of a tree layer led to low NAI values. This is consistent with the results of our study, in which the lowest NAI value was found for subsection A. However, all layers of subsection B were very dense (regarded as a multi-layer structure), and the average difference between subsections B and C (regarded as a single-layer structure) was only approximately 10 ion/cm3. Therefore, we cannot conclude that the NAI of a single-layer structure is superior to that of a multi-layer structure.
In addition, many studies on the relationship between forest climate conditions and NAI have also mentioned the relationships of NAI with Ta, RH, and v [54,55,56,57]. RH is of primary importance and is believed to be positively correlated with NAI. The next most important metrics are Ta and v, which are thought to be negatively correlated with NAI. In our study, no significant differences in Ta, RH, or v were found in comparing microclimate indicators among the three forest types. We speculate that at the microscale level, the three vertical structure types analyzed in this study were not sufficient to change the relatively constant Ta and RH in the air. However, significant differences in the Ts (mean of A = 39.050, mean of B = 30.619, mean of C = 24.031, p < 0.001) and G (mean of A = 400.375, mean of B = 207.631, mean of C = 99.149, p < 0.001) indicators were found, which were obviously due to the different vertical structures of the subsections. Correlation analysis between NAI and five microclimate indicators showed that NAI were significantly correlated with Ta (R = −0.373, p = 0.009) and Ts (R = −0.436, p = 0.002). In addition, v and G showed negative correlations with NAI, and RH showed a positive but nonsignificant correlation.
Based on these results together, we believe that the vertical structure of the forest considered in this study primarily affected the amount of vegetation, thus laying the foundation for the observed differences in the ability of the forest subsections to release NAI. Second, the vertical structures of forests further cause significant differences between G and Ts and mainly spatially affect the NAI content by modifying Ts. In addition, the higher NAI values recorded after rainfall can be interpreted as resulting from the significant decrease in Ta and the significant increase in RH.

4.1.3. Dynamic Changes in the PET and NAI

The data recorded in each time period were used as a supplement to analyze the temporal differences. In terms of the changes in PET values, among the three forest types on the first experimental day, subsection A lacked tree cover; therefore, it absorbed heat quickly in the morning, but the PET dropped slowly in the afternoon. Subsections B and C were sheltered by trees, and the PET values in these subsections were low and increased slowly before noon. Generally, solar radiation decreases after 12:00, leading to a decrease in energy absorption in space and an increase in energy loss. Therefore, the PET values of subsections A and C began to decrease after noon. The vertical structure of the vegetation in subsection B was the densest, and heat was continuously “captured” in this subsection; thus, the PET increased instead of decreasing. Overnight rainfall caused a lower PET starting point in all three spaces, which remained consistent until noon. When the “rain effect” disappeared, subsection A, without a tree layer, rapidly absorbed external radiation, and the PET thus increased rapidly. In general, light nighttime rain changed the daytime climatic conditions within a short period of time, to some extent delaying the PET differences caused by the different spatial vertical structures of the studied subsections.
In the derived changes in NAI values, the trends of the three forest types on the first day (Be.) were basically the same. The NAI level was highest before noon and then gradually decreased, which was related to the gradually increasing temperatures and gradually decreasing humidity at noon. In Wang’s study, data were collected at 1-h intervals, and the researchers found that the diurnal variations in NAI in the studied forest generally presented a U-shaped distribution; that is, NAI was high in the morning, decreased at noon, and gradually increased in the evening, peaking from 7:00 to 11:00 [57]. The results of our experimental period were consistent with those reported in previous studies. However, light overnight rain produced better air humidity conditions the next day. The starting points of the NAI values in all three studied forest spaces were high, and the U-shaped distribution disappeared. Compared to the first day, we found that the NAI in subsection B increased faster in the afternoon, which may have also been due to the dense vertical structure that maintained a higher air humidity level.

4.2. Responses of Physiological Stress Indicators to Thermal Comfort and NAI

4.2.1. PET and EEG

Choi’s study verified that higher temperatures produced more stress in subjects according to brain wave β, and this result is consistent with the conclusions of this study [41]. In Son’s study, by analyzing the thermal pleasure obtained from a room with high thermal stress (temperature = 32 °C, relative humidity = 65%) relative to that from a room with low thermal stress (temperature = 25 °C, relative humidity = 50%), it was found that the low-frequency brainwave θ increased significantly, while the high-frequency brainwave β decreased significantly [38]. Jieun’s study on thermal pleasure yielded similar results [58]. Although no significant relationship between the PET and θ was observed in the results of this study, the implications of this study are consistent with those of previous studies, namely, lower PET values in summer lead to thermal pleasure, as represented by an increase in low-frequency brainwaves (representing greater relaxation). In addition, this study verified this phenomenon in forest walking spaces. However, not all studies on thermal comfort and EEG are similar, and some previous studies have reported opposite results. Zhu’s study was set at 70% relative humidity, and a temperature increase resulted in an increase in brain wave δ (0.1–3 Hz) and decreases in θ, α, and β. No δ data were output from the device used in this study, and δ decreases are associated with deep sleep [59]. Therefore, we hypothesize that the opposite results of Zhu’s study may have been caused by climatic conditions, such as the high relative humidity in the study.

4.2.2. PET and HR

Tian defined four experimental temperature groups (26 °C, 30 °C, 33 °C, and 37 °C) [60]. Subjects in these four groups walked on a treadmill at a speed of 4 km/h for 85 min. Tian found that subjects were more fatigued and had higher HRs after walking for 85 min in hotter conditions. Compared with Tian’s study, our study had a shorter duration and walking distance and was located in a natural outdoor forest. Therefore, we speculate that the reason for the different results is that the short-term walking analyzed in this study did not cause excessive fatigue, and the whole forest-walking process was a pleasant, light exercise. In Horiuchi’s study, the relationship between environmental thermal comfort and S was expounded [48]. Speed indicators may be relevant to the results of this study. We observed a negative correlation between the PET and S in this study, although this negative correlation was not significant (R = −0.210, p = 0.171). Based on this finding, we speculated that during the short forest walk, the lower the PET was, the higher the subjects’ S values were, and thus, the higher their HRs were (HR is positively correlated with exercise intensity). More importantly, the normal heart rate range is generally considered to be between 60 bmp and 100 bmp at rest and below 120 bmp during light exercise. The HRs of the subjects were always within the normal range of slight movement in this study (Figure 4).

4.2.3. NAI and EEG

In an earlier study, the frequency of α dropped from 10 Hz to 9 Hz and, in rare cases, dropped to 8 Hz after subjects were exposed to NAI for 10 min [44]. Assael interpreted this as a sign of overall relaxation caused by NAI. He reported that all workers exposed to NAI also experienced beneficial relaxation. These findings are consistent with the results of our study. However, when Hagiwara studied the relationship between the physiological states of athletes and NAI during high-intensity exercise; he found that the higher the NAI were, the higher the β was, and the stronger the arousal degree was [43]. His research took place indoors, and although the research methods differed from those used to obtain results in this study, we speculate that his results were related to the exercise type, intensity, and environment. At the same time, we believe that the results of this study provide theoretical value for the light exercise of forest walking.
At the same time, the NAI was significantly positively correlated with S and relaxation in this study. This means that in forest walking activities, the more NAI that are present, the faster S is, and the better the physiological relaxation is.

4.2.4. Consistency of Responses

In general, both the PET and NAI values derived in forest walking spaces impacted physiological stress indicators during forest walking. In addition, their influence on EEG and HR was consistent. S, as an auxiliary indicator in the analysis, plays a certain role in explaining the change trends of the main physiological indicators. The correlation supports hypothesis 2 of this study: a higher NAI and lower PET are beneficial for reducing physiological stress in humans during summer daytime forest walking. It must be pointed out that while these results were consistent, their correlation coefficient (R) values were basically at medium or low values and generally indicated moderate or weak correlations (Figure 8 and Figure 9). We think that this result is related to the linear relationships between the individual factors discussed in this study. Forest walking may have a more diversified relationship with various factors, such as the composite mechanism of visual, auditory, and thermal perception factors, and these relationships need to be further explored.

4.3. Application

By revealing the comprehensive relationships among the three analyzed aspects, this study proposed possible theoretical support for the construction, management, and recreation of forest walking spaces. In general, if forest walking spaces have a dense tree layer and sparse shrub layer in summer, relatively more favorable thermal comfort and air anion conditions can be formed to relieve the pressure on human physiology. Moreover, the role of dense tree layers is central. On the other hand, the collocation of spatiotemporal relationships is also particularly important. Based on the results of this study, it is recommended that summer forest walks be conducted before noon and that, to the greatest extent possible, forest spaces should be chosen to provide pleasant climate and air conditions as long as possible. In addition, at the same time of day, lower thermal comfort conditions and higher NAI tend to form after rain. With the above theoretical results, better forest ecological service functions and health benefits can be achieved.

4.4. Limitations

There were a number of limitations to this study. (1) The vertical structures of the forest walking spaces discussed in this study were limited to the three forest forms on the existing footpath, and more forms were not studied. More detailed vertical indicators, such as plant and branch heights, need further discussion. (2) The amount of valid physiological indicator data was reduced compared with the original plan due to interference from outdoor research. The stability of the utilized instruments and the rigor of the experimental process need to be improved to obtain better anti-interference measures. (3) Some response relationships of the physiological indicators observed in this study differ from the results of previous long-term studies, which may be due to physiological cumulative effects over time or the interaction of physiological indicators. The cumulative effects and the relationship between physiological indexes need further study. (4) This study only discussed the correlation between individual factors, but more factors may affect human physiological indicators in forest walking spaces. Therefore, by studying multiple factors and establishing regression models, it will be more beneficial to study the systematic influence path of forest walking spaces. (5) Since this study arranged for each subject to receive three groups of PET and NAI stimulation, the physiological data of each group were not completely from different subjects. More consideration should be given to data independence in the future. In addition, if the physiological indicators in the three forest sections could be compared horizontally (such as with GLM with repeated measures), the results would be more supportive to the conclusion of the whole study. However, as the experimental design did not meet the conditions of this analysis and some physiological data were missing, only correlation analysis was carried out in this study.

5. Conclusions

The objective of this study was to explore the comprehensive relationships between the spatial structures of forests used for forest walking and the effects of forest structures on microclimatic and air conditions, and hence, on physiological responses. The comprehensive relationship includes two aspects. One aspect involves the vertical structure–thermal comfort and NAI. The results of our study showed that forest subsection A had the highest average PET (sparse tree layer, dense shrub, and herb layers), subsection C had the lowest PET (dense tree layer, sparse shrub layer, and dense herb layer), and subsection B had a moderate PET (all three layers were dense). Subsection A had the lowest average NAI, while subsections B and C had high NAI with little difference. We believe that the tree layer density is the core factor for obtaining lower PET and higher NAI values. A relatively sparse shrub layer is more conducive to PET reductions in the afternoon. Rainfall also weakens and delays the thermal comfort and NAI differences caused by the spatial structures of forests. The other aspect involves thermal comfort and NAI–physiological stress. We obtained the following results. PET was negatively correlated with HR and positively correlated with the brainwave γ of 12 channels. There was a significant positive correlation between NAI and S and a significant positive correlation between NAI and relaxation. There was also a significant negative correlation between NAI and the γ of two channels and a significant negative correlation between NAI and the β-high/α of five channels. These results were consistent across all correlations and support our hypothesis that lower PET values (thermal comfort conditions) and higher NAI values lead to lower physiological stress states in humans.
The above comprehensive relationships form the overall theoretical results; that is, in forest walking spaces in summer, a dense tree layer, sparse shrub layer, and high-coverage herb layer can form a thermal comfort and air anion environment that is more conducive to relieving human physiological pressure. In addition, attention should be given to the advantageous period of the day (before noon or after rain) to ensure a good spatiotemporal collocation effect.

Author Contributions

Conceptualization, W.L. and C.Z.; methodology, W.L.; software, W.L. and W.N.; formal analysis, C.Z., X.N., and S.S.; investigation, W.L., C.Z. and Y.S.; resources, Z.B.; data curation, W.L. and H.Y.; writing—original draft preparation, W.L.; writing—review and editing, W.L. and C.Z.; visualization, F.Y. and R.W.; supervision, Z.B.; project administration, Z.B.; funding acquisition, W.L., C.Z. and Z.B. All authors have read and agreed to the published version of the manuscript.

Funding

This research was funded by the Talent Initiation Program of the Scientific Research Development Fund of Zhejiang A&F University, grant number 2021LFR041.

Institutional Review Board Statement

Ethical review and approval were waived for this study due to REASON (This is not a medical clinical study. No human tissues or organs were studied, and no blood was collected or tested. The study used only non-invasive instruments to measure basic human data, including blood pressure and brain waves. All the instruments has been proved to be harmless to human body.)

Informed Consent Statement

Informed consent was obtained from all subjects involved in the study. Written informed consent has been obtained from the subject(s) to publish this paper.

Conflicts of Interest

The authors declare no conflict of interest.

Appendix A

Table A1. The climate indicator, PET, and NAI values obtained for each subsection.
Day and TimeSubsectionTa
(°C)
RH
(%)
v
(m/s)
Ts
(°C)
G
(W/m2)
PET
(°C)
NAI
(ion/cm3)
Be.
10:30~
11:00
A25.659.70.832.580039.4530
B26.160.6025.810026.1820
C24.966.50.619.43520.41100
11:00~
11:30
A26.958.60.244.580047.6470
B26.163.3023.88225.1880
C23.866.3022.65622.5890
11:30~
12:00
A28.957.3043.166048.6200
B25.556.80.226.618026.8410
C24.3590.823.87121420
12:00~
12:30
A27.95804940342.670
B29.255.2040.621035.3410
C27.653.6026.511027.4480
12:30~
13:00
A304905030541.3140
B26.95103225032.5380
C26.3590.62628028.5450
13:00~
13:30
A28.750.9046.526038.2120
B26.55703822033.2420
C25.9550.231.319028.5340
13:30~
14:00
A27.458.30.441.521532150
B26.65603442037.9500
C25.759029.58326.3370
14:00~
14:30
A25.859035.716630.6120
B25.557.6029.412027.2470
C24.765.3025.67624.5410
Af.
10:30~
11:00
A19.585024.88321.4690
B19.784.3020.55419.4720
C19.684.6018.53118.1720
11:00~
11:30
A20.286.7025.812523.4310
B19.981.9021.980.620.7680
C2081.8019.23818.7790
11:30~
12:00
A20.284025.115924.2370
B19.880022.611021.7590
C20.581.6020.16820.31100
12:00~
12:30
A23.375.60.23740033.4350
B22.670.9029.818527.61200
C22.968.4022.17822.51200
12:30~
13:00
A25.260.2034.828033.3480
B24.468.2027.812.523700
C22.566.5023.57922.6960
13:00~
13:30
A23.261.5038.233034.5620
B22.865.5034.531032.71200
C22.764.60.430.525826.4840
13:30~
14:00
A26.556.2039.851042800
B26.262.1031.617830.11800
C23.955023.576.823.21100
14:00~
14:30
A28.257056.591059630
B26.861.905181053.9680
C23.854.20.622.456.520.2870
Note: A, B and C indicate Subsection A, Subsection B and Subsection C, respectively. Be. indicates “the day before the rain”, and Af. indicates “the day after the rain”.
Table A2. ANOVA results for the PET and NAI across three forest structure types.
IndicatorSubsectionNMSDFSig.Pairwise Comparison
PETA1634.33810.6523.4170.042 *A > C *
B1629.3949.858
C1626.0075.993
NAIA16378.125232.8447.4960.002 **A < B **
A < C **
B16741.250381.643
C16752.500300.943
Note: * p < 0.05, ** p < 0.01. A, B and C indicate Subsection A, Subsection B and Subsection C, respectively.
Table A3. ANOVA results for the PET and NAI across two days.
IndicatorDayNMSDFSig.Pairwise Comparison
PETBe.2434.8179.06117.0990.000 *Be. > Af. **
Af.2425.0097.275
NAIBe.24439.583262.65317.9730.000 **Be. < Af. **
Af.24808.333335.542
Note: * p < 0.05, ** p < 0.01. Be. indicates “the day before the rain”, and Af. indicates “the day after the rain”.

References

  1. Stigsdotter, U.K.; Ekholm, O.; Schipperijn, J.; Toftager, M.; Kamper-Jørgensen, F.; Randrup, T.B. Health promoting outdoor environments—Associations between green space, and health, health-related quality of life and stress based on a Danish national representative survey. Scand. J. Public Health 2010, 38, 411–417. [Google Scholar] [CrossRef] [PubMed]
  2. Wallner, P.; Kundi, M.; Arnberger, A.; Eder, R.; Allex, B.; Weitensfelder, L.; Hutter, H.-P. Reloading Pupils’ Batteries: Impact of Green Spaces on Cognition and Wellbeing. Int. J. Environ. Res. Public Health 2018, 15, 1205. [Google Scholar] [CrossRef] [Green Version]
  3. Chang, C.-Y.; Hammitt, W.E.; Chen, P.-K.; Machnik, L.; Su, W.-C. Psychophysiological responses and restorative values of natural environments in Taiwan. Landsc. Urban Plan. 2008, 85, 79–84. [Google Scholar] [CrossRef]
  4. Park, B.-J.; Tsunetsugu, Y.; Kasetani, T.; Morikawa, T.; Kagawa, T.; Miyazaki, Y. Physiological effects of forest recreation in a young conifer forest in Hinokage Town, Japan. Silva Fenn. 2009, 43, 291–301. [Google Scholar] [CrossRef] [Green Version]
  5. Yu, Y.-M.; Lee, Y.-J.; Kim, J.-Y.; Yoon, S.-B.; Shin, C.-S. Effects of forest therapy camp on quality of life and stress in postmenopausal women. For. Sci. Technol. 2016, 12, 125–129. [Google Scholar] [CrossRef]
  6. Song, C.; Ikei, H.; Miyazaki, Y. Sustained effects of a forest therapy program on the blood pressure of office workers. Urban For. Urban Green. 2017, 27, 246–252. [Google Scholar] [CrossRef]
  7. Chiang, Y.-C.; Li, D.; Jane, H.-A. Wild or tended nature? The effects of landscape location and vegetation density on physiological and psychological responses. Landsc. Urban Plan. 2017, 167, 72–83. [Google Scholar] [CrossRef]
  8. Song, C.; Ikei, H.; Kobayashi, M.; Miura, T.; Li, Q.; Kagawa, T.; Kumeda, S.; Imai, M.; Miyazaki, Y. Effects of viewing forest landscape on middle-aged hypertensive men. Urban For. Urban Green. 2017, 21, 247–252. [Google Scholar] [CrossRef]
  9. Sanusi, R.; Johnstone, D.; May, P.; Livesley, S. Microclimate benefits that different street tree species provide to sidewalk pedestrians relate to differences in Plant Area Index. Landsc. Urban Plan. 2017, 157, 502–511. [Google Scholar] [CrossRef]
  10. de Abreu-Harbich, L.V.; Labaki, L.C.; Matzarakis, A. Effect of tree planting design and tree species on human thermal comfort in the tropics. Landsc. Urban Plan. 2015, 138, 99–109. [Google Scholar] [CrossRef]
  11. Zheng, S.; Guldmann, J.-M.; Liu, Z.; Zhao, L. Influence of trees on the outdoor thermal environment in subtropical areas: An experimental study in Guangzhou, China. Sustain. Cities Soc. 2018, 42, 482–497. [Google Scholar] [CrossRef]
  12. Chow, W.T.; Akbar, S.N.A.B.A.; Heng, S.L.; Roth, M. Assessment of measured and perceived microclimates within a tropical urban forest. Urban For. Urban Green. 2016, 16, 62–75. [Google Scholar] [CrossRef] [Green Version]
  13. Kong, L.; Lau, K.K.-L.; Yuan, C.; Chen, Y.; Xu, Y.; Ren, C.; Ng, E.Y.Y. Regulation of outdoor thermal comfort by trees in Hong Kong. Sustain. Cities Soc. 2017, 31, 12–25. [Google Scholar] [CrossRef]
  14. Wang, Y.; Ni, Z.; Peng, Y.; Xia, B. Local variation of outdoor thermal comfort in different urban green spaces in Guangzhou, a subtropical city in South China. Urban For. Urban Green. 2018, 32, 99–112. [Google Scholar] [CrossRef]
  15. Ketterer, C.; Matzarakis, A. Human-biometeorological assessment of heat stress reduction by replanning measures in Stuttgart, Germany. Landsc. Urban Plan. 2014, 122, 78–88. [Google Scholar] [CrossRef]
  16. Chen, J.; Jin, S.; Du, P. Roles of horizontal and vertical tree canopy structure in mitigating daytime and nighttime urban heat island effects. Int. J. Appl. Earth Obs. Geoinf. 2020, 89, 102060. [Google Scholar] [CrossRef]
  17. Kim, J.-H.; Oh, D.-K.; Park, Y.-G.; Yoon, Y.-H. A Comparative Analysis of Negative Air Ions according to the Planting Structure at School Forests. J. Korean Inst. Landsc. Arch. 2015, 43, 55–64. [Google Scholar] [CrossRef] [Green Version]
  18. Lin, W.; Zeng, C.; Lam, N.S.-N.; Liu, Z.; Tao, J.; Zhang, X.; Lyu, B.; Li, N.; Li, D.; Chen, Q. Study of the relationship between the spatial structure and thermal comfort of a pure forest with four distinct seasons at the microscale level. Urban For. Urban Green. 2021, 62, 127168. [Google Scholar] [CrossRef]
  19. Sodoudi, S.; Zhang, H.; Chi, X.; Müller, F.; Li, H. The influence of spatial configuration of green areas on microclimate and thermal comfort. Urban For. Urban Green. 2018, 34, 85–96. [Google Scholar] [CrossRef]
  20. ASHRAE. Thermal comfort conditions. In ASHRAE Standards; ASHRAE: New York, NY, USA, 1966; pp. 55–66. [Google Scholar]
  21. Fanger, P.O. Thermal Comfort; McGraw-Hill: New York, NY, USA, 1972. [Google Scholar]
  22. Parsons, K. Human Thermal Environments: The Effects of Hot, Moderate and Cold Environments on Human Health, Comfort and Performance; Taylor and Francis: New York, NY, USA, 2003. [Google Scholar]
  23. Kántor, N.; Unger, J. Benefits and opportunities of adopting GIS in thermal comfort studies in resting places: An urban park as an example. Landsc. Urban Plan. 2010, 98, 36–46. [Google Scholar] [CrossRef]
  24. Lai, D.; Guo, D.; Hou, Y.; Lin, C.; Chen, Q. Studies of outdoor thermal comfort in northern China. Build. Environ. 2014, 77, 110–118. [Google Scholar] [CrossRef]
  25. Lin, T.-P.; de Dear, R.; Hwang, R.-L. Effect of thermal adaptation on seasonal outdoor thermal comfort. Int. J. Clim. 2011, 31, 302–312. [Google Scholar] [CrossRef]
  26. Lin, T.-P.; Tsai, K.-T.; Hwang, R.-L.; Matzarakis, A. Quantification of the effect of thermal indices and sky view factor on park attendance. Landsc. Urban Plan. 2012, 107, 137–146. [Google Scholar] [CrossRef]
  27. Klemm, W.; Heusinkveld, B.G.; Lenzholzer, S.; Jacobs, M.H.; Van Hove, B. Psychological and physical impact of urban green spaces on outdoor thermal comfort during summertime in The Netherlands. Build. Environ. 2015, 83, 120–128. [Google Scholar] [CrossRef]
  28. Li, K.; Liu, X.; Zhou, J. Impact of environmental characteristics in urban green spaces on outdoor thermal environment: A case study of Wuhan City, China. Indoor Built Environ. 2019, 28, 1217–1236. [Google Scholar] [CrossRef]
  29. Sun, S.; Xu, X.; Lao, Z.; Liu, W.; Li, Z.; Garcia, E.H.; He, L.; Zhu, J. Evaluating the impact of urban green space and landscape design parameters on thermal comfort in hot summer by numerical simulation. Build. Environ. 2017, 123, 277–288. [Google Scholar] [CrossRef]
  30. Höppe, P. The physiological equivalent temperature–a universal index for the biometeorological assessment of the thermal environment. Int. J. Biometeorol. 1999, 43, 71–75. [Google Scholar] [CrossRef]
  31. Matzarakis, A.; Mayer, H.; Iziomon, M. Applications of a universal thermal index: Physiological equivalent temperature. Int. J. Biometeorol. 1999, 43, 76–84. [Google Scholar] [CrossRef]
  32. Matzarakis, A.; Rutz, F.; Mayer, H. Modelling radiation fluxes in simple and complex environments—Application of the RayMan model. Int. J. Biometeorol. 2007, 51, 323–334. [Google Scholar] [CrossRef]
  33. Zhu, S.-X.; Hu, F.-F.; He, S.-Y.; Qiu, Q.; Su, Y.; He, Q.; Li, J.-Y. Comprehensive Evaluation of Healthcare Benefits of Different Forest Types: A Case Study in Shimen National Forest Park, China. Forests 2021, 12, 207. [Google Scholar] [CrossRef]
  34. Duan, W.; Wang, C.; Pei, N.; Zhang, C.; Gu, L.; Jiang, S.; Hao, Z.; Xu, X. Urban forests increase spontaneous activity and improve emotional state of white mice. Urban For. Urban Green. 2019, 46, 126449. [Google Scholar] [CrossRef]
  35. Liu, X.; Yu, X.; Zhang, Z. PM2.5 Concentration Differences between Various Forest Types and Its Correlation with Forest Structure. Atmosphere 2015, 6, 1801–1815. [Google Scholar] [CrossRef] [Green Version]
  36. Bai, K.; Li, K.; Chang, N.-B.; Gao, W. Advancing the prediction accuracy of satellite-based PM2.5 concentration mapping: A perspective of data mining through in situ PM2.5 measurements. Environ. Pollut. 2019, 254, 113047. [Google Scholar] [CrossRef] [PubMed]
  37. Wu, M.; Li, H.; Qi, H. Using electroencephalogram to continuously discriminate feelings of personal thermal comfort between uncomfortably hot and comfortable environments. Indoor Air 2020, 30, 534–543. [Google Scholar] [CrossRef]
  38. Son, Y.J.; Chun, C. Research on electroencephalogram to measure thermal pleasure in thermal alliesthesia in temperature step-change environment. Indoor Air 2018, 28, 916–923. [Google Scholar] [CrossRef]
  39. Kim, H.; Hong, T.; Kim, J.; Yeom, S. A psychophysiological effect of indoor thermal condition on college students’ learning performance through EEG measurement. Build. Environ. 2020, 184, 107223. [Google Scholar] [CrossRef]
  40. Kim, M.; Chong, S.C.; Chun, C.; Choi, Y. Effect of thermal sensation on emotional responses as measured through brain waves. Build. Environ. 2017, 118, 32–39. [Google Scholar] [CrossRef]
  41. Choi, Y.; Kim, M.; Chun, C. Measurement of occupants’ stress based on electroencephalograms (EEG) in twelve combined environments. Build. Environ. 2015, 88, 65–72. [Google Scholar] [CrossRef]
  42. Ko, W.H.; Schiavon, S.; Zhang, H.; Graham, L.T.; Brager, G.; Mauss, I.; Lin, Y.-W. The impact of a view from a window on thermal comfort, emotion, and cognitive performance. Build. Environ. 2020, 175, 106779. [Google Scholar] [CrossRef] [Green Version]
  43. Hagiwara, G.; Mankyu, H.; Tsunokawa, T.; Matsumoto, M.; Funamori, H. Effectiveness of Positive and Negative Ions for Elite Japanese Swimmers’ Physical Training: Subjective and Biological Emotional Evaluations. Appl. Sci. 2020, 10, 4198. [Google Scholar] [CrossRef]
  44. Assael, M.; Pfeifer, Y.; Sulman, F.G. Influence of artificial air ionisation on the human electroencephalogram. Int. J. Biometeorol. 1974, 18, 306–312. [Google Scholar] [CrossRef] [PubMed]
  45. Ulrich, R.S.; Simons, R.F.; Losito, B.D.; Fiorito, E.; Miles, M.A.; Zelson, M. Stress recovery during exposure to natural and urban environments. J. Environ. Psychol. 1991, 11, 201–230. [Google Scholar] [CrossRef]
  46. Neale, C.; Aspinall, P.; Roe, J.; Tilley, S.; Mavros, P.; Cinderby, S.; Coyne, R.; Thin, N.; Bennett, G.; Thompson, C.W. The Aging Urban Brain: Analyzing Outdoor Physical Activity Using the Emotiv Affectiv Suite in Older People. J. Hered. 2017, 94, 869–880. [Google Scholar] [CrossRef] [Green Version]
  47. Aspinall, P.; Mavros, P.; Coyne, R.; Roe, J. The urban brain: Analysing outdoor physical activity with mobile EEG. Br. J. Sports Med. 2015, 49, 272–276. [Google Scholar] [CrossRef] [Green Version]
  48. Horiuchi, M.; Handa, Y.; Fukuoka, Y. Impact of ambient temperature on energy cost and economical speed during level walking in healthy young males. Biol. Open 2018, 7, bio035121. [Google Scholar] [CrossRef] [PubMed] [Green Version]
  49. Szot, T.; Specht, C.; Dabrowski, P.S.; Specht, M. Comparative analysis of positioning accuracy of Garmin Forerunner wearable GNSS receivers in dynamic testing. Measurement 2021, 183, 109846. [Google Scholar] [CrossRef]
  50. Elsoragaby, S.; Yahya, A.; Nawi, N.M.; Mahadi, M.R.; Mairghany, M.; Muazu, A.; Shukery, M.F. Comparison between conventional human energy measurement and physical human energy measurement methods in wetland rice production. Heliyon 2020, 6, e05332. [Google Scholar] [CrossRef]
  51. Hsu, B.-W.; Wang, M.-J.J. Evaluating the Effectiveness of Using Electroencephalogram Power Indices to Measure Visual Fatigue. Percept. Mot. Ski. 2013, 116, 235–252. [Google Scholar] [CrossRef]
  52. Kim, J.-Y.; Kim, J.-T.; Kim, W. Psycho-physiological responses of drivers to road section types and elapsed driving time on a freeway. Can. J. Civ. Eng. 2015, 42, 881–888. [Google Scholar] [CrossRef] [Green Version]
  53. Wang, C.; Wang, Z.-H.; Ryu, Y.-H. A single-layer urban canopy model with transmissive radiation exchange between trees and street canyons. Build. Environ. 2021, 191, 107593. [Google Scholar] [CrossRef]
  54. Liang, H.; Chen, X.; Yin, J.; Da, L. The spatial-temporal pattern and influencing factors of negative air ions in urban forests, Shanghai, China. J. For. Res. 2014, 25, 847–856. [Google Scholar] [CrossRef]
  55. Yue, C.; Yuxin, Z.; Nan, Z.; Dongyou, Z.; Jiangning, Y. An inversion model for estimating the negative air ion concentration using MODIS images of the Daxing’anling region. PLoS ONE 2020, 15, e0242554. [Google Scholar] [CrossRef] [PubMed]
  56. Miao, S.; Zhang, X.; Han, Y.; Sun, W.; Liu, C.; Yin, S. Random Forest Algorithm for the Relationship between Negative Air Ions and Environmental Factors in an Urban Park. Atmosphere 2018, 9, 463. [Google Scholar] [CrossRef] [Green Version]
  57. Wang, H.; Wang, B.; Niuabc, X.; Songac, Q.; Lid, M.; Luod, Y.; Liangd, L.; Dud, P.; Pengd, W. Study on the change of negative air ion concentration and its influencing factors at different spatio-temporal scales. Glob. Ecol. Conserv. 2020, 23, e01008. [Google Scholar] [CrossRef]
  58. Han, J.; Chun, C. Differences between EEG during thermal discomfort and thermal displeasure. Build. Environ. 2021, 204, 108220. [Google Scholar] [CrossRef]
  59. Zhu, M.; Liu, W.; Wargocki, P. Changes in EEG signals during the cognitive activity at varying air temperature and relative humidity. J. Expo. Sci. Environ. Epidemiol. 2020, 30, 285–298. [Google Scholar] [CrossRef] [Green Version]
  60. Tian, X.; Deng, Y.; Wargocki, P.; Liu, W. Effects of increased activity level on physiological and subjective responses at different high temperatures. Build. Environ. 2021, 201, 108011. [Google Scholar] [CrossRef]
Figure 1. Experimental site and three subsections.
Forests 13 00335 g001
Figure 2. Three subsections with different vertical structures for forest walking at the study site.
Forests 13 00335 g002
Figure 3. Four brain lobes, four brain waves and 14 channels monitored by the EEG device.
Forests 13 00335 g003
Figure 4. Measuring points and data collection processes.
Forests 13 00335 g004
Figure 5. Mean PET and NAI values obtained in the three forest types. A, B and C indicate Subsection A, Subsection B and Subsection C, respectively. Groups with different lowercase letters have significant differences.
Forests 13 00335 g005
Figure 6. Mean PET and NAI values recorded over two days. Be. indicates “the day before the rain”, and Af. indicates “the day after the rain”. Groups with different lowercase letters have significant differences.
Forests 13 00335 g006
Figure 7. PET and NAI values obtained for the three forest types in each period. A, B and C indicate Subsection A, Subsection B and Subsection C, respectively. Be. indicates “the day before the rain”, and Af. indicates “the day after the rain”.
Forests 13 00335 g007
Figure 8. Indicators significantly correlated with the PET.
Forests 13 00335 g008
Figure 9. Indicators significantly correlated with NAI.
Forests 13 00335 g009
Publisher’s Note: MDPI stays neutral with regard to jurisdictional claims in published maps and institutional affiliations.

