
Burned Area Detection Using Multi-Sensor SAR, Optical, and Thermal Data in Mediterranean Pine Forest

 ,
,  ,
,  ,
,  ,
, 
 and
and 
Abstract
:
1. Introduction
2. Materials and Methods
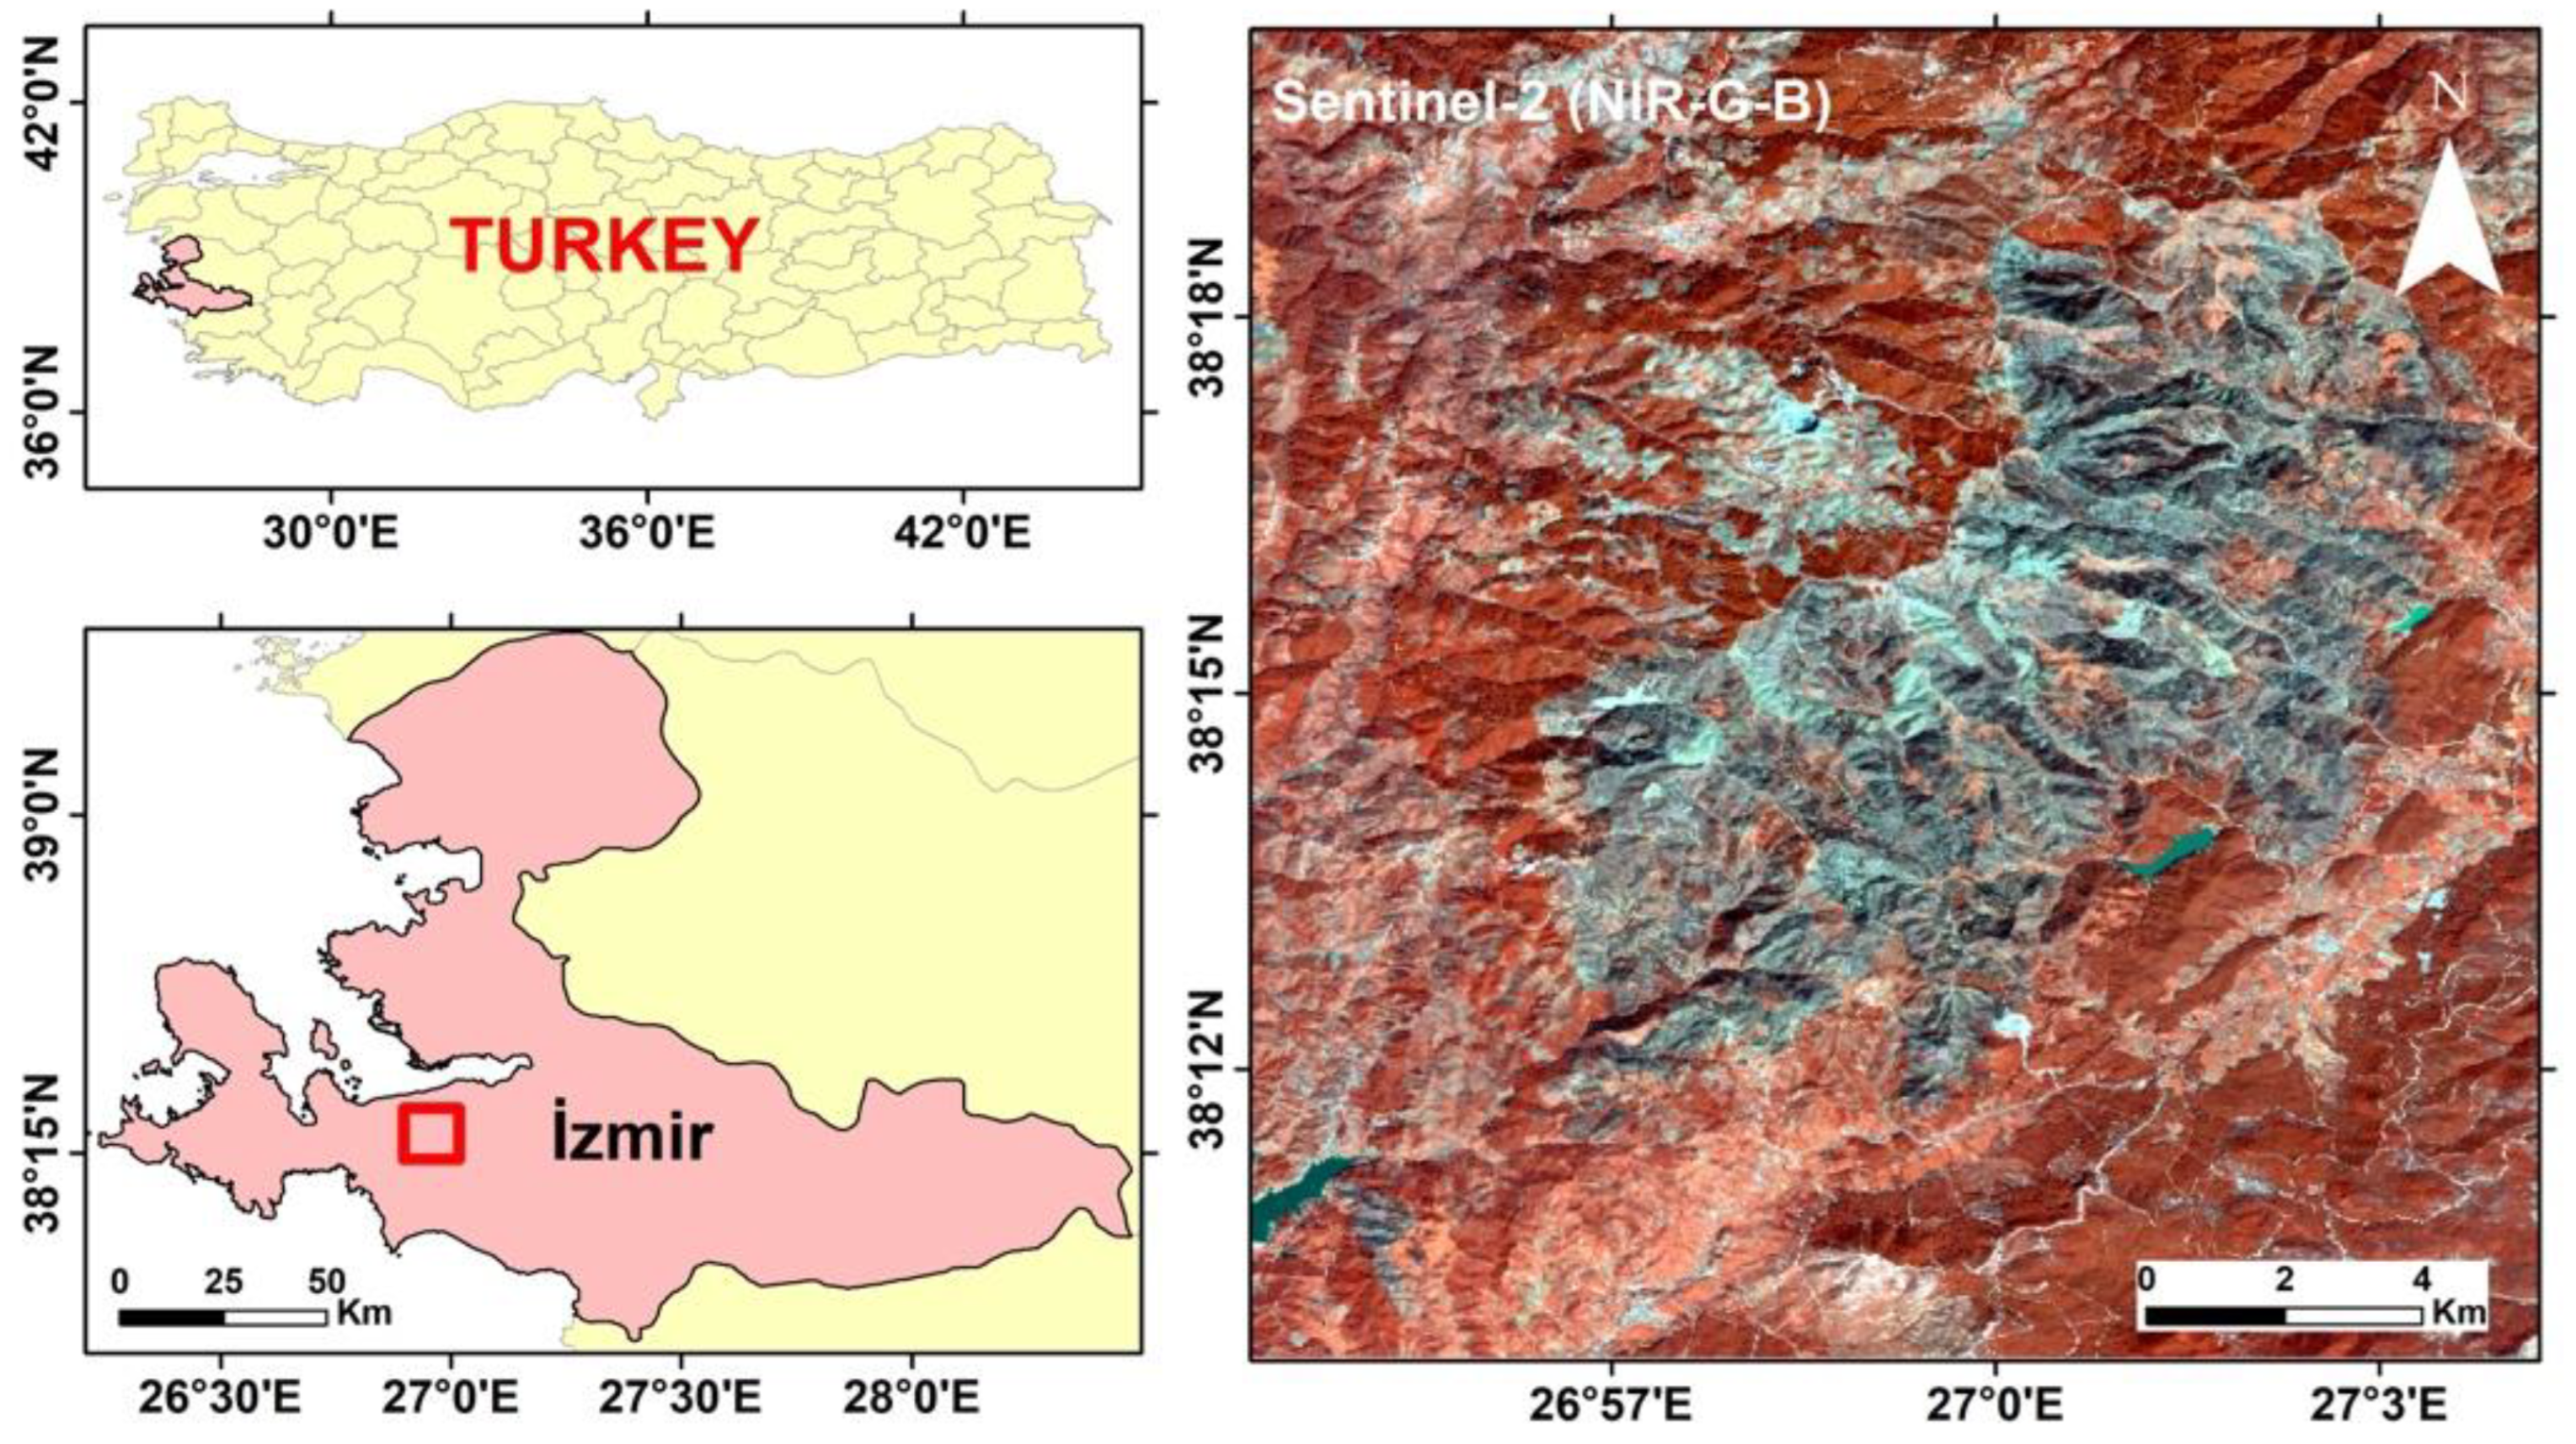
2.1. Study Area
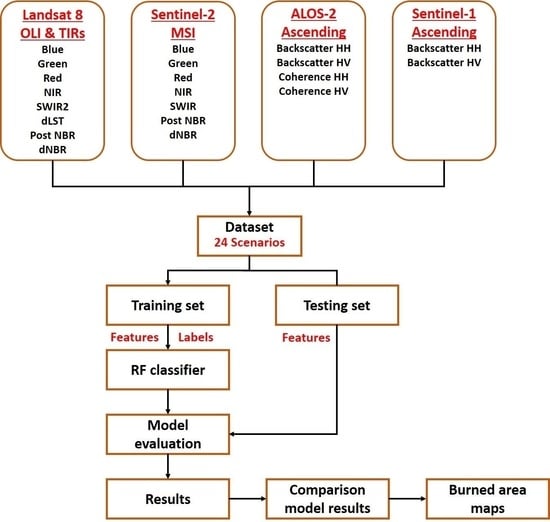
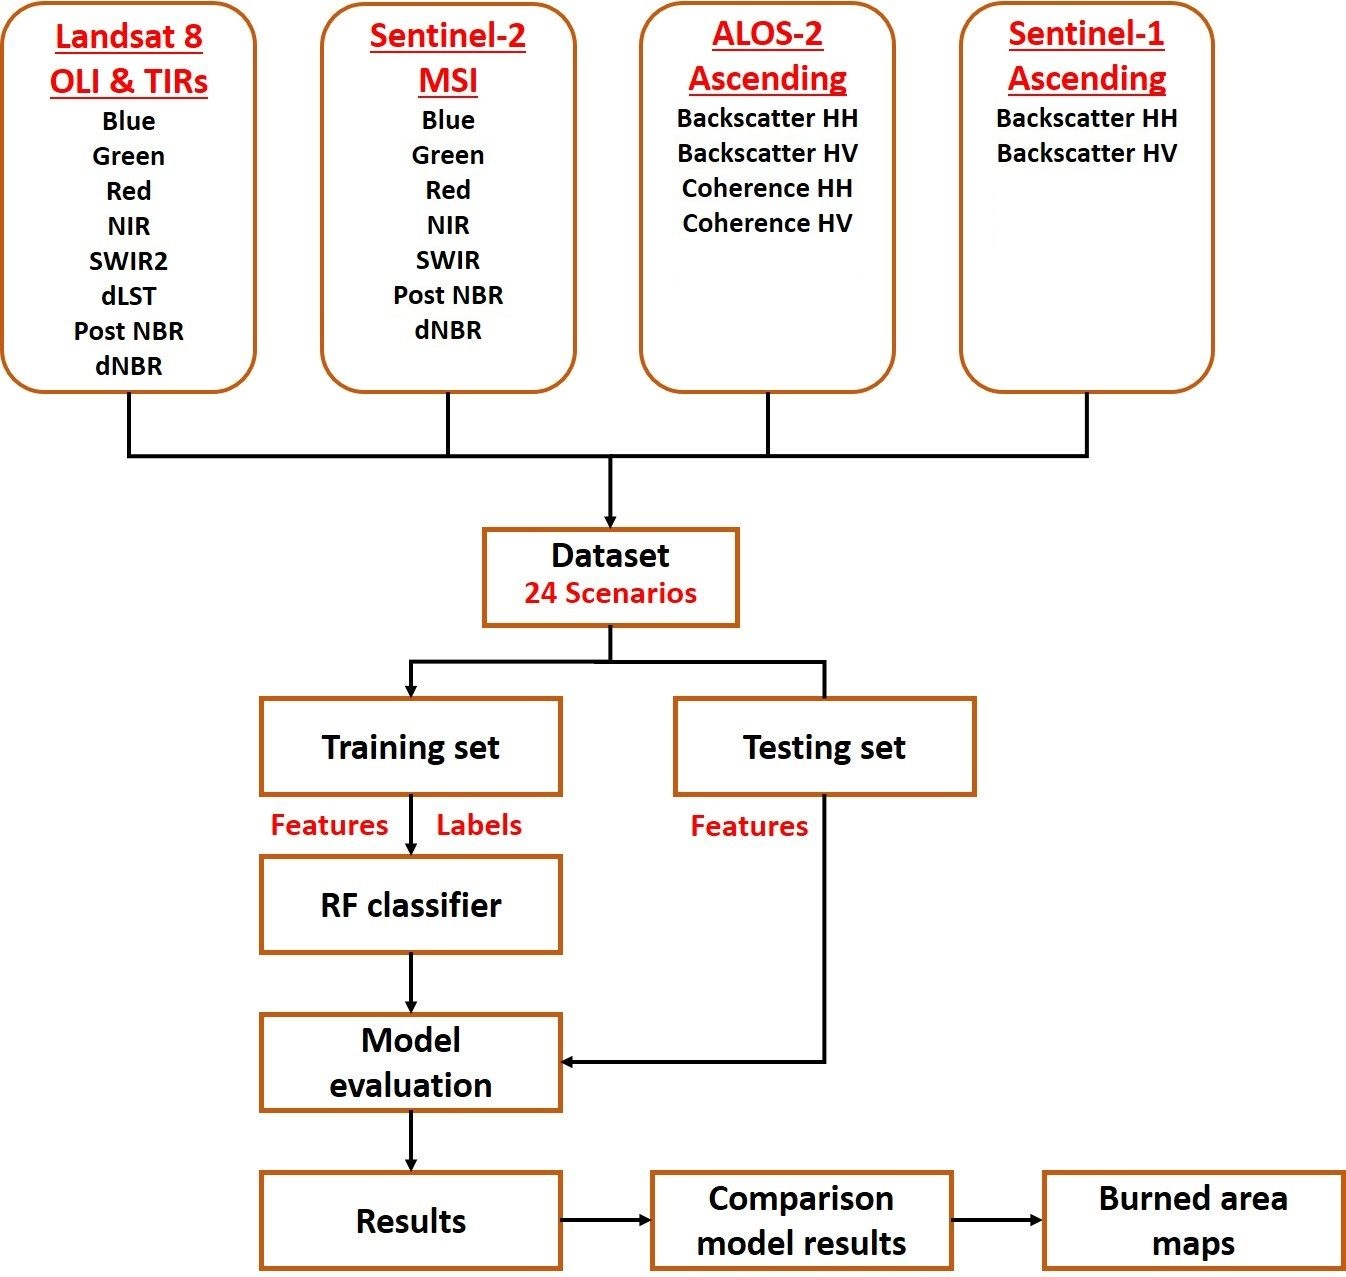
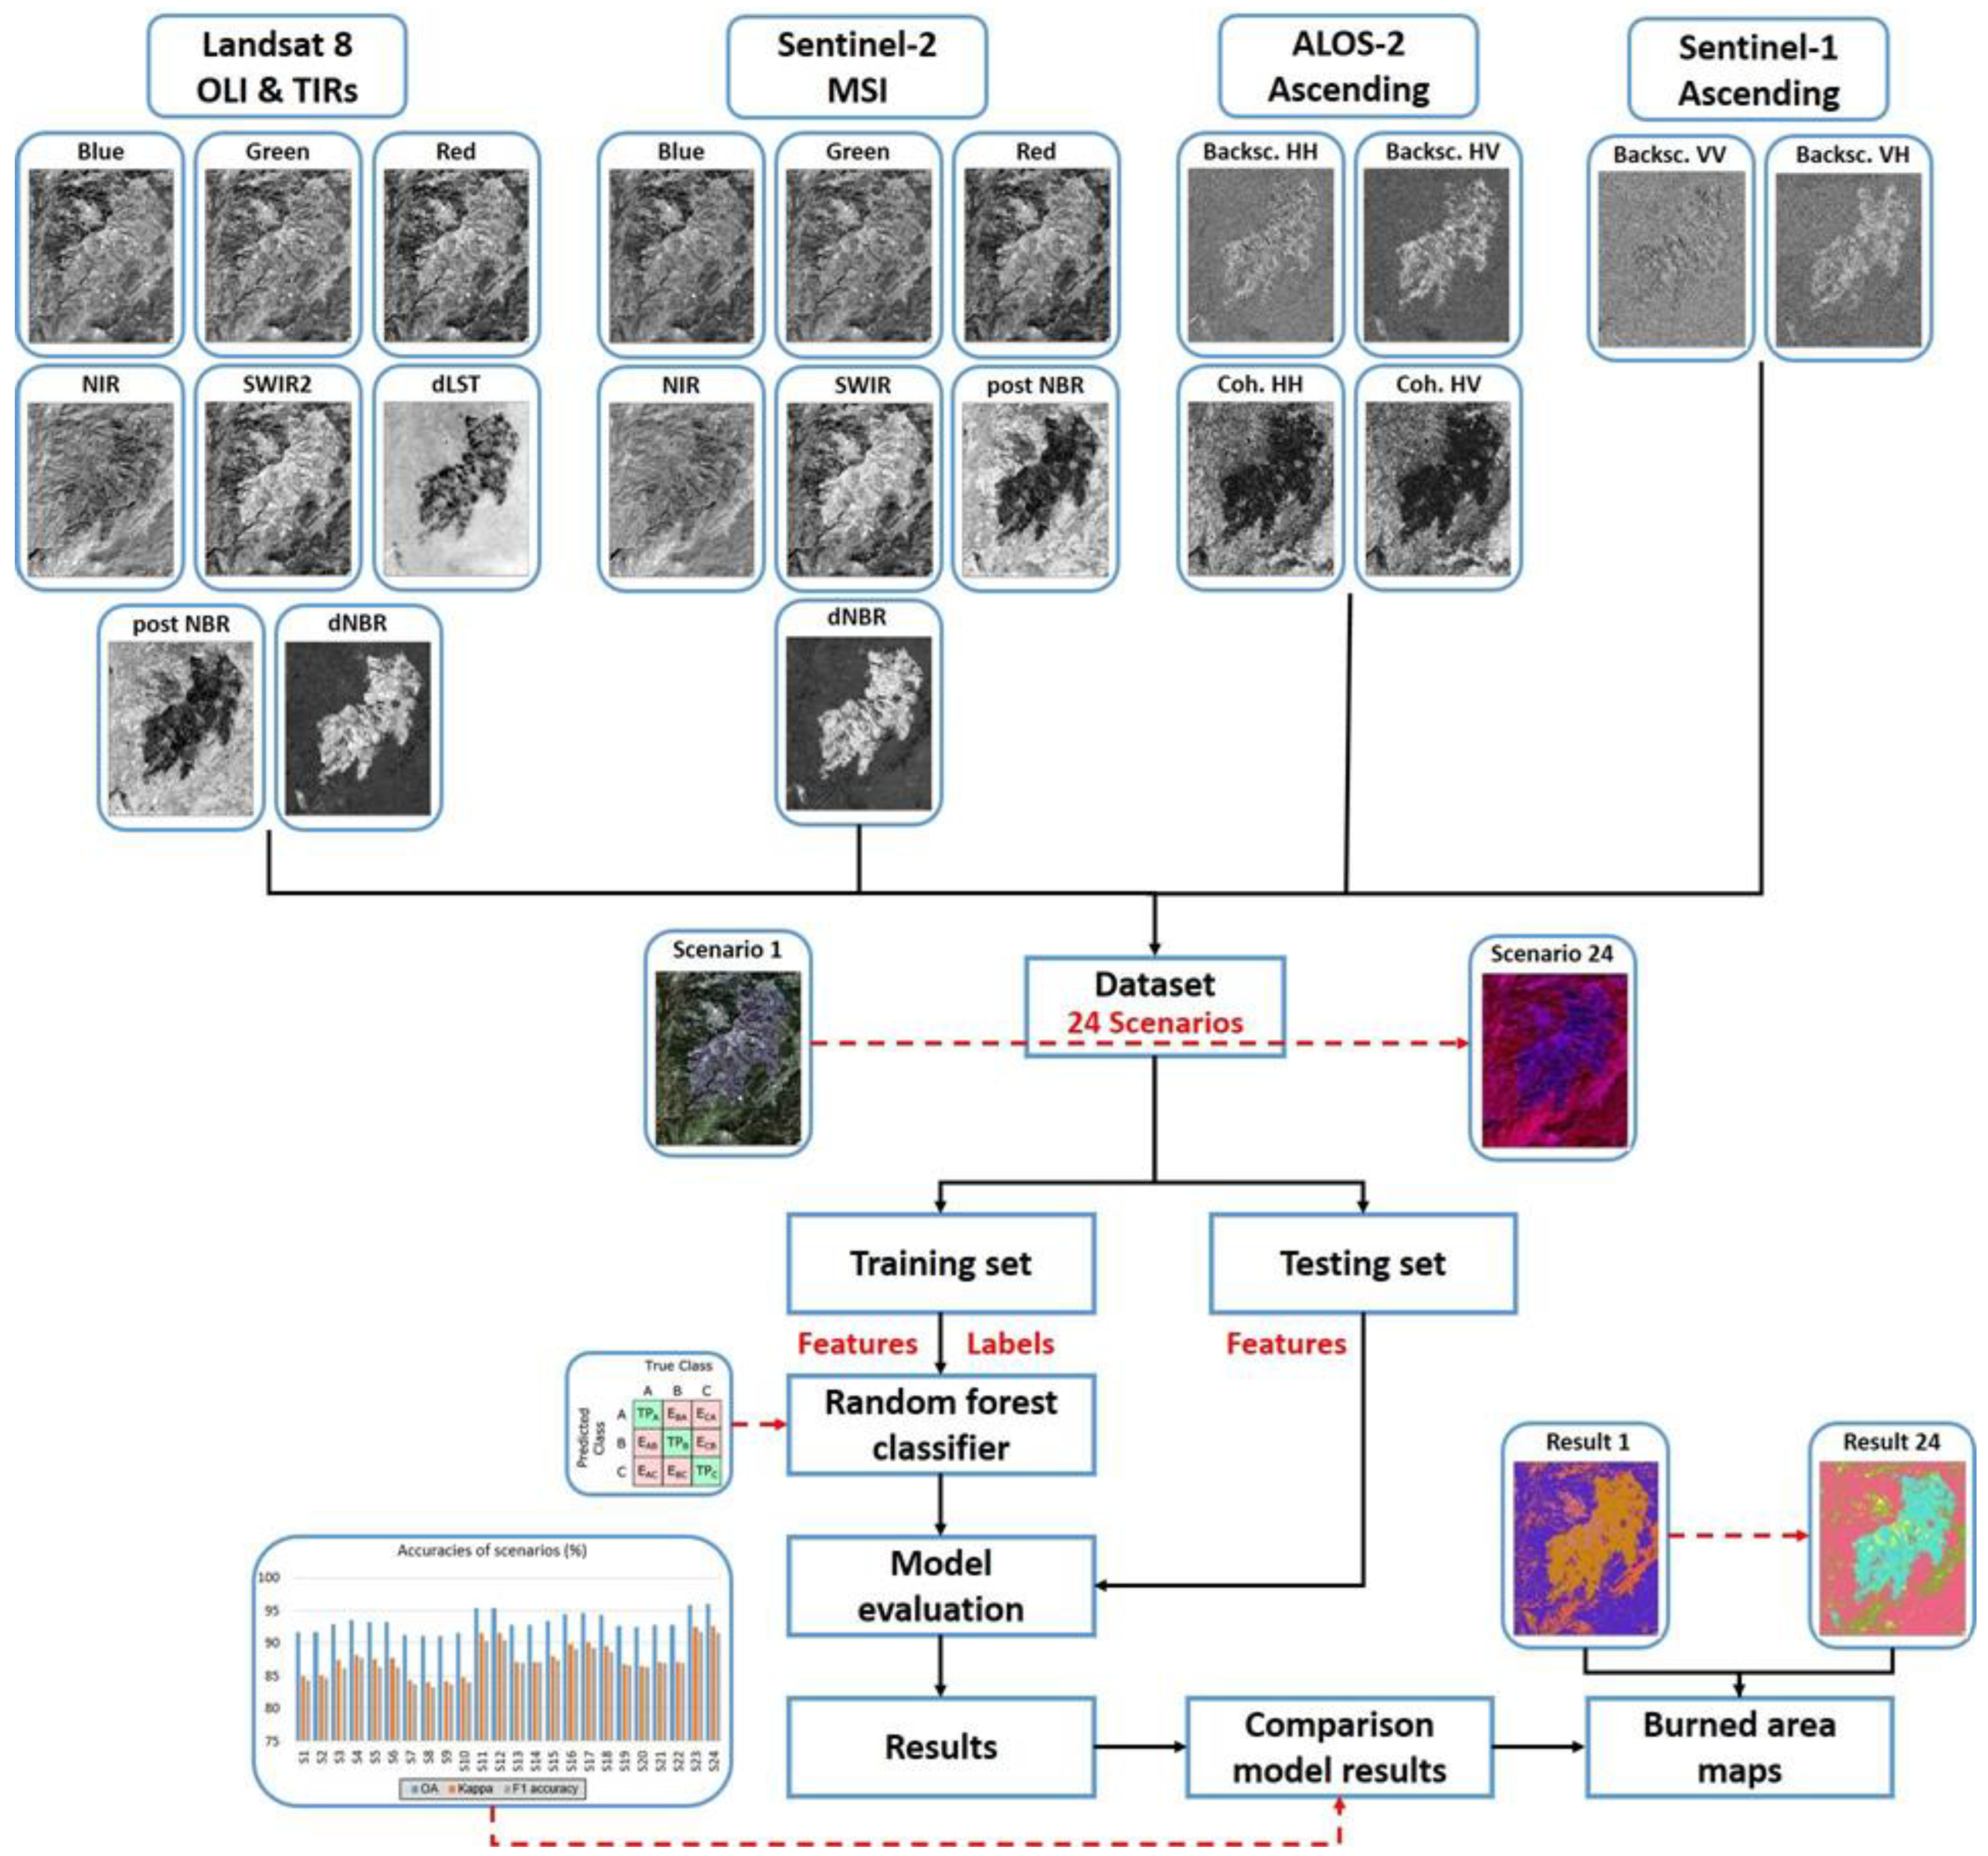
2.2. Multi-Sensor Data
2.3. Burn Severity Spectral Indices of Optical Images
2.4. LST Extraction
2.5. Preprocessing of SAR Images
2.6. Land Cover Classification
3. Results
4. Discussions
5. Conclusions
Author Contributions
Funding
Institutional Review Board Statement
Informed Consent Statement
Data Availability Statement
Acknowledgments
Conflicts of Interest
Appendix A

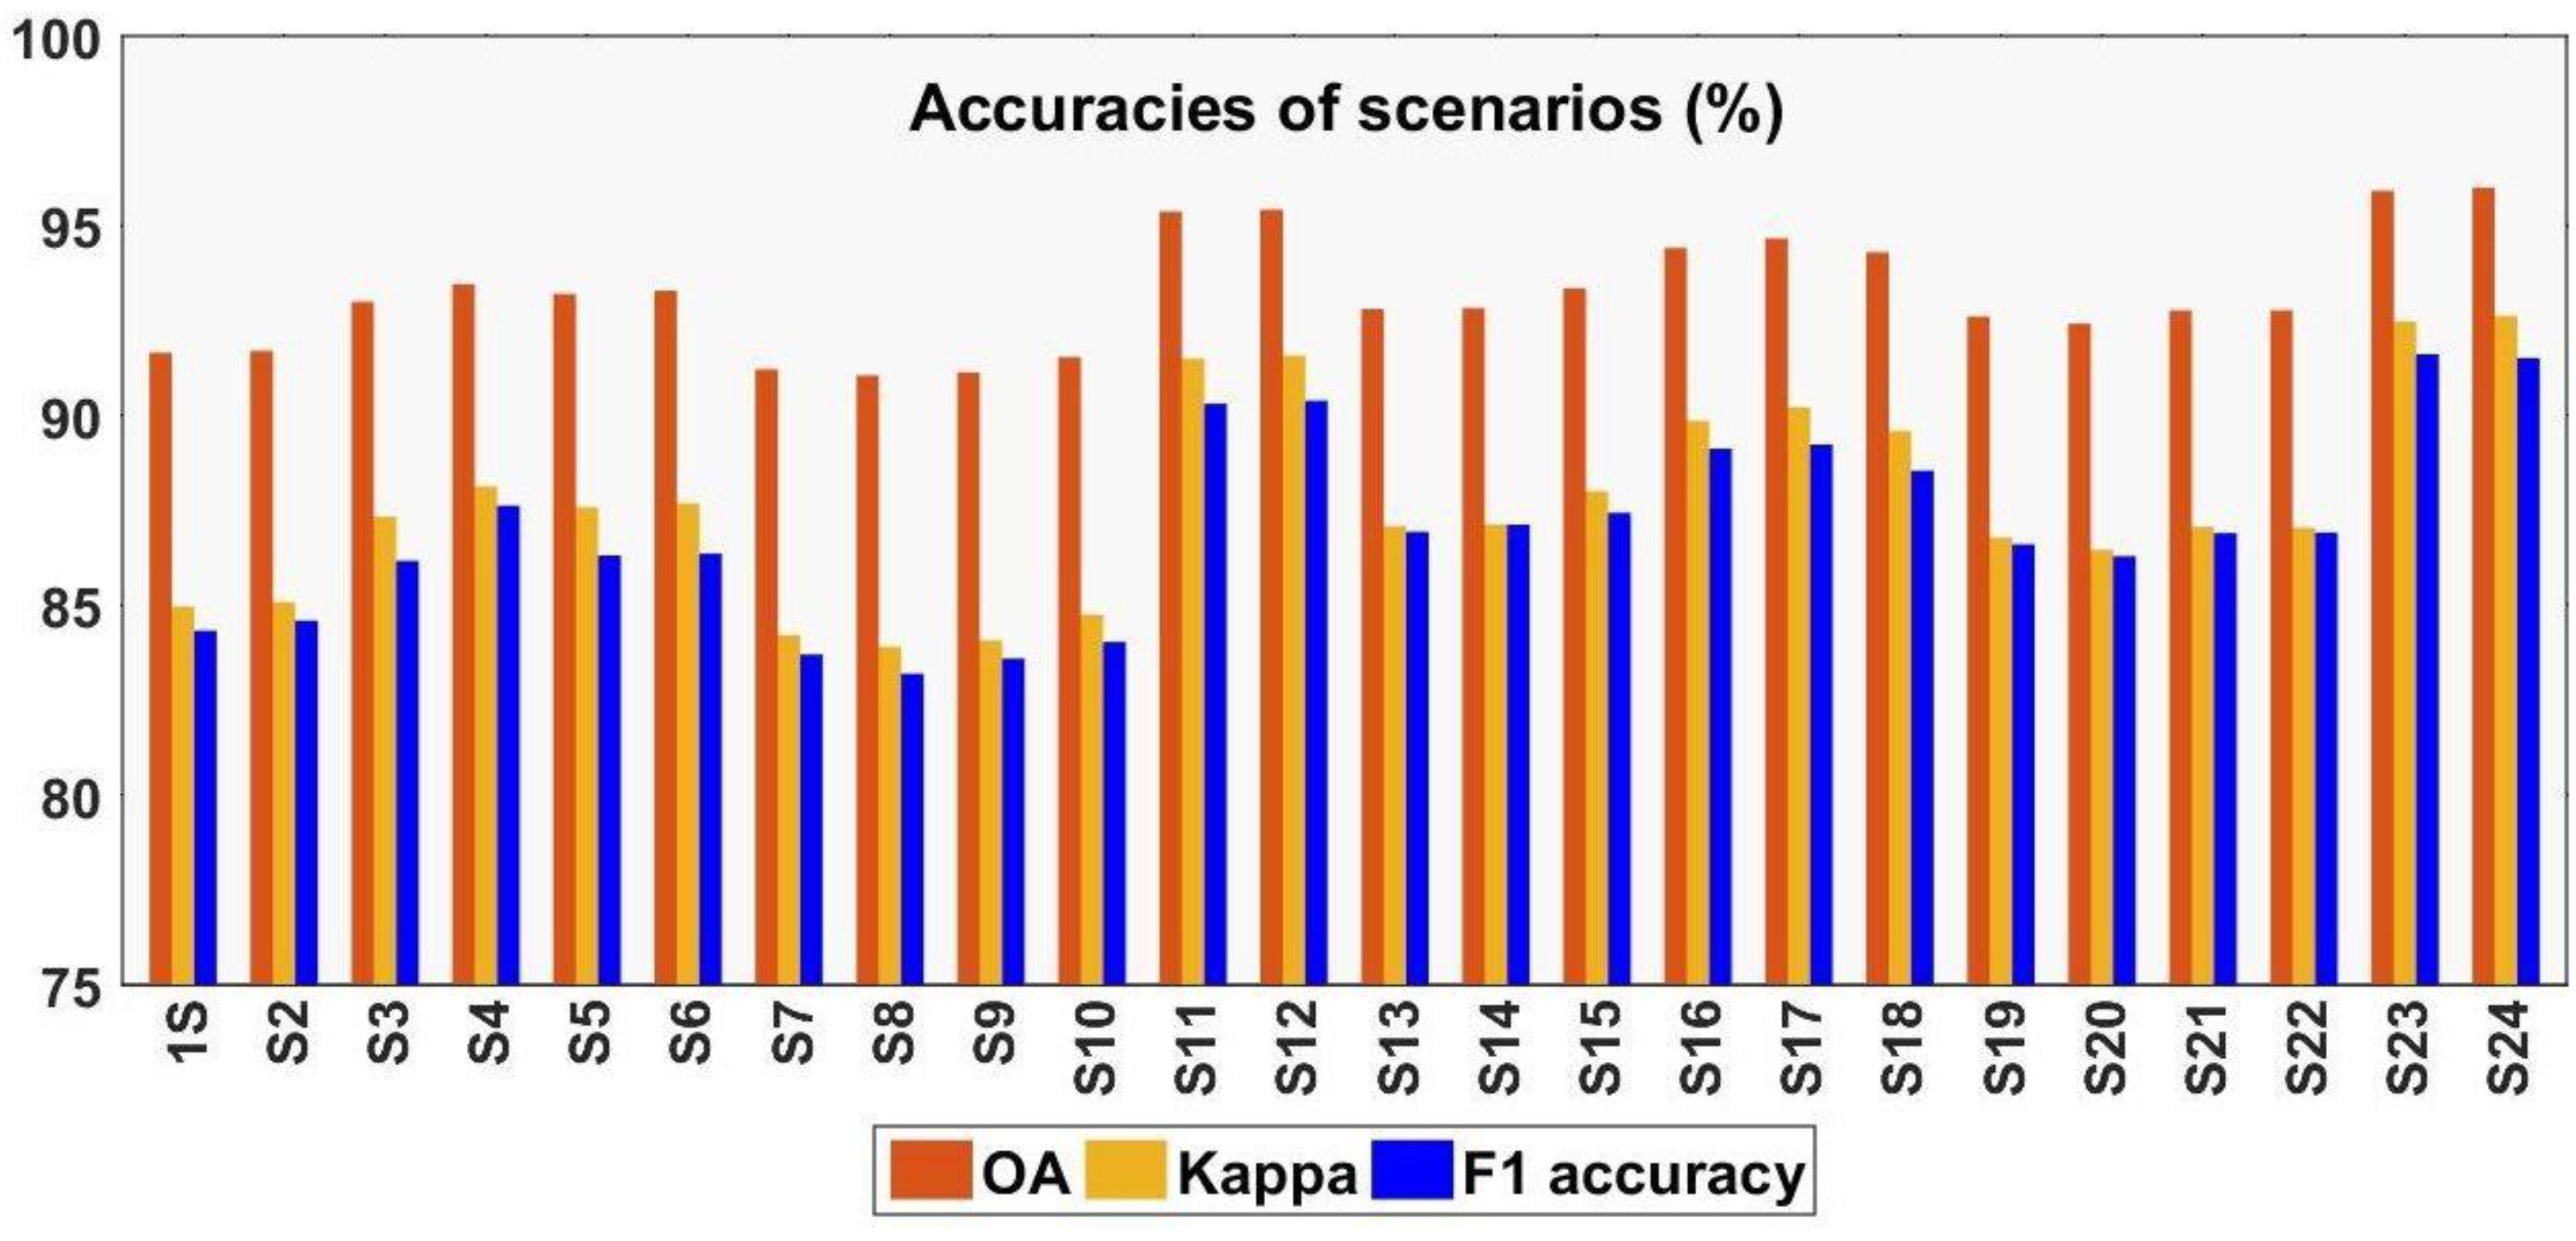
| Scenarios | Features | OA (%) | Kappa (%) | F1 Accuracy (%) |
|---|---|---|---|---|
| S1 | S-2 (B2, B3, B4, B8, B12) | 91.65 | 84.96 | 84.33 |
| S2 | S-2 (B2, B3, B4, B8, B12), NBR2020 | 91.70 | 85.08 | 84.59 |
| S3 | S-2 (B2, B3, B4, B8, B12), dNBR | 92.99 | 87.33 | 86.17 |
| S4 | S-2 (B2, B3, B4, B8, B12), dLST | 93.46 | 88.13 | 87.62 |
| S5 | 93.20 | 87.58 | 86.31 | |
| S6 | 93.29 | 87.68 | 86.36 | |
| S7 | 91.21 | 84.21 | 83.70 | |
| S8 | 91.05 | 83.90 | 83.19 | |
| S9 | 91.13 | 84.07 | 83.59 | |
| S10 | 91.54 | 84.75 | 84.03 | |
| S11 | 95.37 | 91.49 | 90.31 | |
| S12 | 95.43 | 91.58 | 90.39 | |
| S13 | L-8 (B2, B3, B4, B5, B7) | 92.80 | 87.08 | 86.93 |
| S14 | L-8 (B2, B3, B4, B5, B7), NBR2020 | 92.83 | 87.13 | 87.12 |
| S15 | L-8 (B2, B3, B4, B5, B7), dNBR | 93.35 | 88.00 | 87.43 |
| S16 | L-8 (B2, B3, B4, B5, B7), dLST | 94.41 | 89.86 | 89.12 |
| S17 | 94.66 | 90.21 | 89.23 | |
| S18 | 94.30 | 89.59 | 88.54 | |
| S19 | 92.61 | 86.78 | 86.60 | |
| S20 | 92.42 | 86.46 | 86.29 | |
| S21 | 92.77 | 87.06 | 86.90 | |
| S22 | 92.77 | 87.04 | 86.91 | |
| S23 | 95.92 | 92.47 | 91.61 | |
| S24 | 96.00 | 92.62 | 91.51 |
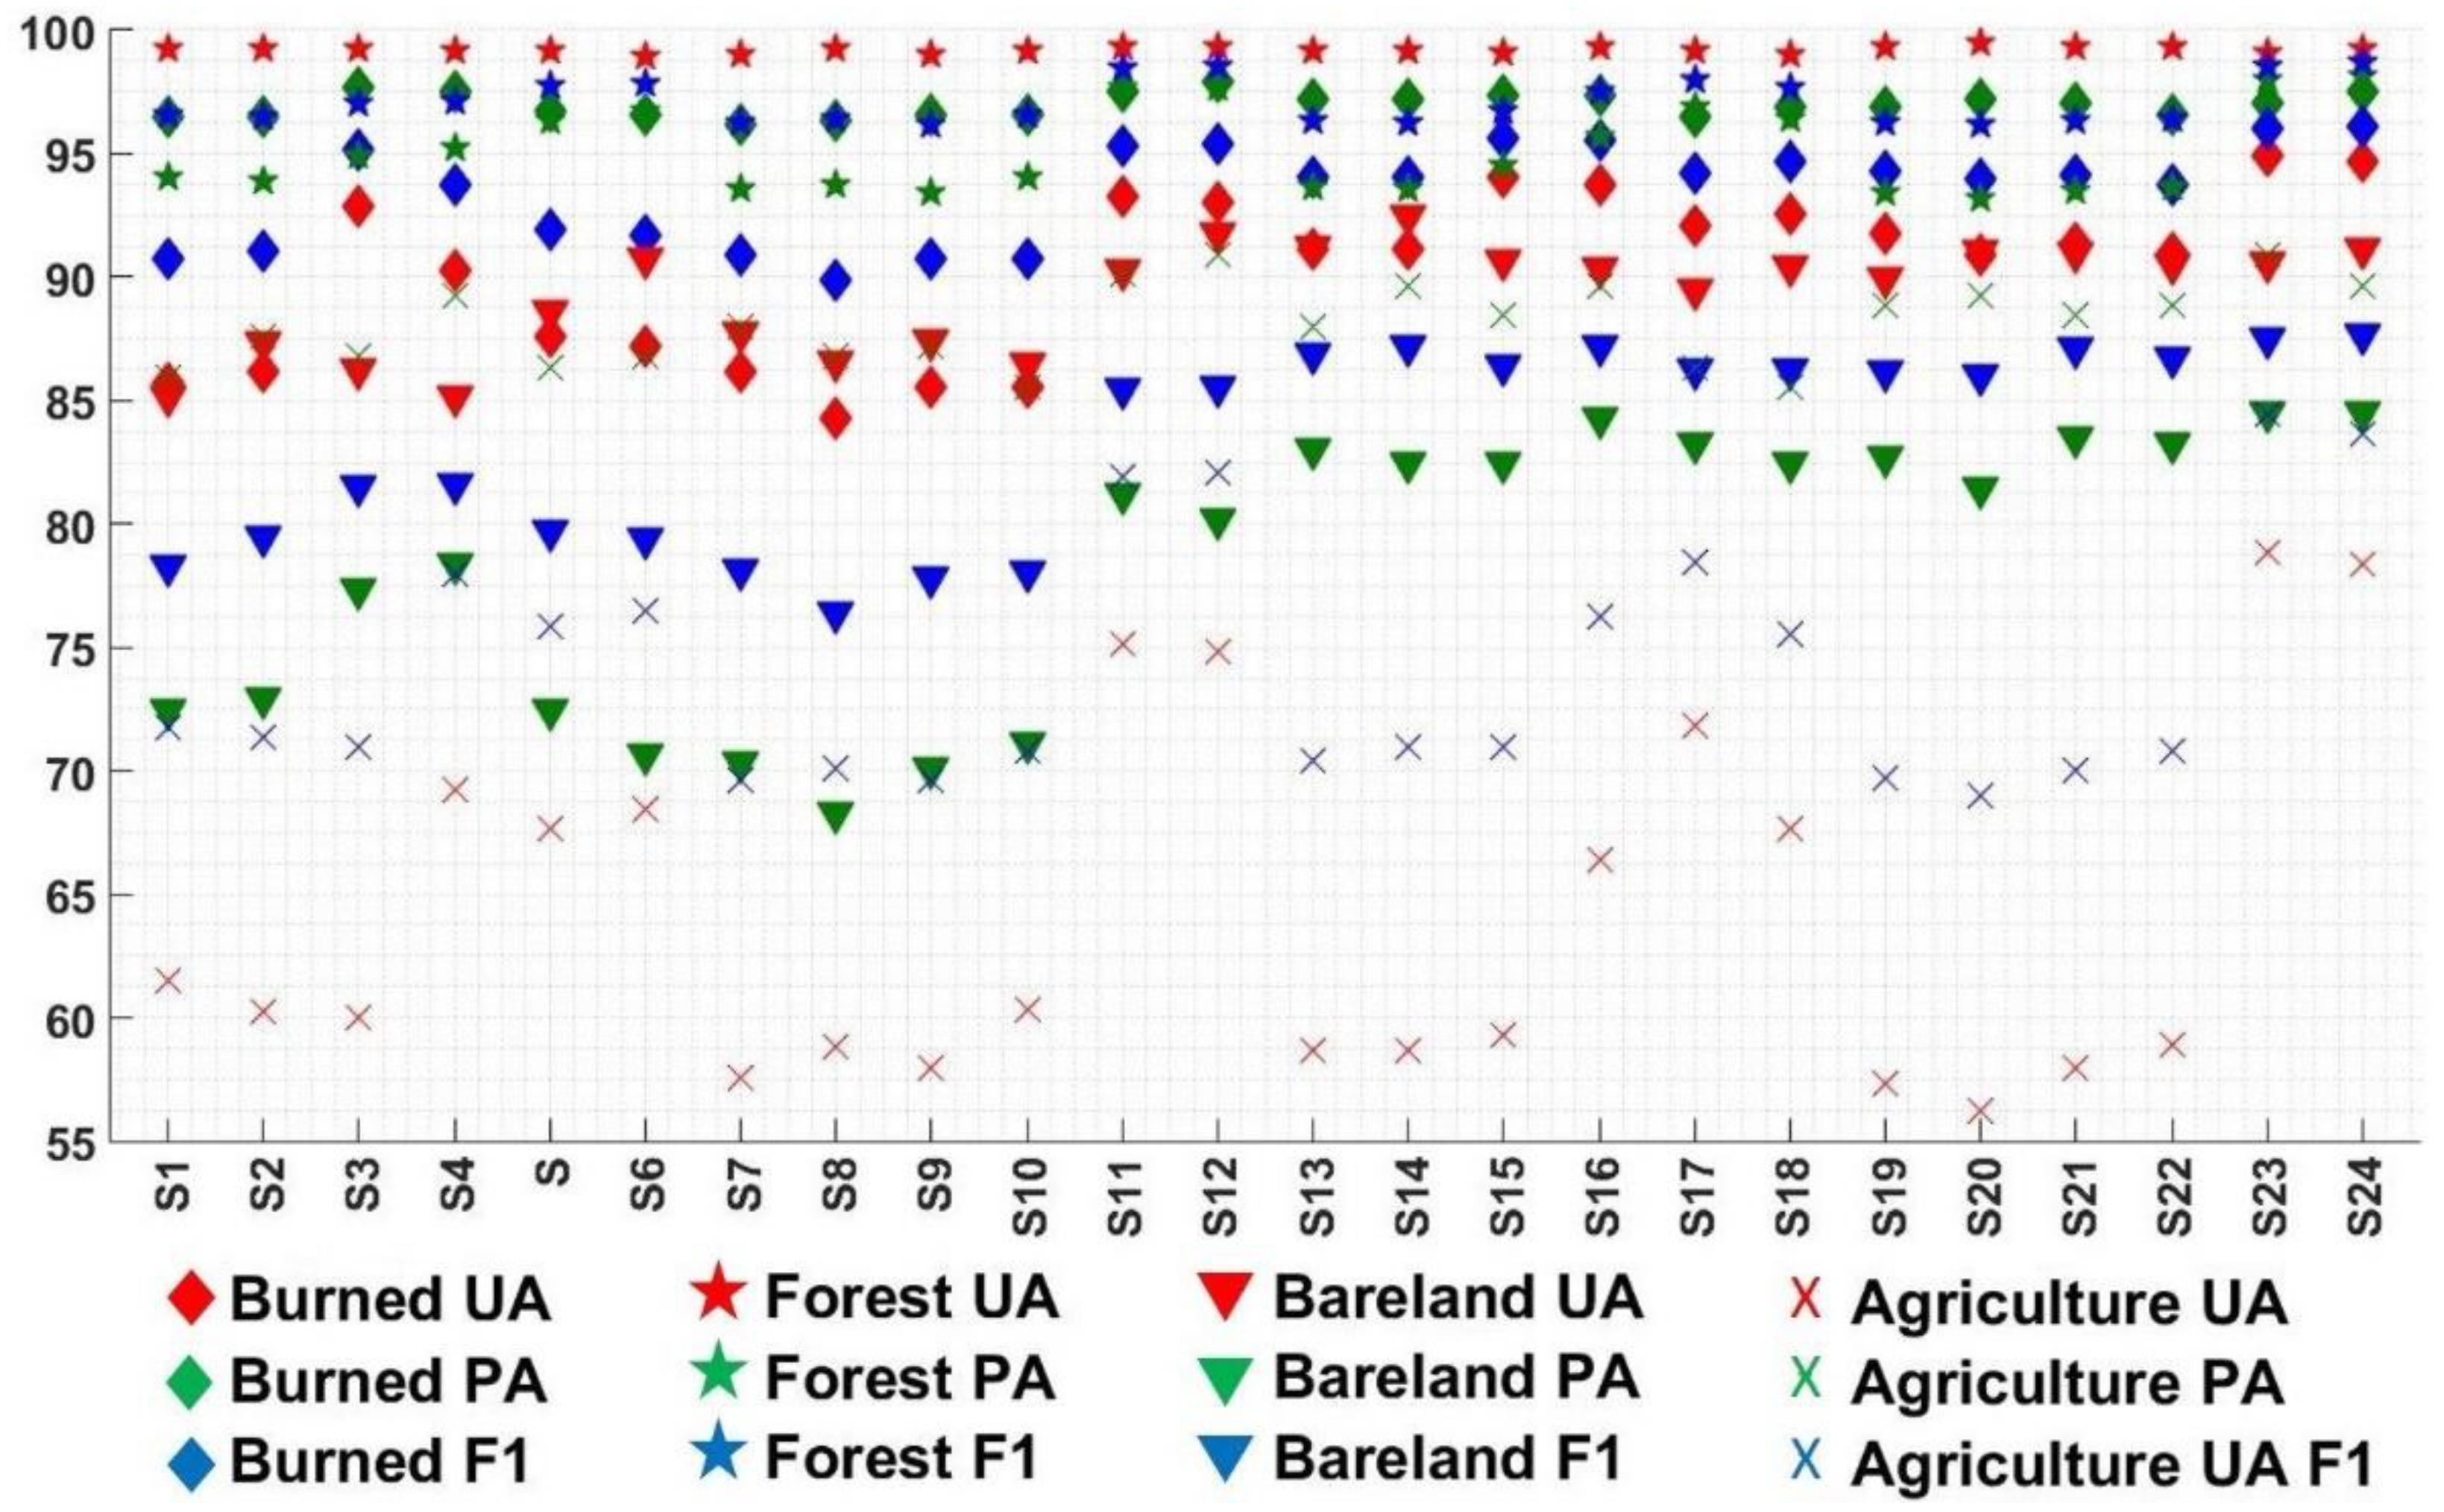
| Burned | Forest | Bareland | Agriculture | |||||||||
|---|---|---|---|---|---|---|---|---|---|---|---|---|
| Scenarios | UA | PA | F1 | UA | PA | F1 | UA | PA | F1 | UA | PA | F1 |
| S1 | 85.71 | 96.46 | 90.77 | 99.23 | 94.03 | 96.56 | 85.15 | 72.42 | 78.27 | 61.54 | 85.95 | 71.72 |
| S2 | 86.17 | 96.46 | 91.02 | 99.23 | 93.86 | 96.47 | 87.35 | 72.94 | 79.49 | 60.23 | 87.60 | 71.38 |
| S3 | 92.85 | 97.64 | 95.18 | 99.24 | 94.88 | 97.01 | 86.21 | 77.32 | 81.52 | 60.00 | 86.78 | 70.95 |
| S4 | 90.30 | 97.49 | 93.76 | 99.16 | 95.22 | 97.15 | 85.15 | 78.35 | 81.61 | 69.23 | 89.26 | 77.98 |
| S5 | 87.58 | 96.76 | 91.94 | 99.17 | 96.33 | 97.73 | 88.64 | 72.42 | 79.72 | 67.64 | 86.36 | 75.86 |
| S6 | 87.22 | 96.61 | 91.67 | 98.95 | 96.76 | 97.84 | 90.73 | 70.62 | 79.42 | 68.40 | 86.78 | 76.50 |
| S7 | 86.13 | 96.17 | 90.87 | 99.05 | 93.56 | 96.23 | 87.78 | 70.36 | 78.11 | 57.57 | 88.02 | 69.61 |
| S8 | 84.26 | 96.31 | 89.88 | 99.23 | 93.73 | 96.40 | 86.60 | 68.30 | 76.37 | 58.82 | 86.78 | 70.12 |
| S9 | 85.51 | 96.61 | 90.72 | 99.05 | 93.43 | 96.16 | 87.46 | 70.10 | 77.83 | 57.97 | 87.19 | 69.64 |
| S10 | 85.51 | 96.61 | 90.72 | 99.,15 | 94.07 | 96.54 | 86.52 | 71.13 | 78.08 | 60.35 | 85.54 | 70.77 |
| S11 | 93.23 | 97.49 | 95.31 | 99.35 | 97.65 | 98.49 | 90.26 | 81.19 | 85.48 | 75.17 | 90.08 | 81.95 |
| S12 | 93.00 | 97.94 | 95.40 | 99.35 | 97.70 | 98.52 | 91.74 | 80.15 | 85.56 | 74.83 | 90.91 | 82.09 |
| S13 | 91.15 | 97.20 | 94.08 | 99.19 | 93.64 | 96.34 | 91.22 | 82.99 | 86.91 | 58.68 | 88.02 | 70.41 |
| S14 | 91.15 | 97.20 | 94.08 | 99.14 | 93.60 | 96.29 | 92.49 | 82.47 | 87.19 | 58.65 | 89.67 | 70.92 |
| S15 | 94.02 | 97.35 | 95.65 | 99.06 | 94.50 | 96.72 | 90.65 | 82.47 | 86.37 | 59.28 | 88.43 | 70.98 |
| S16 | 93.75 | 97.35 | 95.51 | 99.34 | 95.73 | 97.50 | 90.33 | 84.28 | 87.20 | 66.36 | 89.67 | 76.27 |
| S17 | 92.11 | 96.46 | 94.24 | 99.17 | 96.89 | 98.01 | 89.47 | 83.25 | 86.25 | 71.82 | 86.36 | 78.42 |
| S18 | 92.54 | 96.90 | 94.67 | 99.04 | 96.42 | 97.71 | 90.40 | 82.47 | 86.25 | 67.65 | 85.54 | 75.55 |
| S19 | 91.76 | 96.90 | 94.26 | 99.32 | 93.39 | 96.26 | 89.92 | 82.73 | 86.17 | 57.33 | 88.84 | 69.69 |
| S20 | 90.90 | 97.20 | 93.94 | 99.45 | 93.17 | 96.21 | 91.07 | 81.44 | 85.99 | 56.25 | 89.26 | 69.01 |
| S21 | 91.39 | 97.05 | 94.13 | 99.32 | 93.52 | 96.33 | 91.01 | 83.51 | 87.10 | 57.99 | 88.43 | 70.05 |
| S22 | 90.97 | 96.61 | 93.71 | 99.32 | 93.64 | 96.40 | 90.48 | 83.25 | 86.71 | 58.90 | 88.84 | 70.84 |
| S23 | 94.95 | 97.05 | 95.99 | 99.09 | 97.99 | 98.54 | 90.61 | 84.54 | 87.47 | 78.85 | 90.91 | 84.45 |
| S24 | 94.70 | 97.49 | 96.08 | 99.27 | 98.12 | 98.69 | 91.11 | 84.54 | 87.70 | 78.34 | 89.67 | 83.62 |
References
- Bonan, G.B. Forests and climate change: Forcings, feedbacks, and the climate benefits of forests. Science 2008, 320, 1444–1449. [Google Scholar] [CrossRef] [PubMed] [Green Version]
- Li, Q. Forest Bathing: How Trees Can Help You Find Health and Happiness; Viking Press: New York, NY, USA, 2018; ISBN 0525559868. [Google Scholar]
- WWF. Available online: https://www.worldwildlife.org/industries/responsible-forestry (accessed on 18 December 2021).
- Zhang, Q.; Ge, L.; Zhang, R.; Metternicht, G.I.; Du, Z.; Kuang, J.; Xu, M. Deep-learning-based burned area mapping using the synergy of Sentinel-1&2 data. Remote Sens. Environ. 2021, 264, 112575. [Google Scholar] [CrossRef]
- Schroeder, W.; Oliva, P.; Giglio, L.; Quayle, B.; Lorenz, E.; Morelli, F. Active fire detection using Landsat-8/OLI data. Remote Sens. Environ. 2016, 185, 210–220. [Google Scholar] [CrossRef] [Green Version]
- Palandjian, D.; Gitas, I.Z.; Wright, R. Burned area mapping and post-fire impact assessment in the Kassandra peninsula (Greece) using Landsat TM and Quickbird data. Geocarto Int. 2009, 24, 193–205. [Google Scholar] [CrossRef]
- Sertel, E.; Alganci, U. Comparison of pixel and object-based classification for burned area mapping using SPOT-6 images. Geomatics Nat. Hazards Risk 2016, 7, 1198–1206. [Google Scholar] [CrossRef] [Green Version]
- Widodo, J.; Sulaiman, A.; Awaluddin, A.; Riyadi, A.; Nasucha, M.; Perissin, D.; Sri Sumantyo, J.T. Application of SAR Interferometry Using ALOS-2 PALSAR-2 Data as Precise Method to Identify Degraded Peatland Areas Related to Forest Fire. Geosciences 2019, 9, 484. [Google Scholar] [CrossRef] [Green Version]
- Tanase, M.A.; Santoro, M.; Wegmüller, U.; de la Riva, J.; Pérez-Cabello, F. Properties of X-, C-and L-band repeat-pass interferometric SAR coherence in Mediterranean pine forests affected by fires. Remote Sens. Environ. 2010, 114, 2182–2194. [Google Scholar] [CrossRef]
- Philipp, M.B.; Levick, S.R. Exploring the potential of C-Band SAR in contributing to burn severity mapping in tropical savanna. Remote Sens. 2020, 12, 49. [Google Scholar] [CrossRef] [Green Version]
- Xulu, S.; Mbatha, N.; Peerbhay, K. Burned Area Mapping over the Southern Cape Forestry Region, South Africa Using Sentinel Data within GEE Cloud Platform. ISPRS Int. J. Geo-Inf. 2021, 10, 511. [Google Scholar] [CrossRef]
- Viedma, O.; Moreno, J.M.; Güngöroglu, C.; Cosgun, U.; Kavgacı, A. Recent land-use and land-cover changes and its driving factors in a fire-prone area of southwestern Turkey. J. Environ. Manag. 2017, 197, 719–731. [Google Scholar] [CrossRef]
- Elhag, M.; Yimaz, N.; Bahrawi, J.; Boteva, S. Evaluation of optical remote sensing data in burned areas mapping of Thasos Island, Greece. Earth Syst. Environ. 2020, 4, 813–826. [Google Scholar] [CrossRef]
- Thompson, M.P.; MacGregor, D.G.; Dunn, C.J.; Calkin, D.E.; Phipps, J. Rethinking the wildland fire management system. J. For. 2018, 116, 382–390. [Google Scholar] [CrossRef] [Green Version]
- Koutsias, N.; Karteris, M. Burned area mapping using logistic regression modeling of a single post-fire Landsat-5 Thematic Mapper image. Int. J. Remote Sens. 2000, 21, 673–687. [Google Scholar] [CrossRef]
- Pereira, A.A.; Libonati, R.; Rodrigues, J.A.; Nogueira, J.; Santos, F.L.M.; Oom, D.; Sanches, W.; Alvarado, S.T.; Pereira, J. Multi-sensor, active fire-supervised, one-class burned area mapping in the brazilian savanna. Remote Sens. 2021, 13, 4005. [Google Scholar] [CrossRef]
- Sali, M.; Piaser, E.; Boschetti, M.; Brivio, P.A.; Sona, G.; Bordogna, G.; Stroppiana, D. A Burned Area Mapping Algorithm for Sentinel-2 Data Based on Approximate Reasoning and Region Growing. Remote Sens. 2021, 13, 2214. [Google Scholar] [CrossRef]
- Matcı, D.K.; Avdan, U. Comparative analysis of unsupervised classification methods for mapping burned forest areas. Arab. J. Geosci. 2020, 13, 711. [Google Scholar] [CrossRef]
- Smiraglia, D.; Filipponi, F.; Mandrone, S.; Tornato, A.; Taramelli, A. Agreement index for burned area mapping: Integration of multiple spectral indices using Sentinel-2 satellite images. Remote Sens. 2020, 12, 1862. [Google Scholar] [CrossRef]
- Quintano, C.; Fernández-Manso, A.; Fernández-Manso, O.; Shimabukuro, Y.E. Mapping burned areas in Mediterranean countries using spectral mixture analysis from a uni-temporal perspective. Int. J. Remote Sens. 2006, 27, 645–662. [Google Scholar] [CrossRef]
- Kasischke, E.S.; French, N.H.F.; Harrell, P.; Christensen, N.L., Jr.; Ustin, S.L.; Barry, D. Monitoring of wildfires in boreal forests using large area AVHRR NDVI composite image data. Remote Sens. Environ. 1993, 45, 61–71. [Google Scholar] [CrossRef]
- Santana, N.C.; de Carvalho Júnior, O.A.; Gomes, R.A.T.; Guimarães, R.F. Burned-area detection in Amazonian environments using standardized time series per pixel in MODIS data. Remote Sens. 2018, 10, 1904. [Google Scholar] [CrossRef] [Green Version]
- Liu, S.; Wang, S.; Chi, T.; Wen, C.; Wu, T.; Wang, D. An improved combined vegetation difference index and burn scar index approach for mapping cropland burned areas using combined data from Landsat 8 multispectral and thermal infrared bands. Int. J. Wildl. Fire 2020, 29, 499–512. [Google Scholar] [CrossRef]
- Mashhadi, N.; Alganci, U. Determination of forest burn scar and burn severity from free satellite images: A comparative evaluation of spectral indices and machine learning classifiers. Int. J. Environ. Geoinform. 2021, 8, 488–497. [Google Scholar] [CrossRef]
- Smith, A.M.S.; Drake, N.A.; Wooster, M.J.; Hudak, A.T.; Holden, Z.A.; Gibbons, C.J. Production of Landsat ETM+ reference imagery of burned areas within Southern African savannahs: Comparison of methods and application to MODIS. Int. J. Remote Sens. 2007, 28, 2753–2775. [Google Scholar] [CrossRef]
- Martín, M.P.; Gómez, I.; Chuvieco, E. Burnt Area Index (BAIM) for burned area discrimination at regional scale using MODIS data. For. Ecol. Manag. 2006, 234, S221. [Google Scholar] [CrossRef]
- Pinty, B.; Verstraete, M.M. GEMI: A non-linear index to monitor global vegetation from satellites. Vegetatio 1992, 101, 15–20. [Google Scholar] [CrossRef]
- Trigg, S.; Flasse, S. An evaluation of different bi-spectral spaces for discriminating burned shrub-savannah. Int. J. Remote Sens. 2001, 22, 2641–2647. [Google Scholar] [CrossRef]
- Miller, J.D.; Thode, A.E. Quantifying burn severity in a heterogeneous landscape with a relative version of the delta Normalized Burn Ratio (dNBR). Remote Sens. Environ. 2007, 109, 66–80. [Google Scholar] [CrossRef]
- Mallinis, G.; Mitsopoulos, I.; Chrysafi, I. Evaluating and comparing sentinel 2A and landsat-8 operational land imager (OLI) spectral indices for estimating fire severity in a Mediterranean pine ecosystem of Greece. GISci. Remote Sens. 2018, 55, 1–18. [Google Scholar] [CrossRef]
- Achour, H.; Toujani, A.; Trabelsi, H.; Jaouadi, W. Evaluation and comparison of Sentinel-2 MSI, Landsat 8 OLI, and EFFIS data for forest fires mapping. Illustrations from the summer 2017 fires in Tunisia. Geocarto Int. 2021, 36, 1–20. [Google Scholar] [CrossRef]
- Ban, Y.; Zhang, P.; Nascetti, A.; Bevington, A.R.; Wulder, M.A. Near real-time wildfire progression monitoring with Sentinel-1 SAR time series and deep learning. Sci. Rep. 2020, 10, 1322. [Google Scholar] [CrossRef] [PubMed] [Green Version]
- Stroppiana, D.; Azar, R.; Calò, F.; Pepe, A.; Imperatore, P.; Boschetti, M.; Silva, J.; Brivio, P.A.; Lanari, R. Integration of optical and SAR data for burned area mapping in Mediterranean Regions. Remote Sens. 2015, 7, 1320–1345. [Google Scholar] [CrossRef] [Green Version]
- Filipponi, F. Exploitation of sentinel-2 time series to map burned areas at the national level: A case study on the 2017 italy wildfires. Remote Sens. 2019, 11, 622. [Google Scholar] [CrossRef] [Green Version]
- Chuvieco, E.; Lizundia-Loiola, J.; Pettinari, M.L.; Ramo, R.; Padilla, M.; Tansey, K.; Mouillot, F.; Laurent, P.; Storm, T.; Heil, A. Generation and analysis of a new global burned area product based on MODIS 250 m reflectance bands and thermal anomalies. Earth Syst. Sci. Data 2018, 10, 2015–2031. [Google Scholar] [CrossRef] [Green Version]
- Giglio, L.; Boschetti, L.; Roy, D.P.; Humber, M.L.; Justice, C.O. The Collection 6 MODIS burned area mapping algorithm and product. Remote Sens. Environ. 2018, 217, 72–85. [Google Scholar] [CrossRef]
- Fernández-Manso, A.; Quintano, C. A synergetic approach to burned area mapping using maximum entropy modeling trained with hyperspectral data and VIIRS hotspots. Remote Sens. 2020, 12, 858. [Google Scholar] [CrossRef] [Green Version]
- Otón, G.; Ramo, R.; Lizundia-Loiola, J.; Chuvieco, E. Global detection of long-term (1982–2017) burned area with AVHRR-LTDR data. Remote Sens. 2019, 11, 2079. [Google Scholar] [CrossRef] [Green Version]
- Roy, D.P.; Huang, H.; Boschetti, L.; Giglio, L.; Yan, L.; Zhang, H.H.; Li, Z. Landsat-8 and Sentinel-2 burned area mapping-A combined sensor multi-temporal change detection approach. Remote Sens. Environ. 2019, 231, 111254. [Google Scholar] [CrossRef]
- Ngadze, F.; Mpakairi, K.S.; Kavhu, B.; Ndaimani, H.; Maremba, M.S. Exploring the utility of Sentinel-2 MSI and Landsat 8 OLI in burned area mapping for a heterogenous savannah landscape. PLoS ONE 2020, 15, e0232962. [Google Scholar] [CrossRef]
- Moreira, A.; Prats-Iraola, P.; Younis, M.; Krieger, G.; Hajnsek, I.; Papathanassiou, K.P. A tutorial on synthetic aperture radar. IEEE Geosci. Remote Sens. Mag. 2013, 1, 6–43. [Google Scholar] [CrossRef] [Green Version]
- Tariq, A.; Shu, H.; Li, Q.; Altan, O.; Khan, M.R.; Baqa, M.F.; Lu, L. Quantitative Analysis of Forest Fires in Southeastern Australia Using SAR Data. Remote Sens. 2021, 13, 2386. [Google Scholar] [CrossRef]
- Donezar, U.; De Blas, T.; Larrañaga, A.; Ros, F.; Albizua, L.; Steel, A.; Broglia, M. Applicability of the multitemporal coherence approach to sentinel-1 for the detection and delineation of burnt areas in the context of the copernicus emergency management service. Remote Sens. 2019, 11, 2607. [Google Scholar] [CrossRef] [Green Version]
- Verhegghen, A.; Eva, H.; Ceccherini, G.; Achard, F.; Gond, V.; Gourlet-Fleury, S.; Cerutti, P.O. The potential of Sentinel satellites for burnt area mapping and monitoring in the Congo Basin forests. Remote Sens. 2016, 8, 986. [Google Scholar] [CrossRef] [Green Version]
- Belenguer-Plomer, M.A.; Tanase, M.A.; Chuvieco, E.; Bovolo, F. CNN-based burned area mapping using radar and optical data. Remote Sens. Environ. 2021, 260, 112468. [Google Scholar] [CrossRef]
- General Directorate of Forestry, OGM 2020. ISBN 978-605-7599-68-1. Available online: https://www.ogm.gov.tr/tr/ormanlarimiz/Turkiye-Orman-Varligi (accessed on 28 December 2021). (In Turkish)
- Mauri, A.; Di Leo, M.; de Rigo, D.; Caudullo, G. Pinus Halepensis and Pinus Brutia in Europe: Distribution, Habitat, Usage and Threats; San-Miguel-Ayanz, J., de Rigo, D., Caudullo, G., Houston Durrant, T., Mauri, A., Eds.; European Atlas of Forest Tree Species; Publications Office of the EU: Luxembourg, 2016; p. e0166b8.
- Kaynaş, B.Y.; Öney Birol, S. Afforestation of post-fire Pinus brutia Ten forests Effects of Eucalyptus camaldulensis Dehnh P brutia and Pinus pinea L leaf extracts on cell division in P brutia seeds. Allelopathy J. 2020, 49, 125–140. [Google Scholar] [CrossRef]
- Chambel, M.R.; Climent, J.; Pichot, C.; Ducci, F. Chapter 5: Mediterranean pines (Pinus halepensis Mill. and brutia Ten.). In Forest Tree Breeding in Europe; Managing Forest Ecosystems 25; Springer: Dordrecht, The Netherlands, 2013; pp. 229–265. [Google Scholar] [CrossRef]
- Dailysabah. Available online: https://www.dailysabah.com/opinion/op-ed/fires-floods-mucilage-whats-happening-in-turkey (accessed on 20 December 2021).
- San-Miguel-Ayanz, J.; Durrant, T.; Boca, R.; Maianti, P.; Liberta, G.; Artes-Vivancos, T.; Oom, D.; Branco, A.; de Rigo, D.; Ferrari, D.; et al. Forest Fires in Europe, Middle East and North Africa 2019, EUR 30402 EN; Publications Office of the European Union: Luxembourg, 2020; ISBN 978-92-76-23209-4. [CrossRef]
- San-Miguel-Ayanz, J.; Durrant, T.; Boca, R.; Maianti, P.; Liberta, G.; Artes-Vivancos, T.; Oom, D.; Branco, A.; de Rigo, D.; Ferrari, D. Forest Fires in Europe, Middle East and North Africa 2020, EUR 30862 EN; Publications Office of the European Union: Luxembourg, 2021; ISBN 978-92-76-42351-5. [CrossRef]
- Reuters. Available online: https://www.reuters.com/world/middle-east/fire-near-turkish-power-plant-under-control-local-mayor-2021-08-04/ (accessed on 20 December 2021).
- Atak, B.K.; Tonyaloğlu, E.E. Evaluating spectral indices for estimating burned areas in the case of Izmir/Turkey. Eurasian J. For. Sci. 2020, 8, 49–59. [Google Scholar] [CrossRef]
- Veraverbeke, S.; Lhermitte, S.; Verstraeten, W.W.; Goossens, R. Evaluation of pre/post-fire differenced spectral indices for assessing burn severity in a Mediterranean environment with Landsat Thematic Mapper. Int. J. Remote Sens. 2011, 32, 3521–3537. [Google Scholar] [CrossRef] [Green Version]
- Miller, J.D.; Knapp, E.E.; Key, C.H.; Skinner, C.N.; Isbell, C.J.; Creasy, R.M.; Sherlock, J.W. Calibration and validation of the relative differenced Normalized Burn Ratio (RdNBR) to three measures of fire severity in the Sierra Nevada and Klamath Mountains, California, USA. Remote Sens. Environ. 2009, 113, 645–656. [Google Scholar] [CrossRef]
- Veraverbeke, S.; Lhermitte, S.; Verstraeten, W.W.; Goossens, R. The temporal dimension of differenced Normalized Burn Ratio (dNBR) fire/burn severity studies: The case of the large 2007 Peloponnese wildfires in Greece. Remote Sens. Environ. 2010, 114, 2548–2563. [Google Scholar] [CrossRef] [Green Version]
- Key, C.H.; Benson, N.C. Landscape Assessment: Remote Sensing of Severity, the Normalized Burn Ratio and Ground Measure of Severity, the Composite Burn Index; FIREMON: Fire Effects Monitoring and Inventory System, General Technical Report, RMRS-GTR-164-CD:LA1-LA51; USDA Forest Service, Rocky Mountain Research Station: Ogden, UT, USA, 2005.
- Key, C.H.; Benson, N.C. Measuring and remote sensing of burn severity. In Proceedings of the Joint Fire Science Conference and Workshop; University of Idaho and International Association of Wildland Fire: Boise, ID, USA, 1999; Volume 2, p. 284. [Google Scholar]
- Qin, Z.; Karnieli, A.; Berliner, P. A mono-window algorithm for retrieving land surface temperature from Landsat TM data and its application to the Israel-Egypt border region. Int. J. Remote Sens. 2001, 22, 3719–3746. [Google Scholar] [CrossRef]
- Sobrino, J.A.; Jiménez-Muñoz, J.C.; Sòria, G.; Romaguera, M.; Guanter, L.; Moreno, J.; Plaza, A.; Martínez, P. Land surface emissivity retrieval from different VNIR and TIR sensors. IEEE Trans. Geosci. Remote Sens. 2008, 46, 316–327. [Google Scholar] [CrossRef]
- Sekertekin, A.; Bonafoni, S. Land surface temperature retrieval from Landsat 5, 7, and 8 over rural areas: Assessment of different retrieval algorithms and emissivity models and toolbox implementation. Remote Sens. 2020, 12, 294. [Google Scholar] [CrossRef] [Green Version]
- Hagberg, J.O.; Ulander, L.M.H.; Askne, J. Repeat-pass SAR interferometry over forested terrain. IEEE Trans. Geosci. Remote Sens. 1995, 33, 331–340. [Google Scholar] [CrossRef]
- Abdikan, S.; Bayik, C.; Ustuner, M.; Sanli, F.B. Repeat-pass interferometric and backscatter analysis of X-band PAZ satellite–first results. Int. Arch. Photogramm. Remote Sens. Spat. Inf. Sci. 2020, 43, 253–258. [Google Scholar] [CrossRef]
- SNAP v8.0. Available online: http://step.esa.int (accessed on 14 December 2021).
- Shao, Z.; Sumari, N.S.; Portnov, A.; Ujoh, F.; Musakwa, W.; Mandela, P.J. Urban sprawl and its impact on sustainable urban development: A combination of remote sensing and social media data. Geo-Spat. Inf. Sci. 2021, 24, 241–255. [Google Scholar] [CrossRef]
- Breiman, L. Random forests. Mach. Learn. 2001, 45, 5–32. [Google Scholar] [CrossRef] [Green Version]
- Ok, A.O.; Akar, O.; Gungor, O. Evaluation of random forest method for agricultural crop classification. Eur. J. Remote Sens. 2012, 45, 421–432. [Google Scholar] [CrossRef]
- Van der Linden, S.; Rabe, A.; Held, M.; Jakimow, B.; Leitão, P.J.; Okujeni, A.; Schwieder, M.; Suess, S.; Hostert, P. The EnMAP-Box—A toolbox and application programming interface for EnMAP data processing. Remote Sens. 2015, 7, 11249–11266. [Google Scholar] [CrossRef] [Green Version]
- EnMAP-Box Developers. EnMAP-Box 3—A QGIS Plugin to Process and Visualize Hyperspectral Remote Sensing Data. 2019. Available online: https://enmap-box.readthedocs.io (accessed on 8 December 2021).
- QGIS. Available online: http://www.qgis.org (accessed on 12 December 2021).
- Foody, G.M. Status of land cover classification accuracy assessment. Remote Sens. Environ. 2002, 80, 185–201. [Google Scholar] [CrossRef]
- Ustuner, M.; Balik Sanli, F. Polarimetric Target Decompositions and Light Gradient Boosting Machine for Crop Classification: A Comparative Evaluation. ISPRS Int. J. Geo-Inf. 2019, 8, 97. [Google Scholar] [CrossRef] [Green Version]
- Tadono, T.; Ishida, H.; Oda, F.; Naito, S.; Minakawa, K.; Iwamoto, H. Precise global DEM generation by ALOS PRISM. ISPRS Ann. Photogramm. Remote Sens. Spat. Inf. Sci. 2014, 2, 71–76. [Google Scholar] [CrossRef] [Green Version]
- Quintano, C.; Fernández-Manso, A.; Fernández-Manso, O. Combination of Landsat and Sentinel-2 MSI data for initial assessing of burn severity. Int. J. Appl. Earth Obs. Geoinf. 2018, 64, 221–225. [Google Scholar] [CrossRef]
- Nasery, S.; Kalkan, K. Burn area detection and burn severity assessment using Sentinel 2 MSI data: The case of Karabağlar district, İzmir/Turkey. Turk. J. Geosci. 2020, 1, 72–77. [Google Scholar]


| Data Type | Satellite Mission | Acquisition Date(Pre–Post) | Image Channel (Band or Polarization) | Central Wavelength or Frequency | Spatial Resolution (m) |
|---|---|---|---|---|---|
| Optical | Sentinel-2 | 4 March 2019 13 March 2020 | Blue (B2) | 492.4 nm | 10 |
| Green (B3) | 559.8 nm | 10 | |||
| Red (B4) | 664.6 nm | 10 | |||
| NIR (B8) | 832.8 nm | 10 | |||
| Narrow NIR (B8A) | 864.7 nm | 20 | |||
| SWIR (B12) | 2202.4 nm | 20 | |||
| Landsat-8 | 16 March 2019 2 March 2020 | Blue (B2) | 482 nm | 30 | |
| Green (B3) | 561 nm | 30 | |||
| Red (B4) | 655 nm | 30 | |||
| NIR (B5) | 865 nm | 30 | |||
| SWIR 2 (B7) | 2200 nm | 30 | |||
| Thermal | Landsat-8 | 16 March 2019 2 March 2020 | TIR-1 (B10) | 10,800 nm | 100 (Resampled to 30) |
| SAR | Sentinel-1 | 10 March 2019 4 March 2020 | VV (C band) | 5.405 GHz | 2.33 × 13.91 (r × az) |
| VH (C band) | 5.405 GHz | 2.33 × 13.91 (r × az) | |||
| ALOS-2 | 10 March 2019 8 March 2020 | HH (L band) | 1.2 GHz | 4.29 × 3.41 (r × az) | |
| HV (L band) | 1.2 GHz | 4.29 × 3.41 (r × az) |
| Spectral Index | Landsat-8 OLI Equation | Sentinel-2 MSI Equation | Reference |
|---|---|---|---|
| NBR | (B5 − B7)/(B5 + B7) | (B8A − B12)/(B8A + B12) | Key and Benson [50] |
| dNBR | (NBRpre-NBRpost) | (NBRpre-NBRpost) | Miller and Thode [49] |
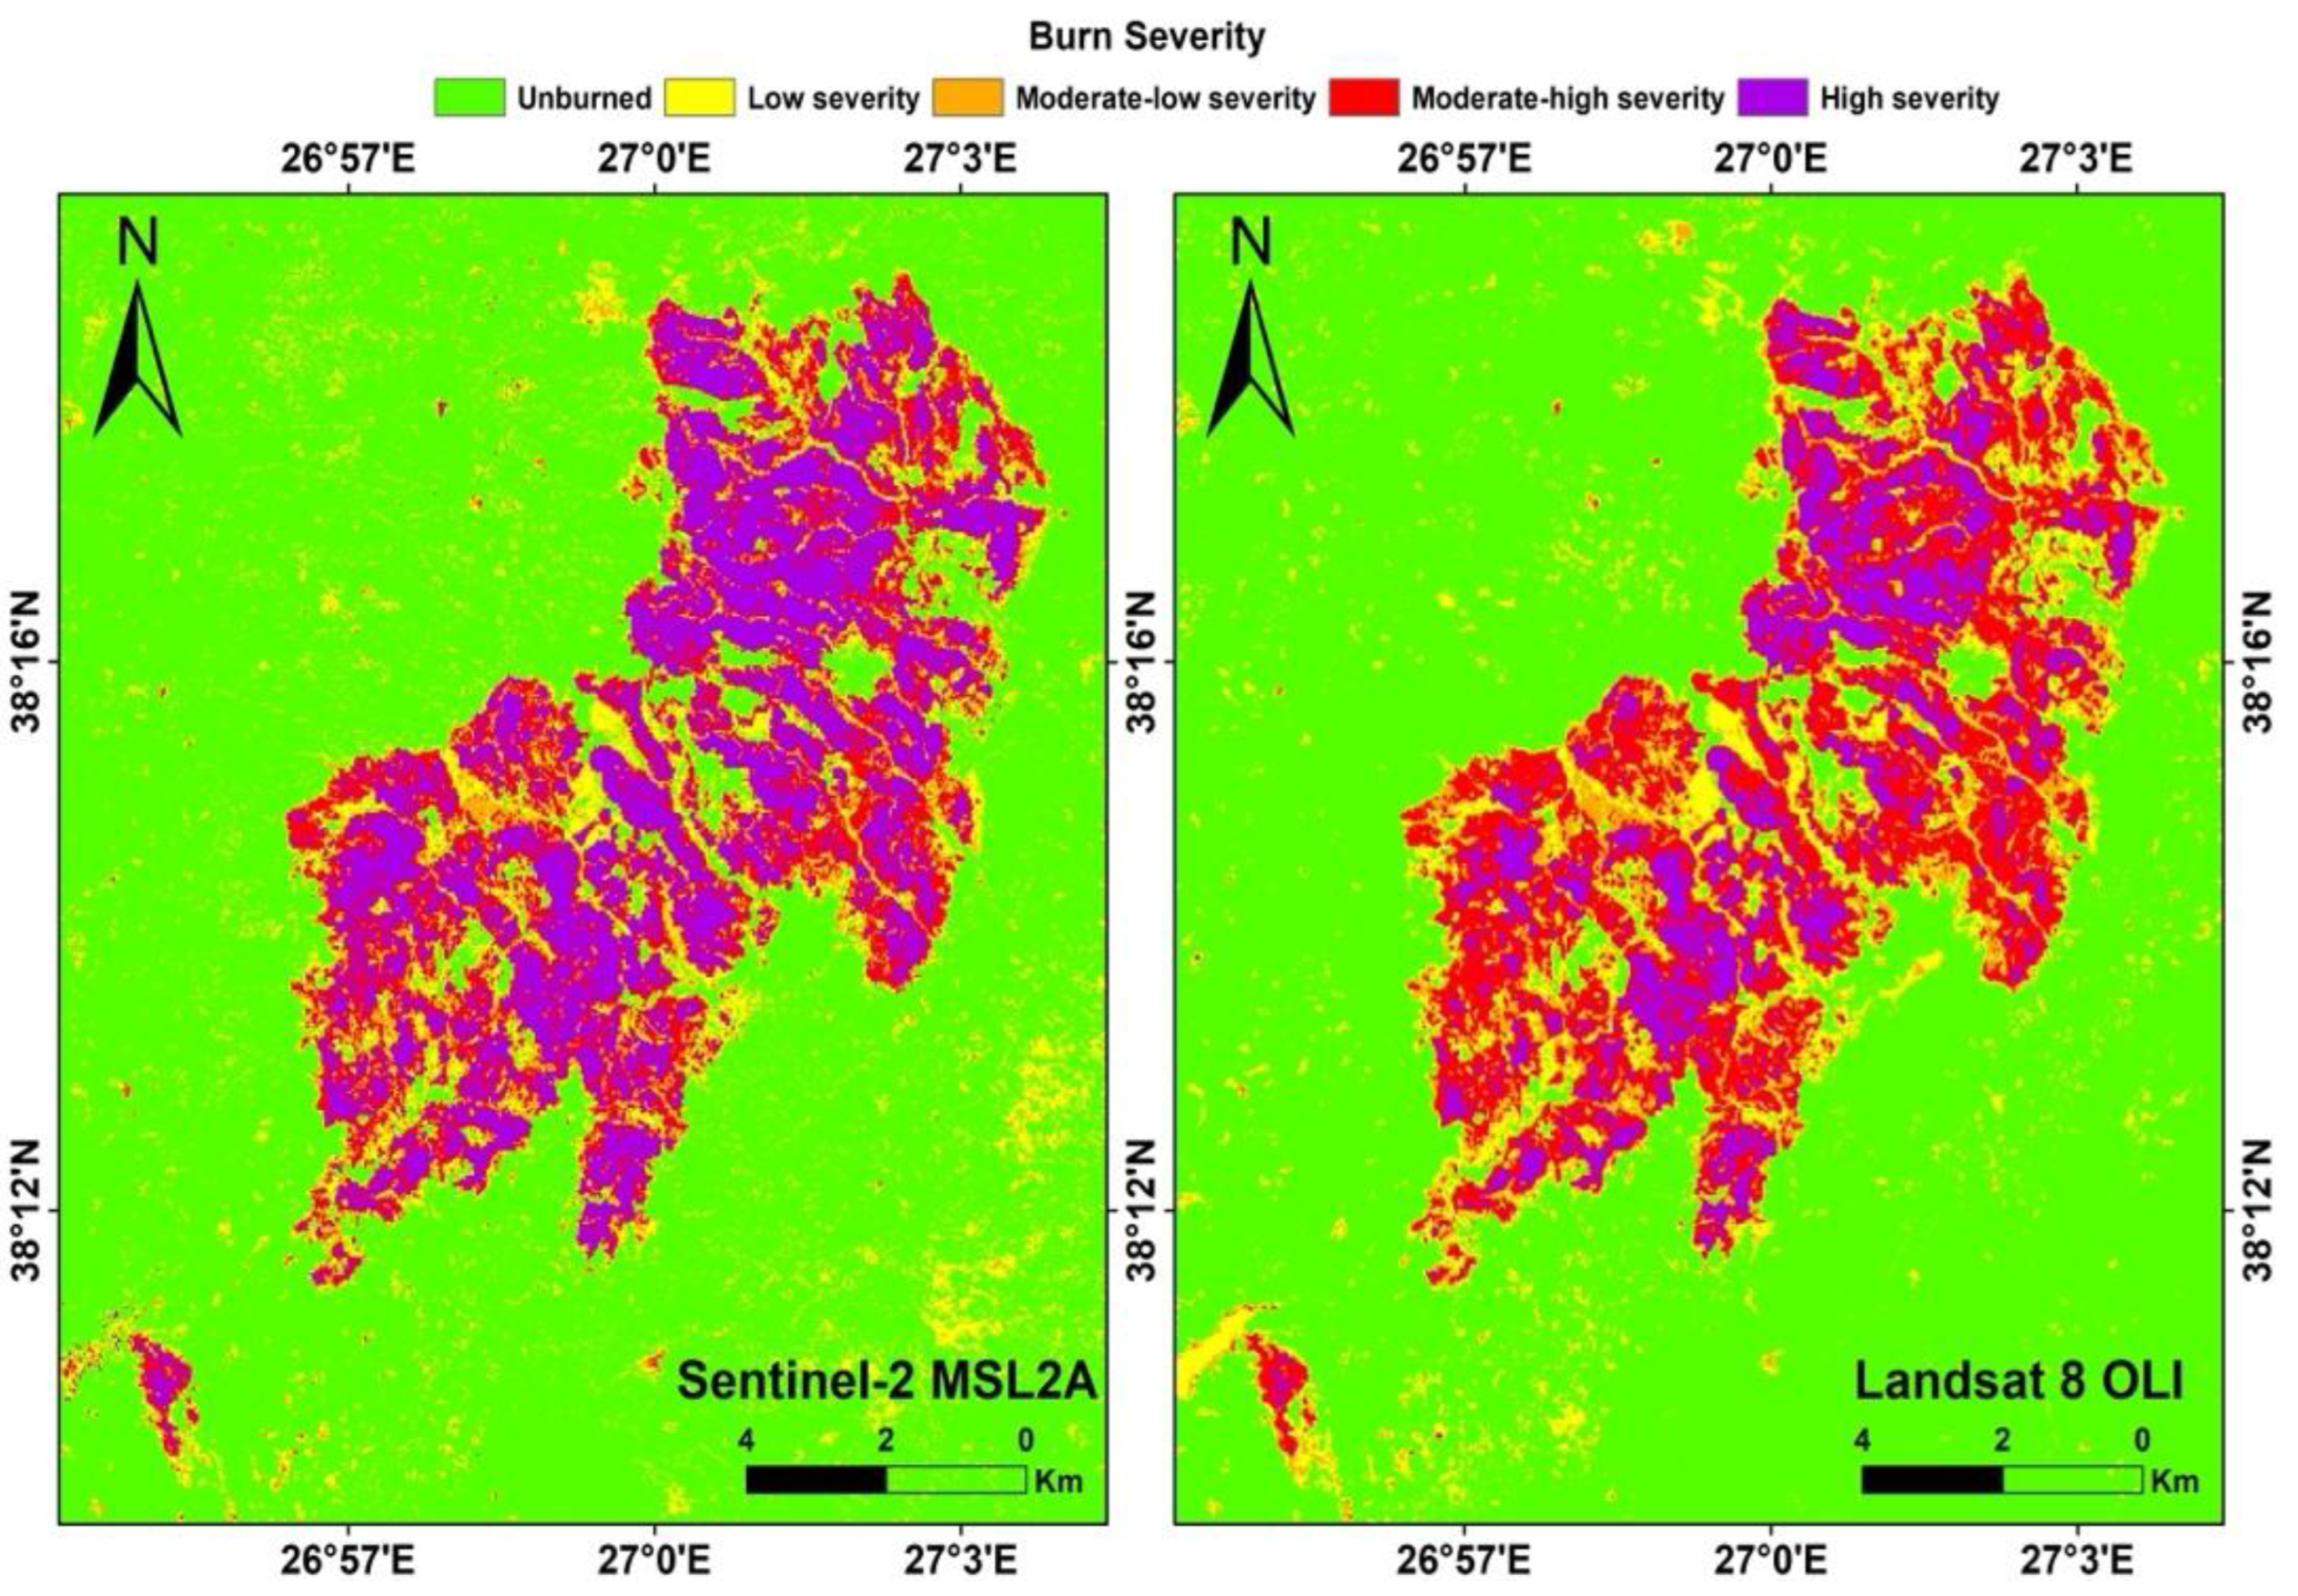
| Severity Level | dNBR Range (Not Scaled) |
|---|---|
| Unburned | <−0.1 |
| Low Severity | 0.1–0.26 |
| Moderate Low Severity | 0.27–0.43 |
| Moderate High Severity | 0.44–0.65 |
| High Severity | >0.66 |
| Scenarios | Features | Scenarios | Features |
|---|---|---|---|
| S1 | S-2 (B2, B3, B4, B8, B12) | S13 | L-8 (B2, B3, B4, B5, B7) |
| S2 | S-2 (B2, B3, B4, B8, B12), S-2 NBR2020 | S14 | L-8 (B2, B3, B4, B5, B7), L-8 NBR2020 |
| S3 | S-2 (B2, B3, B4, B8, B12), dNBR | S15 | L-8 (B2, B3, B4, B5, B7), dNBR |
| S4 | S-2 (B2, B3, B4, B8, B12), dLST | S16 | L-8 (B2, B3, B4, B5, B7), dLST |
| S5 | S17 | ||
| S6 | S18 | ||
| S7 | S19 | ||
| S8 | S20 | ||
| S9 | S21 | ||
| S10 | S22 | ||
| S11 | S23 | ||
| S12 | S24 |
Publisher’s Note: MDPI stays neutral with regard to jurisdictional claims in published maps and institutional affiliations. |
© 2022 by the authors. Licensee MDPI, Basel, Switzerland. This article is an open access article distributed under the terms and conditions of the Creative Commons Attribution (CC BY) license (https://creativecommons.org/licenses/by/4.0/).
Share and Cite
Abdikan, S.; Bayik, C.; Sekertekin, A.; Bektas Balcik, F.; Karimzadeh, S.; Matsuoka, M.; Balik Sanli, F. Burned Area Detection Using Multi-Sensor SAR, Optical, and Thermal Data in Mediterranean Pine Forest. Forests 2022, 13, 347. https://0-doi-org.brum.beds.ac.uk/10.3390/f13020347
Abdikan S, Bayik C, Sekertekin A, Bektas Balcik F, Karimzadeh S, Matsuoka M, Balik Sanli F. Burned Area Detection Using Multi-Sensor SAR, Optical, and Thermal Data in Mediterranean Pine Forest. Forests. 2022; 13(2):347. https://0-doi-org.brum.beds.ac.uk/10.3390/f13020347
Chicago/Turabian StyleAbdikan, Saygin, Caglar Bayik, Aliihsan Sekertekin, Filiz Bektas Balcik, Sadra Karimzadeh, Masashi Matsuoka, and Fusun Balik Sanli. 2022. "Burned Area Detection Using Multi-Sensor SAR, Optical, and Thermal Data in Mediterranean Pine Forest" Forests 13, no. 2: 347. https://0-doi-org.brum.beds.ac.uk/10.3390/f13020347