
Influence of the Canopy Drip Effect on the Accumulation of Atmospheric Metal and Nitrogen Deposition in Mosses

1
Planwerk, Büro für ökologische Fachplanungen, Unterdorfstraße 3, 63667 Nidda, Germany
2
ANECO Institut für Umweltschutz GmbH & Co., Großmoorkehre 4, 21079 Hamburg, Germany
*
Author to whom correspondence should be addressed.
Forests 2022, 13(4), 605; https://0-doi-org.brum.beds.ac.uk/10.3390/f13040605
Submission received: 29 March 2022
/
Revised: 6 April 2022
/
Accepted: 9 April 2022
/
Published: 12 April 2022
(This article belongs to the Special Issue Biomonitoring with Lichens and Mosses in Forests)
Abstract
:Wet, dry, and occult atmospheric deposition may be modified by vegetation canopies. The aim of this study was to verify canopy drip effect studies conducted in 2012, in 2013, and in 2015/2016. For this purpose, 26 moss samples were taken at each of eight monitoring sites of the European Moss Survey 2020/2021 in Germany from a corresponding number of subplots, each representing the site categories “under tree canopy” and adjacent “open land”. The sampling, as well as the chemical analyses, of 12 metals (Al, As, Cd, Cr, Cu, Fe, Hg, Pb, Ni, Sb, V, Zn) and nitrogen (N) and the recording of sample- and site-describing metadata were conducted according to the ICP Vegetation experimental protocol. The results demonstrate an overall higher metal and nitrogen accumulation in moss samples of “canopy” sites compared to neighboring “open land sites” (grassland, heath). The ratios between the “canopy” and “open land” sites of 1.18 to 1.69 and significant correlations of r > 0.8 in case of five elements agree well with corresponding values from samplings in 2012, 2013, and 2015/2016. These results should be used for modeling atmospheric deposition aiming at more realistic results. With regard to the question of whether, and to what extent, moss samples should preferably be taken from “open land” or “canopy” sites, the following can be concluded: The recommendations of ICP Vegetation with regard to the minimum distance to be maintained from trees and shrubs should not be interpreted to mean that “open” sites are fundamentally more suitable for moss sampling in Germany than, for example, clearings in forests. The mostly higher variability of the measured values compared to the “canopy” sites rather suggests that in the open country a much higher number of influencing factors could be significant for the element accumulation in mosses in addition to the background pollution through atmospheric deposition. This is also supported by the fact that the metal contents in the moss samples of the “open” sites can clearly exceed those of the neighboring “canopy” sites in individual cases. With regard to “open” land, grassland sites seem to be less suitable for moss sampling than bog and heathland sites. In grassland, moss occurrences are often sparser and/or cut short by meadow mowing, so that the removal of three-year shoots on grassland, as recommended by ICP Vegetation, must be replaced in places by one-year shoots. The comparatively higher state dynamics of grassland sites also make the resampling of moss at previously sampled sites more difficult.
1. Introduction
Forests have a significantly stronger filtering effect for atmospheric particles and gases in the plant organs and in the understory occurring below them than smaller, horizontally and vertically less-structured vegetation units [1,2,3,4,5]. This leads to increased atmospheric deposition into forests and woody plants due to the large surface area and the resulting impaction/filtering, which plays a significant role for atmospheric deposition at canopy sites [6]. The small-scale horizontal and vertical variability of the vegetation structure at moss sampling sites can significantly influence atmospheric deposition and, thus, also accumulation of atmospheric deposition in mosses. Corresponding quantitative findings are of crucial importance for making the results of deposition modeling more realistic. However, very few studies are available [4,7,8,9,10,11,12,13,14,15,16,17].
Previous studies on moss monitoring in 2015 identified the leaf area index (LAI) on the sampling plots as a significant predictor of accumulation of atmospheric deposition in mosses [4,12,14]. However, estimates of LAI based on surrounding land use and tree and shrub layer cover [18] were subject to considerable uncertainty in these studies.
The aim of this paper was to develop an improved basis for studies on the canopy effect at moss sampling sites and the statistical relationship between the LAI and substance accumulation in mosses. For this purpose, in a first step, moss samples were taken from different canopy drip and open land sites in the northwest German part of the European Moss Survey (EMS), and subsequently 12 metals (Al, As, Cd, Cr, Cu, Fe, Hg, Pb, Ni, Sb, V, Zn; for terminology, refer to [19]) and nitrogen were determined in the moss specimens. In addition to the recommendations of ICP Vegetation [20], further sample- and site-describing parameters were collected in the field (so-called metadata), which were expected to allow a more accurate estimation of the LAI. In addition, the collected measurement data were statistically evaluated and the question was addressed as to whether, and to what extent, the location of the moss sampling at canopy drip or open land sites influenced the level of metal and nitrogen content in mosses, and whether the results of this study were consistent with previous findings [4,8,9,10,11,12,13,14,15].
2. Materials and Methods
2.1. Moss Sampling and Chemical Moss Analysis
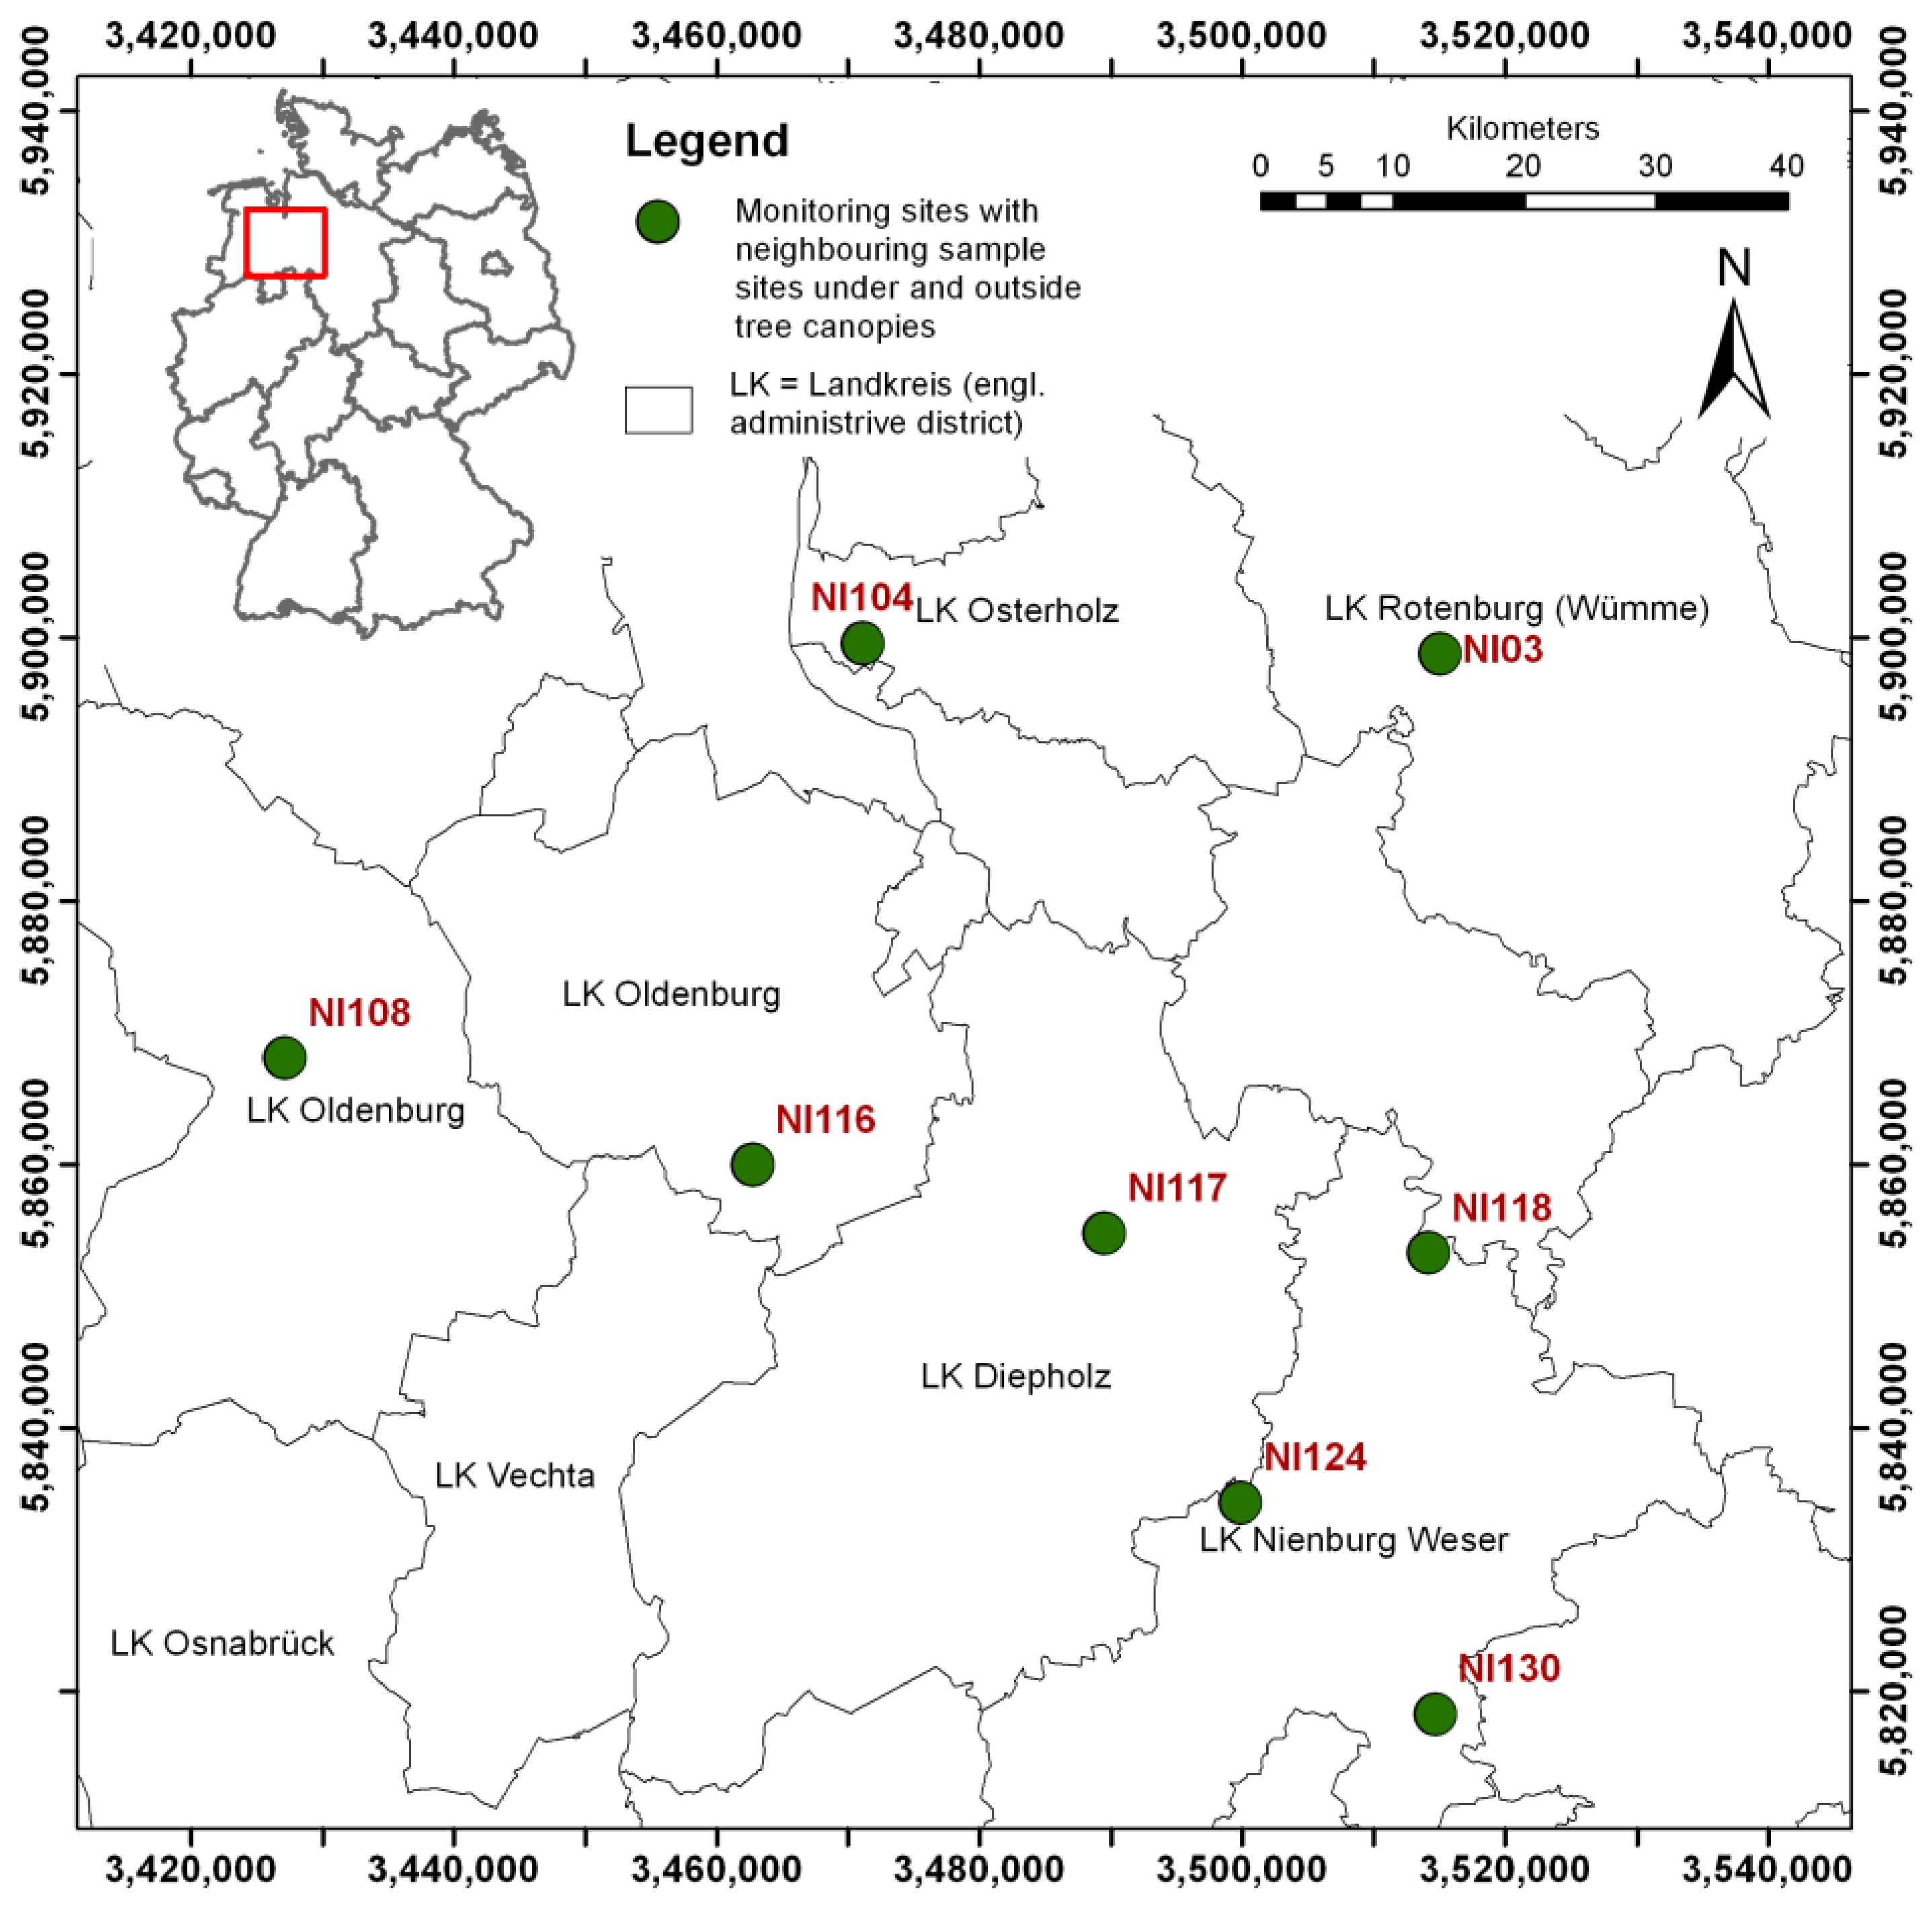
In the northwest German part of the European Moss Survey 2020/2021, moss samples were collected from 26 open land and canopy drip influenced plots at eight monitoring sites for the analysis of 12 metals and nitrogen. Furthermore, all sample- and site-describing metadata were recorded according to the specifications of the Moss Manual [20] and supplemented with relevant parameters for the estimation of the LAI. The sites were selected on the basis of aerial photo information, which showed a largely homogeneous environment of the sampling sites in terms of use. The locations of the eight monitoring sites are shown in Figure 1.
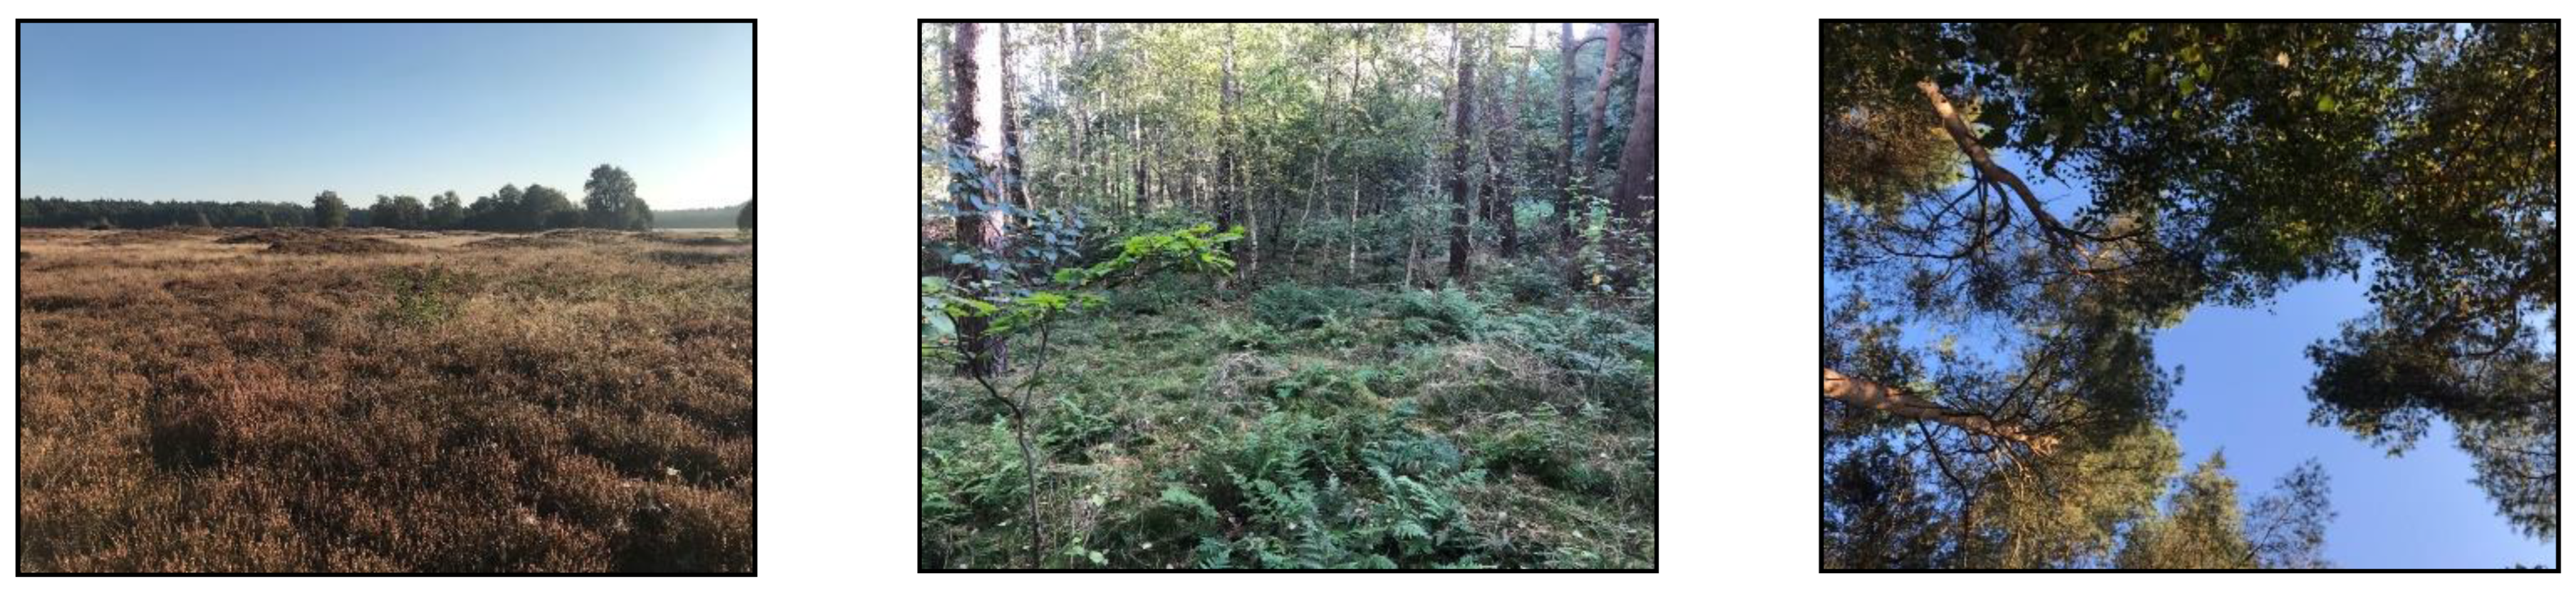
At each of the eight sites, moss samples were taken from neighboring sites of different categories (open land, canopy drip) according to the specifications of the Moss Manual [20] (Figure 2). Sampling sites from previous campaigns were only resampled if they showed homogeneous vegetation structures or new sites were selected on site.
For the estimation of LAI at moss sampling sites, the following parameters were added in addition to the sample and site descriptive metadata according to ANNEX 2 of the Moss Manual [20]:
- Cover of the tree and shrub layer (%);
- Woody species and their proportions in the tree and shrub layer (%);
- Age of the main tree species.
All moss samples were collected between 8 October and 12 October 2021 within the timeframe recommended in the Moss Manual [20] (1 May to 31 October) and according to all other specifications. Up to five sampling plots were sampled per monitoring site in order to investigate as many relationships as possible between open space and canopy drip sites. The 26 moss samples were taken using PE gloves, stored in 1 L LDPE Ziplock bags and sent to ANECO GmbH & Co within 2 days for further processing.
As a result, samples were taken from a total of 9 open sites (heathland, grassland) and 17 coniferous/mixed and deciduous forest sites with seven different main tree species (Table 1). Since leaf area index variability is generally greater in forests than in open land areas, samples were taken from a larger number of canopy drip sites. Half of the moss samples taken were distributed between the moss species Pleurozium schreberi (Brid.) Mitt. (Plesch) and Pseudoscleropodium purum (Hedw.) M. Fleisch. (Psepur). Hypnum cupressiforme Hedw. s. str. as another species on the priority list of the manual [20] was not collected—unlike in the previous campaign. On four sampling plots, the moss occurrence was so sparse that the recommended moss volume of 1 L was not reached. On average, six, but at least four, subsamples were taken per plot. The mosses were collected from the soil throughout. At two grassland sites (NI117_123, NI118_125), the moss samples had visible particles, i.e., they could not be collected from the soil without adhering sandy substrate. At site NI03_92, there were virtually no three-year shoots present due to the cutting of the meadow.
Meaningful photos were taken of the sampling sites and georeferenced using Exif geotags (decimal degrees, WGS 84). All “metadata” were collected using the MossMetEU web application. The specifics on the emission sources in the vicinity, as well as all further information on the tree and shrub cover (%), the woody species and their proportions in the tree and shrub cover (%), and the tree age, were described textually in the comments field. The distance to possible emitters could usually be determined very well with the help of aerial photographs.
After sampling, the moss samples were prepared for the analytical process in such a way that adhering material (e.g., grass, needles, leaves, soil particles, etc.) was removed. The moss samples were not washed. Green and green–yellow moss shoots were separated from the rest of the sample using cleaned ceramic scissors and Teflon tweezers.
For analysis, samples were dried at 60 °C and homogenized using a cutting mill (Retsch SM 200). Nitrogen was determined using the combustion method according with a nitrogen–carbon analyzer (Elementar Vario Max). Approximately 0.3 g of the sample was burned in a stream of oxygen at high temperature. Nitrogen oxides that were formed were reduced to elementary nitrogen and detected using a thermal conductivity detector (TCD). For the analysis of the metals, approximately 0.5 g of the dried moss samples were extracted using microwave-assisted pressure digestion (Microwave MARSXpress CEM) and included with 5 mL of 65% nitric acid and 1 mL of 30% hydrogen peroxide after a prereaction of approximately 1 h at a maximum of 1800 W and a constant temperature of 200 °C. The instrumental determination of Al, As, Cd, Cr, Cu, Fe, Ni, Pb, Sb, V, and Zn was carried out using an ICP-MS (Agilent 7900 with sample loop). The analysis of mercury was carried out according using cold vapor AAS (Mercur) after reduction with tin(II) chloride without enrichment.
With each sample series, a blank sample and moss standard (M2 or M3) [21] were digested to check recovery and performance. The moss standard samples consisted of residual material from the 2015 moss monitoring, which had been stored at room temperature in the dark in PE centrifuge tubes. The recoveries for the heavy metals other than mercury ranged from 86% (iron) to 108% (aluminum) for M2 and from 88% (nickel) to 125% (antimony) for M3. The recoveries for mercury reached 158% (M2) and 150 and 195% (M3). This overestimation could not be explained.
2.2. Statistical Data Evaluation
In total, the metal and nitrogen contents in mosses of 9 open space sites and 17 canopy drip sites were evaluated according to [20].
2.2.1. Descriptive Statistics
For the 12 metals and nitrogen, descriptive statistical parameters (sample size, minimum, 20th, 50th, 90th, and 98th percentile, maximum, mean, standard deviation, and relative coefficient of variation) were first determined for each site category (canopy drip, open space). The series of measured values were then examined for outliers on a site-specific basis using the 1.5 * IQR (interquartile range) rule [20]. The illustration of the data distributions—with and without outliers—was performed by means of box plots.
2.2.2. Inferential Statistics
For all 13 elements, an inferential statistical test for site-specific differences in median values followed, using all possible combinations of values between neighboring open land and canopy drip sites (n = 20). The median values and their differences (as ratios) were determined element-specifically—in each case with and without outliers—and then a two-sided Wilcoxon pair difference test [17] (p. 464) was used to test whether the median values in the data differed significantly when comparing the two site categories. Based on the significance values, the median value differences determined were classified as weakly significant (p < 0.1), significant (p < 0.05), and very significant (p < 0.01). The significance level of p < 0.1 was added to make the test more sensitive for detecting differences. However, it should be emphasized that this also increases the probability of a false positive result from 5% to 10%.
2.2.3. Estimation of the Leaf Area Index
For the statistical analysis of the relationships between the substance concentrations in the mosses and the surrounding vegetation structure, the leaf area index (BFI—Blattflächenindex, LAI—leaf area index) was used as a quantitative measure of vegetation structure, following [4], and derived from existing data or literature values using different methods:
- Land-use-specific simple leaf area index (sLAI.lu): From the data collected in 2021 on the surrounding land use (approximately 200 m radius around the sampling site), a simple land-use-specific leaf area index (sLAI.lu) was estimated using literature values for the seasonal leaf area [22] (p. 27) and we derived from this as an annual mean value: coniferous forest = 11.0, mixed forest = 7.08, deciduous forest = 5.79, moor and heath = 3.63, meadows and pastures = 2.96, other = 3.63. This corresponds to the method for estimating the simple leaf area index described in [4].
- Land-use-specific and cover-weighted leaf area index (wLAI.lu): By adding the cover of the tree layer (TC), a weighted land-use-specific leaf area index (wLAI.lu) was estimated according to the procedure also described in [4] (Equations (1) and (2)). For this purpose, the simple leaf area index (sLAI.lu) was used for all open space sites for the area uncovered by trees (100 − TC) and an LAI of 7.08 (mixed forest [22] (p. 27)) was assumed for the area covered by trees (TC) and weighted according to the degree of cover in each case. For all canopy sites, vice versa, the simple leaf area index (sLAI.lu) was used for the area covered by trees (TC) and a LAI of 2.96 (meadows and pastures) was assumed for the uncovered area share (100 − TC). TC was derived here as the mean value of the upper- and lower-class limits for the tree layer cover, ordinally scaled according to [20].Weighted leaf area index (open space site): wLAI = ((100 − TC)/100) × sLAI + (TC/100) × 7.08Weighted leaf area index (canopy drip site): wLAI = ((100 − TC)/100) × 2.96 + (TC/100) × sLAI
- Vegetation-specific simple leaf area index (sLAI.veg): The procedure corresponds to the procedure described under No. 1 for the sLAI.lu with the difference that the leaf area index according to [23] was not used from the information on the surrounding land use, but from the vegetation data collected in 2021 (at the sampling site): coniferous forest = 11.0, mixed forest = 7.08, deciduous forest = 5.79, heathland = 3.63, grassland = 2.96, other = 3.63.
- Tree species-specific simple leaf area index (sLAI.spec): In addition to the site- and sample-describing “metadata” according to ANNEX 2 of the Moss Manual [20], further information on the cover of the tree and shrub layer (%) and on the woody species in the tree and shrub layer, including their percentage shares, as well as on the age of the main tree species at each moss sampling plot, was collected in the 2021 campaign. From this, a tree species-specific simple leaf area index (sLAI.spec) was estimated for all canopy drip sites using information from the decision support system “Forest and Climate Change” (DSS-WuK) [23]. For this purpose, specific modeled leaf area indices for the tree species spruce, pine, Douglas fir, beech, and oak can be taken from the DSS-WuK as a function of tree age. For birch, the LAI values of oak, and for larch those of pine, were additionally used. The leaf area indices thus determined for the individual tree species were then weighted according to the percentage share of the respective tree species. For the open space sites, the vegetation-specific simple leaf area indices (sLAI.veg) were used as in point 3, with heath = 3.63, grassland = 2.96, and other = 3.63 [23].
- Tree species-specific and cover-weighted leaf area index (wLAI.spec): The weighted wLAI.spec was determined according to the method described in Section 2, using the simple tree species-specific leaf area index (sLAI.spec) and, in addition, the cover (%) estimated metrically in the field instead of the cover scaled ordinally according to ANNEX 2 of the Moss Manual [20].
2.2.4. Correlation Analysis
The analysis of the statistical relationships between the substance concentrations in the mosses and the leaf area index on or in the vicinity of the sampling plots is based on the pairwise combinations of the two site categories (canopy drip/open space plot). An additional inverse (open space/canopy drip) was aimed at expanding the range of interrelated characteristics. For each plot pair and element, the respective ratio of substance concentrations in the moss was calculated for the pairwise combinations of the two site categories (e.g., Cd content in moss collected under the canopy of site NI117 divided by the value of the assigned open land site). Accordingly, the expressions of the above-mentioned six characteristics of the vegetation structure of all site pairs were also placed into relation (e.g., cover of the sampling site below the canopy of site NI117 divided by the cover of the area in the open land area at site NI117).
For the correlation analysis and the subsequent regression analysis, conspicuously high values were eliminated from the entire data collective 1 (data collective 2), as they only reflect the background load from atmospheric deposition to a limited extent. This applies in particular to the concentrations of individual metals at sites NI117_123 and NI_118_125, where a strong influence of soil contamination of unknown origin on the measurement results is suspected. The correlation coefficients were interpreted following [24] as very weak (<0.2), weak (0.2 to <0.4), medium (0.4 to <0.6), strong (0.6 to <0.8), and very strong (≥0.8).
2.2.5. Regression Analysis
All relations between the substance concentrations in the mosses and the leaf area index with the highest correlations were quantified by linear regression. The residuals were analyzed for symmetry using a quantile/quantile plot (QQ plot) and for variance using a residual standard error (RSE). The quality of the model resulting from the regression analysis was assessed using the coefficient of determination (B or R2) as the square of the Pearson correlation coefficient and the adjusted coefficient of determination (adjusted R2). Both parameters describe the proportion of the variance that can be explained by linear regression [17]. Since both quality measures generally represent rather optimistic estimates of the explanatory power when using the same dataset for model building and validation, a pseudo coefficient of determination (Pseudo R2) was also determined (Equation (3)).
with:
x = observed values;
y = modeled values;
Sxy = covariance of x and y;
Sx = standard deviation of x;
Sy = standard deviation of y.
The pseudo R2 was calculated as the square of Pearson’s correlation between modeled and observed values [25]. In order to minimize generally known limitations in the use of such pseudo-determinism measures for the assessment of model quality [26], the total dataset was divided into three equally sized, randomly selected sub-datasets. Three times, 2/3 of the total dataset was used to build the statistical model, 1/3 for model validation, and then the three pseudo R2 were averaged following [27]. The coefficients of determination (R2, adjusted R2, pseudo R2) were finally used to select the predictors with the best fit of the models to the data used.
3. Results
The results of the metal and nitrogen analyses for the moss samples collected from 26 plots at 8 sites in northwest Germany in 2021 comprise 26 element- and site-specific data distributions with a total of 338 measured element concentrations in moss, which were methodically harmonized according to the specifications of the Moss Manual [20] and are thus of high quality (Supplementary Materials Table S1). Within these series of measured values, 25 outlier values stand out, which clearly differ from the other concentration values (16 outliers at open land plots, 9 at canopy plots). They occur for all metals, but not for nitrogen, and are exclusively above the IQR (Figures S1 and S2). In detail, the open land site NI117_123 shows significantly elevated concentrations for a total of eight metals (Al, As, Cd, Cr, Fe, Ni, Pb, V). In addition, at the open land sites NI118_123 (Cr, Ni), NI108_100 (Hg) and NI124_139 (Hg, Sb) as well as at the hillside sites NI116_122 (Zn), NI116_123 (As, Pb), NI117_124 (Cu, Hg, Zn), and NI130_162 (As, Cr, V), individual measured values clearly stand out from the remaining structure of the respective measured value distribution. Contrary to expectations, the extreme values of open land sites are often higher than the measured values of the respective neighboring canopy drip sites.
3.1. Descriptive Statistics
The descriptive statistical characteristic values of the metal and nitrogen contents were each grouped according to open space and canopy drip sites. The ranking of the element-specific median values related to the two site categories gives the following picture: For all 12 metals and nitrogen, the median values of the substance concentrations in the mosses of the canopy drip sites (n = 17) are above those of the open land (n = 9). With the exception of As and Cr, the element- and site-specific minimum is found, as expected, in the samples from the open land. The respective maximum, on the other hand, with the exception of Cu, Zn, and N, is not found in the canopy drip sites, as expected, but also in the open country. Correspondingly, the variances in the data distributions of the open land sites are also higher for all metals, with the exception of Cu, Zn, and N, than for the canopy sites. Particularly high relative coefficients of variation >100% are found in the open country for Al, As, Cr, Fe, Hg, Ni, and V.
3.2. Inferential Statistics
The element- and site-specific comparison of the median values of the substance concentrations based on all possible value combinations between the neighboring canopy drip sites (T) and open space sites (F) (n = 20) results in very significant (p < 0.01) median value differences for 4 of the 13 elements (Cu, Hg, Zn, and N) and weakly significant ones (p < 0.1) for 2 elements (Cd and Sb) (Table S3, Figures S1 and S2). The median ratios (T/F) for these 6 elements range from 1.18 (Sb) to 1.50 (Hg), i.e., for 6 of the 13 elements, the median concentrations of substances in the moss samples from the canopy sites are significantly 20 to 50% higher than in the samples from open land sites.
If the outliers marked in Table S1 are eliminated from the entire dataset, there are very significant median value differences (p < 0.01) for 7 of the 13 elements (Cd, Cu, Hg, Ni, Sb, Zn, and N), significant for one element (Al) and weakly significant for another element (Cr) (Table S4, Figures S3 and S4). The range of the median value ratios (T/F) for these 9 of the 13 elements after removing the outliers is between 1.18 (Sb) and 1.69 (Cd).
3.3. Correlation Analysis
The analysis of the correlations between the quotients of the substance concentrations in the mosses sampled from open space and canopy drip sites (12 metals, nitrogen) and the corresponding quotients of the leaf area indices estimated with different methods, results—with the exception of As—in significant medium to very strong correlations between 0.4 and 0.92 (<0.05) for all elements investigated (Table S5). The leaf area index determined on the basis of tree species and tree age correlates more strongly with the substance concentrations than the values for the LAI derived from the surrounding land use and vegetation. Thus, the tree species-specific LAI provides very strong correlations for four elements (Al, Cu, Sb, N) and still strong correlations for another four elements (Cd, Hg, Ni, Pb), while the vegetation-specific LAI shows very strong correlations only for two elements (Cu, N) and strong correlations for four elements (Al, Cd, Hg, Sb). The land-use-specific LAI shows very strong correlations only for Cu and strong correlations for five other elements (Al, Cd, Hg, Sb, N).
The LAIs derived from the surrounding land use mostly show somewhat higher correlation coefficients when weighted according to the degree of cover of the tree layer than without weighting. In contrast, there are hardly any differences between the estimates with and without weighting for the LAIs determined specifically for vegetation and tree species. The concentrations of five elements (Al, Cd, Fe, Pb, V) correlate more strongly with the weighted tree species-specific LAI and of seven elements (Cr, Cu, Hg, Ni, Sb, Zn, N) more strongly with the simple tree species-specific LAI.
The highest significant correlations (p < 0.01) between the quotients of the leaf area indices and the quotients of the substance concentrations are found for Cu (rs = 0.92), followed by N (rs = 0.87), Al (rp = 0.85), and Sb (rs = 0.84), in each case using the tree species-specific LAI. The correlation coefficients of the simple tree species-specific and the weighted tree species-specific LAI differ only very slightly. For the following regression analyses, therefore, only the LAI determined for the specific tree species was used, without weighting according to the degree of cover of the tree layer.
3.4. Regression Analysis
The results of the regression analysis and the statistical modeling for the relationships between the 12 metals or nitrogen and the leaf area index are as follows: For the analysis and modeling, 28 to 40 pairs of values were available for each of the 13 elements. A linear, monotonic, progressively increasing relationship was assumed between the target variables and the predictors. The quotient of the simple tree species-specific LAI without weighting of the tree layer cover (sLAI.spec) was chosen as predictor. For Al, Cu, Hg, Sb, Ni, and N, regression models with quality measures of >0.5 (pseudo R2) are obtained. For Cr and Pb, the coefficient of determination is between 0.4 and 0.5, for Cd, Fe, and Zn, between 0.3 and 0.4, and for As and V, below 0.3 (Table S6).
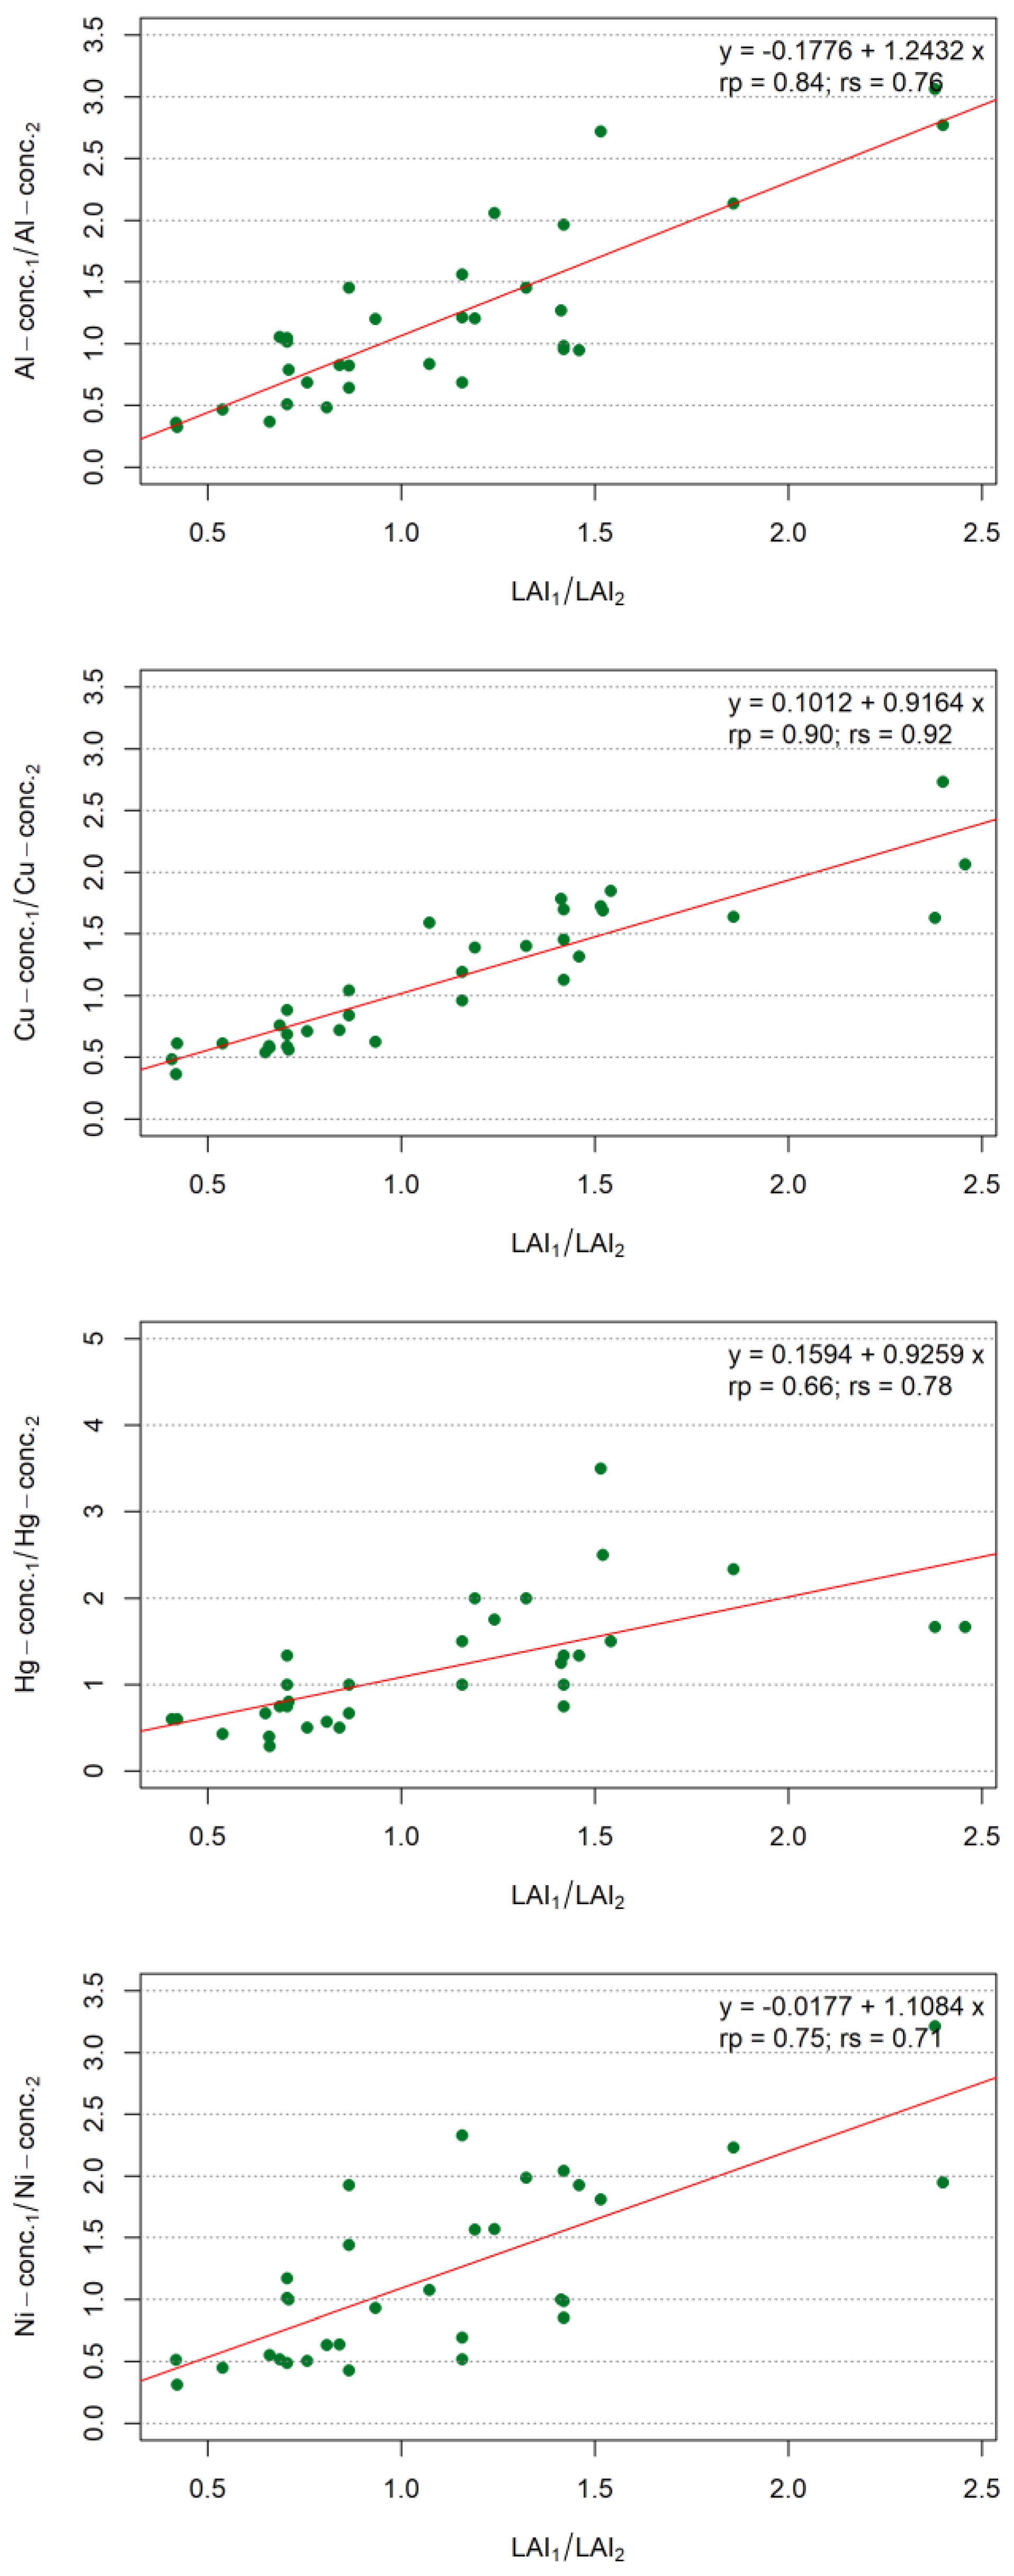
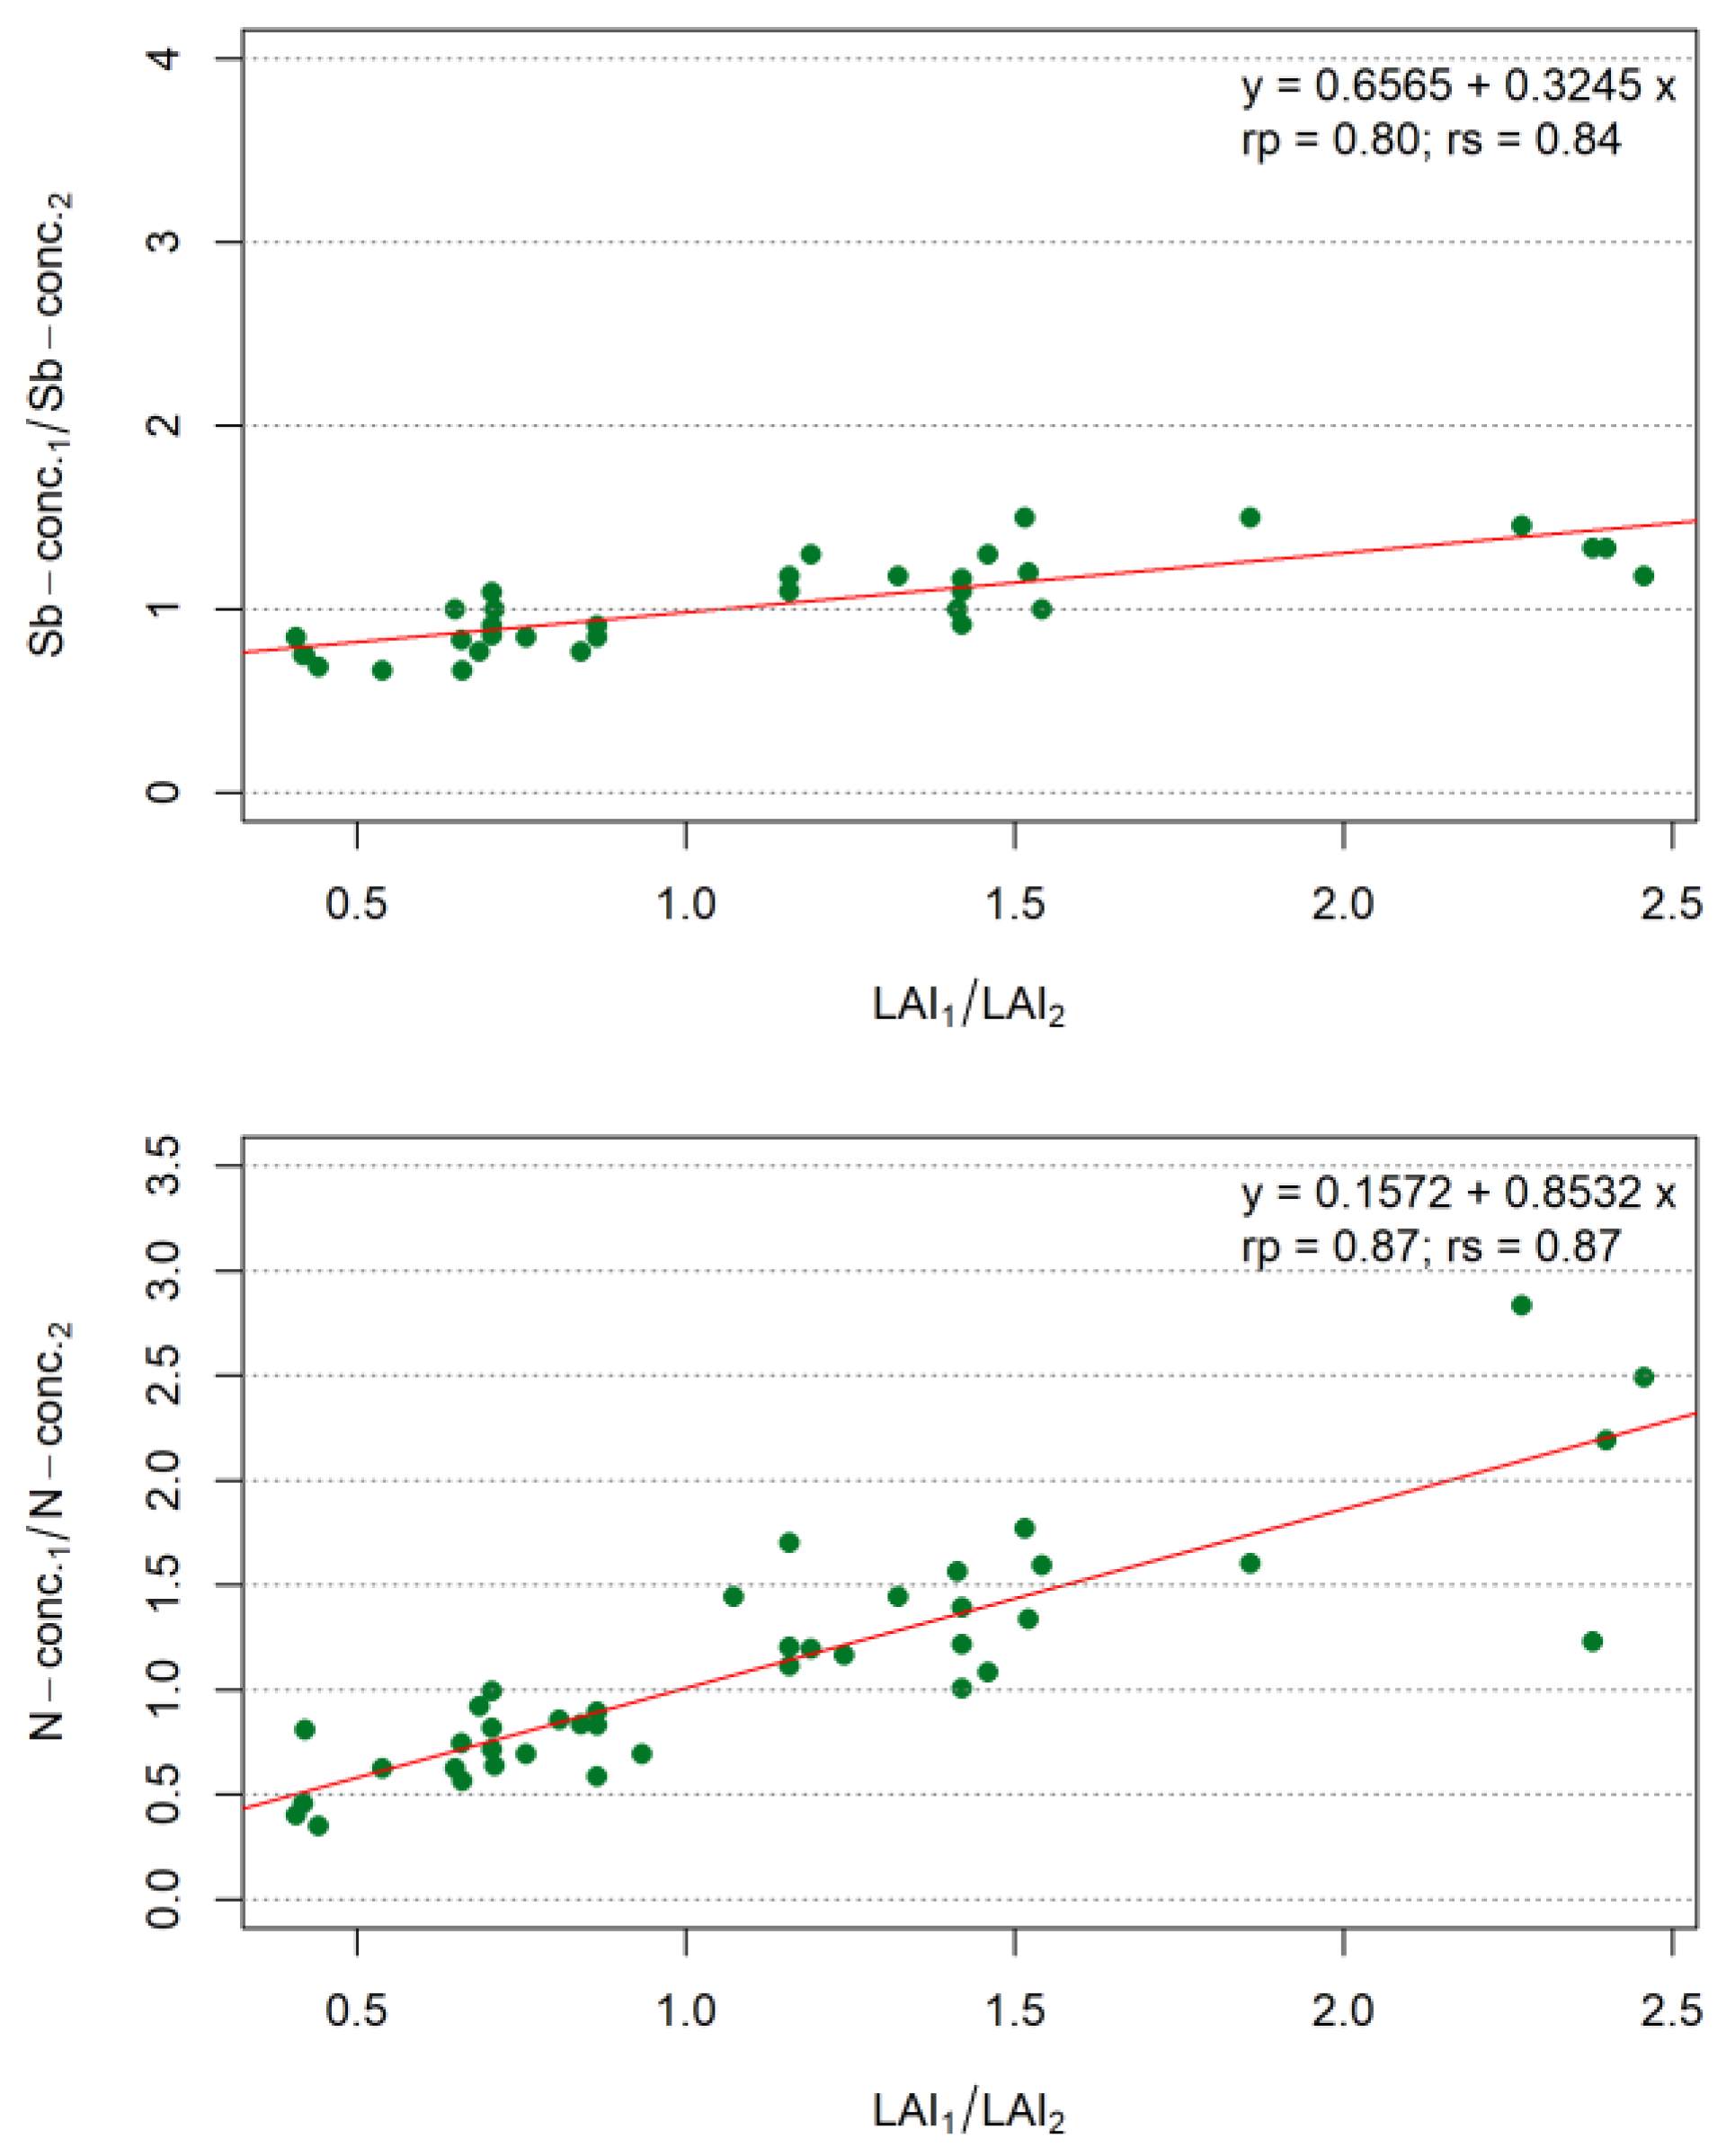
The regression equations for the linear models with R2 > 0.5 are shown in Figure 3. The validity ranges of the models specified for Al, Cu, Hg, Sb, Ni, and N lie in a range of 0.3 < sLAI.spec-quotient < 2.5 and are limited to site combinations between grassland, heath, deciduous, mixed, and coniferous forest sites.
4. Discussion and Conclusions
The results of the inferential statistics again prove an overall higher metal and nitrogen accumulation in the moss samples of canopy drip sites (deciduous, mixed, and coniferous forests and copses) compared to neighboring open land sites (grassland, heath). The observed ratios between the canopy drips and open land sites of 1.18 to 1.69 overall agree well with results of corresponding studies from 2012, 2013, and 2015/2016 [4,8,9,10,11,12,13,14,15] (Table 2). In this context, the data collective 2 (measured values after removal of the outliers) results in overall smaller differences than the previous findings compared to data collective 1. The statistically significant median value ratios for Al and Cd deviate by less than 10%, and for Cu, Zn, and N by 10 to 20% from the findings of the previous studies. For Pb, the previous finding is confirmed with a significance value p of just above 0.1 [9]. For Hg and Ni, significantly higher metal concentrations are again found under the canopy of trees, but the relations to the measured values at open land sites deviate more clearly from previous findings. For As and Cr, the median value differences in both studies prove to be not, or only slightly, significant.
With regard to the question of whether, and to what extent, moss samples should preferably be taken from open land or canopy drip influenced plots, the following can be concluded from this study: The recommendations of the Moss Manual [20] with regard to the minimum distance to be maintained from trees and shrubs should not be interpreted to mean that open land plots are fundamentally more suitable for moss sampling in Germany than, for example, clearings in forests. The mostly higher variability of the measured values in comparison to the canopy sites rather suggests that in the open country a much higher number of influencing factors could often be significant for the substance accumulation in the mosses in addition to the background pollution by atmospheric deposition. This is also supported by the fact that the metal contents in the moss samples of the open space sites can clearly exceed those of the neighboring ridge sites in individual cases. With regard to open land use, grassland sites seem to be less suitable for moss sampling than moorland and heathland sites. In grassland, moss occurrences are often sparser and/or cut short by meadow mowing, so that the removal of three-year shoots on grassland sites recommended in the Moss Manual [20] must be replaced in places by one-year shoots. The comparatively higher state dynamics of grassland sites also make it difficult to resample the moss occurrences at the previously sampled sites. The strikingly high number of metal contents clearly above the measured value series, especially in the two samples polluted by adhering sandy substrate (NI117_123, NI_118_125), also suggests that moss samples should be taken without adhering soil particles if possible, but mosses in grassland can often only be picked up directly from raw soil sites, while in heath sites with at least three-year shoots, they are often found between the dwarf shrubs.
For Cu, Zn, and N, in addition to the scouring effect of trees and shrubs, the vegetation factor demonstrated by [21] could also contribute to increased substance contents in the mosses of canopy sites. According to this, Cu, Zn, and N as plant nutrients are taken up by the woody plants from the soil via the roots, transported into the leaves and needles, released as litter onto the moss cushions, and partly co-measured. Accordingly, the maxima of the Cu, Zn, and N concentrations in northwest Germany were not found at open land plots, as is the case with the other elements, but at canopy drip plots.
It should also be noted that the division into canopy drips and open sites is based on categories whose boundaries may be, in reality, continuous in terms of vegetation structure. The leaf area index as a quantitative parameter, on the other hand, makes it possible to arrange the different moss sampling sites along a continuous gradient of vegetation structure and to relate them to the corresponding substance concentrations in mosses. The leaf area index can be estimated from the “metadata” according to ANNEX 2 of the Moss Manual [20] using literature values from [22] or using additional information on tree species and tree age presented by [23].
As a result, the correlation and regression analyses again prove the leaf area index to be a suitable indicator of the canopy effect for a number of metals and nitrogen. The higher the leaf area per soil surface, the higher the scouring/filtering effect of trees and shrubs, which has a significant influence on atmospheric deposition in the canopy and thus on substance accumulation in the mosses growing there. The results show strong to very strong statistical correlations between the ratios of the leaf area indices and the substance concentrations in the moss samples of neighboring open space and canopy drip sites (Cu > N > Sb > Al > Hg > Ni > Cd > Pb) for eight of the thirteen elements investigated. This corresponds roughly to the element series for which significant median differences in substance concentrations were also found in the moss samples from neighboring open space/canopy drip sites (A.5). Conversely, where there are no significant differences in median values, there are usually no significant correlations between the leaf area index and the substance concentrations, i.e., for the contents of As, Cr, Fe, and V in the moss, the combing/filtering effect of woody plants seems to be less significant. This is also supported by the finding that the minimum substance content of As and Cr is not found in the samples from the open countryside, as expected, but rather in specimens collected at canopy drip plots.
In all 13 cases, the element concentrations correlate more strongly with the LAI determined tree species-specifically [23] than with the LAI-estimated land use-specifically [22], which indicates a higher accuracy of the estimation method based on the tree species [23]. The tree species with their percentages in the tree layer as well as the tree age are therefore relevant features for the vegetation structural characterization of the sampling plots and can be recommended for an addition to ANNEX 2 in the Moss Manual [20]. However, it should also be emphasized that, compared to more elaborate technical measurements of LAI [28,29], the simplified estimation of LAI according to [22,23] entails generalizations.
The comparison with the study on the canopy effect already carried out in MM2015 [4], which was based on a somewhat larger sample (n = 67), shows a similar picture (Table 3): a strong to very strong correlation with the weighted land-use-specific leaf area index according to [23] was found for almost the same element series (N > Cu > Hg > Sb > Pb > Ni > Zn). Here, too, the influence of the canopy effect on the contents of As, Cr, Fe, and V in the moss clearly receded.
In view of the significant influence of the canopy effect on substance accumulation in mosses, care should be taken when selecting future sampling sites to ensure that the vegetation structures are as similar as possible throughout the entire monitoring network. For this purpose, the leaf area index can serve as a suitable measure of vegetation structure, and by minimizing the variance of the leaf area index in the entire moss monitoring network, greater homogeneity can be achieved with regard to the vegetation structure as a whole.
Alternatively, the influence of the canopy drip effect on the substance concentrations in mosses can be calculated out of or into the leaf area index using regression models, i.e., the substance concentrations can be transformed to a standardized leaf area index [12]. According to the results of the current study, it is expected that the validity of this method would increase if the tree species-specific estimation method for the LAI according to [24] were used. However, this would require that tree species and tree age are also recorded in the nationwide moss monitoring network as a supplement to the “metadata” of the Moss Manual [20].
In perspective, the question also arises as to which radii the estimates of the leaf area index around the moss sampling sites should ideally extend to. For this purpose, an area-wide mapping of the vegetation structures around the sampling site for an estimation of the LAI according to [23] in different radii, e.g., of 25, 35, 50, 100, and 200 m, and an evaluation with regard to the radius with the maximum correlation coefficient would be useful.
Further, worthwhile points of contact for studies on the canopy effect exist with regard to the small-scale variability of the concentrations of persistent organic pollutants at moss sampling sites. For example, the group of polycyclic aromatic hydrocarbons (PAHs) could be used for this purpose.
Moss data cover large areas with high spatial resolution and can therefore help validate atmospheric deposition calculated by using chemical transport models (CTM) such as LOTOS EUROS or EMEP-W better than data collected with technical instruments, which are sparse spatially. This is especially due to the fact that moss surveys can be used to detect the influence of vegetation cover on atmospheric deposition in a small-scale differentiated manner and can be used as a dimensionless factor in CTM calculations of atmospheric deposition. Such quantified factors are presented and discussed in the paper using the example of Germany based on moss samples collected in 2021 as the result of a corresponding empirical design. These data complement and confirm corresponding studies in Germany in 2012, 2013, and 2015. Corresponding studies are very, up to now, seldom within the framework of the European Moss Survey, the largest of its kind worldwide [4,7,8,9,10,11,12,13,14,15,16].
Supplementary Materials
The following supporting information can be downloaded at: https://0-www-mdpi-com.brum.beds.ac.uk/article/10.3390/f13040605/s1, Tables S1–S6, Figures S1–S4.
Author Contributions
Conceptualization, S.N. and W.S.; methodology, S.N. and W.S.; investigation, moss sampling B.V. and chemical analysis, A.D.; data curation, S.N.; writing—original draft preparation, W.S.; writing—review and editing, W.S.; supervision, W.S. All authors have read and agreed to the published version of the manuscript.
Funding
This study was financed with own funds and took place in the research project 3720632010 “Pilot studies on the suitability of bioindication with mosses for the detection of atmospheric deposition of persistent organic pollutants as well as microplastics”, the German contribution to the European Moss Survey 2020/2021, funded by the Federal Environment Agency.
Data Availability Statement
The data produced in this research project are intended to be published in a data paper.
Acknowledgments
This investigation took place in the research project 3720632010 “Pilot studies on the suitability of bioindication with mosses for the detection of atmospheric deposition of persistent organic pollutants as well as microplastics”, the German contribution to the European Moss Survey 2020/2021, which was scientifically accompanied by the Federal Environment Agency.
Conflicts of Interest
The authors declare no conflict of interest. The funders had no role in the design of the study; in the collection, analyses, or interpretation of data; in the writing of the manuscript, or in the decision to publish the results.
References
- BMEL (Federal Ministry of Food and Agriculture). Waldzustandsbericht 2013 [Forest Condition Report 2013]; BMEL: Berlin, Germany, 2013; pp. 1–40.
- Builtjes, P.; Hendriks, E.; Koenen, M.; Schaap, M.; Banzhaf, S.; Kerschbaumer, A.; Gauger, T.; Nagel, H.D.; Scheuschner, T.; Schlutow, A. Erfassung, Prognose und Bewertung von Stoffeinträgen und ihren Wirkungen in Deutschland [Recording, Forecasting and Assessing Substance Inputs and Their Effects in Germany]; MAPESI Project (Modelling of Air Pollutants and EcoSystem Impact); UBA-Texte 42/2011; Umweltbundesamt: Dessau, Germany, 2011; pp. 1–154.
- De Schrijver, A.; Staelens, J.; Wuyts, K.; Van Hoydonck, G.; Janssen, N.; Mertens, J.; Gielis, L.; Geudens, G.; Augusto, L.; Verheyen, K. Effect of vegetation type on throughfall deposition and seepage flux. Environ. Pollut. 2008, 153, 295–303. [Google Scholar] [CrossRef] [PubMed]
- Schröder, W.; Nickel, S.; Völksen, B.; Dreyer, A.; Wosniok, W. Einsatz von Bioindikationsmethoden zur Bestimmung und Regionalisierung von Schadstoffeinträgen für eine Abschätzung des atmosphärischen Beitrags zur aktuellen Belastung von Ökosystemen. [Use of Bioindication Methods to Determine and Regionalise Pollutant Inputs for an Estimation of the Atmospheric Contribution to Current Pressures on Ecosystems]; UBA-Texte 91/2019; Umweltbundesamt: Berlin, Germany, 2019; Volume 1:1–189, 2:1–296.
- UBA (Umweltbundesamt). Stickstoff—Zuviel des Guten? [Nitrogen—Too Much of a Good Thing?]; Brochure of the Federal Environment Agency: Dessau-Roßlau, Germany, 2011; pp. 1–42.
- Beudert, B.; Breit, W. Horizontaler Niederschlag, Nasse und Feuchte Deposition im Inneren Bayerischen Wald—Erste Ergebnisse [Horizontal Precipitation, Wet and Moist Deposition in the Inner Bavarian Forest—First Results]; FKZ 351 01 012/04; Federal Environment Agency: Dessau, Germany, 2012; pp. 1–50.
- Gandois, L.; Agnan, Y.; Leblond, S.; Séjalon-Delmas, N.; Le Roux, G.; Probst, A. Use of geochemical signatures, including rare earth elements, in mosses and lichens to assess spatial integration and the influence of forest environment. Atmos. Environ. 2014, 95, 96–104. [Google Scholar] [CrossRef] [Green Version]
- Kluge, M.; Pesch, R.; Schröder, W.; Hoffmann, A. Accounting for canopy drip effects of spatiotemporal trends of the concentrations of N in mosses, atmospheric N depositions and critical load exceedances: A case study from North-Western Germany. Environ. Sci. Eur. 2013, 25, 1–13. [Google Scholar] [CrossRef] [Green Version]
- Meyer, M. Standortspezifisch Differenzierte Erfassung Atmosphärischer Stickstoff- und Schwermetalleintrag Mittels Moosen unter Berücksichtigung des Traufeffektes und Ergänzende Untersuchungen zur Beziehung von Stickstoffeinträgen und Begleitvegetation [Site-Specific Differentiated Recording of Atmospheric Nitrogen and Heavy Metal Inputs by Means of Mosses, Taking into Account the Canopy Drip Effect, and Supplementary Studies on the Relationship between Atmospheric Nitrogen Deposition and Accompanying Vegetation]. Ph.D. Thesis, University of Vechta, Vechta, Germany, 2017. [Google Scholar]
- Meyer, M.; Schröder, W.; Hoffmann, A. Effect of canopy drip on accumulation of nitrogen and metals in moss. Pollut. Atmosphérique 2015, 226, 1–29. [Google Scholar] [CrossRef] [Green Version]
- Meyer, M.; Schröder, W.; Nickel, S.; Leblond, S.; Lindroos, A.J.; Mohr, K.; Poikolainen, J.; Santamaria, J.M.; Skudnik, M.; Thöni, L.; et al. Relevance of canopy drip for the accumulation of nitrogen in moss used as biomonitors for atmospheric nitrogen deposition in Europe. Sci. Tot. Environ. 2015, 538, 600–610. [Google Scholar] [CrossRef] [PubMed]
- Nickel, S.; Schröder, W. Kleinräumige Untersuchungen zum Einfluss des Kronentraufeffekts auf Elementkonzentrationen in Moosen [Small-scale studies on the influence of the crown effect on element concentrations in mosses]. In Handbuch der Umweltwissenschaften. Grundlagen und Anwendungen der Ökosystemforschung [In Handbook of Environmental Sciences. Fundamentals and Applications of Ecosystem Research]; Schröder, W., Fränzle, O., Müller, F., Eds.; Wiley VCH: Weinheim, Germany, 2018; 25. Erg.Lfg., Chapter VI-1.10; pp. 1–35. [Google Scholar]
- Pesch, R.; Schröder, W.; Genssler, L.; Goeritz, A.; Holy, M.; Kleppin, L.; Matter, Y. Moos-Monitoring 2005/2006: Schwermetalle IV und Gesamtstickstoff [Moss Monitoring 2005/2006: Heavy Metals IV and Total Nitrogen]; (Environmental Research Plan of the Federal Minister for the Environment, Nature Conservation and Nuclear Safety. R&D Project 205 64 200, Final Report, Commissioned by the Federal Environment Agency); 90 pp.; 11 Tabs.; 2 Figs. (Text); 51 pp. + 41 Maps, 34 Tables, 46 Diagrams (Appendix); Federal Environment Agency: Berlin, Germany, 2007. [Google Scholar]
- Schröder, W.; Nickel, S. Site-specific investigation and spatial modelling of canopy drip effect on element concentrations in moss. Environ. Sci. Pollut. Res. 2018, 25, 27173–27186. [Google Scholar] [CrossRef] [PubMed]
- Schröder, W.; Nickel, S.; Schönrock, S.; Schmalfuß, R.; Wosniok, W.; Meyer, M.; Harmens, H.; Frontasyeva, M.V.; Alber, R.; Aleksiayenak, J.; et al. Bioindication and modelling of atmospheric deposition in forests enable exposure and effect monitoring at high spatial density across scales. Ann. For. Sci. 2017, 74, 1–23. [Google Scholar] [CrossRef]
- Skudnik, M.; Jeran, Z.; Batič, F.; Simončič, P.; Kastelec, D. Potential environmental factors that influence the nitrogen concentration and δ15N values in the moss Hypnum cupressiforme collected inside and outside canopy drip lines. Environ. Pollut. 2015, 198, 78–85. [Google Scholar] [CrossRef] [PubMed]
- Sachs, L.; Hedderich, J. Angewandte Statistik. Methodensammlung mit R; Springer: Berlin, Germany, 2019; pp. 1–813. [Google Scholar]
- ICP Vegetation. Monitoring of Atmospheric Deposition of Metals, Nitrogen and POPs in Europe Using Bryophytes; Monitoring Manual 2015 Survey; Natural Environment Council, Center for Ecology & Hidrology: Bangor, UK, 2014; pp. 1–26. [Google Scholar]
- Pourret, O.; Bollinger, J.-C.; Hursthouse, A. Heavy Metal: A misused term? Acta Geochim. 2021, 40, 466–471. [Google Scholar] [CrossRef]
- ICP Vegetation. Metals, Nitrogen and POPs in European Mosses; Monitoring Manual Survey 2020; ICP Vegetation: Bangor, UK; Dubna, Russia, 2020; pp. 1–27. [Google Scholar]
- Steinnes, E. A critical evaluation of the use of naturally growing moss to monitor the deposition of atmospheric metals. Sci. Tot. Environ. 1995, 160–161, 243–249. [Google Scholar] [CrossRef]
- Bremicker, M. Das Wasserhaushaltsmodell LARSIM—Modellgrundlagen und Anwendungsbeispiele [The Water Balance Model LARSIM—Model Basics and Application Examples]; Freiburger Schriften zur Hydrologie: Freiburg, Germany, 2000; Volume 11, pp. 1–119. [Google Scholar]
- Jansen, M.; Döring, C.; Ahrends, B.; Bolte, A.; Czajkowski, T.; Panferov, O.; Albert, M.; Spellmann, H.; Nagel, J.; Lemme, H.; et al. Anpassungsstrategien für eine nachhaltige Waldbewirtschaftung unter sich wandelnden Klimabedingungen: Entwicklung eines Entscheidungsunterstützungssystems “Wald und Klimawandel” (DSS-WuK) [Adaptation strategies for sustainable forest management under changing climate conditions: Development of a decision support system “Forest and Climate Change” (DSS-WuK)]. Forstarchiv 2008, 79, 131–142. [Google Scholar]
- Brosius, F. SPSS 21; Mitp/bhv: Heidelberg, Germany, 2013; pp. 1–1052. [Google Scholar]
- R Core Team. R: A Language and Environment for Statistical Computing; R Foundation for Statistical Computing: Vienna, Austria, 2018; Available online: https://www.R-project.org/ (accessed on 14 August 2020).
- UCLA. What Are Pseudo R-Squareds? UCLA—Statistical Consulting Group. 2011. Available online: https://stats.idre.ucla.edu/other/mult-pkg/faq/general/faq-what-are-pseudo-r-squareds (accessed on 16 February 2022).
- Liu, S.; Dissanayake, S.; Patel, S.; Dang, X.; Mlsna, T.; Chen, Y.; Wilkins, D. Learning accurate and interpretable models based on regularized random forests regression. BMC Syst. Biol. 2014, 8 (Suppl. 3), S5. [Google Scholar] [CrossRef] [PubMed] [Green Version]
- Eschenbach, C.; Kappen, L. Leaf area index determination in an alder forest: A comparison of three methods. J. Exp. Bot. 1995, 47, 1457–1462. [Google Scholar] [CrossRef] [Green Version]
- Welles, J.M.; Norman, J.M. Instrument for indirect measurement of canopy architecture. Agron. J. 1991, 83, 818–825. [Google Scholar] [CrossRef]
Figure 1.
Spatial distribution of the 8 sites in northwest Germany where moss specimens were collected from 26 open land and canopy drip plots in 2021.
Figure 1.
Spatial distribution of the 8 sites in northwest Germany where moss specimens were collected from 26 open land and canopy drip plots in 2021.

Figure 2.
Open land plot (left), canopy drip plot (center) and tree layer cover (right) at site NI116. Photos: S. Nickel.
Figure 2.
Open land plot (left), canopy drip plot (center) and tree layer cover (right) at site NI116. Photos: S. Nickel.

Figure 3.
Regression models for the relationships between the ratio of concentrations of Al, Cu, Hg, Ni, Sb, and N in the mosses and the ratio of leaf area indices at neighboring canopy drip and open land plots.
Figure 3.
Regression models for the relationships between the ratio of concentrations of Al, Cu, Hg, Ni, Sb, and N in the mosses and the ratio of leaf area indices at neighboring canopy drip and open land plots.


Table 1.
Sampling sites (n = 26) in northwest Germany 2020/2021.
| Sample Collection Site | Date | Moss Type | Location Category | Use | Share of Main Tree Species |
|---|---|---|---|---|---|
| NI03_92 | 11 October 2021 | Plesch | F | Grassland | |
| NI03_94 | 11 October 2021 | Plesch | T | Coniferous forest | Picea 80%, Pinus 20% |
| NI03_95 | 11 October 2021 | Plesch | T | Coniferous forest | Pinus 100% |
| NI104_88 | 11 October 2021 | Psepur | F | Heathland | |
| NI104_90 | 11 October 2021 | Psepur | T | Coniferous forest | Pinus 100% |
| NI104_91 | 11 October 2021 | Psepur | T | Clearing within deciduous forest | Betula 100% |
| NI108_98 | 12 October2021 | Psepur | F | Grassland | |
| NI108_100 | 12 October 2021 | Psepur | T | Coniferous forest | Pseudotsuga 100% |
| NI108_101 | 12 October 2021 | Psepur | T | Deciduous forest | Quercus 90%, Pinus 10% |
| NI108_102 | 12 October 2021 | Psepur | T | Coniferous forest | Larix 100% |
| NI116_120 | 9 October 2021 | Plesch | F | Heathland | |
| NI116_122 | 9 October 2021 | Plesch | T | Coniferous forest | Pinus 100% |
| NI116_123 | 9 October 2021 | Plesch | T | Deciduous tree | Quercus 70%, Betula 30% |
| NI117_123 | 11 October 2021 | Psepur | F | Grassland | |
| NI117_124 | 11 October 2021 | Psepur | T | Coniferous forest | Picea/Pseudotsuga 90%, Betula 10% |
| NI117_125 | 11 October 2021 | Psepur | T | Deciduous forest | Fagus 90%, Pseudotsuga 10% |
| NI118_125 | 10 October 2021 | Psepur | F | Grassland | |
| NI118_127 | 10 October 2021 | Psepur | T | Coniferous forest | |
| NI118_128 | 10 October 2021 | Psepur | T | Deciduous forest | Betula 70%, Quercus 30% |
| NI124_139 | 17 September 2021 | Plesch | F | Heathland | |
| NI124_143 | 9 October 2021 | Plesch | T | Deciduous tree | Betula 70%, Quercus 30% |
| NI130_157 | 8 October 2021 | Plesch | F | Grassland | |
| NI130_160 | 8 October 2021 | Plesch | T | Coniferous forest | Pinus 100% |
| NI130_161 | 8 October 2021 | Plesch | T | Mixed forest | Betula 70%, Pinus 30% |
| NI130_162 | 8 October 2021 | Plesch | T | Coniferous forest | Pseudotsuga 60%, Pinus 40% |
| NI130_163 | 8 October 2021 | Plesch | F | Heathland |
F = Open space site (open land; n = 9), T = canopy drip site (forest/woodland; n = 17); Plesch = Pleurozium schreberi, Psepur = Pseudoscleropodium purum; chemical moss analysis. Sampling, sample preparation, and determination of the 12 metals (Al, As, Cd, Cr, Cu, Fe, Hg, Pb, Ni, Sb, V, Zn) were carried out according to [4,20].
Table 2.
Comparison of the determined median value ratios between open land and canopy drip plots in northwest Germany 2021 with values from [4,9].
| Element | Data Collective 1 (n = 20) | Data Collective 2 (n = 17 to 20) | [9] (n = 52) | [4] (n = 25) |
|---|---|---|---|---|
| Al | 1.26 | 1.43 ** | - | 1.41 |
| As | 1.44 | 1.50 | - | 1.57 |
| Cd | 1.35 * | 1.69 *** | 1.60 *** | 1.75 *** |
| Cr | 1.42 | 1.40 * | 1.01 | 1.22 |
| Cu | 1.44 *** | 1.46 *** | 1.71 *** | 1.80 *** |
| Fe | 1.31 | 1.31 | - | 1.32 *** |
| Hg | 1.50 *** | 1.33 *** | 1.68 *** | 2.50 *** |
| Ni | 1.46 | 1.63 *** | 1.15 *** | 1.24 *** |
| Pb | 1.26 | 1.38 * | 1.32 *** | 1.72 *** |
| Sb | 1.18 * | 1.18 *** | - | 1.62 *** |
| V | 1.21 | 1.26 | - | 1.60 *** |
| Zn | 1.21 *** | 1.20 *** | 1.33 *** | 1.43 *** |
| N | 1.46 *** | 1.46 *** | 1.95 *** | 1.68 *** |
Data collective 1: measured values of the present study; data collective 2: measured values of the present study after removing the outliers; n = sample size; *** = p ≤ 0.01 (very significant); ** = p ≤ 0.05 (significant); * = p ≤ 0.1 or just above 0.1 (weakly significant).
Table 3.
Comparison of the correlation coefficients (Pearson, Spearman) between the quotients of the element contents in mosses and the quotients of the leaf area indices with the results of [4].
Table 3.
Comparison of the correlation coefficients (Pearson, Spearman) between the quotients of the element contents in mosses and the quotients of the leaf area indices with the results of [4].
| Element | Data Collective 2 rp (n = 28 to 40) (1) | Data Collective 2 rs (n = 28 to 40) (1) | [4] rp (n = 67) (2) | [4] rs (n = 67) (2) |
|---|---|---|---|---|
| Al | 0.84 *** | 0.76 *** | 0.43 *** | 0.41 *** |
| As | 0.32 * | 0.24 | 0.44 *** | 0.50 *** |
| Cd | 0.48 *** | 0.67 *** | 0.64 *** | 0.57 *** |
| Cr | 0.57 *** | 0.60 *** | 0.48 *** | 0.47 *** |
| Cu | 0.90 *** | 0.92 *** | 0.73 *** | 0.75 *** |
| Fe | 0.52 *** | 0.50 *** | 0.51 *** | 0.52 *** |
| Hg | 0.66 *** | 0.78 *** | 0.71 *** | 0.72 *** |
| Ni | 0.75 *** | 0.71 *** | 0.64 *** | 0.60 *** |
| Pb | 0.61 *** | 0.52 *** | 0.72 *** | 0.65 *** |
| Sb | 0.80 *** | 0.84 *** | 0.77 *** | 0.68 *** |
| V | 0.41 ** | 0.36 ** | 0.57 *** | 0.59 *** |
| Zn | 0.46 *** | 0.59 *** | 0.59 *** | 0.60 *** |
| N | 0.87 *** | 0.87 *** | 0.84 *** | 0.81 *** |
(1) Determined using the tree species-specific simple leaf area index (sLAI.spec); (2) determined using the land-use-specific and cover-weighted leaf area index (wLAI.lu); n = sample size; rp = correlation coefficient (Pearson); rs = correlation coefficient (Spearman); *** = p ≤ 0.01 (very significant); ** = p ≤ 0.05 (significant); * = p ≤ 0.1 (weakly significant); bold = vegetation structure measure with the comparatively highest correlation coefficients.
Publisher’s Note: MDPI stays neutral with regard to jurisdictional claims in published maps and institutional affiliations. |
© 2022 by the authors. Licensee MDPI, Basel, Switzerland. This article is an open access article distributed under the terms and conditions of the Creative Commons Attribution (CC BY) license (https://creativecommons.org/licenses/by/4.0/).
Share and Cite
MDPI and ACS Style
Nickel, S.; Schröder, W.; Völksen, B.; Dreyer, A. Influence of the Canopy Drip Effect on the Accumulation of Atmospheric Metal and Nitrogen Deposition in Mosses. Forests 2022, 13, 605. https://0-doi-org.brum.beds.ac.uk/10.3390/f13040605
AMA Style
Nickel S, Schröder W, Völksen B, Dreyer A. Influence of the Canopy Drip Effect on the Accumulation of Atmospheric Metal and Nitrogen Deposition in Mosses. Forests. 2022; 13(4):605. https://0-doi-org.brum.beds.ac.uk/10.3390/f13040605
Chicago/Turabian StyleNickel, Stefan, Winfried Schröder, Barbara Völksen, and Annekatrin Dreyer. 2022. "Influence of the Canopy Drip Effect on the Accumulation of Atmospheric Metal and Nitrogen Deposition in Mosses" Forests 13, no. 4: 605. https://0-doi-org.brum.beds.ac.uk/10.3390/f13040605
Note that from the first issue of 2016, this journal uses article numbers instead of page numbers. See further details here.