
Geochemical Behavior of Sedimentary Phosphorus Species in Northernmost Artificial Mangroves in China

 ,
,  , , , , , , ,
Abstract
:1. Introduction
2. Materials and Methods
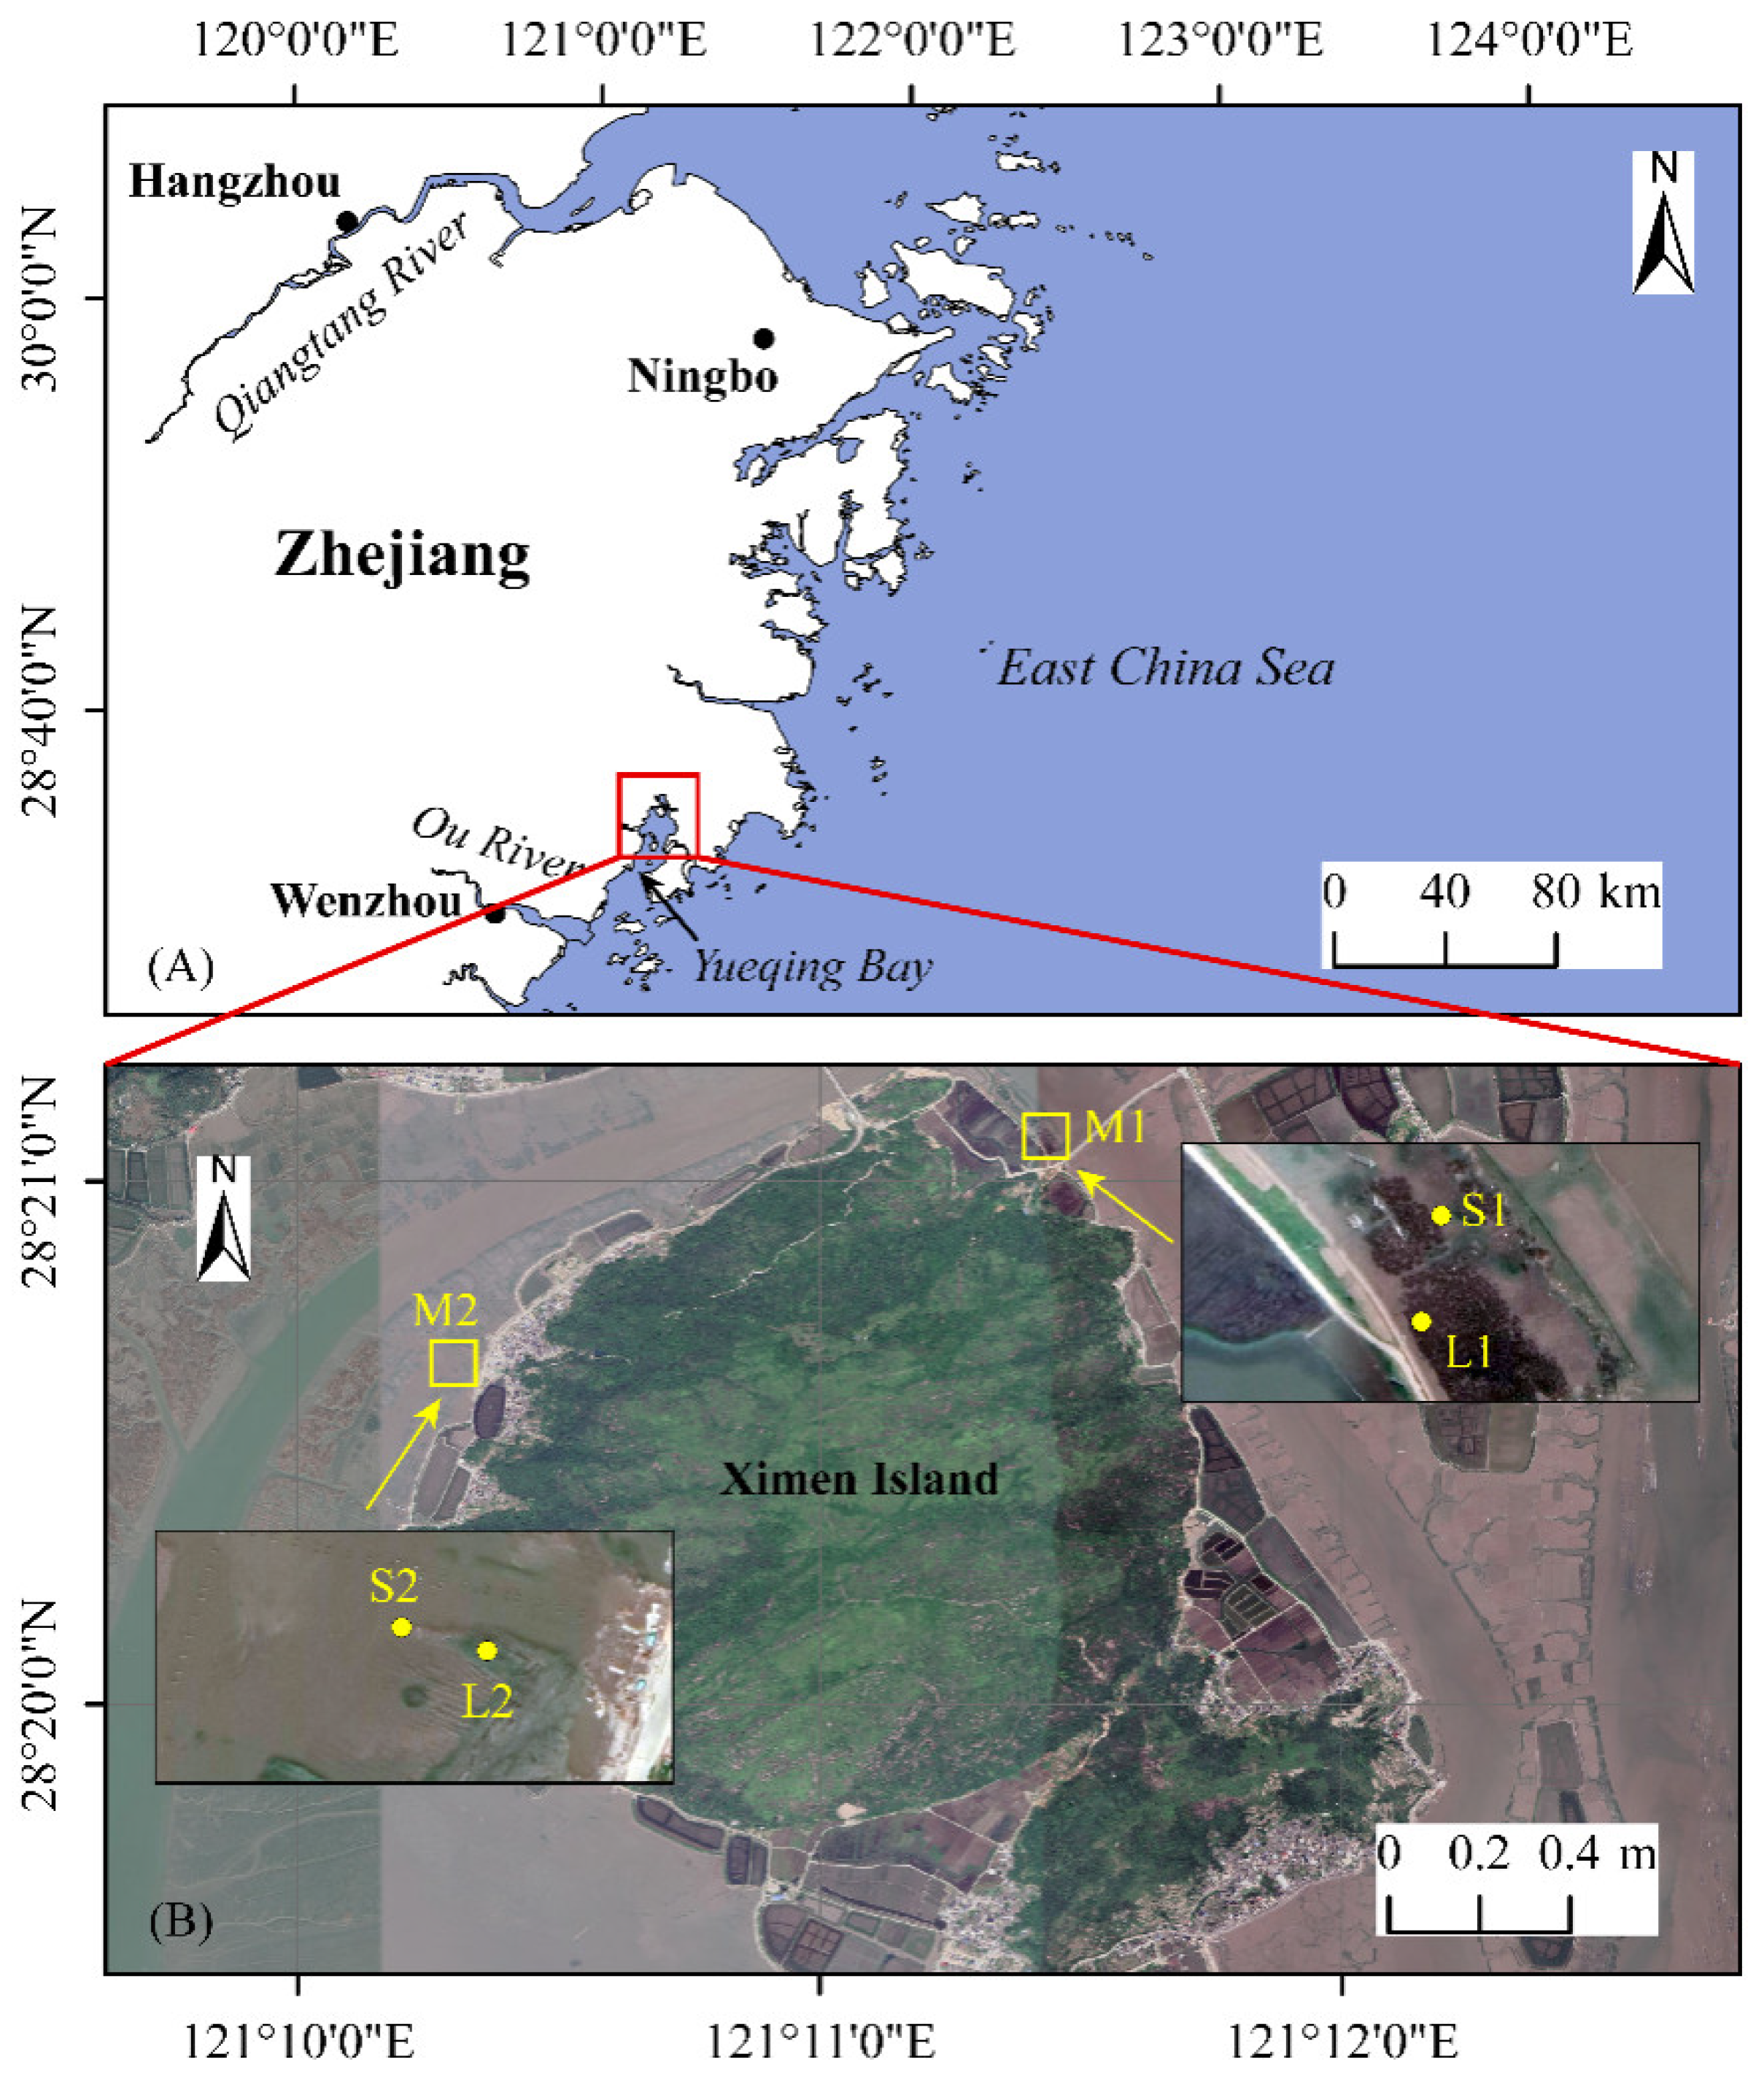
2.1. Study Area and Sampling Locations
2.2. Sequential P Extraction
2.3. Statistics and Visualization
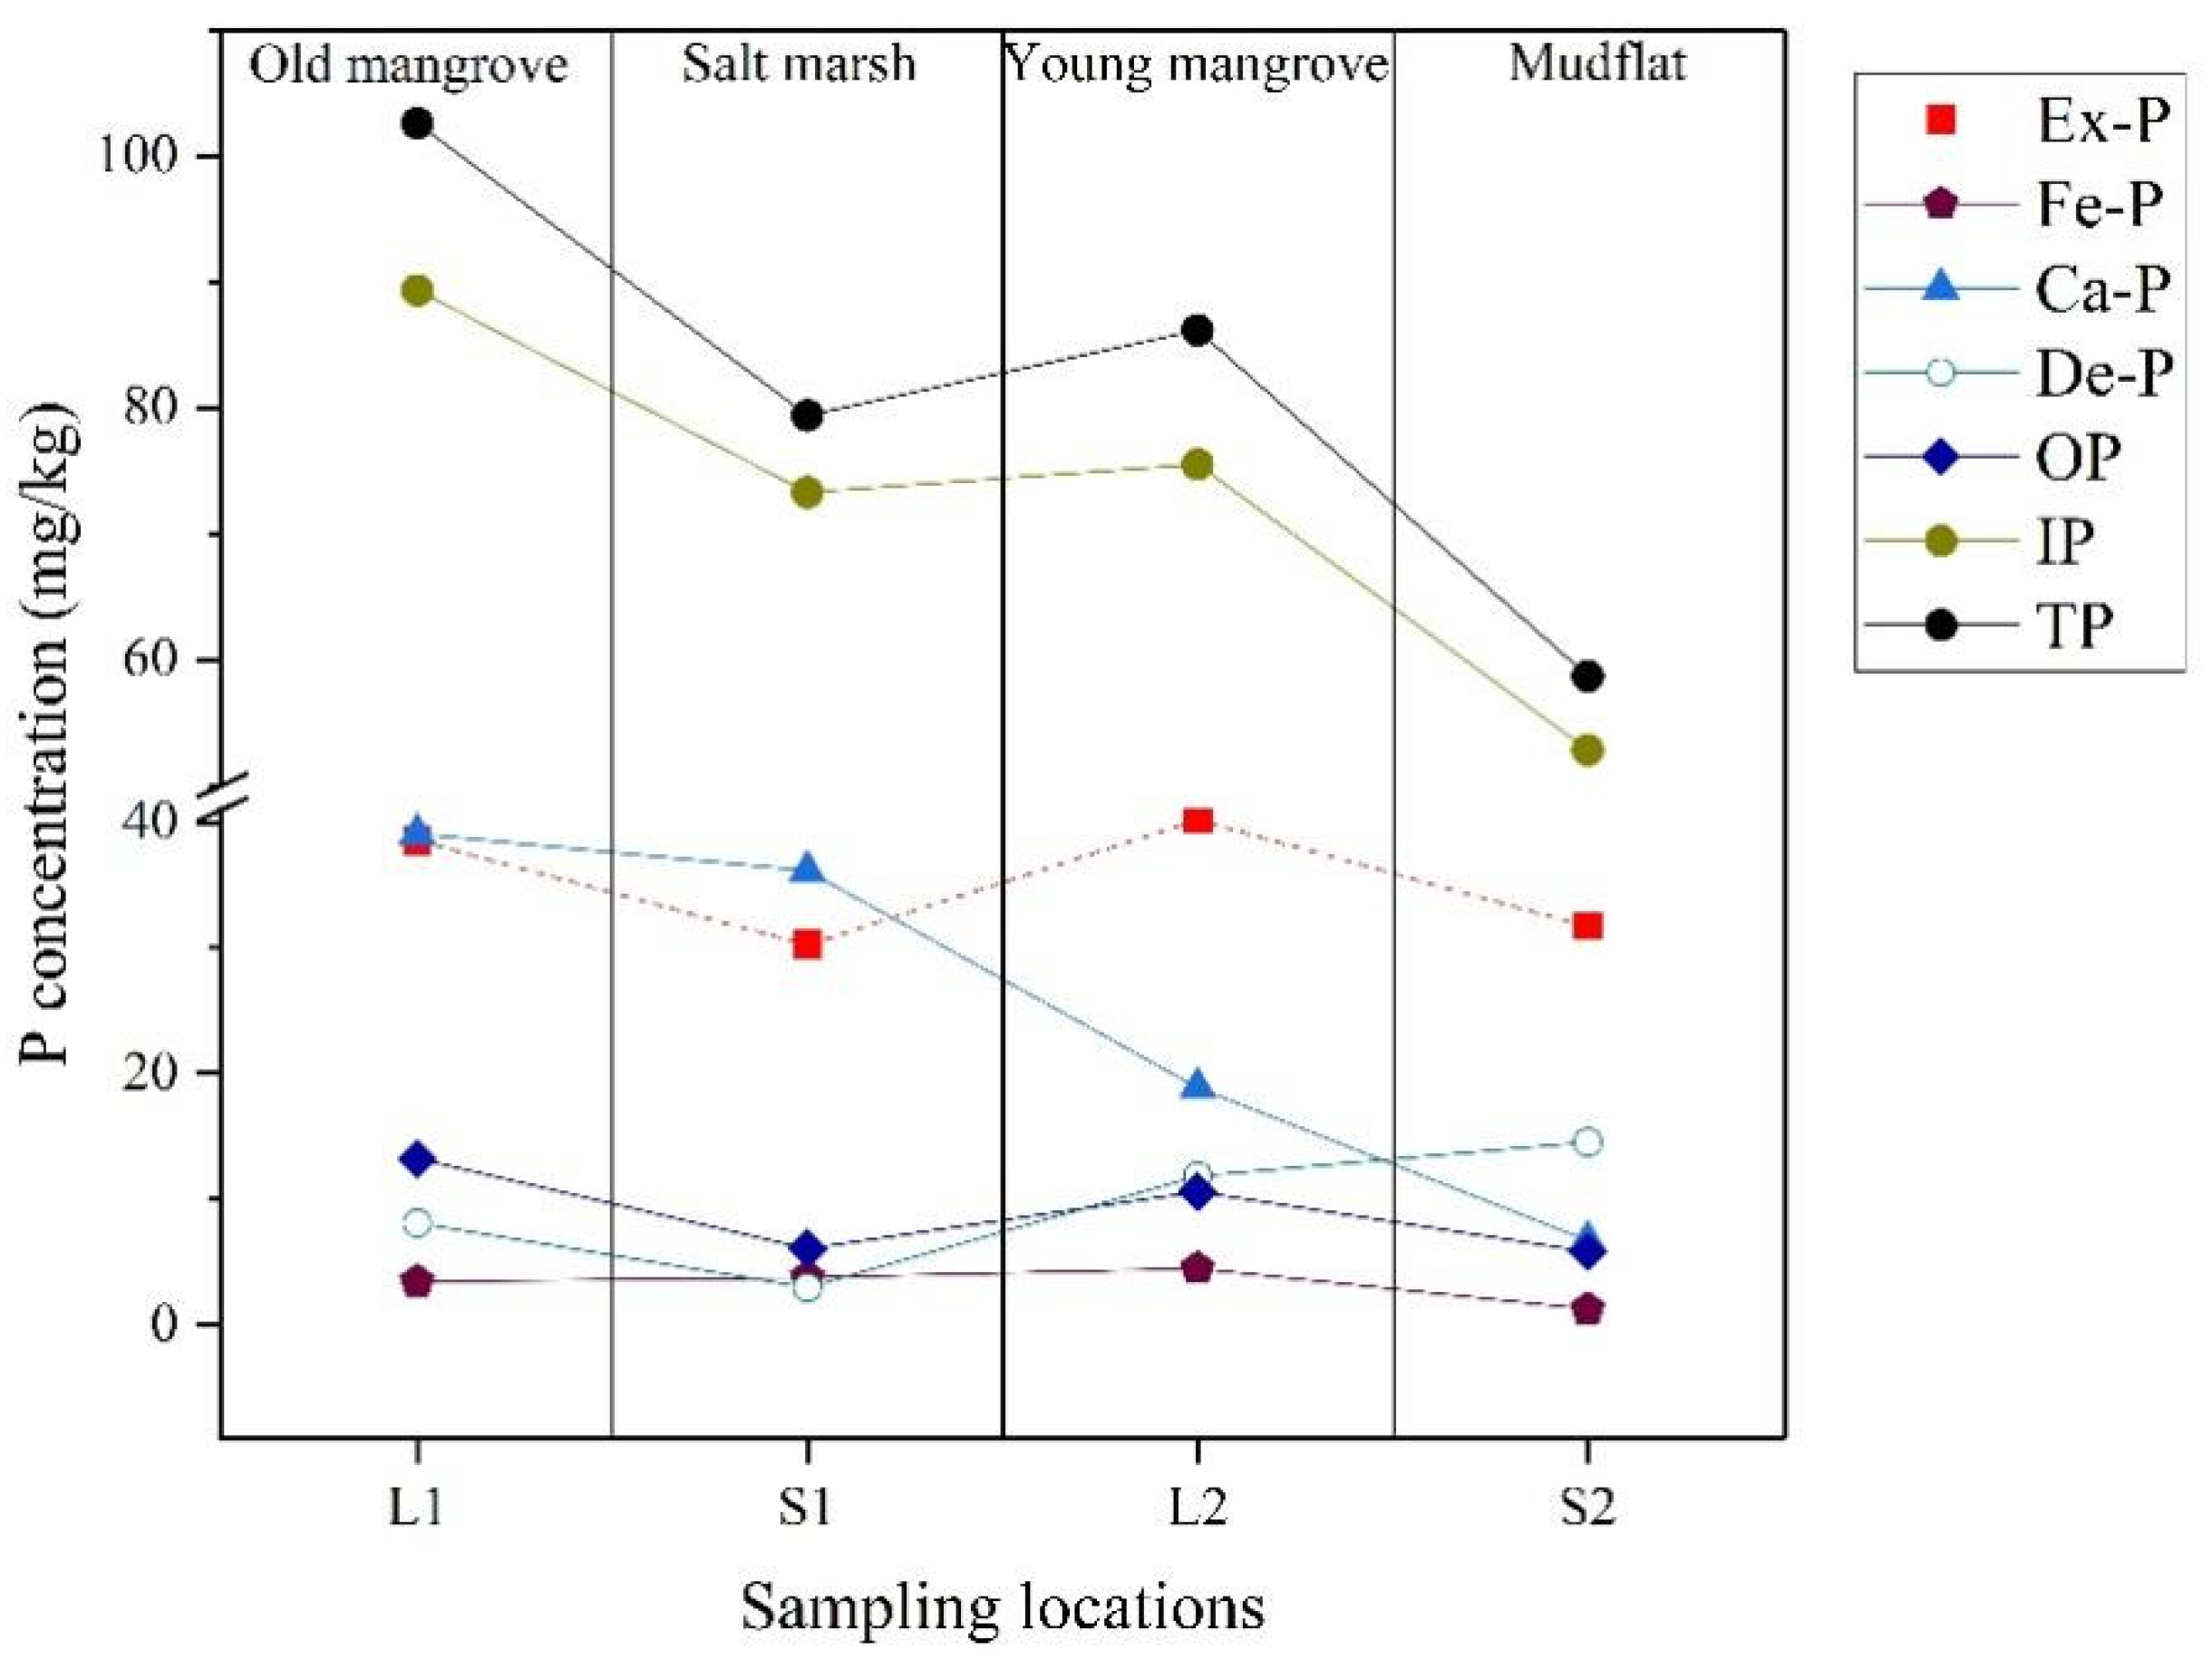
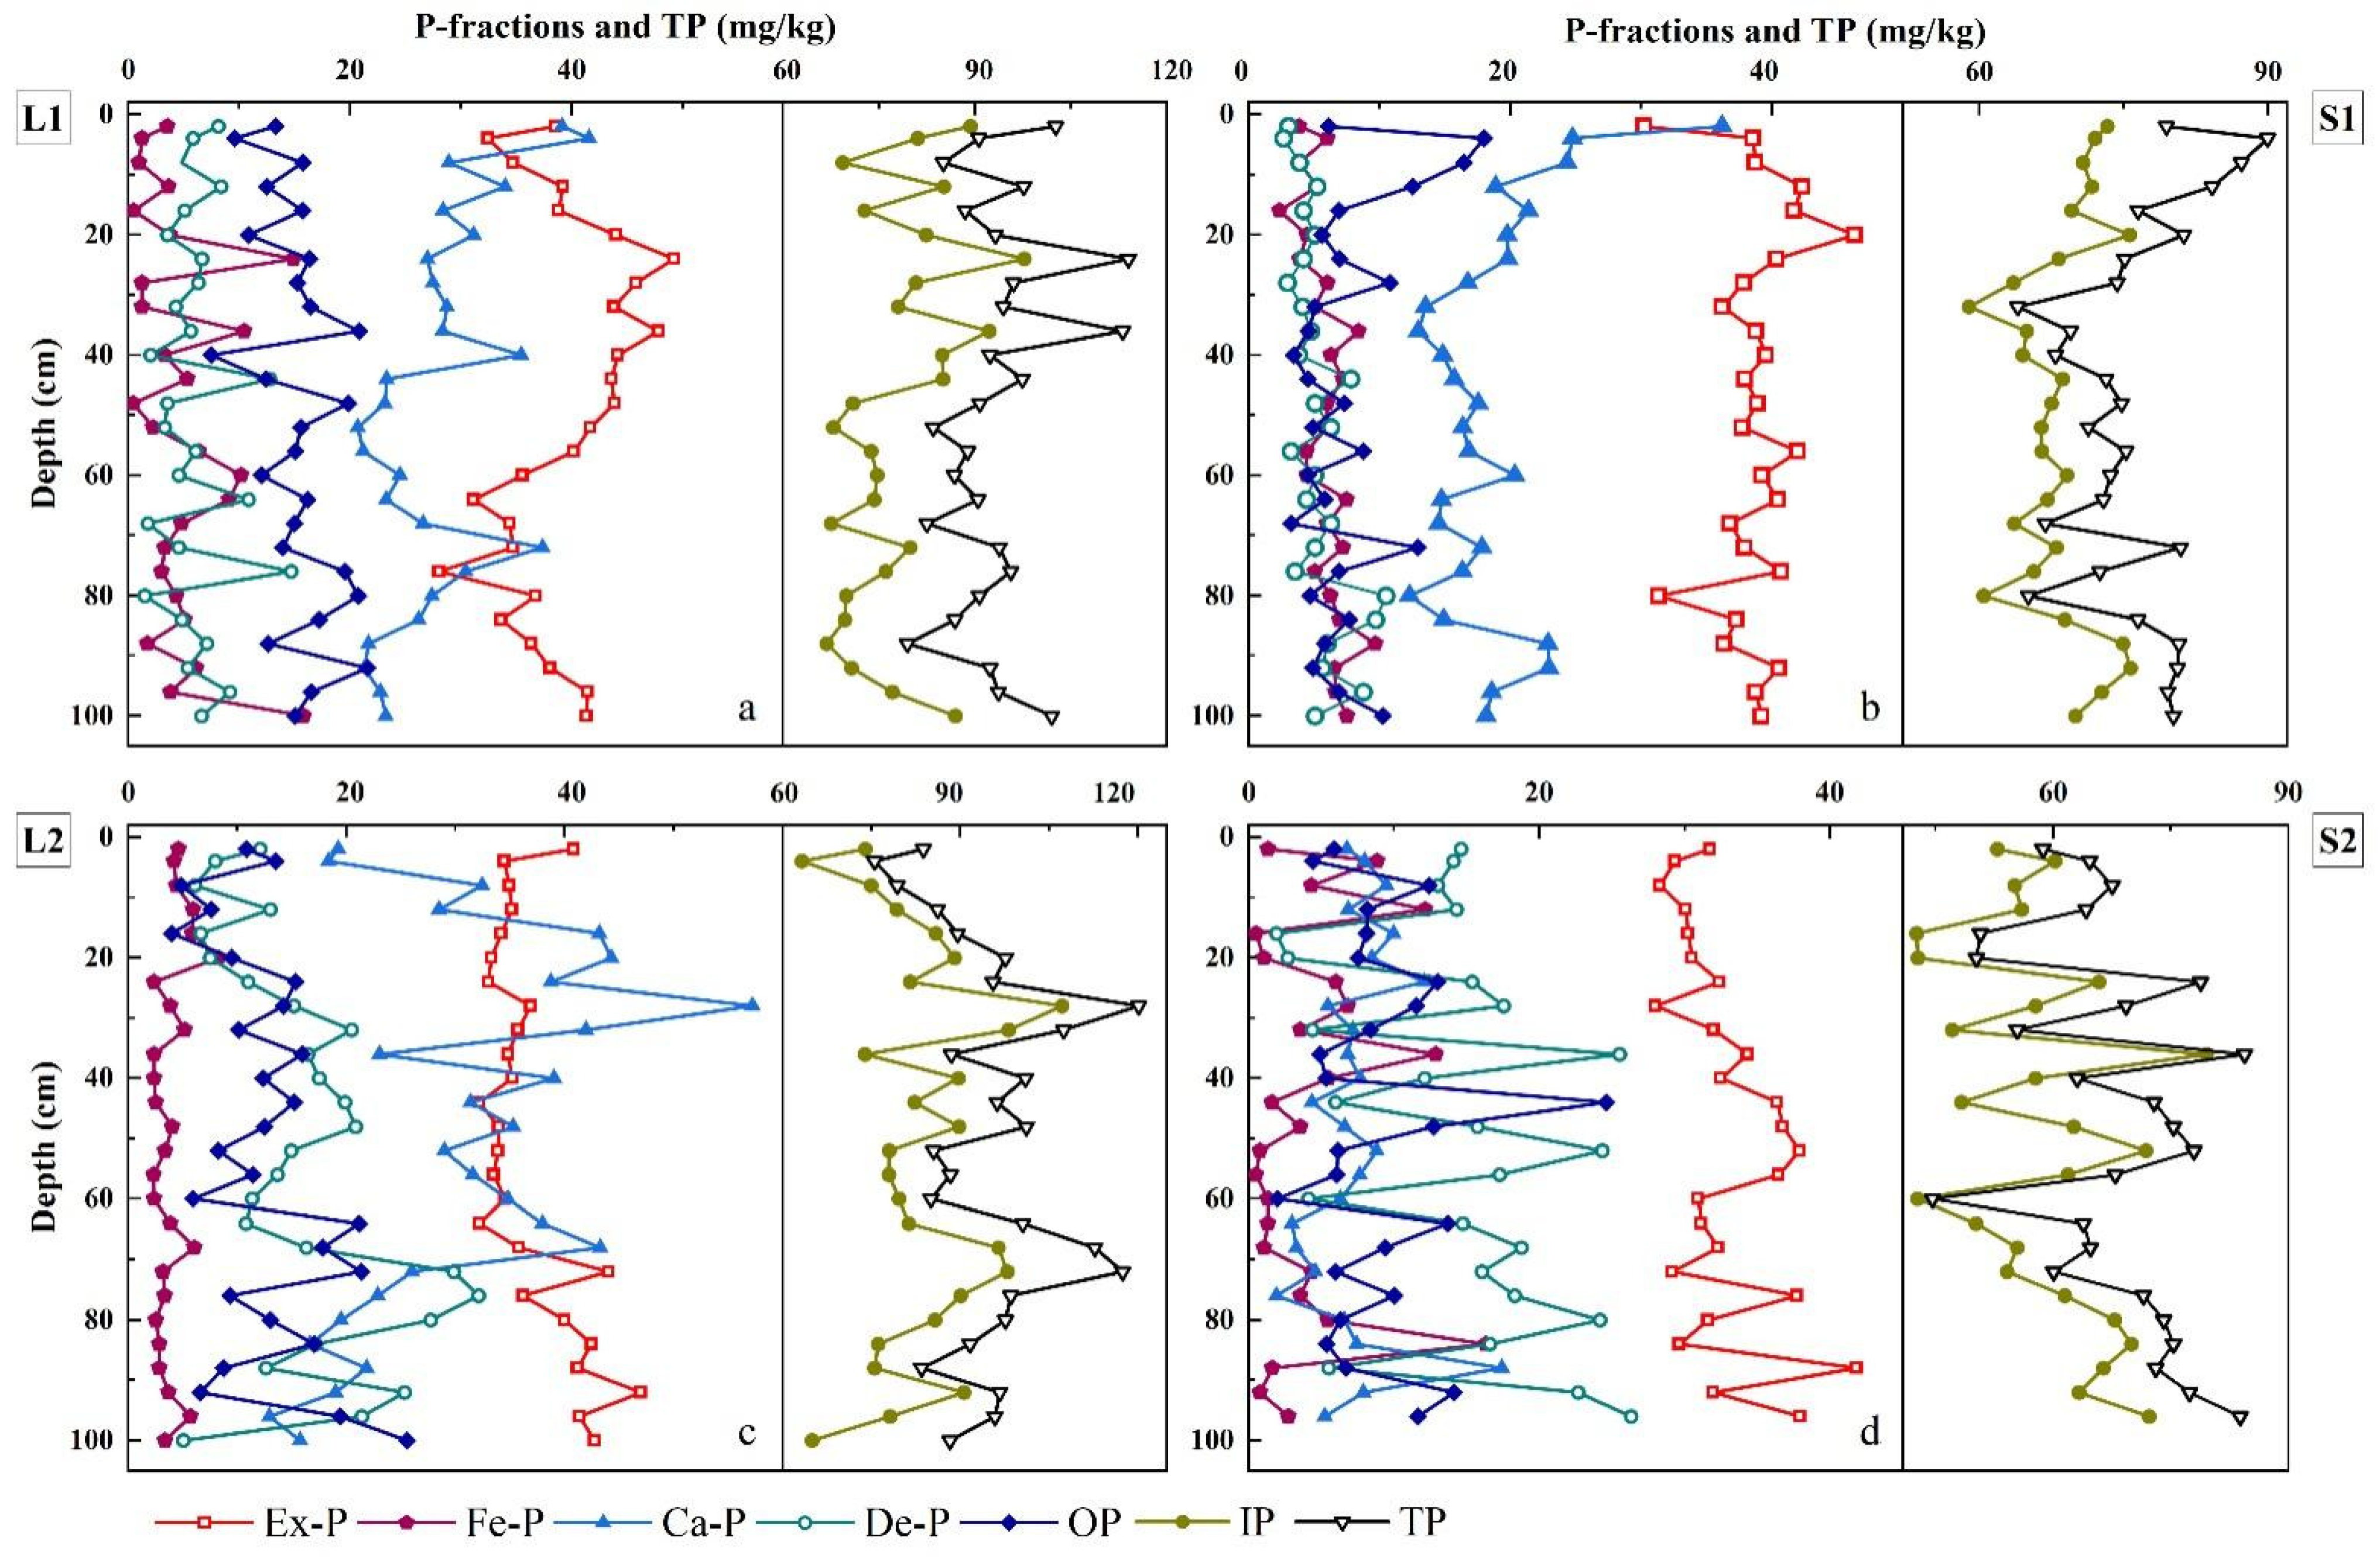
3. Results
4. Discussion
4.1. Sedimentary P Species
4.2. Different Wetland Ecosystems
4.3. Vertical Distribution of Sedimentary P Species
5. Conclusions
Author Contributions
Funding
Data Availability Statement
Acknowledgments
Conflicts of Interest
Appendix A

| Sample Number | Depth (cm) | Ex-P | Concentrations (mg/kg) | TP | Percentage to TP (%) | |||||||
|---|---|---|---|---|---|---|---|---|---|---|---|---|
| Fe-P | Ca-P | De-P | OP | IP | BAP | OP | IP | BAP | ||||
| 1 | 0–2 | 38.56 | 3.50 | 39.09 | 8.15 | 13.27 | 89.31 | 55.34 | 102.58 | 12.90% | 87.10% | 54.00% |
| 2 | 2–4 | 32.42 | 1.23 | 41.53 | 5.85 | 9.60 | 81.03 | 43.25 | 90.63 | 10.59% | 89.41% | 47.72% |
| 3 | 6–8 | 34.69 | 0.97 | 28.90 | 4.82 | 15.73 | 69.38 | 51.39 | 85.10 | 18.48% | 81.52% | 60.39% |
| 4 | 10–12 | 39.19 | 3.64 | 33.98 | 8.35 | 12.49 | 85.16 | 55.32 | 97.65 | 12.76% | 87.24% | 56.68% |
| 5 | 14–16 | 38.79 | 0.46 | 28.39 | 5.07 | 15.73 | 72.72 | 54.99 | 88.45 | 17.79% | 82.21% | 62.17% |
| 6 | 18–20 | 43.93 | 3.78 | 31.13 | 3.53 | 10.84 | 82.37 | 58.55 | 93.21 | 11.63% | 88.37% | 62.82% |
| 7 | 22–24 | 49.21 | 14.87 | 26.96 | 6.64 | 16.31 | 97.68 | 80.39 | 113.99 | 14.31% | 85.69% | 70.52% |
| 8 | 26–28 | 45.81 | 1.22 | 27.45 | 6.32 | 15.25 | 80.79 | 62.28 | 96.05 | 15.88% | 84.12% | 64.84% |
| 9 | 30–32 | 43.79 | 1.22 | 28.73 | 4.28 | 16.40 | 78.02 | 61.42 | 94.43 | 17.37% | 82.63% | 65.04% |
| 10 | 34–36 | 47.78 | 10.44 | 28.35 | 5.63 | 20.83 | 92.21 | 79.06 | 113.04 | 18.43% | 81.57% | 69.94% |
| 11 | 38–40 | 44.17 | 3.27 | 35.43 | 1.99 | 7.50 | 84.85 | 54.94 | 92.35 | 8.13% | 91.87% | 59.49% |
| 12 | 42–44 | 43.55 | 5.34 | 23.31 | 12.79 | 12.43 | 84.99 | 61.32 | 97.42 | 12.76% | 87.24% | 62.94% |
| 13 | 46–48 | 43.82 | 0.46 | 23.14 | 3.52 | 19.86 | 70.94 | 64.13 | 90.79 | 21.87% | 78.13% | 70.63% |
| 14 | 50–52 | 41.67 | 2.25 | 20.68 | 3.28 | 15.59 | 67.89 | 59.51 | 83.48 | 18.68% | 81.32% | 71.30% |
| 15 | 54–56 | 40.19 | 6.34 | 21.18 | 6.09 | 15.07 | 73.80 | 61.60 | 88.87 | 16.96% | 83.04% | 69.31% |
| 16 | 58–60 | 35.53 | 10.19 | 24.52 | 4.56 | 12.00 | 74.79 | 57.72 | 86.79 | 13.83% | 86.17% | 66.50% |
| 17 | 62–64 | 31.13 | 9.07 | 23.25 | 10.84 | 16.19 | 74.29 | 56.38 | 90.48 | 17.89% | 82.11% | 62.32% |
| 18 | 66–68 | 34.40 | 4.82 | 26.59 | 1.74 | 14.96 | 67.55 | 54.18 | 82.51 | 18.13% | 81.87% | 65.66% |
| 19 | 70–72 | 34.70 | 3.28 | 37.36 | 4.56 | 13.94 | 79.91 | 51.92 | 93.85 | 14.85% | 85.15% | 55.33% |
| 20 | 74–76 | 28.01 | 2.99 | 30.41 | 14.67 | 19.52 | 76.08 | 50.52 | 95.60 | 20.42% | 79.58% | 52.85% |
| 21 | 78–80 | 36.76 | 4.31 | 27.38 | 1.49 | 20.74 | 69.93 | 61.80 | 90.67 | 22.87% | 77.13% | 68.17% |
| 22 | 82–84 | 33.63 | 5.09 | 26.16 | 4.83 | 17.19 | 69.72 | 55.92 | 86.91 | 19.78% | 80.22% | 64.34% |
| 23 | 86–88 | 36.33 | 1.74 | 21.66 | 7.10 | 12.62 | 66.83 | 50.69 | 79.45 | 15.88% | 84.12% | 63.80% |
| 24 | 90–92 | 38.03 | 6.12 | 21.28 | 5.35 | 21.56 | 70.77 | 65.71 | 92.34 | 23.35% | 76.65% | 71.16% |
| 25 | 94–96 | 41.42 | 3.79 | 22.76 | 9.17 | 16.50 | 77.14 | 61.72 | 93.64 | 17.62% | 82.38% | 65.90% |
| 26 | 98–100 | 41.33 | 15.80 | 23.21 | 6.60 | 15.06 | 86.93 | 72.18 | 101.99 | 14.76% | 85.24% | 70.77% |
| Mean | 39.19 | 4.85 | 27.80 | 6.05 | 15.28 | 77.89 | 59.32 | 93.16 | 16.46% | 83.54% | 63.64% | |
| Stdev | 5.30 | 4.13 | 5.74 | 3.18 | 3.46 | 8.26 | 8.35 | 8.14 | 3.75% | 3.75% | 6.29% | |
| Sample Number | Depth (cm) | Ex-P | Concentrations (mg/kg) | TP | Percentage to TP (%) | |||||||
|---|---|---|---|---|---|---|---|---|---|---|---|---|
| Fe-P | Ca-P | De-P | OP | IP | BAP | OP | IP | BAP | ||||
| 1 | 0–2 | 30.24 | 3.83 | 36.16 | 3.03 | 6.12 | 73.26 | 40.19 | 79.38 | 7.72% | 92.28% | 50.99% |
| 2 | 2–4 | 38.54 | 6.01 | 24.73 | 2.64 | 17.97 | 71.93 | 62.53 | 89.90 | 19.99% | 80.01% | 69.55% |
| 3 | 6–8 | 38.70 | 3.85 | 24.33 | 3.85 | 16.47 | 70.73 | 59.01 | 87.20 | 18.88% | 81.12% | 67.68% |
| 4 | 10–12 | 42.30 | 5.23 | 18.87 | 5.24 | 12.52 | 71.64 | 60.06 | 84.17 | 14.44% | 85.56% | 71.33% |
| 5 | 14–16 | 41.64 | 2.33 | 21.37 | 4.18 | 6.90 | 69.52 | 50.87 | 76.42 | 9.02% | 90.98% | 66.57% |
| 6 | 18–20 | 46.31 | 4.46 | 19.73 | 5.07 | 5.61 | 75.57 | 56.38 | 81.18 | 6.91% | 93.09% | 69.45% |
| 7 | 22–24 | 40.33 | 3.86 | 19.80 | 4.17 | 6.91 | 68.16 | 51.11 | 75.07 | 9.21% | 90.79% | 68.08% |
| 8 | 26–28 | 37.83 | 6.00 | 16.71 | 2.94 | 10.79 | 63.48 | 54.61 | 74.26 | 14.52% | 85.48% | 73.54% |
| 9 | 30–32 | 36.21 | 5.03 | 13.50 | 4.12 | 5.06 | 58.85 | 46.29 | 63.91 | 7.91% | 92.09% | 72.43% |
| 10 | 34–36 | 38.78 | 8.39 | 12.95 | 4.74 | 4.53 | 64.86 | 51.70 | 69.39 | 6.53% | 93.47% | 74.51% |
| 11 | 38–40 | 39.51 | 6.28 | 14.82 | 3.84 | 3.41 | 64.45 | 49.20 | 67.86 | 5.03% | 94.97% | 72.50% |
| 12 | 42–44 | 37.92 | 7.18 | 15.70 | 7.79 | 4.51 | 68.60 | 49.62 | 73.11 | 6.17% | 93.83% | 67.86% |
| 13 | 46–48 | 38.86 | 5.97 | 17.54 | 5.06 | 7.28 | 67.43 | 52.11 | 74.70 | 9.74% | 90.26% | 69.75% |
| 14 | 50–52 | 37.73 | 5.98 | 16.36 | 6.29 | 4.89 | 66.36 | 48.60 | 71.25 | 6.86% | 93.14% | 68.21% |
| 15 | 54–56 | 41.95 | 4.42 | 16.83 | 3.21 | 8.77 | 66.40 | 55.13 | 75.17 | 11.66% | 88.34% | 73.35% |
| 16 | 58–60 | 39.23 | 4.45 | 20.32 | 5.06 | 4.52 | 69.06 | 48.20 | 73.58 | 6.14% | 93.86% | 65.51% |
| 17 | 62–64 | 40.45 | 7.45 | 14.71 | 4.42 | 5.80 | 67.03 | 53.69 | 72.82 | 7.96% | 92.04% | 73.73% |
| 18 | 66–68 | 36.76 | 5.98 | 14.51 | 6.28 | 3.23 | 63.53 | 45.97 | 66.76 | 4.84% | 95.16% | 68.86% |
| 19 | 70–72 | 37.88 | 7.18 | 17.82 | 5.05 | 12.94 | 67.92 | 58.00 | 80.86 | 16.00% | 84.00% | 71.72% |
| 20 | 74–76 | 40.67 | 5.05 | 16.32 | 3.53 | 6.90 | 65.58 | 52.62 | 72.47 | 9.52% | 90.48% | 72.61% |
| 21 | 78–80 | 31.35 | 6.23 | 12.29 | 10.47 | 4.70 | 60.35 | 42.28 | 65.04 | 7.22% | 92.78% | 65.01% |
| 22 | 82–84 | 37.28 | 6.93 | 14.90 | 9.69 | 7.66 | 68.79 | 51.86 | 76.45 | 10.02% | 89.98% | 67.84% |
| 23 | 86–88 | 36.34 | 9.68 | 22.86 | 6.00 | 5.79 | 74.88 | 51.81 | 80.67 | 7.18% | 92.82% | 64.22% |
| 24 | 90–92 | 40.53 | 6.55 | 22.93 | 5.64 | 4.89 | 75.65 | 51.97 | 80.54 | 6.07% | 93.93% | 64.52% |
| 25 | 94–96 | 38.75 | 6.61 | 18.55 | 8.75 | 6.88 | 72.66 | 52.24 | 79.54 | 8.65% | 91.35% | 65.68% |
| 26 | 98–100 | 39.19 | 7.50 | 18.16 | 5.06 | 10.23 | 69.91 | 56.92 | 80.14 | 12.77% | 87.23% | 71.02% |
| Mean | 38.66 | 5.86 | 18.57 | 5.24 | 7.51 | 68.33 | 52.04 | 75.84 | 9.65% | 90.35% | 68.71% | |
| Stdev | 3.16 | 1.61 | 4.96 | 2.01 | 3.83 | 4.34 | 5.17 | 6.47 | 4.11% | 4.11% | 4.75% | |
| Sample Number | Depth (cm) | Ex-P | Concentrations (mg/kg) | TP | Percentage to TP (%) | |||||||
|---|---|---|---|---|---|---|---|---|---|---|---|---|
| Fe-P | Ca-P | De-P | OP | IP | BAP | OP | IP | BAP | ||||
| 1 | 0–2 | 40.17 | 4.54 | 18.91 | 11.88 | 10.63 | 75.50 | 55.34 | 86.14 | 11.86% | 88.14% | 63.60% |
| 2 | 2–4 | 33.89 | 4.12 | 18.06 | 7.86 | 13.30 | 63.94 | 51.32 | 77.24 | 17.22% | 82.78% | 66.44% |
| 3 | 6–8 | 34.33 | 4.31 | 31.91 | 6.01 | 4.76 | 76.56 | 43.40 | 81.32 | 5.85% | 94.15% | 53.37% |
| 4 | 10–12 | 34.60 | 5.84 | 28.02 | 12.80 | 7.47 | 81.25 | 47.91 | 88.72 | 8.41% | 91.59% | 53.92% |
| 5 | 14–16 | 33.63 | 5.77 | 42.48 | 6.52 | 3.91 | 88.40 | 43.31 | 92.32 | 4.24% | 95.76% | 46.92% |
| 6 | 18–20 | 32.74 | 8.13 | 43.53 | 7.37 | 9.31 | 91.76 | 50.18 | 101.07 | 9.21% | 90.79% | 49.64% |
| 7 | 22–24 | 32.48 | 2.30 | 38.10 | 10.79 | 15.09 | 83.67 | 49.88 | 98.77 | 15.28% | 84.72% | 50.50% |
| 8 | 26–28 | 36.28 | 3.82 | 56.27 | 14.94 | 14.03 | 111.31 | 54.13 | 125.34 | 11.19% | 88.81% | 43.19% |
| 9 | 30–32 | 35.13 | 5.10 | 41.29 | 20.15 | 9.96 | 101.66 | 50.19 | 111.63 | 8.93% | 91.07% | 44.97% |
| 10 | 34–36 | 34.24 | 2.31 | 22.68 | 16.22 | 15.71 | 75.45 | 52.27 | 91.16 | 17.23% | 82.77% | 57.33% |
| 11 | 38–40 | 34.62 | 2.30 | 38.37 | 17.22 | 12.18 | 92.51 | 49.11 | 104.69 | 11.64% | 88.36% | 46.91% |
| 12 | 42–44 | 31.67 | 2.49 | 30.86 | 19.52 | 14.97 | 84.53 | 49.12 | 99.50 | 15.04% | 84.96% | 49.37% |
| 13 | 46–48 | 33.38 | 3.96 | 34.72 | 20.49 | 12.28 | 92.55 | 49.63 | 104.84 | 11.72% | 88.28% | 47.34% |
| 14 | 50–52 | 33.35 | 3.33 | 28.48 | 14.69 | 8.11 | 79.85 | 44.79 | 87.96 | 9.22% | 90.78% | 50.92% |
| 15 | 54–56 | 32.95 | 2.30 | 31.08 | 13.44 | 11.26 | 79.77 | 46.51 | 91.03 | 12.37% | 87.63% | 51.10% |
| 16 | 58–60 | 33.94 | 2.33 | 34.21 | 11.19 | 5.84 | 81.67 | 42.11 | 87.51 | 6.68% | 93.32% | 48.12% |
| 17 | 62–64 | 31.67 | 3.82 | 37.34 | 10.61 | 20.82 | 83.43 | 56.31 | 104.25 | 19.97% | 80.03% | 54.01% |
| 18 | 66–68 | 35.23 | 5.98 | 42.54 | 16.04 | 17.53 | 99.79 | 58.75 | 117.32 | 14.94% | 85.06% | 50.08% |
| 19 | 70–72 | 43.32 | 3.14 | 25.59 | 29.35 | 21.02 | 101.39 | 67.47 | 122.42 | 17.17% | 82.83% | 55.12% |
| 20 | 74–76 | 35.57 | 3.28 | 22.50 | 31.57 | 9.15 | 92.92 | 48.00 | 102.07 | 8.96% | 91.04% | 47.03% |
| 21 | 78–80 | 39.34 | 2.48 | 19.17 | 27.24 | 12.80 | 88.23 | 54.62 | 101.03 | 12.67% | 87.33% | 54.06% |
| 22 | 82–84 | 41.75 | 2.79 | 16.37 | 16.91 | 16.78 | 77.83 | 61.32 | 94.61 | 17.73% | 82.27% | 64.82% |
| 23 | 86–88 | 40.50 | 2.80 | 21.49 | 12.39 | 8.61 | 77.18 | 51.90 | 85.79 | 10.04% | 89.96% | 60.50% |
| 24 | 90–92 | 46.23 | 3.65 | 18.70 | 24.91 | 6.50 | 93.49 | 56.38 | 99.99 | 6.50% | 93.50% | 56.38% |
| 25 | 94–96 | 40.67 | 5.62 | 12.71 | 21.05 | 19.09 | 80.05 | 65.38 | 99.14 | 19.26% | 80.74% | 65.95% |
| 26 | 98–100 | 42.04 | 3.33 | 15.51 | 4.95 | 25.14 | 65.83 | 70.51 | 90.97 | 27.64% | 72.36% | 77.51% |
| Mean | 36.30 | 3.84 | 29.65 | 15.62 | 12.55 | 85.41 | 52.69 | 97.95 | 12.73% | 87.27% | 54.20% | |
| Stdev | 4.03 | 1.49 | 10.88 | 7.16 | 5.37 | 11.05 | 7.31 | 11.93 | 5.29% | 5.29% | 8.08% | |
| Sample Number | Depth (cm) | Ex-P | Concentrations (mg/kg) | TP | Percentage to TP (%) | |||||||
|---|---|---|---|---|---|---|---|---|---|---|---|---|
| Fe-P | Ca-P | De-P | OP | IP | BAP | OP | IP | BAP | ||||
| 1 | 0–2 | 31.71 | 1.32 | 6.76 | 14.59 | 5.86 | 52.81 | 37.33 | 58.67 | 9.82% | 90.18% | 63.49% |
| 2 | 2–4 | 29.32 | 8.81 | 7.98 | 14.08 | 4.39 | 60.19 | 42.52 | 64.58 | 6.79% | 93.21% | 65.84% |
| 3 | 6–8 | 28.26 | 4.30 | 9.47 | 13.01 | 12.41 | 55.05 | 44.97 | 67.45 | 18.39% | 81.61% | 66.66% |
| 4 | 10–12 | 30.04 | 12.11 | 6.85 | 14.29 | 8.16 | 55.96 | 42.99 | 64.13 | 12.04% | 87.96% | 65.91% |
| 5 | 14–16 | 30.22 | 0.50 | 9.94 | 1.89 | 8.10 | 42.56 | 38.82 | 50.65 | 15.98% | 84.02% | 76.64% |
| 6 | 18–20 | 30.46 | 1.04 | 8.47 | 2.69 | 7.51 | 42.67 | 39.01 | 50.18 | 14.96% | 85.04% | 77.75% |
| 7 | 22–24 | 32.40 | 6.00 | 12.05 | 15.35 | 12.96 | 65.79 | 51.36 | 78.75 | 16.46% | 83.54% | 65.22% |
| 8 | 26–28 | 27.95 | 6.81 | 5.44 | 17.52 | 11.52 | 57.72 | 46.28 | 69.23 | 16.63% | 83.37% | 66.84% |
| 9 | 30–32 | 32.01 | 3.54 | 7.13 | 4.37 | 8.35 | 47.04 | 43.90 | 55.39 | 15.08% | 84.92% | 79.24% |
| 10 | 34–36 | 34.30 | 12.86 | 6.82 | 25.51 | 4.87 | 79.49 | 52.03 | 84.36 | 5.77% | 94.23% | 61.68% |
| 11 | 38–40 | 32.49 | 5.46 | 7.67 | 12.08 | 5.30 | 57.71 | 43.26 | 63.01 | 8.41% | 91.59% | 68.65% |
| 12 | 42–44 | 36.36 | 1.59 | 4.33 | 5.97 | 24.58 | 48.24 | 62.52 | 72.82 | 33.76% | 66.24% | 85.86% |
| 13 | 46–48 | 36.73 | 3.54 | 6.58 | 15.71 | 12.71 | 62.56 | 52.98 | 75.27 | 16.89% | 83.11% | 70.38% |
| 14 | 50–52 | 37.89 | 0.78 | 8.81 | 24.32 | 6.12 | 71.78 | 44.78 | 77.91 | 7.86% | 92.14% | 57.48% |
| 15 | 54–56 | 36.45 | 0.49 | 7.63 | 17.24 | 6.04 | 61.81 | 42.98 | 67.85 | 8.90% | 91.10% | 63.35% |
| 16 | 58–60 | 30.91 | 1.33 | 6.30 | 4.09 | 1.95 | 42.63 | 34.19 | 44.58 | 4.37% | 95.63% | 76.68% |
| 17 | 62–64 | 31.13 | 1.31 | 2.95 | 14.72 | 13.68 | 50.12 | 46.13 | 63.80 | 21.44% | 78.56% | 72.30% |
| 18 | 66–68 | 32.29 | 1.05 | 3.26 | 18.75 | 9.37 | 55.35 | 42.72 | 64.72 | 14.48% | 85.52% | 66.00% |
| 19 | 70–72 | 29.13 | 4.31 | 4.58 | 16.04 | 5.96 | 54.07 | 39.41 | 60.03 | 9.93% | 90.07% | 65.65% |
| 20 | 74–76 | 37.72 | 3.56 | 1.89 | 18.28 | 10.02 | 61.44 | 51.29 | 71.46 | 14.02% | 85.98% | 71.78% |
| 21 | 78–80 | 31.59 | 5.45 | 6.55 | 24.16 | 6.28 | 67.76 | 43.32 | 74.03 | 8.48% | 91.52% | 58.51% |
| 22 | 82–84 | 29.61 | 16.30 | 7.43 | 16.58 | 5.35 | 69.92 | 51.26 | 75.27 | 7.11% | 92.89% | 68.10% |
| 23 | 86–88 | 41.82 | 1.61 | 17.42 | 5.49 | 6.68 | 66.33 | 50.11 | 73.01 | 9.15% | 90.85% | 68.63% |
| 24 | 90–92 | 31.95 | 0.77 | 7.88 | 22.65 | 14.10 | 63.25 | 46.82 | 77.35 | 18.23% | 81.77% | 60.53% |
| 25 | 94–96 | 37.94 | 2.72 | 5.21 | 26.29 | 11.63 | 72.16 | 52.29 | 83.79 | 13.88% | 86.12% | 62.40% |
| Mean | 32.83 | 4.30 | 7.18 | 14.63 | 8.96 | 58.58 | 45.73 | 67.53 | 13.15% | 86.85% | 68.22% | |
| Stdev | 3.61 | 4.24 | 3.11 | 7.20 | 4.63 | 9.87 | 6.19 | 10.35 | 6.26% | 6.26% | 6.85% | |
References
- Henriques, M.; Granadeiro, J.P.; Piersma, T.; Leao, S.; Pontes, S.; Catry, T. Assessing the contribution of mangrove carbon and of other basal sources to intertidal flats adjacent to one of the largest West African mangrove forests. Mar. Environ. Res. 2021, 169, 105331. [Google Scholar] [CrossRef] [PubMed]
- Wang, G.; Singh, M.; Wang, J.; Xiao, L.; Guan, D. Effects of marine pollution, climate, and tidal range on biomass and sediment organic carbon in Chinese mangrove forests. Catena 2021, 202, 105270. [Google Scholar] [CrossRef]
- Zakaria, R.; Chen, G.; Chew, L.L.; Sofawi, A.B.; Moh, H.H.; Chen, S.; Teoh, H.W.; Adibah, S.Y.S.N. Carbon stock of disturbed and undisturbed mangrove ecosystems in Klang Straits, Malaysia. J. Sea Res. 2021, 176, 102113. [Google Scholar] [CrossRef]
- Bhandari, U.; Arulkumar, A.; Ganeshkumar, A.; Paramasivam, S.; Rajaram, R.; Miranda, J.M. Metal accumulation and biomineralisation of coastal and mangrove-associated molluscs of Palk Bay, Southeastern India. Mar. Pollut. Bull. 2021, 167, 112259. [Google Scholar] [CrossRef]
- Lewis, D.B.; Jimenez, K.L.; Abd-Elrahman, A.; Andreu, M.G.; Landry, S.M.; Northrop, R.J.; Campbell, C.; Flower, H.; Rains, M.C.; Richards, C.L. Carbon and nitrogen pools and mobile fractions in surface soils across a mangrove saltmarsh ecotone. Sci. Total Environ. 2021, 798, 149328. [Google Scholar] [CrossRef]
- Puthusseri, R.M.; Nair, H.P.; Johny, T.K.; Bhat, S.G. Insights into the response of mangrove sediment microbiomes to heavy metal pollution: Ecological risk assessment and metagenomics perspectives. J. Environ. Manag. 2021, 298, 113492. [Google Scholar] [CrossRef]
- Pérez, A.; Machado, W.; Gutiérrez, D.; Saldarriaga, M.S.; Sanders, C.J. Shrimp farming influence on carbon and nutrient accumulation within Peruvian mangroves sediments. Estuar. Coast. Shelf Sci. 2020, 243, 106879. [Google Scholar] [CrossRef]
- Alongi, D.M. Mangrove forests: Resilience, protection from tsunamis, and responses to global climate change. Estuar. Coast. Shelf Sci. 2008, 76, 1–13. [Google Scholar] [CrossRef]
- Alam, M.I.; Ahsan, M.N.; Debrot, A.O.; Verdegem, M.C.J. Nutrients and anti-nutrients in leaf litter of four selected mangrove species from the Sundarbans, Bangladesh and their effect on shrimp (Penaeus monodon, Fabricius, 1798) post larvae. Aquaculture 2021, 542, 736865. [Google Scholar] [CrossRef]
- Liu, X.; Liu, H.; Chen, L.; Wang, X. Ecological interception effect of mangroves on microplastics. J. Hazard Mater. 2022, 423, 127231. [Google Scholar] [CrossRef]
- Pradit, S.; Noppradit, P.; Loh, P.-S.; Nitiratsuwan, T.; Le, T.P.Q.; Oeurng, C.; Mohamed, C.A.R.; Lee, C.W.; Lu, X.; Anshari, G.Z.; et al. The Occurrence of Microplastics in Sediment Cores from Two Mangrove Areas in Southern Thailand. J. Mar. Sci. Eng. 2022, 10, 418. [Google Scholar] [CrossRef]
- Vanegas, J.; Muñoz-García, A.; Pérez-Parra, K.A.; Figueroa-Galvis, I.; Mestanza, O.; Polanía, J. Effect of salinity on fungal diversity in the rhizosphere of the halophyte Avicennia germinans from a semi-arid mangrove. Fungal Ecol. 2019, 42, 100855. [Google Scholar] [CrossRef]
- Roy, A.K.D. Determinants of participation of mangrove-dependent communities in mangrove conservation practices. Ocean. Coast. Manag. 2014, 98, 70–78. [Google Scholar] [CrossRef]
- Hyacinthe, C.; Van Cappellen, P. An authigenic iron phosphate phase in estuarine sediments: Composition, formation and chemical reactivity. Mar. Chem. 2004, 91, 227–251. [Google Scholar] [CrossRef]
- Morales, M.I.; Masagca, J.T.; Araojo, A.E.; Vargas, S.R. Coastal and Mangrove Eco-Tourism in Catanduanes Island (Philippines): A Menace or a Bonus? In Proceedings of the International Conference on Latest Trends in Food, Biological & Ecological Sciences, Phuket, Thailand, 15–16 July 2014; pp. 15–16. [Google Scholar]
- Mohammad, N.N.; Sarker, R.A.H.M.; Biswajit, N.; Eivin, R.; Ma, S.; Paul, K. Economic valuation of tourism of the Sundarban Mangroves, Bangladesh. J. Ecol. Nat. Environ. 2021, 13, 100–109. [Google Scholar] [CrossRef]
- Asbridge, E.; Lucas, R.; Accad, A.; Dowling, R. Mangrove Response to Environmental Changes Predicted Under Varying Climates: Case Studies from Australia. Curr. For. Rep. 2015, 1, 178–194. [Google Scholar] [CrossRef] [Green Version]
- Payo, A.; Mukhopadhyay, A.; Hazra, S.; Ghosh, T.; Ghosh, S.; Brown, S.; Nicholls, R.J.; Bricheno, L.; Wolf, J.; Kay, S.; et al. Projected changes in area of the Sundarban mangrove forest in Bangladesh due to SLR by 2100. Clim Chang. 2016, 139, 279–291. [Google Scholar] [CrossRef] [Green Version]
- Aslan, A.; Rahman, A.F.; Robeson, S.M.; Ilman, M. Land-use dynamics associated with mangrove deforestation for aquaculture and the subsequent abandonment of ponds. Sci. Total Environ. 2021, 791, 148320. [Google Scholar] [CrossRef]
- Barbier, E.B. Economics: Account for depreciation of natural capital. Nature 2014, 515, 32–33. [Google Scholar] [CrossRef]
- Andree, C.; Marie Anne Eurie, F.; Niels, T.; Isabel, G.A.; Arne, D.; Wout, V.E.; Lenin, R.F.; Jasmine, R.; Liesbeth, J.; Pieter, S.; et al. From field to plate: Agricultural pesticide presence in the guayas estuary (Ecuador) and commercial mangrove crabs. Environ. Pollut. 2021, 289, 117955. [Google Scholar] [CrossRef]
- Banerjee, S.; Ghosh, S.; Singh, K.; Ghodke, M.; Sudarshan, M. Detection of metals and associated bacteria from Mumbai mangroves and their impact analysis. Reg. Stud. Mar. Sci. 2021, 48, 102007. [Google Scholar] [CrossRef]
- Kesavan, S.; Xavier, K.A.M.; Deshmukhe, G.; Jaiswar, A.K.; Bhusan, S.; Shukla, S.P. Anthropogenic pressure on mangrove ecosystems: Quantification and source identification of surficial and trapped debris. Sci. Total Environ. 2021, 794, 148677. [Google Scholar] [CrossRef] [PubMed]
- Rodríguez-Rodríguez, J.A.; Mancera-Pineda, J.E.; Tavera, H. Mangrove restoration in Colombia: Trends and lessons learned. For. Ecol. Manag. 2021, 496, 119414. [Google Scholar] [CrossRef]
- Wayan Eka Dharmawan, I. Mangrove health index distribution on the restored post-tsunami mangrove area in Biak Island, Indonesia. IOP Conf. Ser. Earth Environ. Sci. 2021, 860, 012007. [Google Scholar] [CrossRef]
- Hanggara, B.B.; Murdiyarso, D.; Ginting, Y.R.S.; Widha, Y.L.; Panjaitan, G.Y.; Lubis, A.A. Effects of diverse mangrove management practices on forest structure, carbon dynamics and sedimentation in North Sumatra, Indonesia. Estuar. Coast. Shelf Sci. 2021, 259, 107467. [Google Scholar] [CrossRef]
- Tachas, J.N.; Raoult, V.; Morris, R.L.; Swearer, S.E.; Gaston, T.F.; Strain, E.M.A. Eco-engineered mangroves provide complex but functionally divergent niches for estuarine species compared to natural mangroves. Ecol. Eng. 2021, 170, 106355. [Google Scholar] [CrossRef]
- Maza, M.; Lara, J.L.; Losada, I.J. Predicting the evolution of coastal protection service with mangrove forest age. Coast. Eng. 2021, 168, 103922. [Google Scholar] [CrossRef]
- Agaton, C.B.; Collera, A.A. Now or later? Optimal timing of mangrove rehabilitation under climate change uncertainty. For. Ecol. Manag. 2022, 503, 119739. [Google Scholar] [CrossRef]
- Xia, X.; Wu, Q.; Zhu, B.; Zhao, P.; Zhang, S.; Yang, L. Analyzing the contribution of climate change to long-term variations in sediment nitrogen sources for reservoirs/lakes. Sci. Total Environ. 2015, 523, 64–73. [Google Scholar] [CrossRef]
- Zhang, H.; Huo, S.; Yeager, K.M.; He, Z.; Xi, B.; Li, X.; Ma, C.; Wu, F. Phytoplankton response to climate changes and anthropogenic activities recorded by sedimentary pigments in a shallow eutrophied lake. Sci. Total Environ. 2019, 647, 1398–1409. [Google Scholar] [CrossRef]
- Guignard, M.S.; Leitch, A.R.; Acquisti, C.; Eizaguirre, C.; Elser, J.J.; Hessen, D.O.; Jeyasingh, P.D.; Neiman, M.; Richardson, A.E.; Soltis, P.S.; et al. Impacts of Nitrogen and Phosphorus: From Genomes to Natural Ecosystems and Agriculture. Front. Ecol. Evol. 2017, 5, 70. [Google Scholar] [CrossRef] [Green Version]
- Johnson, A.C.; Acreman, M.C.; Dunbar, M.J.; Feist, S.W.; Giacomello, A.M.; Gozlan, R.E.; Hinsley, S.A.; Ibbotson, A.T.; Jarvie, H.P.; Jones, J.I.; et al. The British river of the future: How climate change and human activity might affect two contrasting river ecosystems in England. Sci. Total Environ. 2009, 407, 4787–4798. [Google Scholar] [CrossRef] [PubMed] [Green Version]
- Coelho, J.P.; Flindt, M.R.; Jensen, H.S.; Lillebø, A.I.; Pardal, M.A. Phosphorus speciation and availability in intertidal sediments of a temperate estuary: Relation to eutrophication and annual P-fluxes. Estuar. Coast. Shelf Sci. 2004, 61, 583–590. [Google Scholar] [CrossRef] [Green Version]
- Hiriart-Baer, V.P.; Milne, J.E.; Marvin, C.H. Temporal trends in phosphorus and lacustrine productivity in Lake Simcoe inferred from lake sediment. J. Great Lakes Res. 2011, 37, 764–771. [Google Scholar] [CrossRef]
- Bastami, K.D.; Neyestani, M.R.; Raeisi, H.; Shafeian, E.; Baniamam, M.; Shirzadi, A.; Esmaeilzadeh, M.; Mozaffari, S.; Shahrokhi, B. Bioavailability and geochemical speciation of phosphorus in surface sediments of the Southern Caspian Sea. Mar. Pollut. Bull. 2018, 126, 51–57. [Google Scholar] [CrossRef]
- Cavalcante, H.; Araujo, F.; Noyma, N.P.; Becker, V. Phosphorus fractionation in sediments of tropical semiarid reservoirs. Sci. Total Environ. 2018, 619, 1022–1029. [Google Scholar] [CrossRef]
- Cong, M.; Jiang, T.; Qi, Y.-z.; Dong, H.-p.; Teng, D.-q.; Lu, S.-h. Phosphorus forms and distribution in Zhejiang coastal sediment in the East China Sea. Int. J. Sediment Res. 2014, 29, 278–284. [Google Scholar] [CrossRef]
- Kang, X.; Song, J.; Yuan, H.; Shi, X.; Yang, W.; Li, X.; Li, N.; Duan, L. Phosphorus speciation and its bioavailability in sediments of the Jiaozhou Bay. Estuar. Coast. Shelf Sci. 2017, 188, 127–136. [Google Scholar] [CrossRef]
- Loh, P.S.; Molot, L.A.; Nowak, E.; Nürnberg, G.K.; Watson, S.B.; Ginn, B. Evaluating relationships between sediment chemistry and anoxic phosphorus and iron release across three different water bodies. Inland Waters 2013, 3, 105–118. [Google Scholar] [CrossRef] [Green Version]
- Soliman, N.F.; El Zokm, G.M.; Okbah, M.A. Evaluation of phosphorus bioavailability in El Mex Bay and Lake Mariut sediments. Int. J. Sediment Res. 2017, 32, 432–441. [Google Scholar] [CrossRef]
- Barcellos, D.; Queiroz, H.M.; Nobrega, G.N.; de Oliveira Filho, R.L.; Santaella, S.T.; Otero, X.L.; Ferreira, T.O. Phosphorus enriched effluents increase eutrophication risks for mangrove systems in northeastern Brazil. Mar. Pollut. Bull. 2019, 142, 58–63. [Google Scholar] [CrossRef] [PubMed]
- Jiang, S.; Lu, H.; Liu, J.; Lin, Y.; Dai, M.; Yan, C. Influence of seasonal variation and anthropogenic activity on phosphorus cycling and retention in mangrove sediments: A case study in China. Estuar. Coast. Shelf Sci. 2018, 202, 134–144. [Google Scholar] [CrossRef]
- Weng, C.H.; Wang, D.G.; Han, F.J.; Shen, G.; Tan, Y.H.; Lv, D.A.; Weerasinghe, R. Study on the Driving Mechanism of Ecosystem Service Value on Ximen Island Based on STIRPAT Model. E3S Web Conf. 2018, 53, 03036. [Google Scholar] [CrossRef]
- Zhang, Z.; Hu, G.; Liang, S. Distribution, protection and ecological value of mangroves in China. Bull. Biol. 2006, 64, 9–11. (In Chinese) [Google Scholar] [CrossRef]
- Du, P.; Liu, J.; Zeng, J.; Chen, Q.; Zhu, X.; Gao, Y. Bacteria distribution and environmental characteristics in the sediment of Ximen lsland mangrove. Mar. Environ. Sci. 2014, 33, 763–771. (In Chinese) [Google Scholar] [CrossRef]
- Wang, A.; Chen, J.; Jing, C.; Ye, G.; Wu, J.; Huang, Z.; Zhou, C. Monitoring the Invasion of Spartina alterniflora from 1993 to 2014 with Landsat TM and SPOT 6 Satellite Data in Yueqing Bay, China. PLoS ONE 2015, 10, e0135538. [Google Scholar] [CrossRef] [Green Version]
- Zheng, J.; Wang, J.; Chen, Q.; Xu, J.; Li, X.; Lu, X.; Lei, H.; Zheng, S. Preliminary report on north-ward introduction experi-ment of several mangrove plants along the southern coast of Zhejiang Province. J. Southwest For. Univ. 2010, 30, 11–17. (In Chinese) [Google Scholar]
- Li, J.; Xu, H. Introduction and Afforestation Technique of Kandelia candel to the North. J. Zhejiang For. Sci. Technol. 2001, 23, 6–8. (In Chinese) [Google Scholar]
- Zhu, H.; Guo, Y.; Wu, C.; Zhang, L. Study on meiofauna abundance in mangrove of Ximen Island, Zhejiang province. J. Jimei Univ. Nat. Sci. 2020, 25, 241–247. (In Chinese) [Google Scholar] [CrossRef]
- Liao, Y.; Shou, L.; Tang, Y.; Zeng, J.; Chen, Q.; Yan, X. Effects of non-indigenous plants on food sources of intertidal macrobenthos in Yueqing Bay, China: Combining stable isotope and fatty acid analyses. Estuar. Coast. Shelf Sci. 2020, 241, 106801. [Google Scholar] [CrossRef]
- Wang, Q.; Song, L.; Agusti, S.; Duarte, C.; Christakos, G.; Wu, J. Changes of the Macrobenthos Community with Non-native Mangrove Rehabilitation (Kandelia obovata) and Salt Marsh Invasion (Spartina alterniflora) in Ximen Island, Zhejiang, China. Ocean Sci. J. 2021, 56, 395–405. [Google Scholar] [CrossRef]
- Chen, Q.; Yang, S.; Wang, J.; Liu, X.; Deng, R. Development history and discussion of mangrove forest in Zhejiang Province. J. Zhejiang Agric. Sci. 2019, 60, 1177–1181. (In Chinese) [Google Scholar] [CrossRef]
- Zhou, Z.; Xu, G.; Chen, Y.; Lin, Z. Ximen Island: “Guardian” of the northernmost mangroves area. Map 2020, 3, 56–69. (In Chinese) [Google Scholar]
- Ruttenberg, K.C. Development of a sequential extraction method for different forms of phosphorus in marine sediments. Limnol. Oceanogr. 1992, 37, 1460–1482. [Google Scholar] [CrossRef]
- Ruttenberg, K.C.; Berner, R.A. Authigenic apatite formation and burial in sediments from non-upwelling, continental margin environments. Geochim. Cosmochim. Acta 1993, 57, 991–1007. [Google Scholar] [CrossRef]
- Andrieux-Loyer, F.; Aminot, A. Phosphorus Forms Related to Sediment Grain Size and Geochemical Characteristics in French Coastal Areas. Estuar. Coast. Shelf Sci. 2001, 52, 617–629. [Google Scholar] [CrossRef] [Green Version]
- Kaiserli, A.; Voutsa, D.; Samara, C. Phosphorus fractionation in lake sediments—Lakes Volvi and Koronia, N. Greece. Chemosphere 2002, 46, 1147–1155. [Google Scholar] [CrossRef]
- Lake, B.A.; Coolidge, K.M.; Norton, S.A.; Amirbahman, A. Factors contributing to the internal loading of phosphorus from anoxic sediments in six Maine, USA, lakes. Sci. Total Environ. 2007, 373, 534–541. [Google Scholar] [CrossRef]
- Norton, S.A.; Coolidge, K.; Amirbahman, A.; Bouchard, R.; Kopacek, J.; Reinhardt, R. Speciation of Al, Fe, and P in recent sediment from three lakes in Maine, USA. Sci. Total Environ. 2008, 404, 276–283. [Google Scholar] [CrossRef]
- Zhuang, W.; Gao, X.; Zhang, Y.; Xing, Q.; Tosi, L.; Qin, S. Geochemical characteristics of phosphorus in surface sediments of two major Chinese mariculture areas: The Laizhou Bay and the coastal waters of the Zhangzi Island. Mar. Pollut. Bull. 2014, 83, 343–351. [Google Scholar] [CrossRef]
- Andrieux, F.; Aminot, A. A two-year survey of phosphorus speciation in the sediments of the Bay of Seine (France). Cont. Shelf Res. 1997, 17, 1229–1245. [Google Scholar] [CrossRef]
- Yang, Y.; Gao, B.; Hao, H.; Zhou, H.; Lu, J. Nitrogen and phosphorus in sediments in China: A national-scale assessment and review. Sci. Total Environ. 2017, 576, 840–849. [Google Scholar] [CrossRef] [PubMed]
- Sekula-Wood, E.; Benitez-Nelson, C.R.; Bennett, M.A.; Thunell, R. Magnitude and composition of sinking particulate phosphorus fluxes in Santa Barbara Basin, California. Glob. Biogeochem. Cycles 2012, 26. [Google Scholar] [CrossRef]
- Yang, B.; Liu, S.-M.; Wu, Y.; Zhang, J. Phosphorus speciation and availability in sediments off the eastern coast of Hainan Island, South China Sea. Cont. Shelf Res. 2016, 118, 111–127. [Google Scholar] [CrossRef]
- Meng, J.; Yao, P.; Yu, Z.; Bianchi, T.S.; Zhao, B.; Pan, H.; Li, D. Speciation, bioavailability and preservation of phosphorus in surface sediments of the Changjiang Estuary and adjacent East China Sea inner shelf. Estuar. Coast. Shelf Sci. 2014, 144, 27–38. [Google Scholar] [CrossRef]
- Ni, J.; Lin, P.; Zhen, Y.; Yao, X.; Guo, L. Distribution, source and chemical speciation of phosphorus in surface sediments of the central Pacific Ocean. Deep Sea Res. Part I 2015, 105, 74–82. [Google Scholar] [CrossRef]
- Nobrega, G.N.; Otero, X.L.; Macias, F.; Ferreira, T.O. Phosphorus geochemistry in a Brazilian semiarid mangrove soil affected by shrimp farm effluents. Environ. Monit. Assess 2014, 186, 5749–5762. [Google Scholar] [CrossRef]
- Ji, X.; Zhang, Y.; Zhu, D. Study on marine environment and recent coastal evolution of Yueqing Bay, Zhejiang province, China. Mar. Sci. Bull. 2006, 25, 44–53. (In Chinese) [Google Scholar] [CrossRef]
- Hu, J.; Loh, P.S.; Pradit, S.; Le, T.P.Q.; Oeurng, C.; Mohamed, C.A.R.; Lee, C.W.; Lu, X.; Anshari, G.Z.; Kandasamy, S.; et al. Assessing the Effect of Age and Geomorphic Setting on Organic Carbon Accumulation in High-Latitude Human-Planted Mangroves. Forests 2022, 13, 105. [Google Scholar] [CrossRef]
- Bala Krishna Prasad, M.; Ramanathan, A.L. Characterization of phosphorus fractions in the sediments of a tropical intertidal mangrove ecosystem. Wetl. Ecol. Manag. 2009, 18, 165–175. [Google Scholar] [CrossRef]
- Le, Y.; Hu, M.; Lai, X.; Wang, Y.; Xiao, L.; Wang, S.; Li, T.; Zhou, S. Changes of phosphorus speciation and enzyme activities in sediments of the Quanzhou Bay estuarine wetland under different vegetation restoration patterns. Acta Sci. Circumstantiae 2022, 4, 1–9. (In Chinese) [Google Scholar] [CrossRef]
- Xiong, Y.; Liao, B.; Proffitt, E.; Guan, W.; Sun, Y.; Wang, F.; Liu, X. Soil carbon storage in mangroves is primarily controlled by soil properties: A study at Dongzhai Bay, China. Sci. Total Environ. 2018, 619, 1226–1235. [Google Scholar] [CrossRef] [PubMed]
- Feng, J.; Zhou, J.; Wang, L.; Cui, X.; Ning, C.; Wu, H.; Zhu, X.; Lin, G. Effects of short-term invasion of Spartina alterniflora and the subsequent restoration of native mangroves on the soil organic carbon, nitrogen and phosphorus stock. Chemosphere 2017, 184, 774–783. [Google Scholar] [CrossRef] [PubMed]
- Sonzogni, W.C.; Chapra, S.C.; Armstrong, D.E.; Logan, T.J. Bioavailability of Phosphorus Inputs to Lakes. J. Environ. Qual. 1982, 11, 555–563. [Google Scholar] [CrossRef]
- Zhang, J.-E.; Liu, J.-L.; Ouyang, Y.; Liao, B.-W.; Zhao, B.-L. Removal of nutrients and heavy metals from wastewater with mangrove Sonneratia apetala Buch-Ham. Ecol. Eng. 2010, 36, 807–812. [Google Scholar] [CrossRef]
- Chen, H.; Liao, B.; Liu, B.; Peng, C.; Zhang, Y.; Guan, W.; Zhu, Q.; Yang, G. Eradicating invasive Spartina alterniflora with alien Sonneratia apetala and its implications for invasion controls. Ecol. Eng. 2014, 73, 367–372. [Google Scholar] [CrossRef]
- Ahlgren, J.; Tranvik, L.; Gogoll, A.; Waldebäck, M.; Markides, K.; Rydin, E. Sediment Depth Attenuation of Biogenic Phosphorus Compounds Measured by 31P NMR. Environ. Sci. Technol. 2005, 39, 867–872. [Google Scholar] [CrossRef]
- Borges, A.; Sanders, C.; Santos, H.; Araripe, D.; Machado, W.; Patchineelam, S. Accumulation of paralytic shellfish toxins in digestive gland of Octopus vulgaris during bloom events including the dinoflagellate Gymnodinium catenatum. Mar. Pollut. Bull. 2009, 58, 1747–1750. [Google Scholar] [CrossRef]
- Feng, J.; Cui, X.; Zhou, J.; Wang, L.; Zhu, X.; Lin, G. Effects of exotic and native mangrove forests plantation on soil organic carbon, nitrogen, and phosphorus contents and pools in Leizhou, China. Catena 2019, 180, 1–7. [Google Scholar] [CrossRef]


| Sampling Sites | Locations | Core Length (cm) | Number of Samples | Other Information | |
|---|---|---|---|---|---|
| Latitude | Longitude | ||||
| M1-L1 | 28°21′05″ N | 121°11′26″ E | 100 | 26 | Covered by an old mangrove forest and with the effects from the cold. |
| M1-S1 | 28°21′04″ N | 121°11′25″ E | 100 | 26 | In the seaward vegetation transition zone which has Spartina alterniflora. |
| M2-L2 | 28°20′39″ N | 121°10′19″ E | 100 | 26 | Covered by young Kandelia obovata plant. |
| M2-S2 | 28°20′39″ N | 121°10′18″ E | 96 | 25 | In mudflat on the seaward side. |
| M1-L1 | M1-S1 | M2-L2 | M2-S2 | All | |
|---|---|---|---|---|---|
| Ex–P (mg/kg) | 28.01–49.21 | 30.24–46.31 | 31.67–46.23 | 27.95–41.82 | 27.95–49.21 |
| Mean | 39.19 | 38.66 | 36.30 | 32.83 | 36.75 |
| Ex–P/TP | 29.30–49.92% | 38.10–58.22% | 28.95–47.21% | 39.34–69.34% | 29.30–69.34% |
| Mean | 42.06% | 50.98% | 37.05% | 48.61% | 44.68% |
| Fe–P (mg/kg) | 0.46–15.80 | 2.33–9.68 | 2.30–8.13 | 0.49–16.30 | 0.46–16.30 |
| Mean | 4.85 | 5.86 | 3.84 | 4.30 | 4.71 |
| Fe–P/TP | 0.51–15.49% | 3.05–12.09% | 2.20–8.04% | 0.73–21.66% | 0.51–21.66% |
| Mean | 5.21% | 7.73% | 3.92% | 6.37% | 5.81% |
| Ca–P (mg/kg) | 20.68–41.53 | 12.29–36.16 | 12.71–56.27 | 1.89–17.42 | 1.89–56.27 |
| Mean | 27.80 | 18.57 | 29.65 | 7.18 | 20.80 |
| Ca–P/TP | 22.76–45.82% | 18.66–45.56% | 12.82–46.02% | 2.64–23.85% | 2.64–45.82% |
| Mean | 29.84% | 24.48% | 30.27% | 10.63% | 23.81% |
| De–P (mg/kg) | 1.49–14.67 | 2.64–10.47 | 4.95–31.57 | 1.89–26.29 | 1.49–31.57 |
| Mean | 6.05 | 5.24 | 15.62 | 14.63 | 10.39 |
| De–P/TP | 1.64–15.35% | 2.94–16.10% | 5.45–30.93% | 3.73–32.64% | 1.64–21.64% |
| Mean | 6.49% | 6.90% | 15.95% | 21.66% | 12.75% |
| OP (mg/kg) | 7.50–21.56 | 3.23–17.97 | 3.91–25.14 | 1.95–24.58 | 1.95–25.14 |
| Mean | 15.28 | 7.51 | 12.55 | 8.96 | 11.08 |
| OP/TP | 8.13–23.35% | 4.84–19.99% | 4.24–27.64% | 4.37–33.76% | 4.24–33.76% |
| Mean | 16.46% | 9.65% | 12.73% | 13.15% | 13.00% |
| IP (mg/kg) | 66.83–97.68 | 58.85–75.65 | 63.94–111.31 | 42.56–79.49 | 42.56–111.31 |
| Mean | 77.89 | 68.33 | 85.41 | 58.58 | 72.55 |
| IP/TP | 76.65–91.87% | 80.01–95.16% | 72.36–95.76% | 66.24–95.63% | 66.24–95.76% |
| Mean | 83.54% | 90.35% | 87.27% | 86.85% | 87.00% |
| BAP (mg/kg) | 43.25–80.39 | 40.19–62.53 | 42.11–70.51 | 34.19–62.52 | 34.19–80.39 |
| Mean | 59.32 | 52.04 | 52.69 | 45.73 | 52.45 |
| BAP/TP | 47.72–71.30% | 50.99–74.51% | 43.19–77.51% | 57.48–85.86% | 43.19–85.86% |
| Mean | 63.64% | 68.71% | 54.20% | 68.22% | 63.69% |
| TP (mg/kg) | 79.45–113.99 | 63.91–89.90 | 77.24–125.34 | 44.58–84.36 | 44.58–113.99 |
| Mean | 93.16 | 75.84 | 97.95 | 67.53 | 83.62 |
| Study Area | Concentrations (mg/kg) | References | ||||||
|---|---|---|---|---|---|---|---|---|
| Ex-P | Fe-P | Ca-P | De-P | OP | IP | TP | ||
| The Jiulong Estuary mangrove, China | - | 223–793 | - | 100–200 | 100–200 | 721–1489 | 821–1689 | Jiang et al., 2018 [43] |
| Surface sediments in the Pichavaram mangrove, India | 49.6 | 172 | 122 | 92 | 58 | 403–473 | 451–552 | Prasad and Ramanathan, 2010 [71] |
| Core sediments in the Pichavaram mangrove, India | 29 | 126 | 144 | 138 | 450 | - | 459–530 | Prasad and Ramanathan, 2010 [71] |
| The Ximen Island mangrove, China | 36.75 | 4.71 | 20.80 | 10.39 | 11.08 | 42.56–111.31 | 44.58–113.99 | This study |
| HCl–P | NaOH–P | - | BAP | OP | IP | TP | ||
| Quanzhou Bay mangrove wetland, China | 60–96 | 107–151 | - | 63–106 | 144–192 | 297–530 | 492–726 | Le et al., 2022 [72] |
| Ex-P | Fe-P | Ca-P | De-P | OP | IP | BAP | TP | |
|---|---|---|---|---|---|---|---|---|
| (a) M1-L1 (n = 26) | ||||||||
| Ex-P | 1 | |||||||
| Fe-P | 0.218 | 1 | ||||||
| Ca-P | −0.160 | −0.280 | 1 | |||||
| De-P | −0.232 | 0.132 | −0.060 | 1 | ||||
| OP | −0.014 | 0.127 | −0.457 * | 0.055 | 1 | |||
| IP | 0.550 ** | 0.496 * | 0.429 * | 0.260 | −0.242 | 1 | ||
| BAP | 0.737 ** | 0.685 ** | −0.430 * | −0.059 | 0.468 * | 0.494 * | 1 | |
| TP | 0.552 ** | 0.556 ** | 0.241 | 0.288 | 0.180 | 0.911 ** | 0.700 ** | 1 |
| (b) M1-S1 (n = 26) | ||||||||
| Ex-P | 1 | |||||||
| Fe-P | −0.195 | 1 | ||||||
| Ca-P | −0.187 | −0.35 | 1 | |||||
| De-P | −0.286 | 0.378 | −0.388 | 1 | ||||
| OP | 0.128 | −0.131 | 0.322 | −0.348 | 1 | |||
| IP | 0.311 | 0.004 | 0.696 ** | −0.047 | 0.25 | 1 | ||
| BAP | 0.646 ** | 0.095 | 0.015 | −0.315 | 0.778 ** | 0.377 | 1 | |
| TP | 0.284 | −0.075 | 0.657 ** | −0.238 | 0.760 ** | 0.819 ** | 0.713 ** | 1 |
| (c) M2-L2 (n = 26) | ||||||||
| Ex-P | 1 | |||||||
| Fe-P | −0.097 | 1 | ||||||
| Ca-P | −0.596 ** | 0.273 | 1 | |||||
| De-P | 0.375 | −0.265 | −0.239 | 1 | ||||
| OP | 0.233 | −0.169 | −0.209 | 0.11 | 1 | |||
| IP | 0.007 | 0.197 | 0.649 ** | 0.513 ** | −0.072 | 1 | ||
| BAP | 0.702 ** | 0.025 | −0.426 * | 0.233 | 0.828 ** | −0.009 | 1 | |
| TP | 0.111 | 0.106 | 0.507 ** | 0.525 ** | 0.383 | 0.894 ** | 0.365 | 1 |
| (d) M2-S2 (n = 25) | ||||||||
| Ex-P | 1 | |||||||
| Fe-P | −0.331 | 1 | ||||||
| Ca-P | 0.212 | −0.01 | 1 | |||||
| De-P | 0.157 | 0.265 | −0.31 | 1 | ||||
| OP | 0.157 | −0.249 | −0.214 | −0.029 | 1 | |||
| IP | 0.430 * | 0.446 * | 0.167 | 0.805 ** | −0.128 | 1 | ||
| BAP | 0.515 ** | 0.222 | −0.036 | 0.254 | 0.684 ** | 0.479 * | 1 | |
| TP | 0.480 * | 0.314 | 0.063 | 0.754 ** | 0.325 | 0.896 ** | 0.763 ** | 1 |
Publisher’s Note: MDPI stays neutral with regard to jurisdictional claims in published maps and institutional affiliations. |
© 2022 by the authors. Licensee MDPI, Basel, Switzerland. This article is an open access article distributed under the terms and conditions of the Creative Commons Attribution (CC BY) license (https://creativecommons.org/licenses/by/4.0/).
Share and Cite
You, S.; Loh, P.; Li, Z.; Qin, H.; Pradit, S.; Le, T.P.Q.; Oeurng, C.; Mohamed, C.A.R.; Lee, C.W.; Lu, X.; et al. Geochemical Behavior of Sedimentary Phosphorus Species in Northernmost Artificial Mangroves in China. Forests 2022, 13, 610. https://0-doi-org.brum.beds.ac.uk/10.3390/f13040610
You S, Loh P, Li Z, Qin H, Pradit S, Le TPQ, Oeurng C, Mohamed CAR, Lee CW, Lu X, et al. Geochemical Behavior of Sedimentary Phosphorus Species in Northernmost Artificial Mangroves in China. Forests. 2022; 13(4):610. https://0-doi-org.brum.beds.ac.uk/10.3390/f13040610
Chicago/Turabian StyleYou, Shuzhen, Peisun Loh, Zilong Li, Haiyan Qin, Siriporn Pradit, Thi Phuong Quynh Le, Chantha Oeurng, Che Abdul Rahim Mohamed, Choon Weng Lee, Xixi Lu, and et al. 2022. "Geochemical Behavior of Sedimentary Phosphorus Species in Northernmost Artificial Mangroves in China" Forests 13, no. 4: 610. https://0-doi-org.brum.beds.ac.uk/10.3390/f13040610