Article

Comparative Analyses of 35 Complete Chloroplast Genomes from the Genus Dalbergia (Fabaceae) and the Identification of DNA Barcodes for Tracking Illegal Logging and Counterfeit Rosewood

1
State Key Laboratory of Tree Genetics and Breeding, Research Institute of Tropical Forestry, Chinese Academy of Forestry, Guangzhou 510520, China
2
Shenzhen Branch, Guangdong Laboratory for Lingnan Modern Agriculture, Genome Analysis Laboratory of the Ministry of Agriculture, Agricultural Genomics Institute at Shenzhen, Chinese Academy of Agricultural Sciences, Shenzhen 518120, China
3
Department of Agricultural Biology, Colorado State University, Fort Collins, CO 80523, USA
4
Kunpeng Institute of Modern Agriculture at Foshan, Foshan 528200, China
*
Authors to whom correspondence should be addressed.
Submission received: 17 March 2022 / Revised: 12 April 2022 / Accepted: 14 April 2022 / Published: 16 April 2022
(This article belongs to the Section Genetics and Molecular Biology)

Abstract

:
The genus Dalbergia contains more than 200 species, several of which are trees that produce traditional medicines and extremely high-value timber commonly referred to as rosewood. Due to the rarity of these species in the wild, the high value of the timber, and a growing international illicit trade, CITES (Convention on International Trade in Endangered Species of Wild Fauna and Flora) has listed the entire genus in appendix II and the species Dalbergia nigra in appendix I because species in this genus are considered at risk of extinction. Given this, and the fact that species or even genus level determination is nearly impossible from cut timber morphology, alternative molecular methods are needed to identify and track intercepted rosewood. To better identify rosewood using molecular methods, we sequenced and assembled eight chloroplast genomes including D. nigra as well as conducted comparative analyses with all other available chloroplast genomes in Dalbergia and closely related lineages. From these analyses, numerous repeats including simple sequence repeats (SSR) and conserved nucleotide polymorphisms unique to subclades within the genus were detected. From phylogenetic analysis based on the CDS from 77 chloroplast genes, the groups Siam rosewood and scented rosewood resolved as monophyletic, supporting the morphological traits used to delimit these species. In addition, several instances of paraphyly and polyphyly resulting from mismatches between taxonomic determinations and phylogenetic tree topology were identified. Ultimately, the highly variable regions in the chloroplast genomes will provide useful plastid markers for further studies regarding the identification, phylogeny, and population genetics of Dalbergia species, including those frequently intercepted in illegal trade.

1. Introduction

The genus Dalbergia L.f. in the tribe Dalbergieae (DC.) Cardoso and family Fabaceae is made up of approximately 275 species of trees, shrubs, and lianas. The genus is widely distributed worldwide, with species occurring in the tropics and subtropics of South and Central America, Africa, Madagascar, and Asia [1,2,3]. Several tree species in the genus are highly valued for producing premium darkly colored, dense, and sometimes fragrant wood used in a variety of applications such as the production of musical instruments, traditional medicine, fine furniture, cabinetry, and veneers. By way of example, rosewood furniture in China can range from thousands of dollars for an ornate chair to millions of dollars (USD) for a bed frame [3]. The main species used to produce high-quality timber are loosely grouped into the three categories (made up of several species in each group) black rosewood, scented rosewood, and Siam rosewood, based mainly on characteristics of the wood. The black and Siam rosewoods are the most highly valued [4,5].
The extremely high value of rosewood has led to large scale illegal logging and international trade involving numerous countries where rosewood is native. The main centers of rosewood logging are found in Central and South America [6,7], Africa and Madagascar [8,9], and Southeast Asia [10,11]. Madagascar is an area of particular concern given the high number of endemic Dalbergia species (42 spp.) and the presence of organized syndicates taking advantage of the political and economic instability in the country [12,13,14]. Rosewood is considered the most trafficked group of endangered species in the world with the value of global seizures exceeding ivory, rhino horn, and big cats combined [15].
Because of illegal trade, overexploitation, and the similarity of wood between some species, the entire Dalbergia genus is protected under CITES (Convention on International Trade in Endangered Species of Wild Fauna and Flora) appendix II [16]. The Brazilian species Dalbergia nigra (Vell.) Benth endemic to the Bahia interior forest ecoregion, is considered highly threatened with extinction and has been listed in appendix I of CITES [16] prohibiting all international trade. In addition to listing in appendix II of CITES [16], D. fusca Pierre and D. odorifera T.C. Chen are also listed in China’s key protection list. Given the illegal trade in rosewood and difficulty in differentiating Dalbergieae species based on a lack of morphological differences in confiscated specimens, a means of effectively identifying different rosewood species is needed. In parallel with tracking illegal trade of rosewood, programs that could be developed to produce licit rosewood timber will also benefit from routine molecular identification and tracking as part of a robust certification program.
In studies of plant biology, many different kinds of molecular markers have been developed, including SSRs (simple sequence repeats), and a variety of short (500–1000 bp) DNA sequences referred to as barcodes for the identification of species and populations [17]. The cost of sequencing has rapidly decreased in recent years, with concurrent increases in throughput making the discovery and development of diagnostic markers more efficient and cost-effective even for a large number of species [18]. Given the utility of DNA-barcode-based identification, numerous different barcode regions from different cellular compartments have been proposed in plants [19]. Hassold et al. [20] analyzed DNA barcoding (matK, rbcL, trnL (UAA)) of Dalbergia and found that subgroup-based species identification had a higher success rate, but this method also had limitations on distinguishing individual species. In recent years, super DNA barcodes have been applied to entire chloroplast genome sequences, as in the comparative analyses of complete plant chloroplast genomes [21,22,23]. These studies have also been carried out in Dalbergia and are mainly focused on clade of scented rosewood and Siam rosewood [2]. Unlike the relatively large and complex nuclear genome, the chloroplast genome has several advantages, including uniparental inheritance, high information content (in variable sites), very low recombination rates, and high copy number, making chloroplast genomes and chloroplast barcodes ideally suited for studies in plant systematics [24,25], population genetics [26,27] and plant taxonomy [19]. Moreover, this high copy number of chloroplasts enables chloroplast DNA to be detected from wood products in which DNA amplification rates varied from parts of wood [28]. The conserved gene content and structural arrangement of chloroplast genomes in two inverted repeat regions (IRs), a long single-copy region (LSC), and a short single-copy region (SSC) make assembly and alignment of chloroplast genomes more complete and less error-prone than with plant nuclear or mitochondrial genomes. Additionally, because a large number of complete chloroplast genomes are available in public databases, comparative analyses and searches are more accurate and thorough than with any other complete genome data in plants. Based on the advantages outlined above, the whole chloroplast genome and barcodes derived therefrom would be ideal for identifying Dalbergia species from wood samples.
To isolate informative molecular markers useful for species identification from wood material, we conducted the following analyses: (1) sequenced, assembled, and annotated the chloroplast genomes of eight Dalbergia species (including the CITES listed appendix I D. nigra, which has never been reported) using next-generation sequencing methods; (2) conducted a phylogenetic analysis to infer the relationships among Dalbergia species; and (3) comprehensively analyzed the highly variable regions and conserved nucleotide sites unique to each clade in Dalbergia that could be employed for DNA-barcode-based identification.

2. Results and Discussion

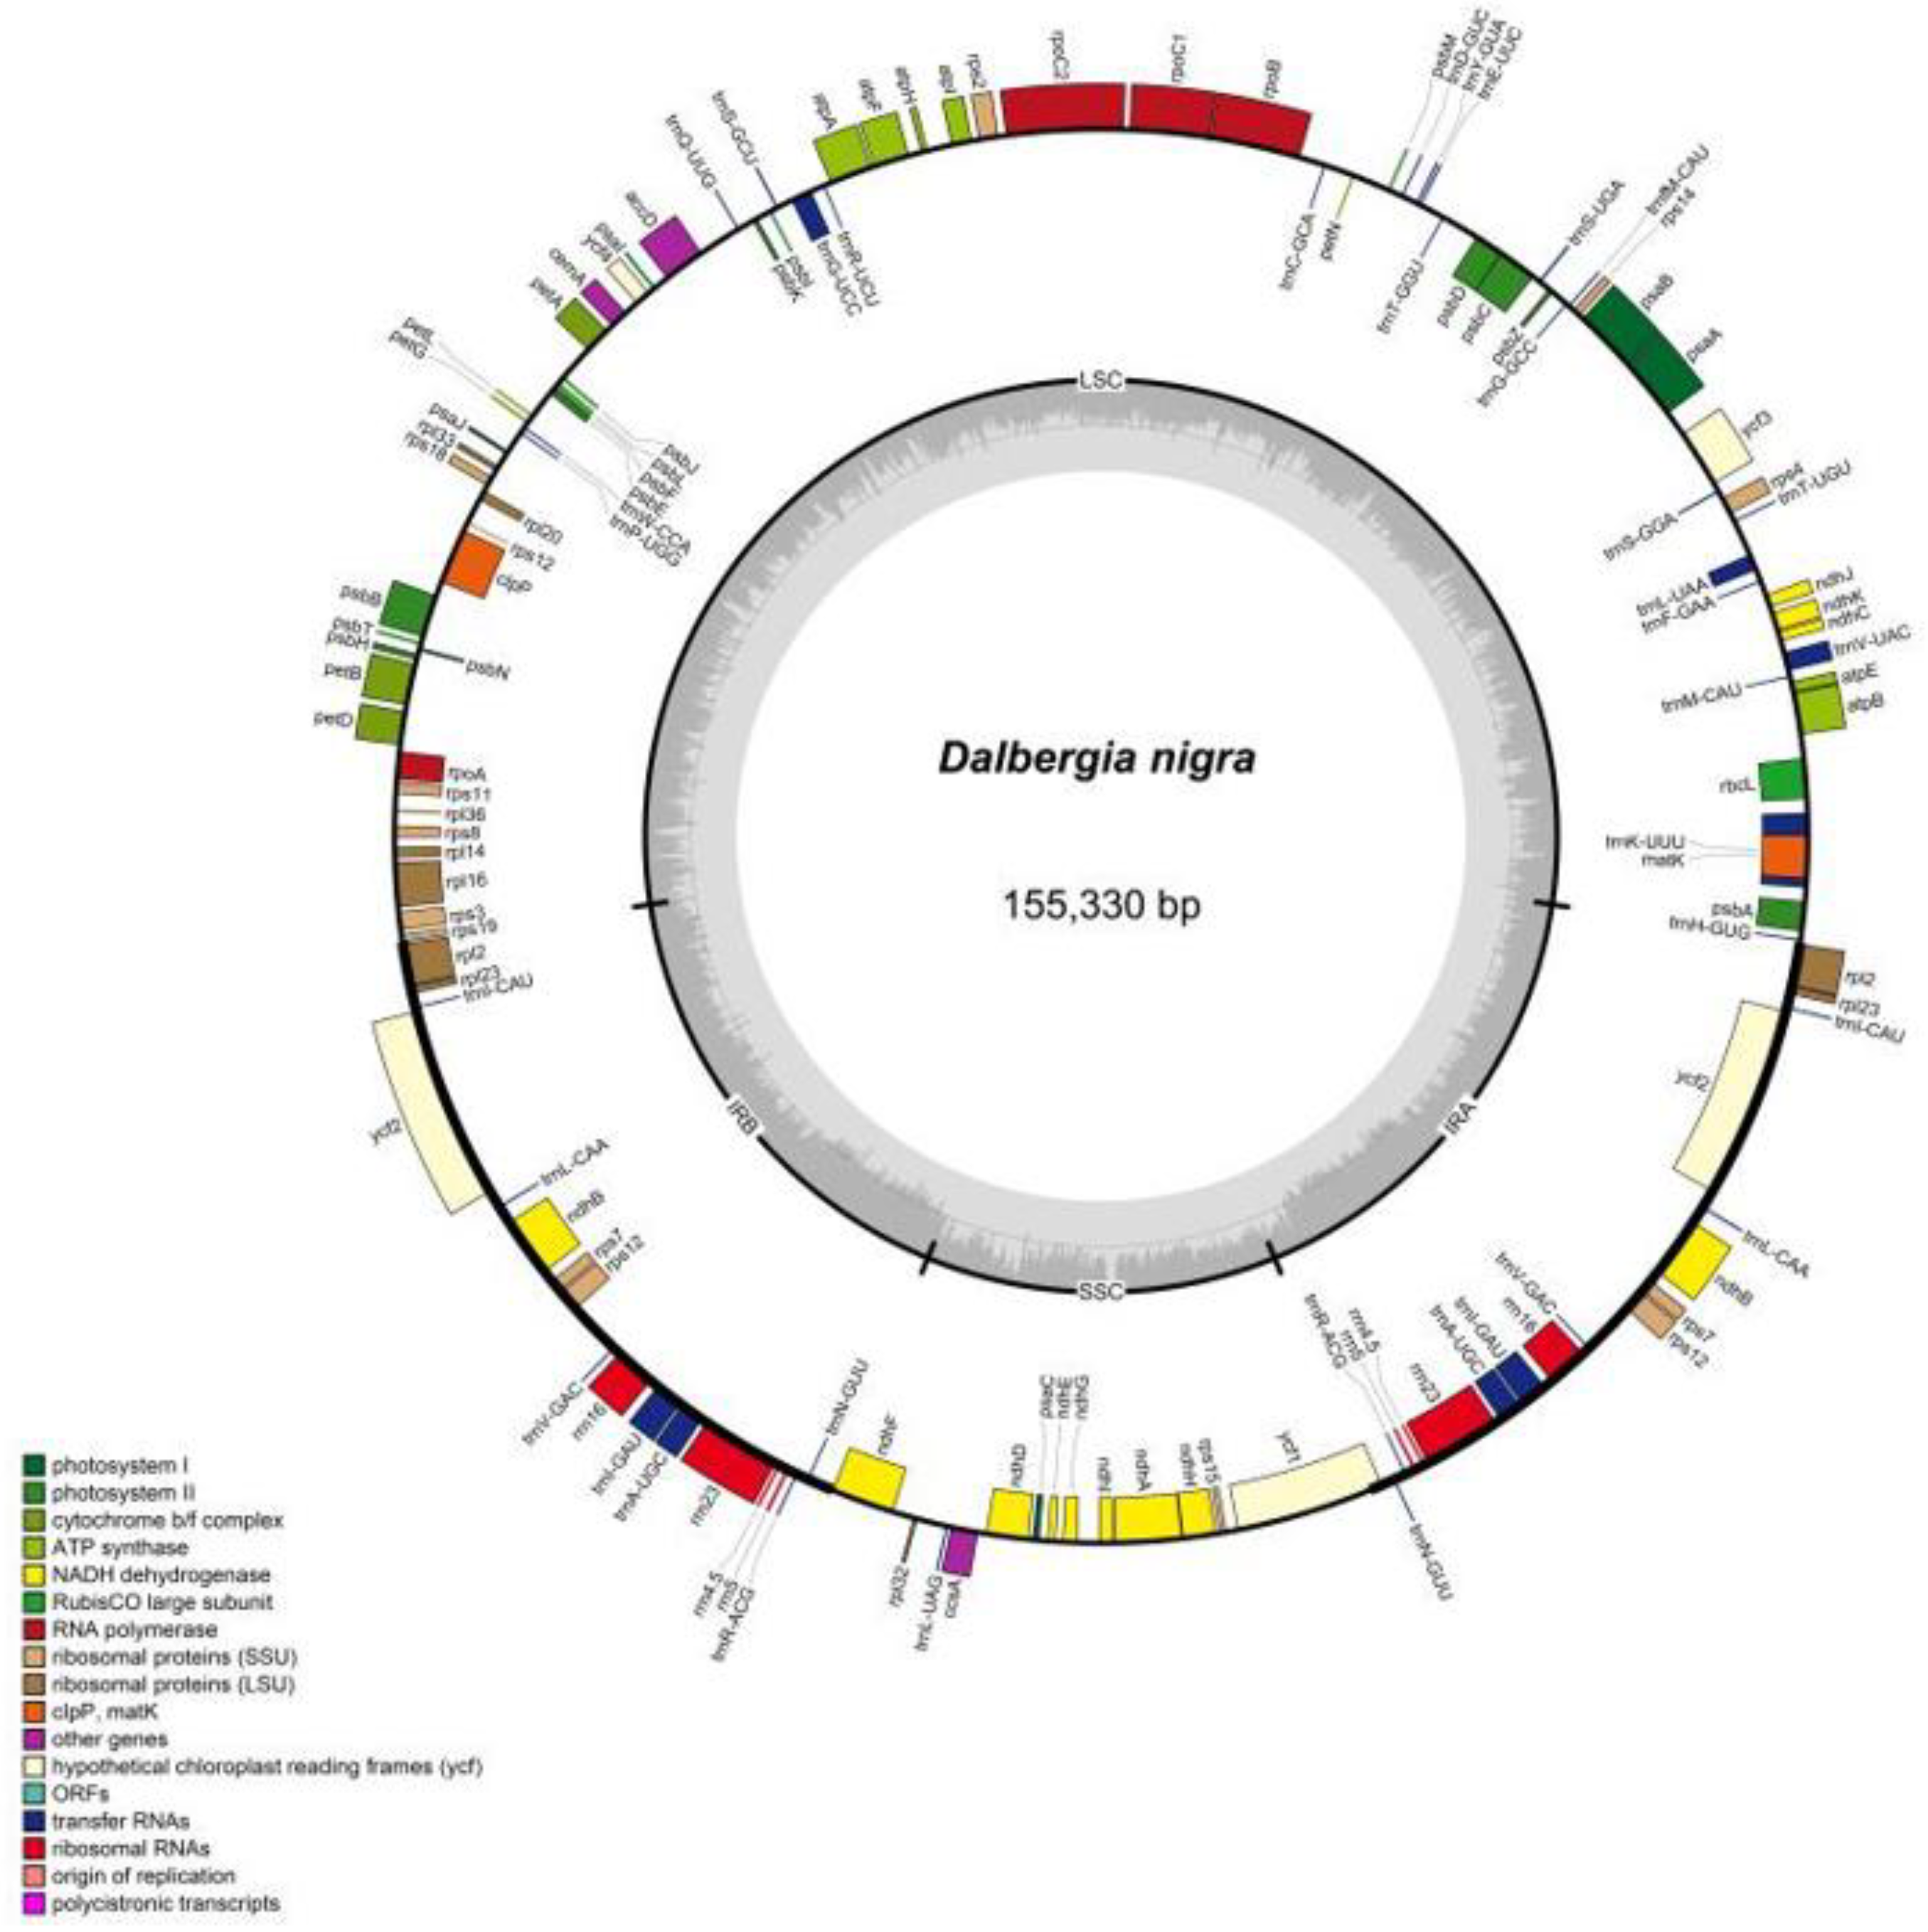
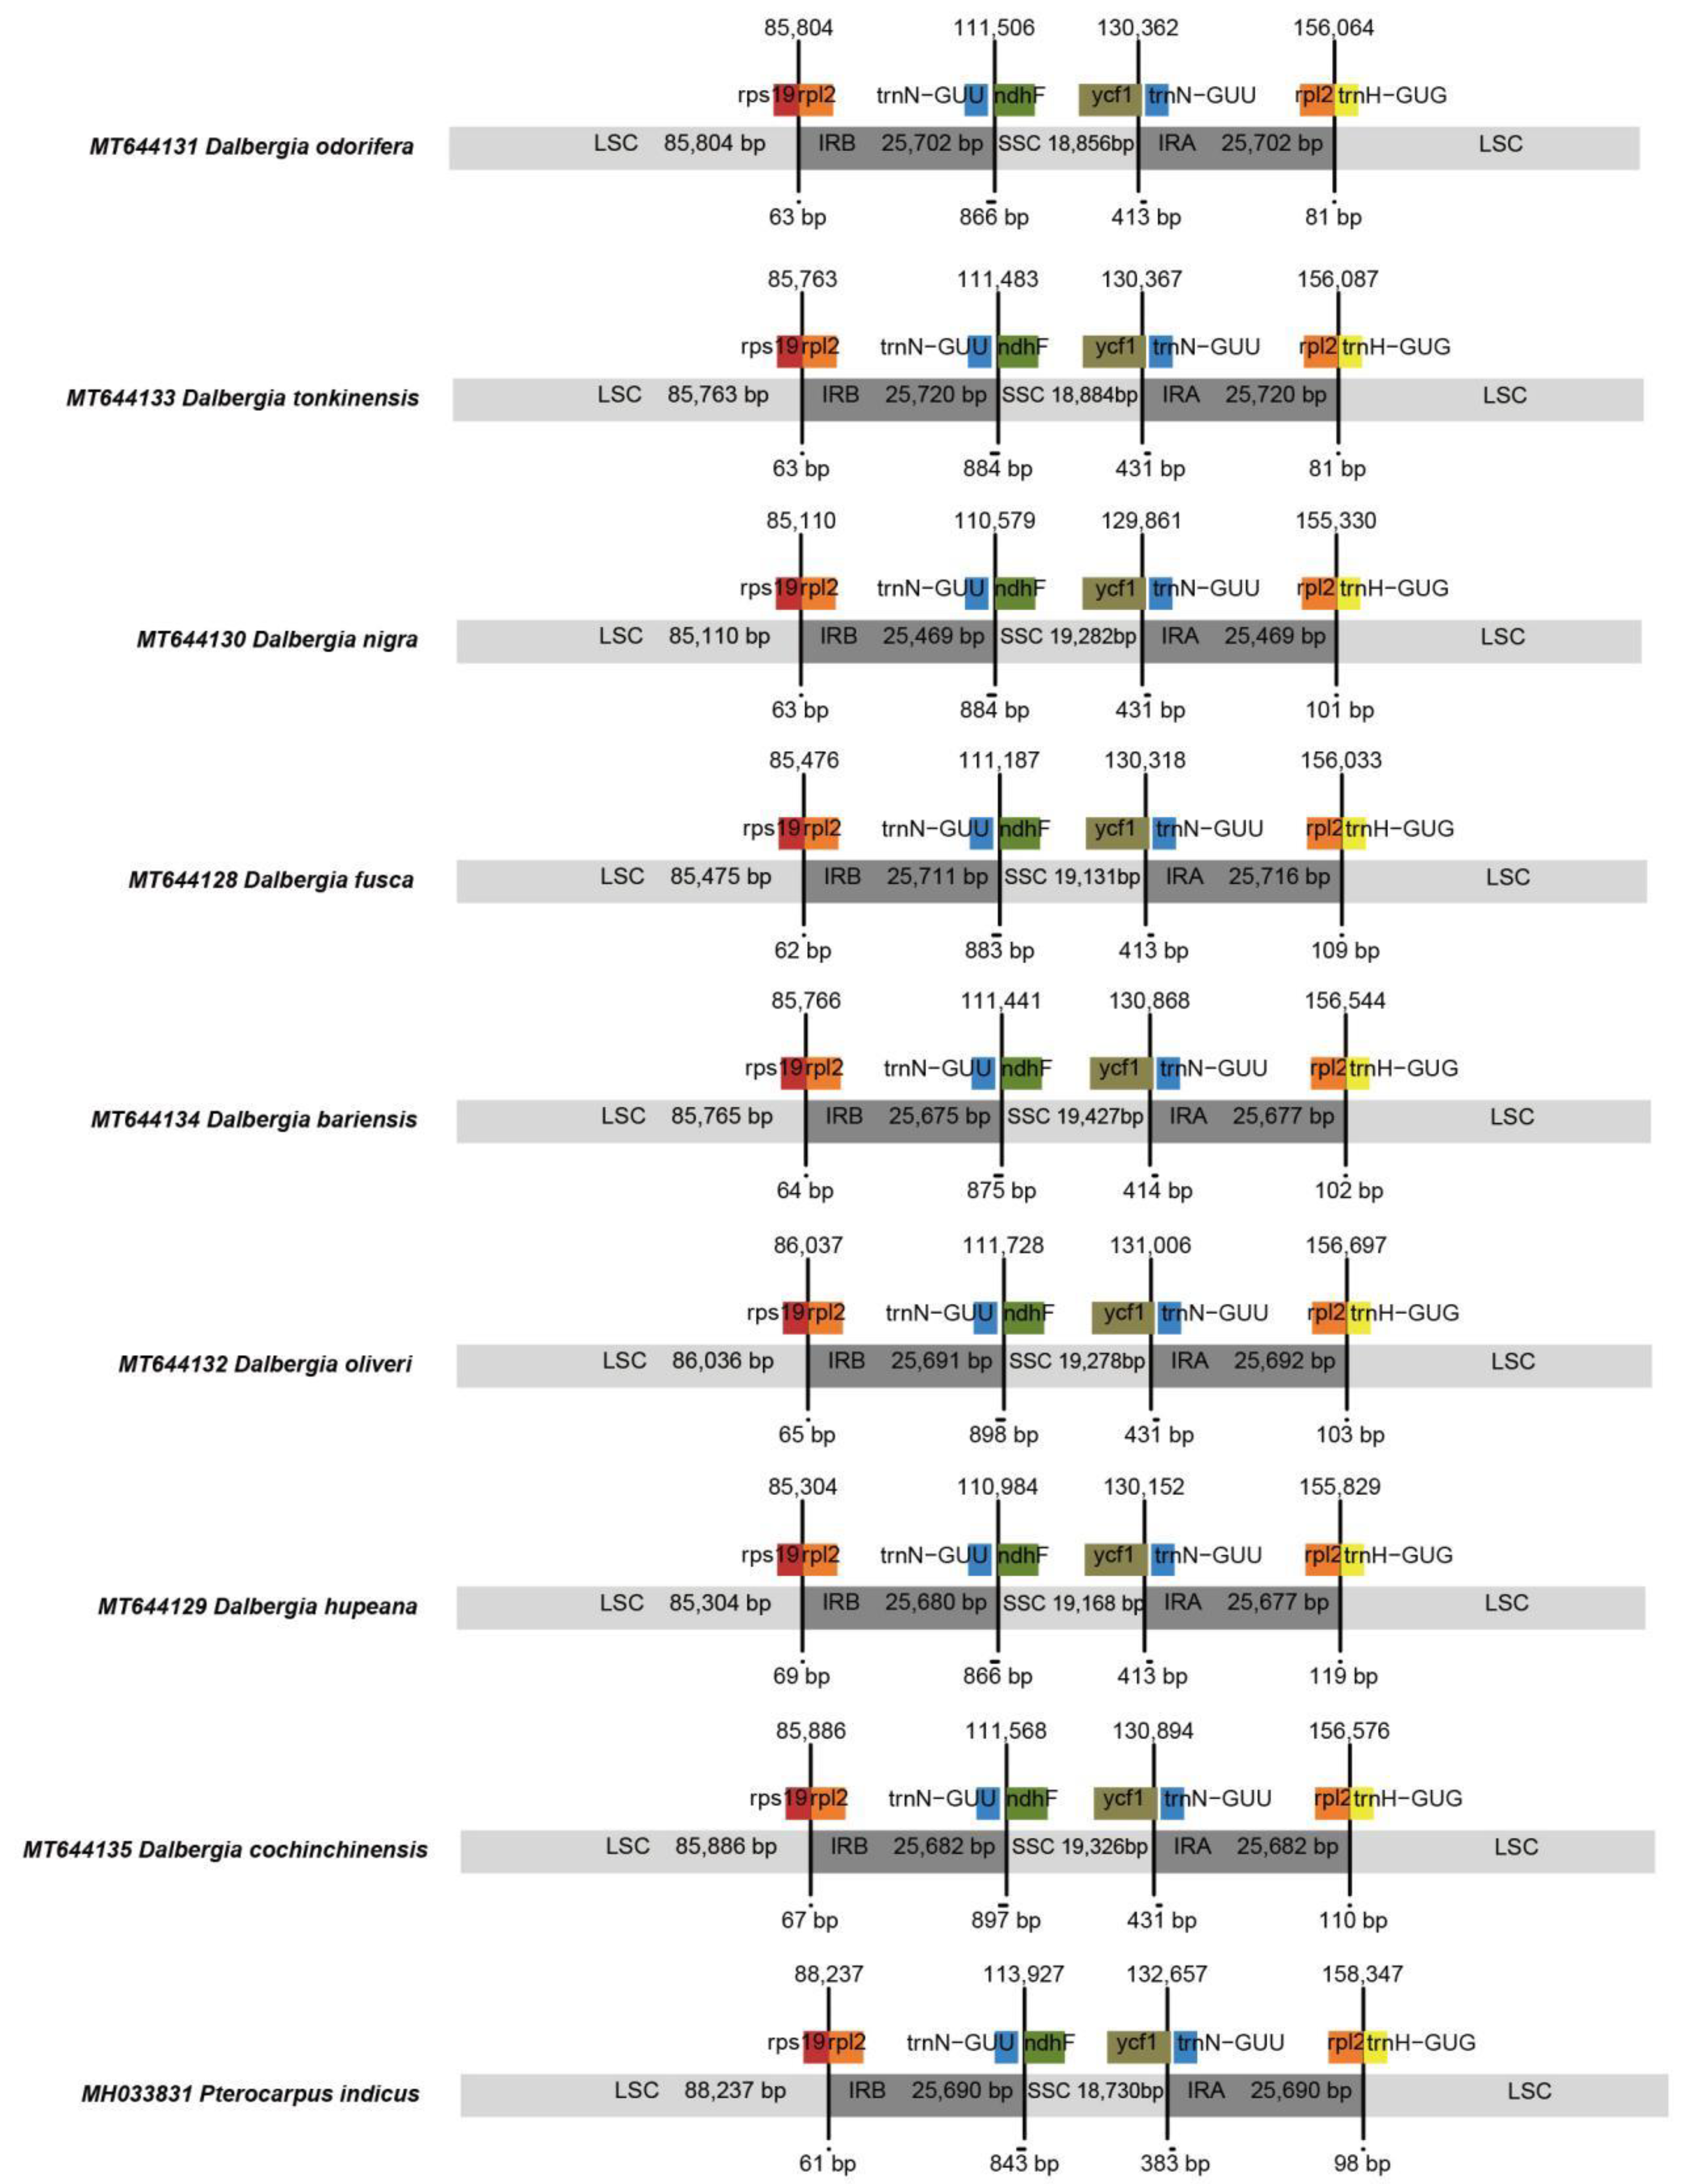
2.1. Complete Chloroplast Genomes

The complete chloroplast genome lengths of the eight Dalbergia species sequenced as part of this study range from 155,330 bp to 156,697 bp and were all typically circular in structure (Figure 1, Supplemental Figure S1, Table 1). The length of each chloroplast genome was D. nigra (MT644130) 155,330 bp, D. hupeana Hance (MT644129) 155,829 bp, D. fusca (MT644128) 156,033 bp, D. odorifera (MT644131) 156,064 bp, D. tonkinensis Prain (MT644133) 156,087 bp, D. bariensis Pierre (MT644134) 156,544 bp, D. cochinchinensis Pierre (MT644135) 156,576 bp, and D. oliveri Prain (MT644132) 156,697 bp, which were consistent with other chloroplast genomes in Dalbergia (Song et al. 2019). The IR regions are also similar in length, ranging from 25,469 to 25,720 bp, separated by an LSC region (85,110–86,036 bp) and an SSC region (18,856–19,427 bp; Table 1; Supplemental Table S1). In general, the genome sequences of species in Dalbergia were similar in length.
In addition to being similar in genome length and overall structure, the number and types of genes are also very similar among the newly sequenced genomes. The annotated coding genes included 45 photosynthesis-related genes (atpA, atpB, atpE, atpF, atpH, atpI, cemA, ndhA, ndhB, ndhC, ndhD, ndhE, ndhF, ndhG, ndhH, ndhI, ndhJ, ndhK, petA, petB, petD, petG, petL, petN, psaA, psaB, psaC, psaI, psaJ, psbA, psbB, psbC, psbD, psbE, psbF, psbH, psbI, psbJ, psbK, psbL, psbM, psbN, psbT, psbZ, and rbcL), 20 ribosomal protein genes (rpl14, rpl16, rpl2, rpl20, rpl23, rpl32, rpl33, rpl36, rps11, rps12, rps14, rps15, rps16, rps18, rps19, rps2, rps3, rps4, rps7, and rps8), 4 transcription/translation genes (rpoA, rpoB, rpoC1, and rpoC2), 4 miscellaneous protein genes (accD, ccsA, clpP and matK), and 4 conserved ORFs, (ycf1-4) (). Introns were found in the 12 coding genes atpF, clpP, ndhA, ndhB, petB, petD, rpl16, rpl2, rpoC1, rps12, rps16, and ycf3. Among the intron-containing genes, ycf3 and clpP contained two introns, while the 10 other genes contained a single intron.
Along with the 8 Dalbergia chloroplast genomes newly sequenced in this study, an additional 27 published genomes from Dalbergia, 4 from Arachis L., 2 from Pterocarpus Jacq. (which also produce a rosewood-type timber), 1 from Tipuana tipu (Benth.) Kuntze, and an outgroup species Amorpha fruticosa L. were employed where larger comparative analysis was appropriate (Supplemental Tables S1 and S3). In comparing these 43 chloroplast genomes, they contained either 82 or 83 coding genes, 37 tRNA genes, and 8 rRNA genes, among which the genes rpl2, rpl23, ycf2, ndhB, rps7, and rps12 have two copies due to duplication in the IR region. The exception to this is D. oliveri (MT644132) in which only a single copy of ycf2 is found with the second copy having been truncated (Table 1; Supplemental Tables S1 and S2).
The ndhF gene spans the IRB SSC junction in most Dalbergia species (Supplemental Table S1). The SSC and IRA junction is spanned by ycf1 in all 43 chloroplast genomes, while no gene spans the IRA and LSC junction. The intergenic region that spans the IRA and LSC junction varies widely in length across the 43 chloroplast genomes with the distance between trnN-GUU and ndhF ranging from 864 bp to 1668 bp. Even within a species, this region was found to vary as in D. tonkinensis with the distance ranging from 882 bp to 900 bp. Similarly, the intergenic region between ycf1 and trnN-GUU varied from 411 bp to 429 bp across the D. tonkinensis chloroplast genomes (Figure 2, Supplemental Figure S2, Supplemental Table S1). The expansion and contraction of the SSC region across the samples used in this study might make this region a loci candidate for marker development.

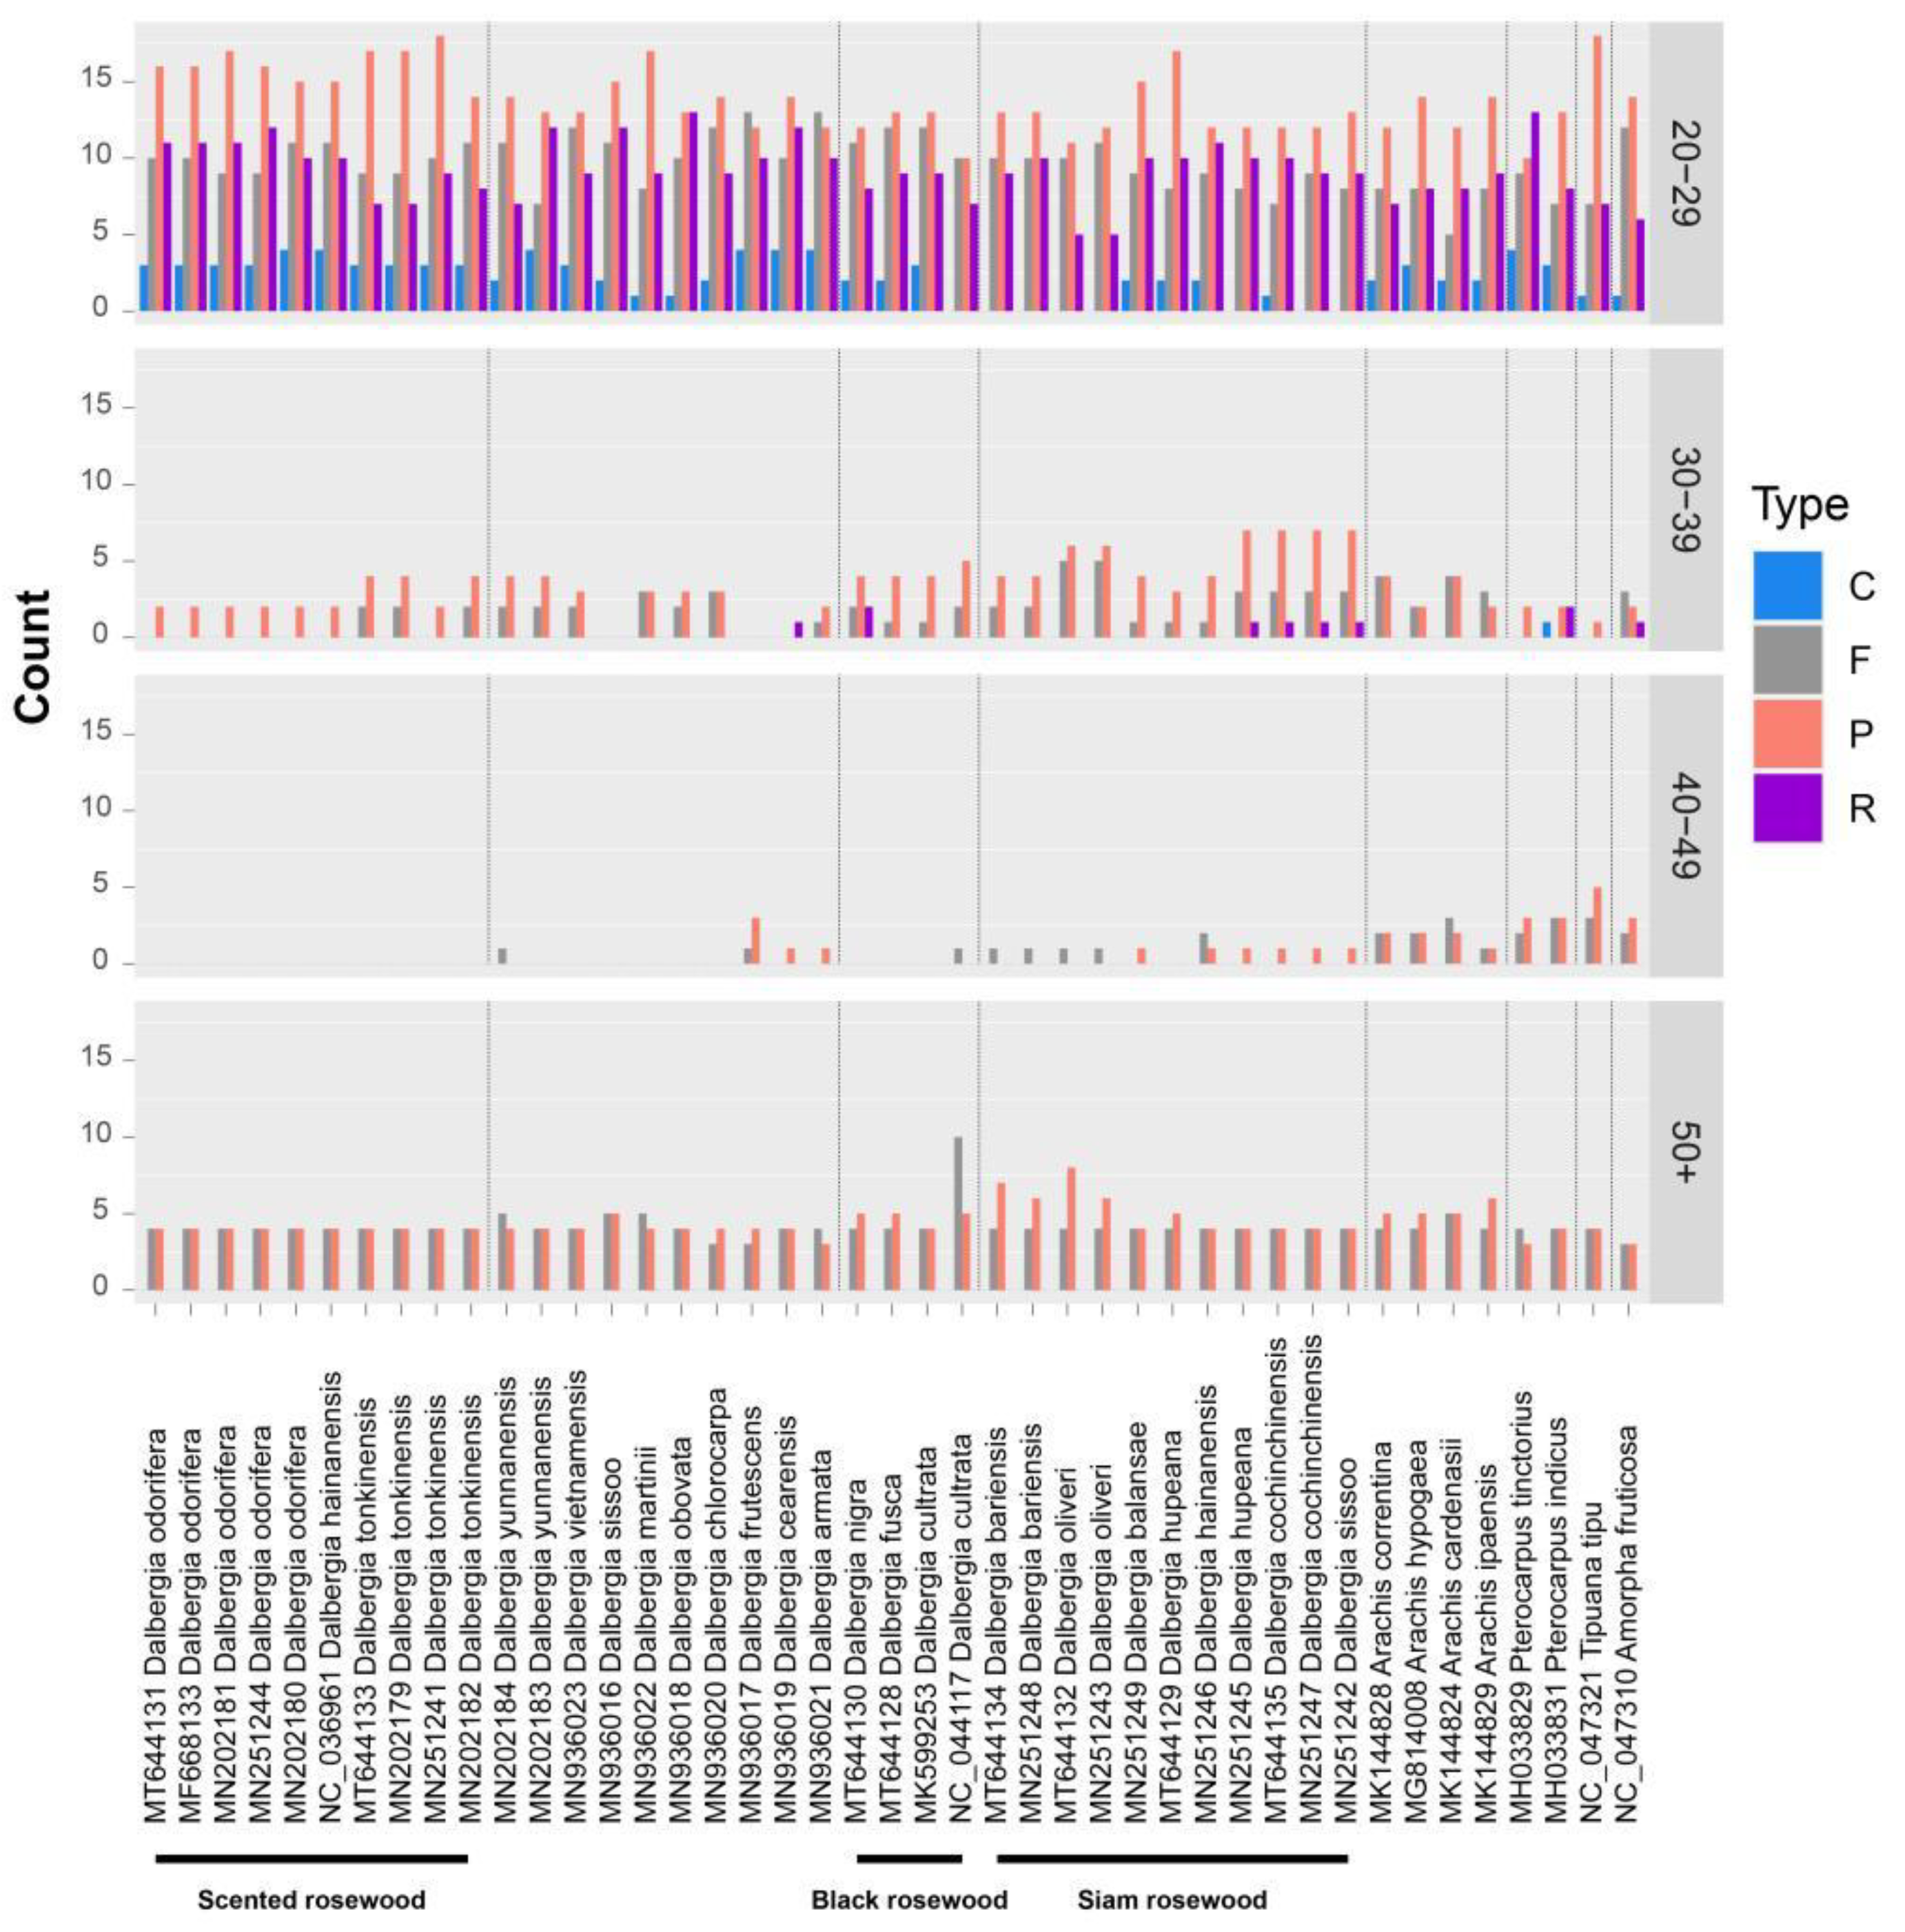
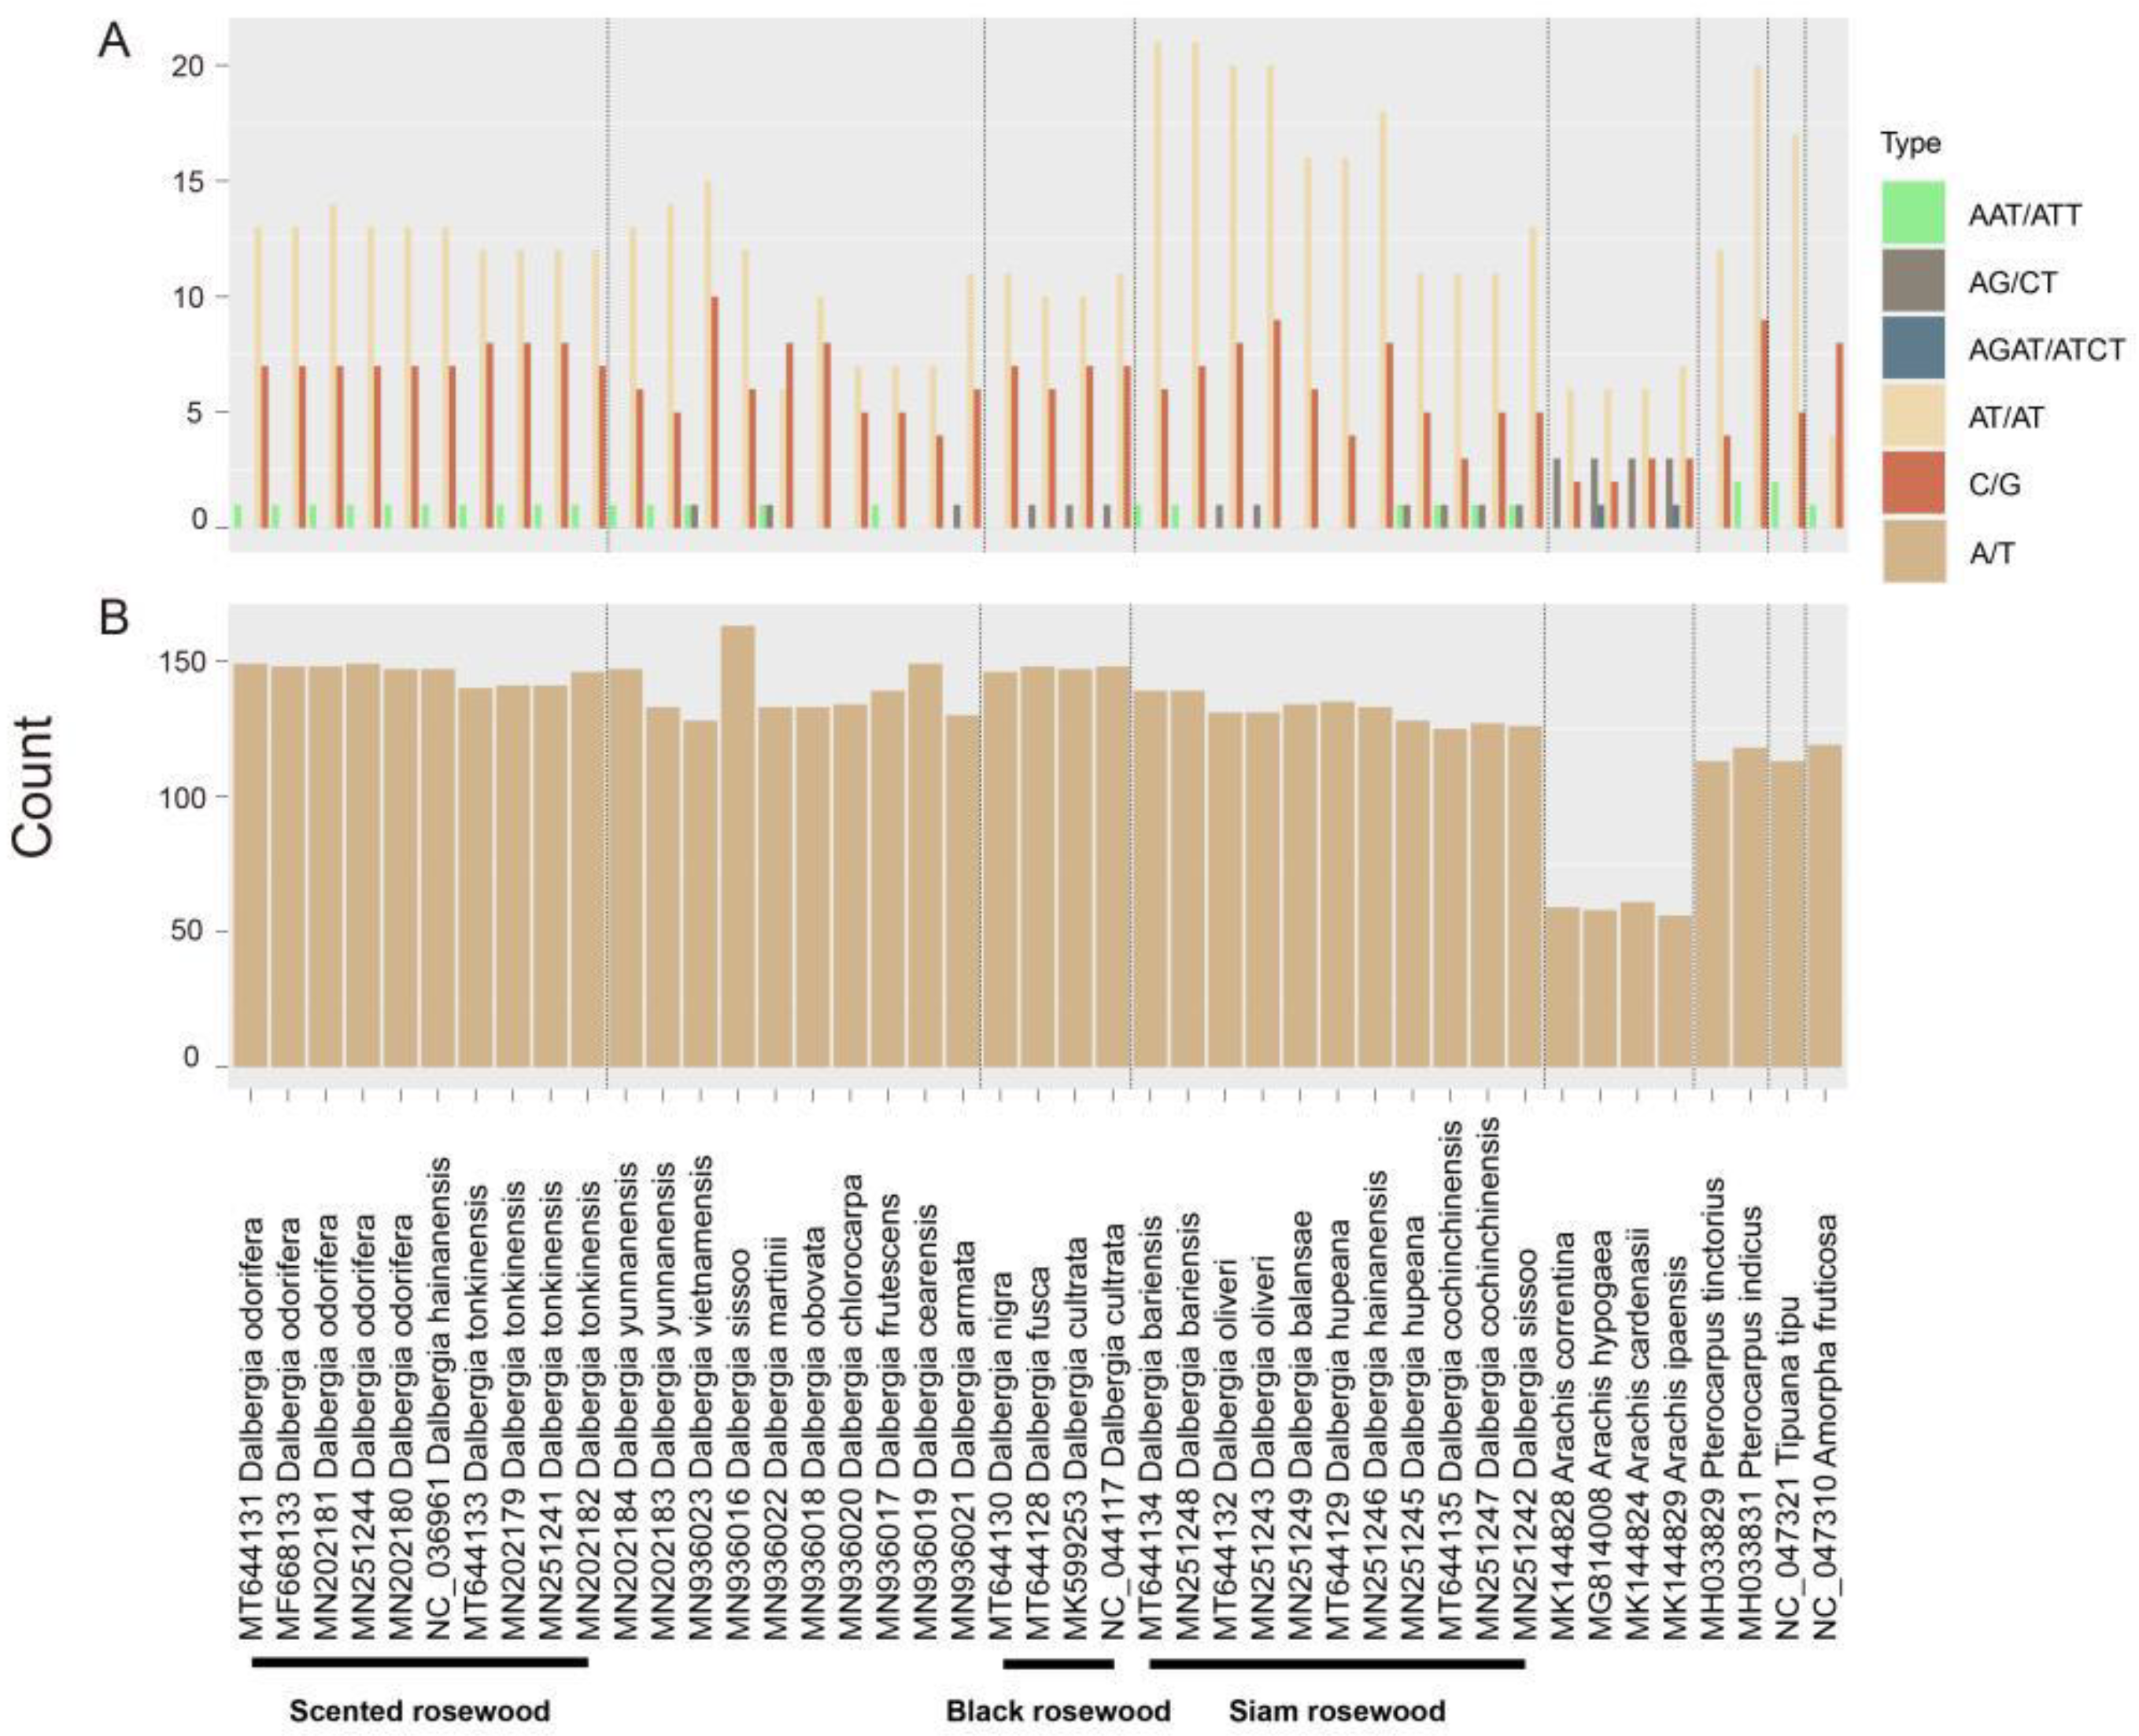
2.2. Repeat Analysis

Nucleotide repeats in chloroplast genomes can be very useful markers for identifying populations and/or species given the high rates of mutation in these regions. All 43 chloroplast genomes were analyzed using Reputer software using the limitation that repeats must have the length of 8 bp or more. Four types of repeats were considered, including forward (direct) (F), reverse (R), complement (C), and palindromic (P). Based on different motif types, the number of each type was counted based on grouping by sequence length (Figure 3). Almost all the repeats were in the 20–29 bp length range, followed by 30–39 bp, then 50+ bp, with the fewest in the 40–49 bp range. No C and R repeats were detected above 40 bp in length and they were rare even in the smaller size ranges. In the 30–39 bp group, C and R repeats were only found in a few species. The R repeats only appeared in six Dalbergia species, and C was only in Pterocarpus. For F and P repeat types, they were absent in the range of 40–49 bp in the scented rosewood species, while in the 20–29 bp group, the C type repeats were fewest in the Siam rosewood species (Figure 3). Given these differences in type and abundance, markers for identification of species and/or lineages could be devised based on different repeats. Fixed differences in repeat location, abundance, and type in a genome have provided ideal signatures for species or clade identification in previous studies [22,29,30].
In chloroplasts, SSRs are often used for population genetics and/or phylogenetic analysis. Among all 43 chloroplast genomes, 86.7% (5579/6423) of the SSRs were single nucleotide A/T motifs. The genus Arachis was found to have less than half the number of A/T SSRs than the other species used in this study, suggesting that indels are more abundant in long A/T stretches for these species. Similarly, the numbers of nearly all other, save AG/CT and AGAT/ATCT, SSR motif types were far fewer in Arachis than the other species (Figure 4). Within Dalbergia, the number of SSRs varied greatly to the point where certain motifs such as AAT/ATT were present in the scented rosewoods and absent in the black rosewoods. Additionally, the presence or absence of certain SSRs differed within a given species such as AT/AT in D. odorifera and C/G in D. tonkinensis. The results from the SSR analyses suggests that these genomic regions might be useful for the identification of populations, species, and clades of Dalbergia if the data from different SSR motif types and length difference is combined in a nested analysis.

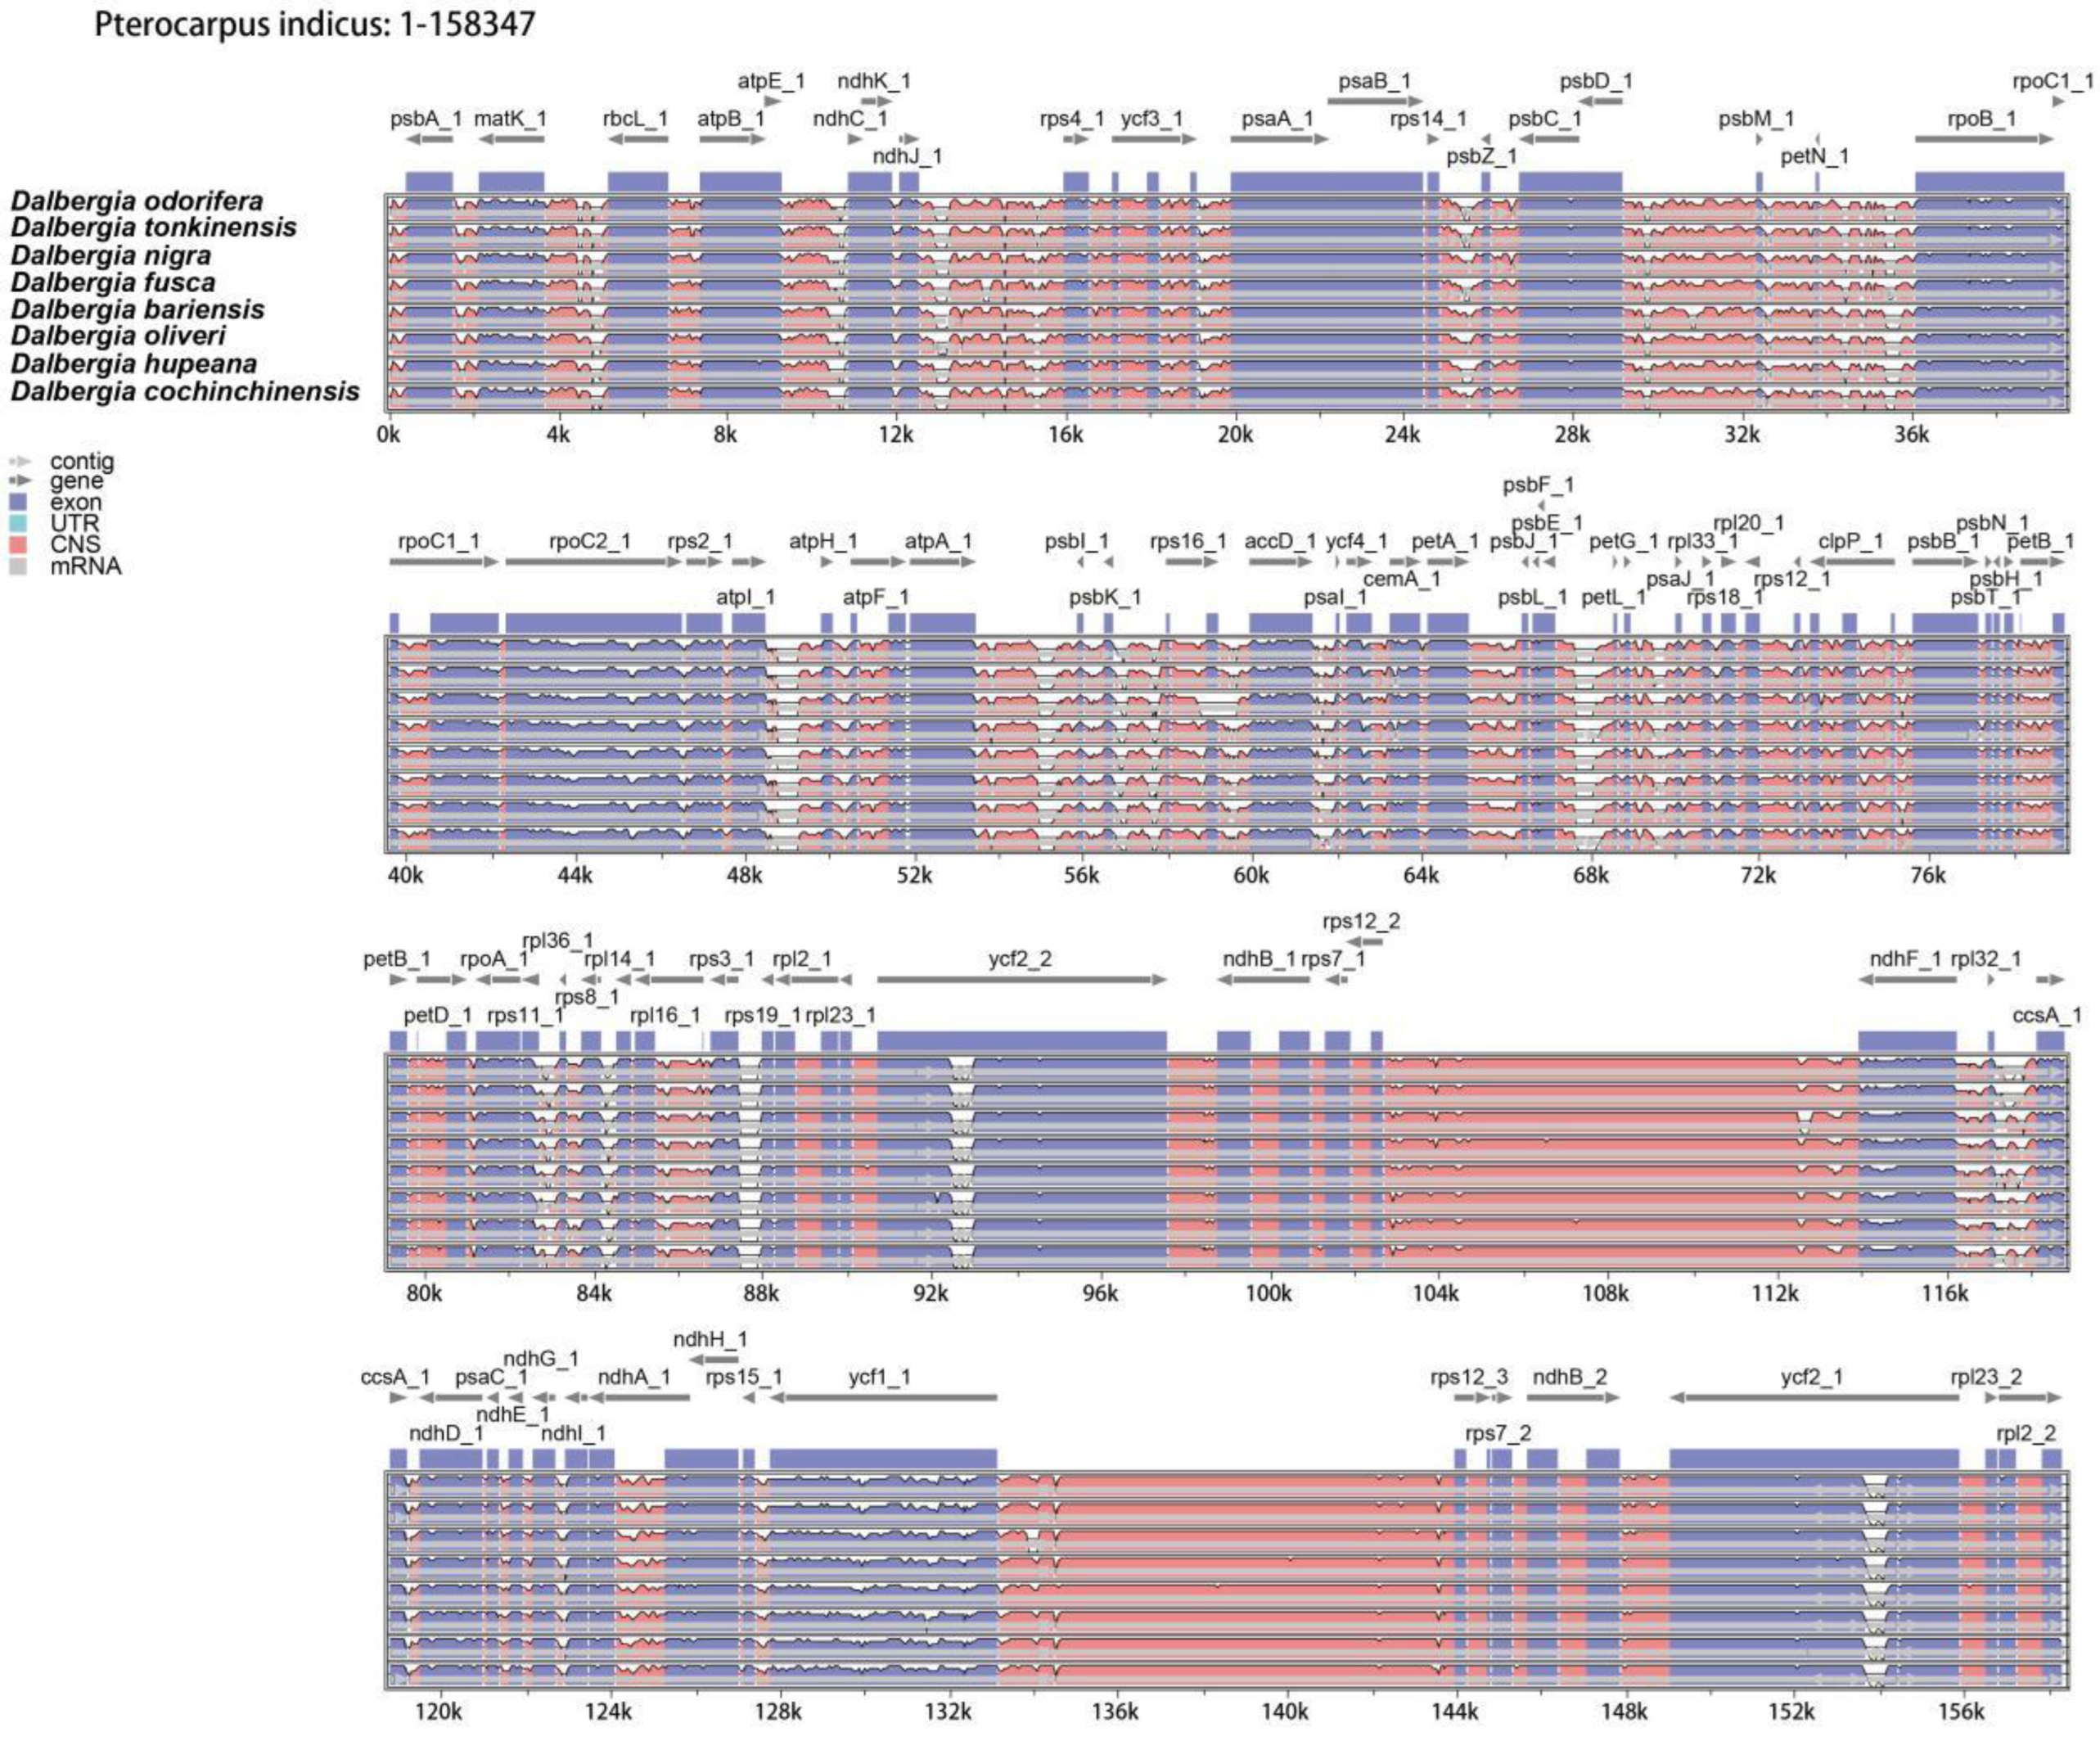
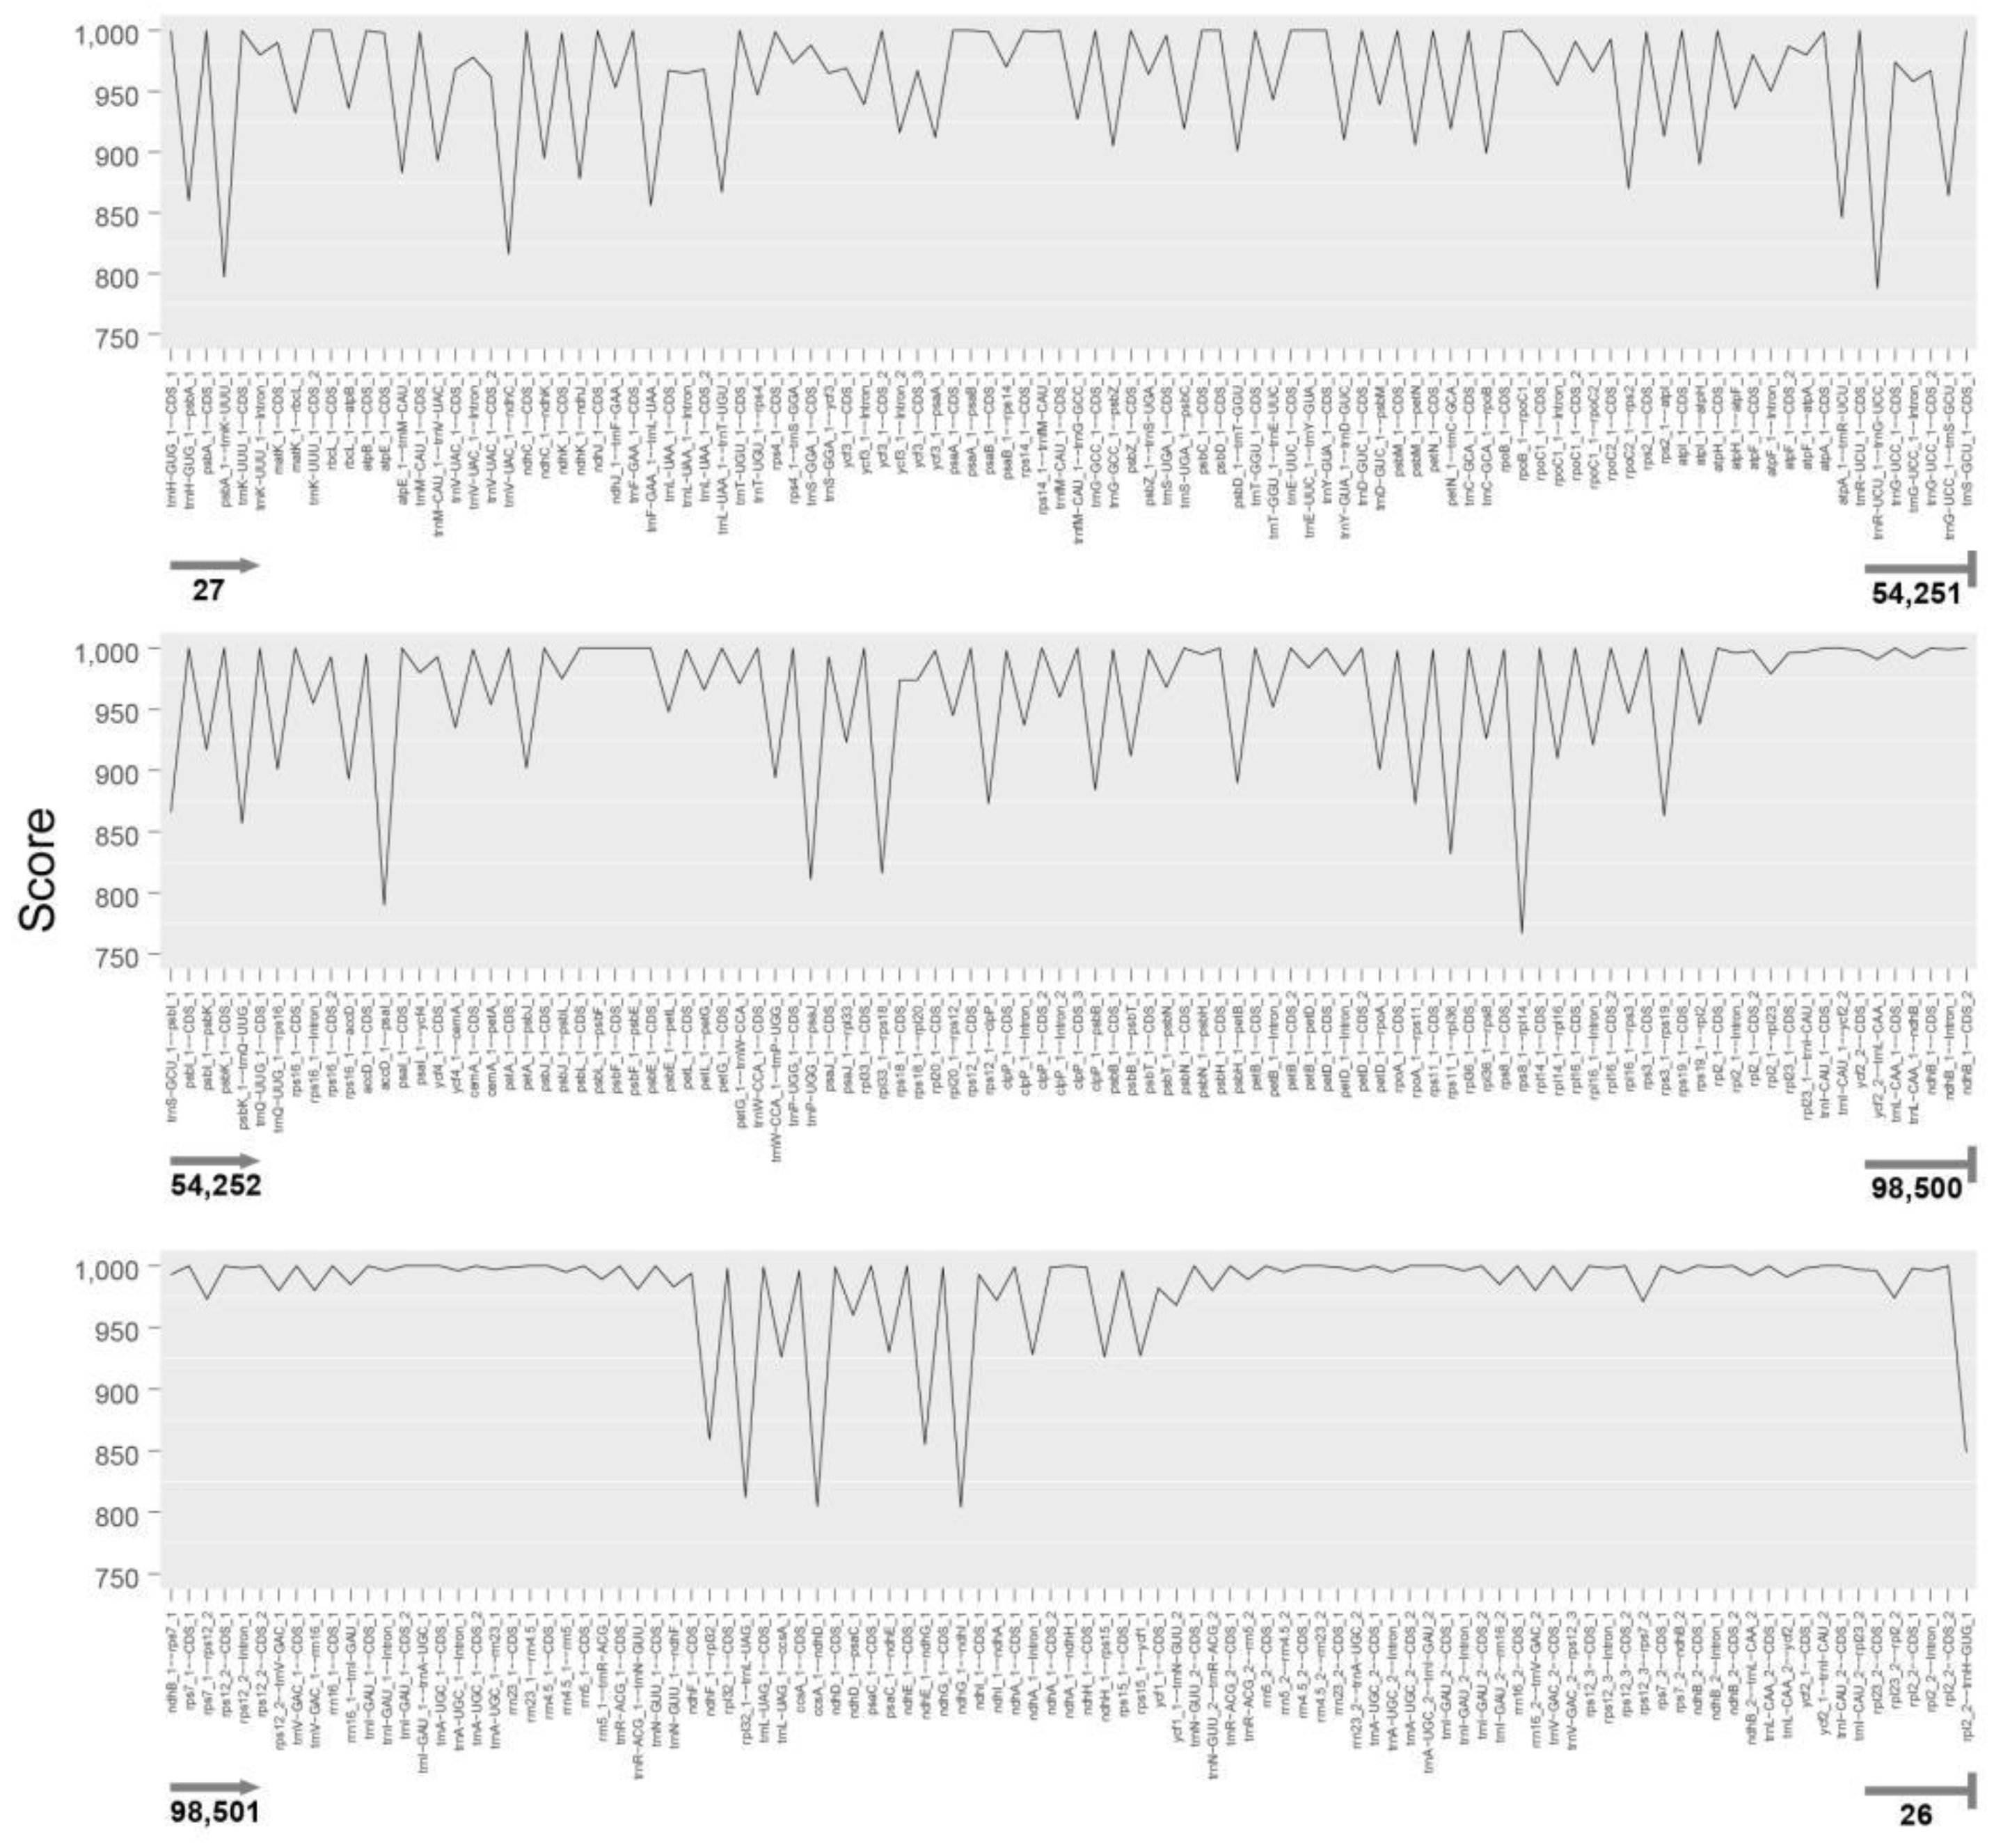
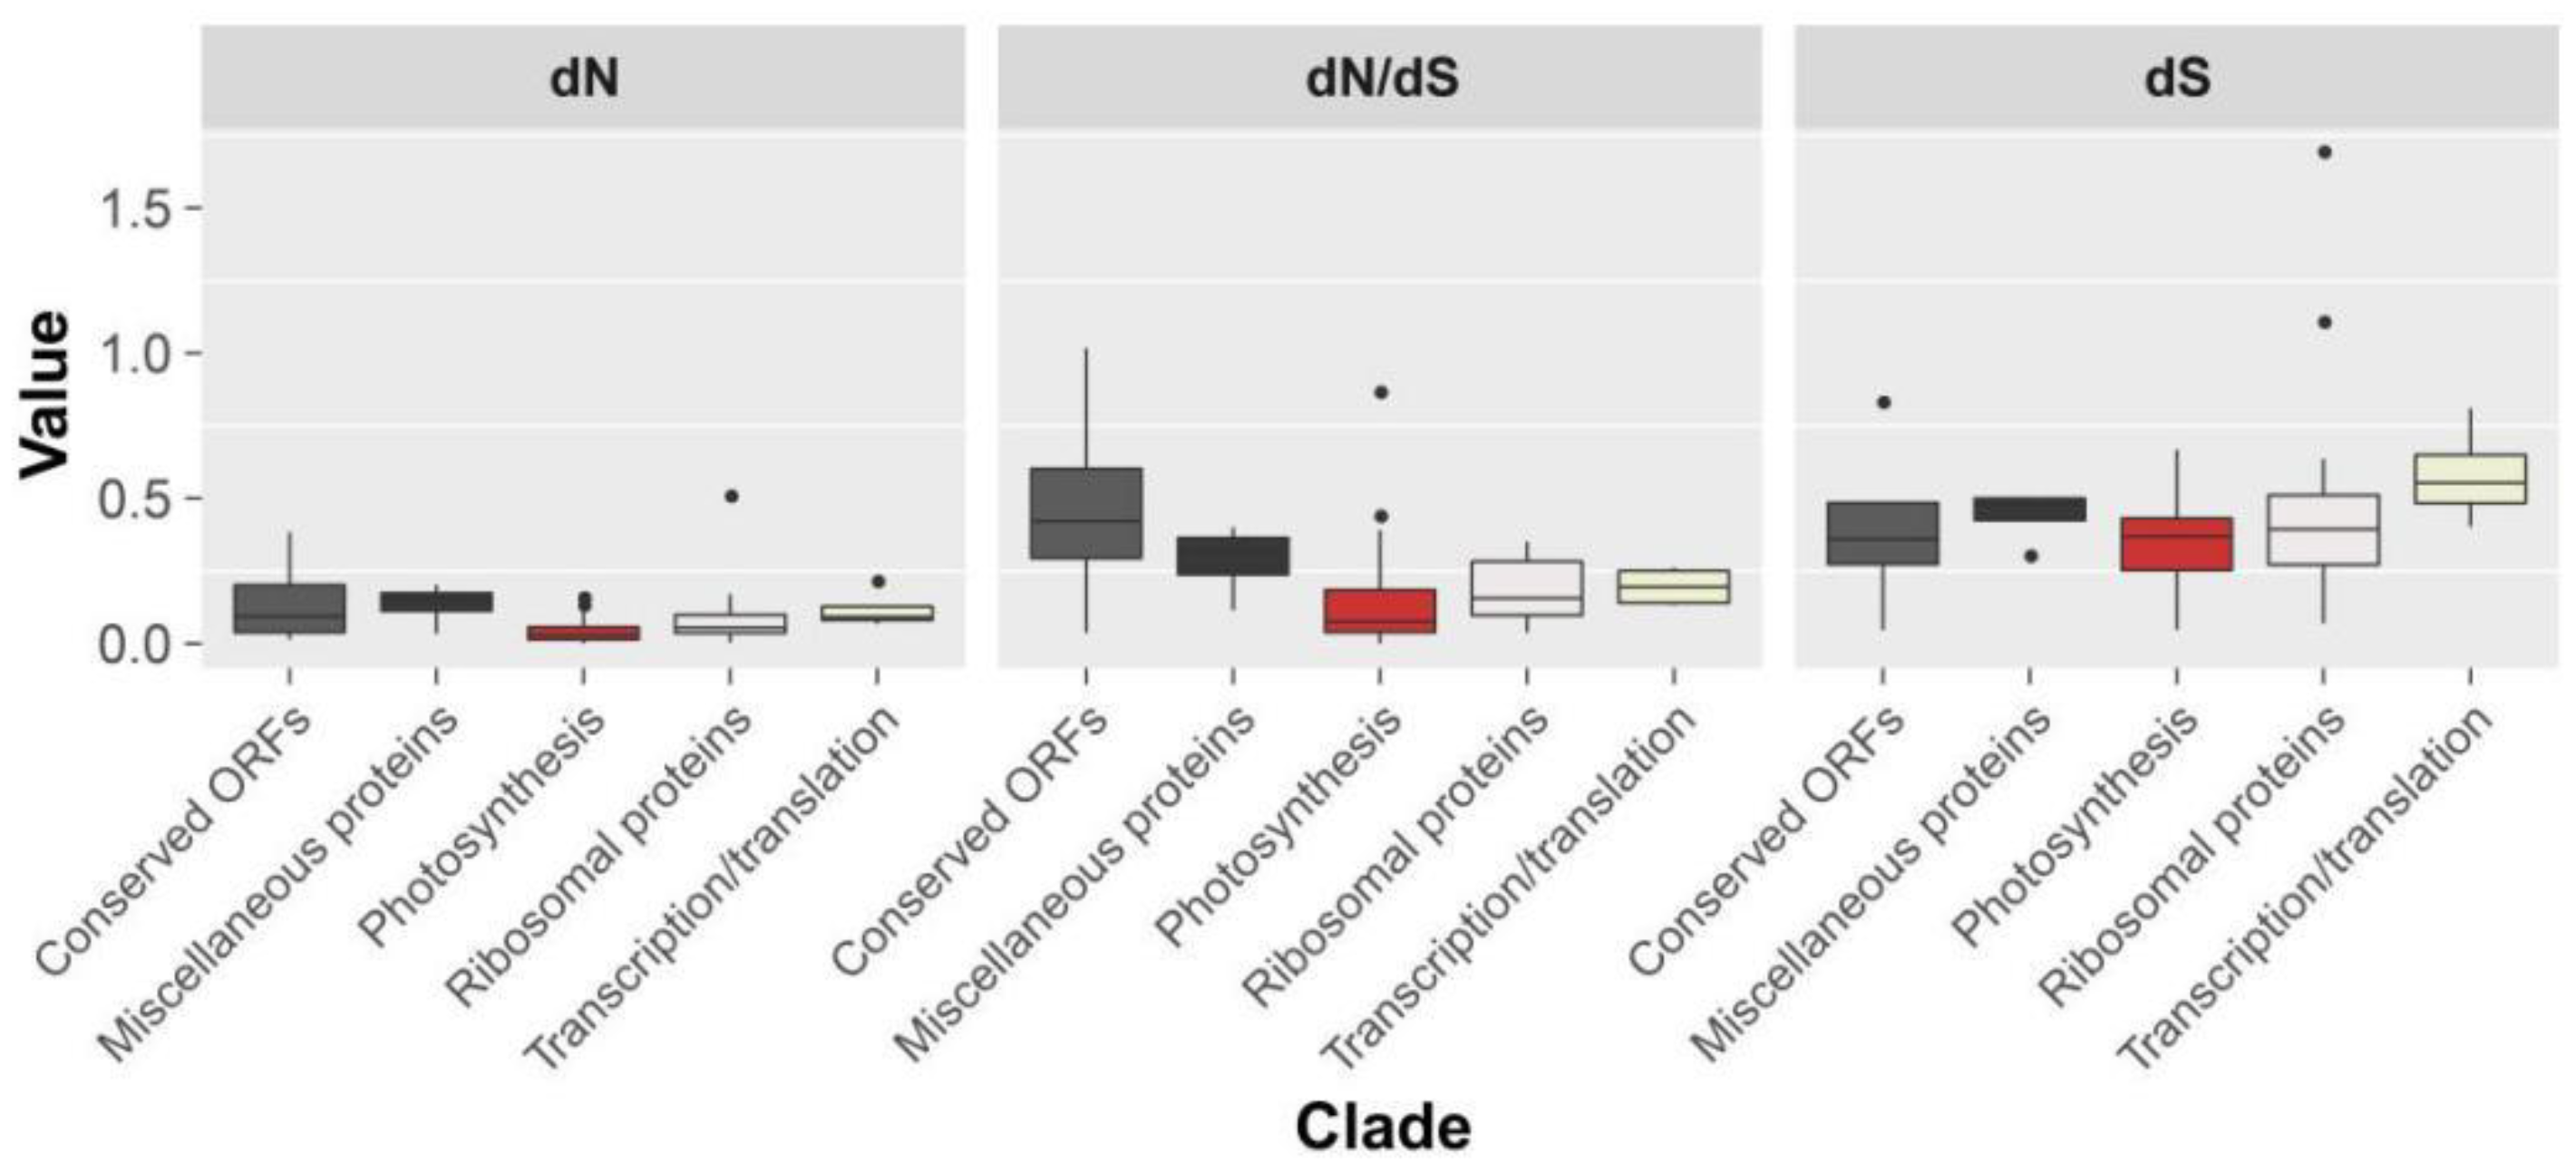
2.3. Genome Sequence Divergence

To further characterize the differences between chloroplast genomes, we employed mVISTA to find regions of greatest difference between conserved regions in the eight newly sequenced genomes and Pterocarpus indicus Willd. (an outgroup species that also produces high-quality rosewood-type lumber). The intergenic and intragenic regions were found to have the least similarity between chloroplast genomes in Dalbergia and P. indicus (Figure 5), especially in LSC (from psbA to rps19) and SSC regions (from ndhF to ycf1). Given these results, there are numerous intergenic and intragenic regions for developing markers to differentiate Pterocarpus from Dalbergia and fewer, but a sufficient number of regions to use within Dalbergia species for clade level differentiation.
Based on the results of sliding window comparisons in Song (2019), we used T-Coffee to compare the complete genome sequences of all 43 samples in order to more comprehensively assess regions of dissimilarity (Figure 6, Supplemental Table S4). As in other plant lineages [31], CDS regions had very high identity scores across all 43 chloroplast genomes, while the lowest identity scores were found in rps8-rpl14 (score 767; length 524 bp), trnR-UCU-trnG-UCC (score 788; length 592 bp), accD-psaI (score 790; length 824 bp), psbA-trnK-UUU (score 797; length 658 bp), and ndhG-ndhI (score 804; length 1308 bp). The identification of these hypervariable intergenic regions provide candidate regions for the development of genetic markers. While most intergenic regions are more variable, psaA-psaB (score 1000; length 25 bp), psbL-psbF (score, 1000; length, 22 bp), psbF-psbE (score, 1000; length, 9), and ndhA-ndhH (score, 1000; length, 1) were noted as being very similar and short in length. As such, these regions should be excluded from further consideration for marker development but might be useful in providing priming sites adjacent to variable regions in the development of molecular assays. Given that these photosynthesis genes are clustered in a single operon, strong selection of function has resulted in nucleotide conservation even in the intergenic regions. However, in general, sufficient nucleotide divergence has been found for the development of genetic markers in Dalbergia and to closely related genera that produce lumber of a similar appearance.
In a third approach to find regions of fixed differences for identifying Dalbergia species, we analyzed the dN (nonsynonymous substitution rates), dS (synonymous substitution rates), and the ratio of dN/dS (quantify strength of selection) of all genes with PAML. This approach is particularly useful in finding fixed differences that persist through a given lineage because mutations that are undergoing different modes of selection can be detected. From this analysis, the dN of all genes was relatively low, while for the dS, two ribosomal genes (rps16 and rpl32) were outliers. Except for ycf2 (1.02), the dN/dS of all the other genes were less than 1, indicating that they are subject to purifying selection, especially photosynthesis genes, which were lower on average than the other four gene categories (Figure 7).

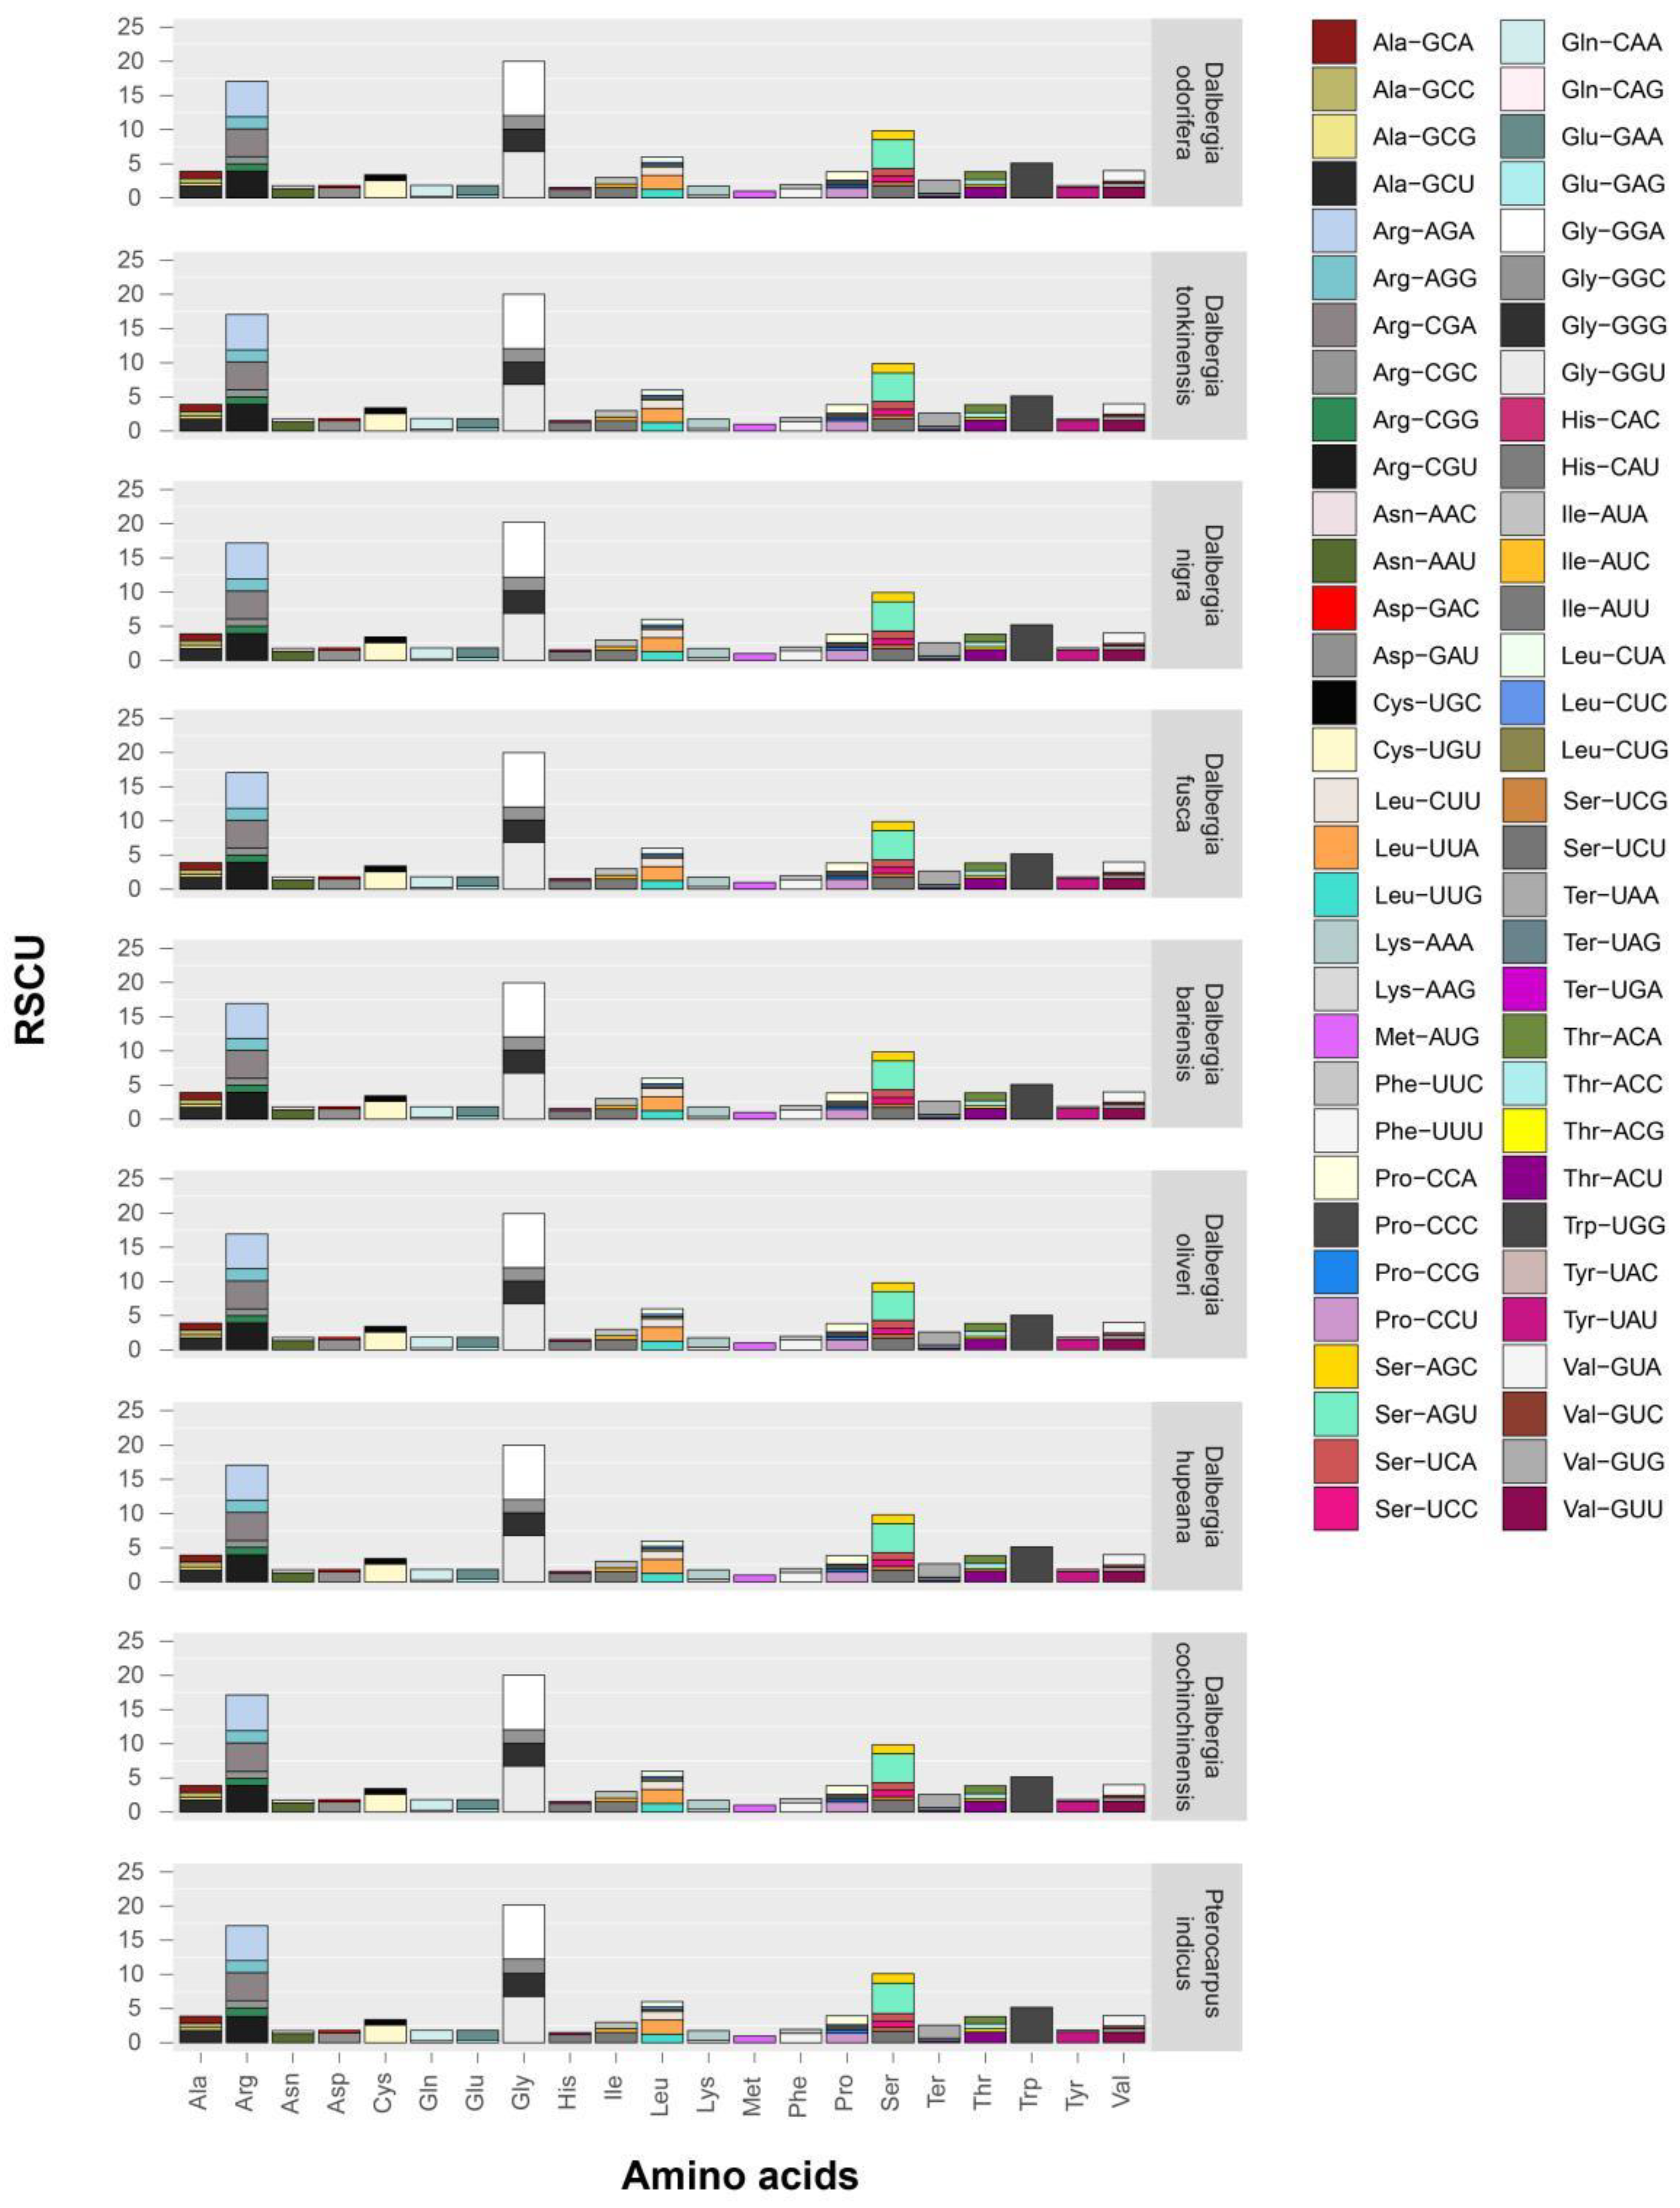
2.4. Codon Usage in Dalbergia Chloroplast Genes

Relative synonymous codon usage (RSCU) is often used to analyze the frequency of codon usage, with the higher values scaling with usage frequency (Figure 8). Given the conserved nature of codon usage, if a mutation is detected, it generally remains fixed and as such can provide a useful marker locus. Thus, we analyzed the codon usage of Dalbergia chloroplast genes. There were no large differences in RSCU between Dalbergia chloroplast genes, indicating conservation in codon usage across Dalbergia, and a very limited number of loci for clade or species identification.

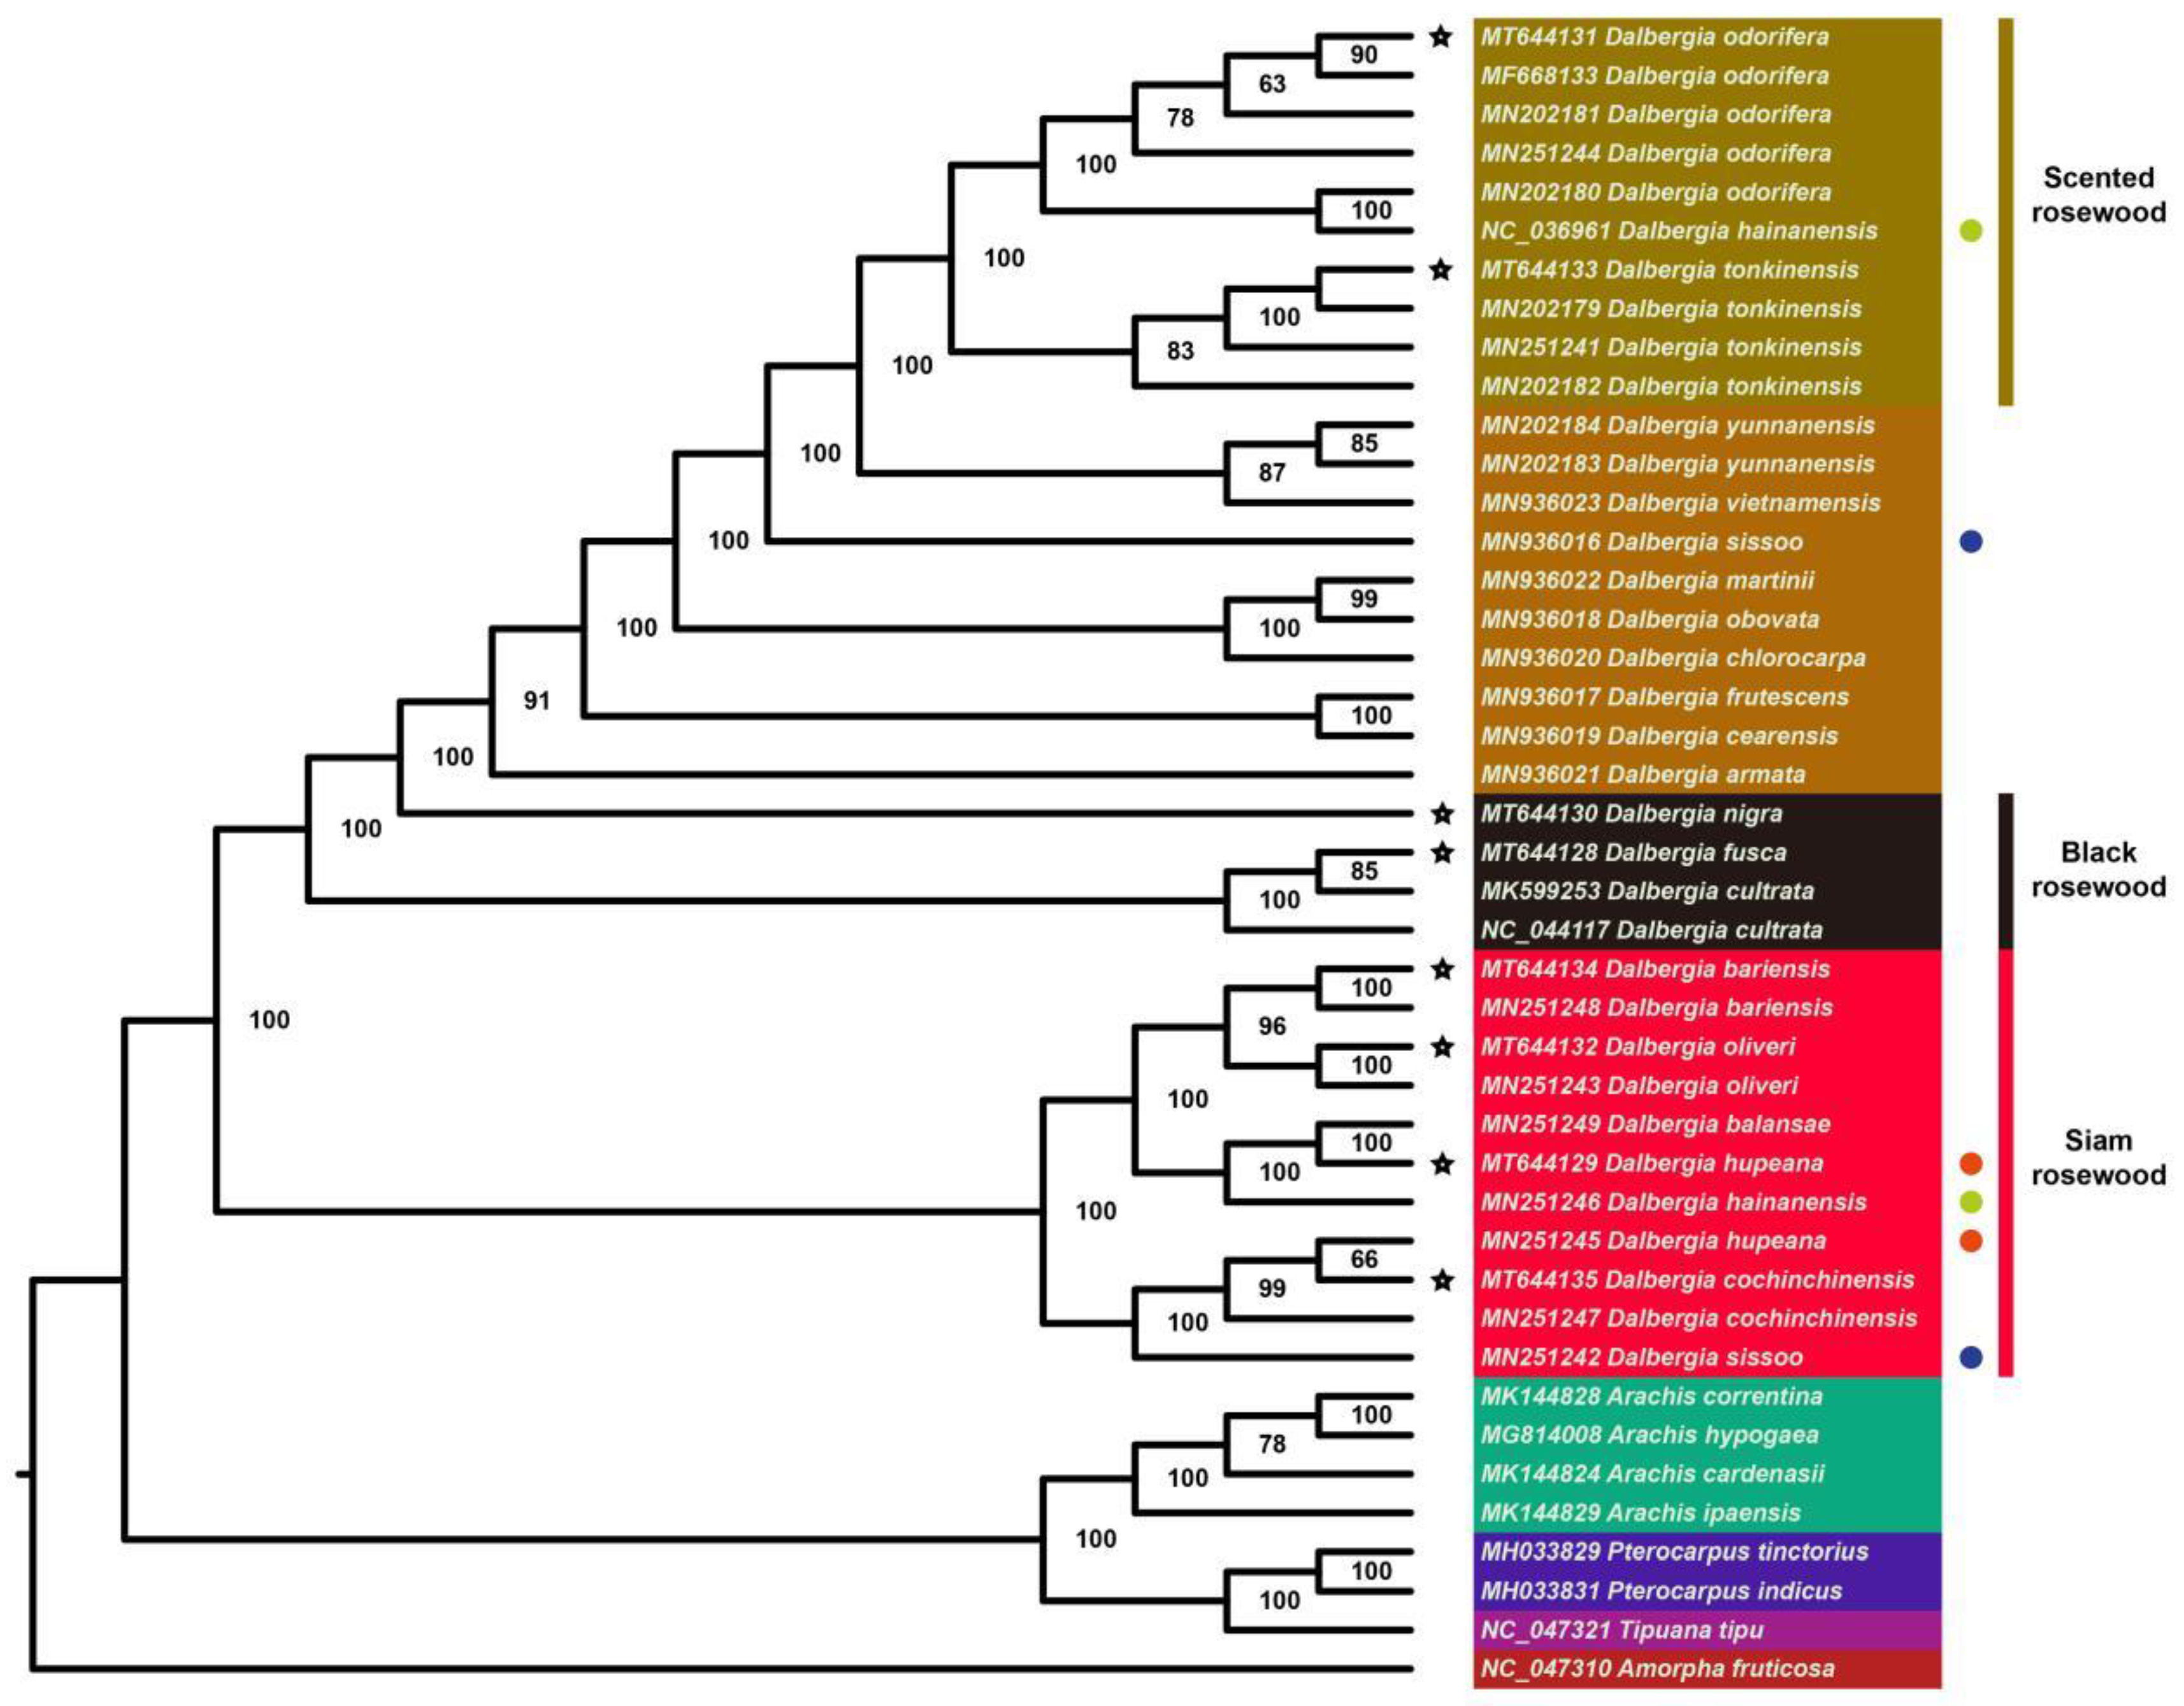
2.5. Phylogenetic Analysis and Barcode Selection

In order to assess chloroplast genome divergence in an evolutionary context and find synapomorphies (and ultimately barcodes) for the given clades, we conducted a phylogenetic analysis using 77 homologous coding genes in 43 chloroplast genomes (Figure 9; Supplemental Figure S3). The resulting phylogenetic tree resolved several instances of polyphyly and paraphyly in regard to the species names applied to a given NCBI accession. For instance, D. sissoo MN936016 resolved in an early diverging position to a clade of D. vietnamesis P.H. Hô and Niyomdhan + D. yunnanensis Franch. + D. tonkinensis + D. hainanensis Merr. and Chun + D. odorifera with high support (BS = 100) and D. sissoo DC. MN251242 resolved in an early diverging position to a clade of D. cochinchinensis + D. hupeana with high support (BS = 100), making this species polyphyletic. Another clear example of polyphyly is D. hainanensis NC_036961 resolving in a clade with D. odorifera, while D. hainanensis MN251246 resolved in an early diverging position to a clade of D. hupeana + D. balanense Prain, making D. hupeana polyphyletic. Instances of paraphyly are also present, as in the branching order of D. sissoo, D. cochinchinensis, and D. hupeana in the Siam rosewood category, with other examples found elsewhere in the tree (Figure 9). These discrepancies between taxonomy and phylogeny indicate that some of the species identifications for Dalbergia NCBI accessions are probably incorrect. Alternatively, some of the examples of polyphyly might be the result of interspecific hybridization where a chloroplast genome was maternally inherited from a more distantly related species. Ultimately, in either case, improper identification (of hybrids and/or species) has led to discordance between the topology and taxonomic designations. These discrepancies should be addressed through identification of samples by taxonomic experts where possible as well as resequencing checks using nuclear loci (e.g., ITS) and reanalysis, as well as increasing the number of different species used in phylogenetic analyses. Furthermore, comparative phylogenetic approaches can be used to isolate which taxa are most likely misidentified in the chloroplast data. For instance, D. sissoo MN936016 is probably correctly identified based on the location it resolved in the phylogenetic tree (early diverging to a clade containing D. tonkinensis in both phylogenies) in this paper compared to the position in the phylogenetic analyses of Vatanparast et al. [32] and Hassold et al. [20]. Issues of polyphyly in the Siam rosewood clade were further verified using whole chloroplast comparisons. Differences are apparent between the phylogenetic tree presented here and previously published phylogenies, as is expected given the different genomic regions and species sampled. That said, consistency is found among the two phylogenies in the membership of important taxa in separate clades and branching order. For example, D. nigra has an early diverging position to clade V in Vatanparast et al. [32] and to a clade with similar membership in the phylogenetic tree presented here. These similarities in phylogenetic topology suggest that both ITS and chloroplast barcoding could be employed to identify wood samples. However, much greater within-species sampling is needed to compare the stability of polymorphisms within species for each locus before a molecular assay can be deployed. This is especially true of ITS, where a large number of tandem copies can be found in multiple ribotypes [33] and potentially affect the accuracy of molecular assays. Lastly, it should be noted that in our analyses, the black rosewood category did not form a monophyletic grouping, whereas scented and Siam rosewood categories did form monophyletic groupings, provided the issue of incorrect labeling and polyphyly can be corrected.
From a MAFFT alignment of 43 chloroplast genomes, we scanned for loci rich in SNVs (single nucleotide variants) and INDELS (INsertions DELetions) to identify potential barcode loci (Supplemental Files S1 and S2). The MAFFT alignment after manual correction was 219,992 sites in total length. From this alignment, 58 SNV loci and 10 INDEL loci were found to identify Siam rosewoods, 29 SNVs and 13 INDELs in scented rosewood, and 2 SNVs and 1 INDEL for black rosewood if D. nigra was taken into account. If D. nigra was removed, 229 SNVs and 49 INDELs were found for the identification of the clade D. cultrata Benth. + D. fusca. However, since D. nigra is the highest priority Dalbergia species in CITES, a set of 94 SNVs and 69 INDELs were isolated for the identification of this species from all other Dalbergia used in this study (Table 2; Supplemental Tables S5 and S6). Given the arrayment of SNVs and INDELS across the entire genome, a super barcode approach could also be considered using the entire chloroplast genome to identify timber seizures from shotgun sequencing data [25]. As above, issues with polyphyly should be addressed to improve the confidence of these SNVs and INDELS in identifying a given Dalbergia subclade.

3. Materials and Methods

3.1. Tissue Samples and DNA Extraction

We collected fresh leaves from eight species of Dalbergia for DNA extraction. The leaf material from plants were collected at the Experimental Station of the Research Institute of Tropical Forestry, Chinese Academy of Forestry, Jianfeng Town, Ledong Li Autonomous County, China. Detailed source and preservation information for these species is listed in Supplemental Table S7. To obtain the chloroplast genome sequences, the genomic DNA was extracted by QIAGEN DNeasy Plant Maxi Kit (Cat. NO 68163) for Illumina paired-end sequencing.

3.2. Genome Sequencing and Assembly

The Illumina HiSeq 2500 platform was used to sequence the extracted DNA with insert sizes of 500 bp, for 150 bp paired-end read lengths. Raw data was quality control filtered using Trimmomatic [34] with the following criteria: filtered reads with adapters, filtered reads with N bases >10%, and filtered reads with low-quality bases (≤5) >50%, which yielded 2 Gb of clean reads for each species.
All paired-end clean reads were aligned to the chloroplast database (containing all published chloroplast genomes from NCBI by the date 26 November 2019) with bwa v0.7.17-r1188 [35] software, and then the Picard v2.20.3 program was used to select chloroplast reads. The selected chloroplast reads were assembled by Spades v3.14.0 [36] with default parameters and the output scaffolds (GFA file) were imported into Bandage v0.8.1 [37] to generate the final chloroplast genome for each species.

3.3. Genome Annotation

All 43 chloroplast genomes, which contained 8 newly assembled Dalbergia chloroplast genomes, and 27 other published genomes of Dalbergieae, 4 Arachis L. species, 2 Pterocarpus, 1 Tipuana Benth. species, and an outgroup species Amorpha fruticosa L., were compiled for analysis, with all NCBI accession numbers listed in Supplemental Table S1. The D. tonkinensis genome was used as a reference, with all genes delimited manually to provide a complete reference template. The re-annotation of all species was then executed using Plastid Genome Annotator (PGA) [38], and the visualization of genome structure was implemented by the Draw Organelle Genome Maps online software (OGDRAW) [39].

3.4. Genome Structure Analysis

Four repeat types in 43 chloroplast genomes, F (forward), P (palindrome), R (reverse), and C (complement) were identified using REPuter [40] with default settings. Simple sequence repeats (SSRs) were detected using the Perl script MISA [41], with 10, 6, 5, 5, 5, and 5 repeat units set for mono-, di-, tri-, tetra-, penta-, and hexa-motif microsatellites set as the minimum threshold, respectively. CodonW v1.4.4 [42] was employed to assess codon distribution on the basis of relative synonymous codon usage (RSCU) ratio.

3.5. Genome Nucleotide Diversity

Analyses of genome sequence diversity was performed using an online software mVISTA [43] to compare the 8 newly assembled Dalbergia species using Shuffle-LAGAN [44] alignment program, with the P. indicus chloroplast genome used as a reference. All 43 chloroplast genomes were split into several parts based on annotation files, and the overall consistency score of each part was calculated with multiple sequence alignment tools using T-Coffee [45] in default mode.

3.6. Phylogenetic Analysis and Nucleotide Substitutions

The whole chloroplast genome sequence alignment of 43 chloroplast genomes was generated using MAFFT v7.464 [46,47] software, with TrimAL v1.4 [48] used to trim the poorly aligned positions. The longest CDS sequences of 77 protein-coding genes were extracted from each genome according to the annotation files and also aligned using MAFFT [46,47]. The nucleotide sequence alignments of 77 protein-coding genes were concatenated. This data set was further used to resolve the phylogenetic tree using IQ-TREE v2.0 [49,50] with 1000 ultrafast bootstrap replicates to assess branch support with FigTree v1.4.3 (http://tree.bio.ed.ac.uk/software/figtree, accessed on 15 June 2020) used for tree visualization. CODEML in PAML v4.9 [51] was used to calculate the nonsynonymous (dN), synonymous (dS), and the ratio of nonsynonymous to synonymous nucleotide substitutions (dN/dS) for each gene.

Supplementary Materials

The following supporting information can be downloaded at: https://0-www-mdpi-com.brum.beds.ac.uk/article/10.3390/f13040626/s1, Figure S1. Chloroplast genome structure of 8 newly assembled Dalbergia species. Figure S2. Comparison of junctions between the LSC, SSC, and IR regions among Dalbergia odorifera and D. tonkinensis chloroplast genome. Figure S3. Phylogenetic tree of Dalbergia based on the CDS alignments of 77 chloroplast genes with branch lengths. File S1. Final alignment file for 43 chloroplasts used in this study. File S2. The Perl scripts used to identify potential barcode loci. Table S1. Genome information of the 43 chloroplast genomes used in this study. Table S2. The N ratio for 43 chloroplast genomes used in this study. Table S3. The gene number of chloroplast genomes from Dalbergia. Table S4. Sequence identity of the region from 43 chloroplast genomes that has been split up. Table S5. The SNP sites and the nucleotide change in different rosewood clades. Table S6. The INDEL sites and nucleotide change in different rosewood clades. Table S7. Detailed source and preservation information for species.

Author Contributions

Z.H. conceived and designed the study. W.H., Z.W., and X.L. (Xuezhu Liao) performed the experiments and data analysis. X.L. (Xiaojing Liu) contributed materials. Z.W. and X.L. (Xuezhu Liao) wrote the paper. L.R.T., Z.W., X.L. (Xuezhu Liao), and D.X. revised the paper. All authors have read and agreed to the published version of the manuscript.

Funding

This study was co-supported by the Research Funds for the Central Non-profit Research Institution of Chinese Academy of Forestry (CAFYBB2020SZ005), National Natural Science Foundation of China (31500537), and the Chinese Academy of Agricultural Sciences Elite Youth Program to Zhiqiang Wu (JCKY2020-07).

Institutional Review Board Statement

Not applicable.

Informed Consent Statement

Not applicable.

Data Availability Statement

The chloroplast genome sequences are available in the NCBI database, under accession number MT644128–MT644135.

Acknowledgments

We sincerely thank Shanghai BIOZERON Biotechnology Co., Ltd. for performing the high-throughput sequencing.

Conflicts of Interest

The authors declare no conflict of interest.

References

  1. Hong, Z.; Li, J.; Liu, X.; Lian, J.; Zhang, N.; Yang, Z.; Niu, Y.; Cui, Z.; Xu, D. The chromosome-level draft genome of Dalbergia odorifera. Gigascience 2020, 9, giaa084. [Google Scholar] [CrossRef] [PubMed]
  2. Song, Y.; Zhang, Y.; Xu, J.; Li, W.; Li, M. Characterization of the complete chloroplast genome sequence of Dalbergia species and its phylogenetic implications. Sci. Rep. 2019, 9, 20401. [Google Scholar] [CrossRef] [PubMed]
  3. Zhu, A.L. China’s rosewood boom: A cultural fix to capital overaccumulation. Ann. Am. Assoc. Geogr. 2020, 1, 277–296. [Google Scholar] [CrossRef]
  4. Li, Y. Everything old is new again: Classical chinese furniture. China Today 2011, 11, 37–40. [Google Scholar]
  5. Sriudorn, N.; Benchawattananon, R. Morphology and anatomy of rosewood (Dalbergia cochinchinensis) and relationship between its elemental components and soil properties for identification of endemic species. Int. J. Agric. Technol. 2018, 14, 1977–1986. [Google Scholar]
  6. Espinoza, E.O.; Wiemann, M.C.; Barajas-Morales, J.; Chavarria, G.D.; McClure, P.J. Forensic analysis of cites-protected dalbergia timber from the americas. IAWA J. 2015, 36, 311–325. [Google Scholar] [CrossRef]
  7. Vardeman, E.; Velásquez Runk, J. Panama’s illegal rosewood logging boom from Dalbergia retusa. Glob. Ecol. Conserv. 2020, 23, e01098. [Google Scholar] [CrossRef]
  8. Innes, J. Madagascar rosewood, illegal logging and the tropical timber trade. Madag. Conserv. Dev. 2010, 5, 6–10. [Google Scholar] [CrossRef] [Green Version]
  9. Abdul-Rahaman, I.; Kabanda, J.; Braimah, M.M. Desertification of the savanna: Illegal logging of rosewood, causes and effects on the people of kabonwule, northern region. Saudi J. Humanit. Soc. Sci. 2016, 1, 48–54. [Google Scholar] [CrossRef]
  10. Siriwat, P.; Nijman, V. Using online media-sourced seizure data to assess the illegal wildlife trade in Siamese rosewood. Environ. Conserv. 2018, 45, 352–360. [Google Scholar] [CrossRef]
  11. Nhung, N.P.; Chi, N.M.; Thu, P.Q.; Thuong, B.H.; Ban, D.V.; Dell, B. 2020. Market and policy setting for the trade in Dalbergia tonkinensis, a rare and valuable rosewood, in Vietnam. Trees For. People 2020, 1, 100002. [Google Scholar] [CrossRef]
  12. Puy, D.D. The Leguminosae of madagascar. Curtis’s Bot. Mag. 1997, 14, 231–240. [Google Scholar] [CrossRef]
  13. Patel, E.R. Logging of rare rosewood and palisandre (Dalbergia spp.) within Marojejy National Park. Madag. Madag. Conserv. Dev. 2007, 2, 11–16. [Google Scholar] [CrossRef] [Green Version]
  14. Randriamalala, H.; Liu, Z. Rosewood of Madagascar: Between democracy and conservation. Madag. Conserv. Dev. 2010, 5, 11–22. [Google Scholar] [CrossRef]
  15. United Nations Office on Drugs and Crime. World Wildlife Crime Report: Trafficking in Protected Species; United Nations Office on Drugs and Crime: New York, NY, USA, 2016. [Google Scholar]
  16. CITES. 2020. Available online: https://cites.org/eng/disc/species.php (accessed on 30 May 2020).
  17. Thiel, T.; Michalek, W.; Varshney, R.K.; Graner, A. Exploiting EST databases for the development and characterization of gene-derived SSR-markers in barley (Hordeum vulgare L.). Theor. Appl. Genet. 2013, 106, 411–422. [Google Scholar] [CrossRef] [PubMed]
  18. Wu, Z.Q.; Liao, X.Z.; Zhang, X.N.; Tembrock, L.R.; Broz, A. Genomic architectural variation of plant mitochondria—a review of multichromosomal structuring. J. Syst. Evol. 2020, 60, 160–168. [Google Scholar] [CrossRef]
  19. CBOL Plant Working Group. A DNA barcode for land plants. Proc. Natl. Acad. Sci. USA 2009, 106, 12794–12797. [Google Scholar] [CrossRef] [Green Version]
  20. Hassold, S.; Lowry, P.N.; Bauert, M.R.; Razafintsalama, A.; Ramamonjisoa, L.; Widmer, A. DNA barcoding of malagasy rosewoods: Towards a molecular identification of cites-listed dalbergia species. PLoS ONE 2016, 11, e157881. [Google Scholar] [CrossRef] [Green Version]
  21. Hollingsworth, P.M.; Li, D.Z.; van der Bank, M.; Twyford, A.D. Telling plant species apart with DNA: From barcodes to genomes. Philos. Trans. R. Soc. B-Biol. Sci. 2016, 371, 20150338. [Google Scholar] [CrossRef]
  22. Zhang, R.; Ge, F.; Li, H.; Chen, Y.; Zhao, Y.; Gao, Y.; Liu, Z.; Yang, L. PCIR: A database of plant chloroplast inverted repeats. Database 2019, 1, 2019–2127. [Google Scholar] [CrossRef]
  23. Zhang, W.; Sun, Y.; Liu, J.; Xu, C.; Zou, X.; Chen, X.; Liu, Y.; Wu, P.; Yang, X.; Zhou, S. DNA barcoding of Oryza: Conventional, specific, and super barcodes. Plant Mol. Biol. 2021, 105, 215–228. [Google Scholar] [CrossRef] [PubMed]
  24. Wang, L.; Wu, Z.Q.; Bystriakova, N.; Ansell, S.W.; Xiang, Q.P.; Heinrichs, J.; Schneider, H.; Zhang, X.C. Phylogeography of the Sino-Himalayan fern Lepisorus clathratus on “the roof of the world”. PLoS ONE 2011, 6, e25896. [Google Scholar] [CrossRef] [PubMed]
  25. Fu, C.N.; Wu, C.S.; Ye, L.J.; Mo, Z.Q.; Liu, J.; Chang, Y.W.; Li, D.Z.; Chaw, S.M.; Gao, L.M. Prevalence of isomeric plastomes and effectiveness of plastome super-barcodes in yews (Taxus) worldwide. Sci. Rep. 2019, 9, 2773. [Google Scholar] [CrossRef] [PubMed]
  26. Wang, Q.; Yu, Q.S.; Liu, J.Q. Are nuclear loci ideal for barcoding plants? A case study of genetic delimitation of two sister species using multiple loci and multiple intraspecific individuals. J. Syst. Evol. 2011, 3, 182–188. [Google Scholar] [CrossRef]
  27. Zhou, J.; Zhang, S.; Wang, J.; Shen, H.; Ai, B.; Gao, W.; Zhang, C.; Fei, Q.; Yuan, D.; Wu, Z.; et al. Chloroplast genomes in Populus (Salicaceae): Comparisons from an intensively sampled genus reveal dynamic patterns of evolution. Sci. Rep. 2021, 11, 9471. [Google Scholar] [CrossRef]
  28. Rachmayanti, Y.; Leinemann, L.; Gailing, O.; Finkeldey, R. DNA from processed and unprocessed wood: Factors influencing the isolation success. Forensic Sci. Int. Genet. 2009, 3, 185–192. [Google Scholar] [CrossRef]
  29. Saltonstall, K.; Lambertini, C. The value of repetitive sequences in chloroplast DNA for phylogeographic inference: A comment on Vachon & Freeland 2011. Mol. Ecol. Resour. 2012, 12, 581–585. [Google Scholar]
  30. Brazda, V.; Lysek, J.; Bartas, M.; Fojta, M. 2018. Complex analyses of short inverted repeats in all sequenced chloroplast dnas. BioMed Res. Int. 2018, 2018, 1097018. [Google Scholar] [CrossRef]
  31. Gu, C.; Ma, L.; Wu, Z.; Chen, K.; Wang, Y. Comparative analyses of chloroplast genomes from 22 Lythraceae species: Inferences for phylogenetic relationships and genome evolution within Myrtales. BMC Plant Biol. 2019, 19, 281. [Google Scholar] [CrossRef]
  32. Vatanparast, M.; Klitgård, B.B.; Adema, F.A.C.B.; Pennington, R.T.; Yahara, T.; Kajita, T. First molecular phylogeny of the pantropical genus Dalbergia: Implications for infrageneric circumscription and biogeography. S. Afr. J. Bot. 2013, 89, 143–149. [Google Scholar] [CrossRef] [Green Version]
  33. Teruel, M.; Ruíz-Ruano, F.J.; Marchal, J.A.; Sánchez, A.; Cabrero, J.; Camacho, J.P.; Perfectti, F. Disparate molecular evolution of two types of repetitive DNAs in the genome of the grasshopper Eyprepocnemis plorans. Heredity 2014, 112, 531–542. [Google Scholar] [CrossRef] [PubMed] [Green Version]
  34. Bolger, A.M.; Lohse, M.; Usadel, B. Trimmomatic: A flexible trimmer for Illumina Sequence Data. Bioinformatics 2014, 30, 2114–2120. [Google Scholar] [CrossRef] [PubMed] [Green Version]
  35. Li, H. Aligning sequence reads, clone sequences and assembly contigs with BWA-MEM. arXiv 2013, arXiv:arXiv:1303.3997v2. [Google Scholar]
  36. Nurk, S.; Bankevich, A.; Antipov, D.; Gurevich, A.A.; Korobeynikov, A.; Lapidus, A.; Prjibelski, A.D.; Pyshkin, A.; Sirotkin, A.; Sirotkin, Y.; et al. Assembling single-cell genomes and mini-metagenomes from chimeric MDA products. J. Comput. Biol. 2013, 20, 714–737. [Google Scholar] [CrossRef] [PubMed] [Green Version]
  37. Wick, R.R.; Schultz, M.B.; Zobel, J.; Holt, K.E. Bandage: Interactive visualization of de novo genome assemblies. Bioinformatics 2015, 31, 3350–3352. [Google Scholar] [CrossRef] [PubMed] [Green Version]
  38. Qu, X.J.; Moore, M.J.; Li, D.Z.; Yi, T.S. PGA: A software package for rapid, accurate, and flexible batch annotation of plastomes. Plant Methods 2019, 15, 50. [Google Scholar] [CrossRef] [Green Version]
  39. Greiner, S.; Lehwark, P.; Bock, R. OrganellarGenomeDRAW (OGDRAW) version 1.3.1: Expanded toolkit for the graphical visualization of organellar genomes. Nucleic Acids Res. 2019, 47, 59–64. [Google Scholar] [CrossRef] [Green Version]
  40. Kurtz, S.; Choudhuri, J.V.; Ohlebusch, E.; Schleiermacher, C.; Stoye, J.; Giegerich, R. REPuter: The manifold applications of repeat analysis on a genomic scale. Nucleic Acids Res. 2001, 29, 4633–4642. [Google Scholar] [CrossRef] [Green Version]
  41. Beier, S.; Thiel, T.; Münch, T.; Scholz, U.; Mascher, M. MISA-web: A web server for microsatellite prediction. Bioinformatics 2017, 33, 2583–2585. [Google Scholar] [CrossRef] [Green Version]
  42. Sharp, P.M.; Li, W.H. The codon Adaptation Index-a measure of directional synonymous codon usage bias, and its potential applications. Nucleic Acids Res. 1987, 15, 1281–1295. [Google Scholar] [CrossRef] [Green Version]
  43. Frazer, K.A.; Pachter, L.; Poliakov, A.; Rubin, E.M.; Dubchak, I. VISTA: Computational tools for comparative genomics. Nucleic Acids Res. 2004, 32, 273–279. [Google Scholar] [CrossRef] [PubMed]
  44. Brudno, M.; Do, C.B.; Cooper, G.M.; Kim, M.F.; Davydov, E.; Green, E.D.; Sidow, A.; Batzoglou, S. LAGAN and Multi-LAGAN: Efficient tools for large-scale multiple alignment of genomic DNA. Genome Res. 2003, 13, 721–731. [Google Scholar] [CrossRef] [PubMed] [Green Version]
  45. Notredame, C.; Higgins, D.G.; Heringa, J. T-Coffee: A novel method for fast and accurate multiple sequence alignment. J. Mol. Biol. 2000, 302, 205–217. [Google Scholar] [CrossRef] [PubMed] [Green Version]
  46. Katoh, K.; Misawa, K.; Kuma, K.; Miyata, T. MAFFT: A novel method for rapid multiple sequence alignment based on fast Fourier transform. Nucleic Acids Res. 2002, 30, 3059–3066. [Google Scholar] [CrossRef] [PubMed] [Green Version]
  47. Katoh, K.; Standley, D.M. MAFFT multiple sequence alignment software version 7: Improvements in performance and usability. Mol. Biol. Evol. 2013, 30, 772–780. [Google Scholar] [CrossRef] [PubMed] [Green Version]
  48. Capella-Gutierrez, S.; Silla-Martinez, J.M.; Gabaldon, T. trimAl: A tool for automated alignment trimming in large-scale phylogenetic analyses. Bioinformatics 2009, 25, 1972–1973. [Google Scholar] [CrossRef] [PubMed]
  49. Nguyen, L.; Schmidt, H.A.; von Haeseler, A.; Minh, B.Q. IQ-TREE: A fast and effective stochastic algorithm for estimating maximum-likelihood phylogenies. Mol. Biol. Evol. 2015, 32, 268–274. [Google Scholar] [CrossRef]
  50. Minh, B.Q.; Schmidt, H.A.; Chernomor, O.; Schrempf, D.; Woodhams, M.D.; von Haeseler, A.; Lanfear, R. IQ-TREE 2: New models and efficient methods for phylogenetic inference in the genomic era. Mol. Biol. Evol. 2020, 37, 1530–1534. [Google Scholar] [CrossRef] [Green Version]
  51. Yang, Z. PAML: A program package for phylogenetic analysis by maximum likelihood. Comput. Appl. Biosci. CABIOS 1997, 13, 555–556. [Google Scholar] [CrossRef]
Figure 1. Gene map of the D. nigra chloroplast genome. Genes shown inside the circle are transcribed clockwise, and those outside are transcribed counterclockwise. The darker gray in the inner circle corresponds to the GC content. The IRA and IRB (two inverted repeating regions); LSC (long single-copy region); and SSC (short single-copy region) are indicated outside of the GC content.
Forests 13 00626 g001
Figure 2. Comparison of junctions between the LSC, SSC, and IR regions among eight newly assembled Dalbergia species and the Pterocarpus indicus chloroplast genome. Figure is not to scale. (LSC: large single-copy, SSC: small single-copy, IR: inverted repeat). The numbers above the vertical line at the junction indicate the positions of the beginning and end of the IR region.
Forests 13 00626 g002
Figure 3. Variation in repeat abundance and type in 43 chloroplast genomes.
Forests 13 00626 g003
Figure 4. The number of simple sequence repeats (SSRs) of different types from 43 chloroplast genomes. (A) The number of AAT/ATT, AG/CT, AGAT/ATCT, AT/AT, C/G type SSRs; (B) The number of A/T type SSRs in each sample.
Forests 13 00626 g004
Figure 5. Global alignment of eight newly assembled Dalbergia chloroplast genomes using mVISTA with P. indicus as reference. Y-axis shows the range of sequence identity (50–100%). tRNA and rRNA genes were not present in this figure.
Forests 13 00626 g005
Figure 6. Sequence identity among coding and non-coding regions based on the alignment from 43 chloroplast genomes. T-Coffee was used to calculate the score of identity.
Forests 13 00626 g006
Figure 7. The mode and strength of selection among 77 chloroplast protein-coding genes in Dalbergia.
Forests 13 00626 g007
Figure 8. Codon content of 21 amino acids and a stop codon of 77 coding genes from 8 newly assembled Dalbergia chloroplast genomes. Color of the histogram corresponds to the color of codons in legend.
Forests 13 00626 g008
Figure 9. Phylogenetic tree of Dalbergia based on the CDS alignment of 77 chloroplast-coding genes. Numbers at nodes indicate the ultrafast bootstrap values generated by IQ-TREE. Species noted with stars are newly assembled chloroplast genomes from this study. Polyphyletic species are indicated with a dot.
Forests 13 00626 g009
Table 1. Summary of the complete chloroplast genomes sequenced for this study.
GB IDSpeciesTLGenestRNArRNAGC%LSCIRBSSIRA
MT644128Dalbergia fusca156,0338337836.0885,47525,71119,13125,716
MT644129Dalbergia hupeana155,8298337836.1985,30425,68019,16825,677
MT644130Dalbergia nigra155,3308237836.0585,11025,46919,28225,469
MT644131Dalbergia odorifera156,0648337836.0985,80425,70218,85625,702
MT644132Dalbergia oliveri156,6978237835.9686,03625,69119,27825,692
MT644133Dalbergia tonkinensis156,0878337836.0985,76325,72018,88425,720
MT644134Dalbergia bariensis156,5448337835.9485,76525,67519,42725,677
MT644135Dalbergia cochinchinensis156,5768337836.0885,88625,68219,32625,682
Table 2. Number of candidate molecular markers for black, Siam and scented rosewood.
GroupSpecies ContainedUnique INDELsUnique SNVs
Black rosewoodD. fusca, D. cultrata, D. nigra12
Black rosewoodD. fusca, D. cultrata49229
Black rosewoodD. nigra6994
Siam rosewoodAs shown in Figure 91058
Scented rosewoodD. odorifera, D. tonkinensis,
D. hainanensis (NC_036961)
1329
Scented rosewoodD. odorifera37
Scented rosewoodD. tonkinensis30
Publisher’s Note: MDPI stays neutral with regard to jurisdictional claims in published maps and institutional affiliations.

