
Impact of Growing Season Precipitation Regime on the Performance of Masson Pine Saplings


1
Zhejiang Provincial Key Laboratory of Plant Evolutionary Ecology and Conservation, Institute of Wetland Ecology & Clone Ecology, Taizhou University, Taizhou 318000, China
2
Forest Dynamics, Swiss Federal Institute for Forest, Snow and Landscape Research WSL, Zuercherstrasse 111, CH-8903 Birmensdorf, Switzerland
3
Key Laboratory of Geographical Processes and Ecological Security in Changbai Mountains, Ministry of Education, School of Geographical Sciences, Northeast Normal University, Changchun 130024, China
*
Authors to whom correspondence should be addressed.
Forests 2022, 13(4), 627; https://0-doi-org.brum.beds.ac.uk/10.3390/f13040627
Submission received: 29 March 2022
/
Revised: 14 April 2022
/
Accepted: 14 April 2022
/
Published: 16 April 2022
(This article belongs to the Section Forest Ecophysiology and Biology)
Abstract
:The growth and physiological effects of either decreased precipitation (e.g., drought) or increased one (e.g., flooding) on trees have been extensively studied. However, less attention has been paid to the questions of whether and how trees respond to changes in precipitation regime with different rainfall amounts. To investigate the effects of water availability on sapling’s growth, tissue levels of non-structural carbohydrates (NSCs), and nutrients, we carried out a greenhouse experiment with Masson pine (Pinus massoniana Lamb.) saplings grown in precipitation amounts of 300, 500, and 700 mm (3 levels) in combination with two levels of a watering regime (i.e., regular watering vs. pulsed watering, i.e., frequent low rainfall coupled with fewer instances of heavy rain) for a growing season in subtropical China. Pulsed watering caused higher soil pH (>7.5) but lower soil organic carbon and soil nutrients, and consequently led to smaller plant biomass and height of the saplings than regular watering, especially in the water amount treatment of 300 and 500 mm. Additionally, higher levels of NSCs in plant tissue concentrations were observed under pulsed watering than under regular watering, due to greater carbon consumption for supporting higher growth rate and a dilution effect by bigger plant size and biomass in the latter. Our results indicated that the growing season precipitation amount of 300 mm is sufficient for the drought-tolerant tree species P. massoniana. In such a case, the growing season precipitation regime rather than the precipitation amount will have a much stronger impact on the tree performance.
1. Introduction
The amount of precipitation and the precipitation regime (i.e., frequency or intervals among precipitation events) have changed in the past and are projected to change continuously in the future [1]. In some regions or areas such as in Europe [2] and subtropical China [3], the precipitation amount is projected to decrease and thus drought events are expected to become more frequent and severe. The drought-induced tree mortality has been observed around the world [4,5,6]. Non-structural carbohydrates (NSCs) and nutrients are considered to play an important role in determining drought resistance, survival, and recovery [7,8]. The carbon starvation hypothesis has been proposed to explain the drought-caused mortality of trees when photosynthesis is inhibited and NSCs reserves are depleted [6,9,10]. Meanwhile, nutrients have an impact on both carbon balance between carbon production and utilization, and on water uptake [8]. For example, a decrease in leaf N content may aggravate the effect of drought on photosynthesis by causing premature stomatal closure [11], protein degradation [12], and an increase in carbon consumption for cell repair, leading to carbon starvation [13].
On the other hand, the precipitation amount and heavy precipitation events have increased in some other areas such as in many regions of the United States [14], leading to waterlogging or flooding. The flood-induced tree mortality has also been observed around the world [15,16,17]. The shortage of NSCs and nutrients can partly contribute to this mortality. For instance, carbohydrate shortage was found in flooded trees due to impaired shoot-to-root transport of carbohydrates [18,19]. Likewise, the decreased nutrient uptake was found in waterlogging or flooding trees [20] due to the decreased transcript levels of many genes encoding transporters [21]. These findings indicated the importance of NSCs and nutrient storage in trees, especially in roots under waterlogging or flooding [22].
In subtropical China, changes in the precipitation amount and regime [23] resulted in increasing drought events companied by frequently short-duration extreme rainfall during the growing season, especially in the rainy season (i.e., so-called ‘plum rain’ season). This outcome may cause combined effects of drought and periodic waterlogging on plants. Unfortunately, previous studies paid less attention to such combined effects on trees. For example, we do not know whether and how the effects of regular watering on trees differ from the effects of irregular watering (e.g., pulsed watering).
Pinus massoniana Lamb. (Masson pine), native to China is one of the two most important tree species (the other one is Cunninghamia lanceolata (Lamb.) Hook.) in subtropical China. Across the subtropical regions of China, the fast-growing C. lanceolata is widely distributed on lower hill slopes with better soil and water conditions, whereas the relatively slow-growing P. massoniana is widely distributed on the poorly drained, nutrient-poor upper hill slopes. Therefore, P. massoniana suffers often from root waterlogging and periodic drought.
Given projected changes in the frequency, intensity, and amount of rainfall in subtropical China, we carried out a greenhouse experiment with Masson pine (Pinus massoniana Lamb.) saplings grown in the growing season with precipitation amounts of 300, 500, and 700 mm (3 levels) in combination with two levels of a watering regime (i.e., regular watering and pulsed watering) across a growing season. We recorded the mortality, growth, tissue levels of NSCs, and nutrients at the end-season, to test our hypothesis that pulsed watering will not affect saplings when the watering amount is sufficient (i.e., 700 mm), while pulsed watering will mitigate the negative effects of drought (e.g., <500 mm) on sapling’s survival, growth, tissue NSCs, and nutrients. We aimed to better understand the responses of subtropical forests to future climate change.
2. Materials and Methods
2.1. Study Site
The experiment was carried out in the greenhouse at Taizhou University (121°23′ E and 28°39′ N) in Taizhou, Zhejiang Province, China. The mean temperature was 27 °C, and the mean relative humidity was 80% (measured using a humidity/temperature datalogger, UNI-T, UT330B) inside the greenhouse during the experiment period.
2.2. Experimental Design
One-year-old P. massoniana saplings were obtained from a field nursery in Hechi, Guangxi province. On 16 February 2020, saplings with naked roots of similar height (20.9 ± 0.1 cm) were planted in pots (one sapling per pot) filled with a 2:1:1 (v:v:v) mixture of local soil, river sand, and peat. Each pot (38 cm in diameter, 41 cm in height, 28 L) with holes at the bottom was placed on a saucer (10 cm in height to ensure no overflow) to catch and maintain excess water and was watered every two days for one month while adapting to the greenhouse. The local soil was collected in the mountain area of Taizhou, containing 0.62 ± 0.17 (mean ± SE) g kg−1 total nitrogen and 0.13 ± 0.03 g kg−1 total phosphorus. The soil in each container was mixed with 84 g of slow-release fertilizer (N:P:K = 14:14:14; Osmocote Exact Standard 3–4 M; Scotts, Marysville, OH, USA) at the recommended dose (3 g L−1).
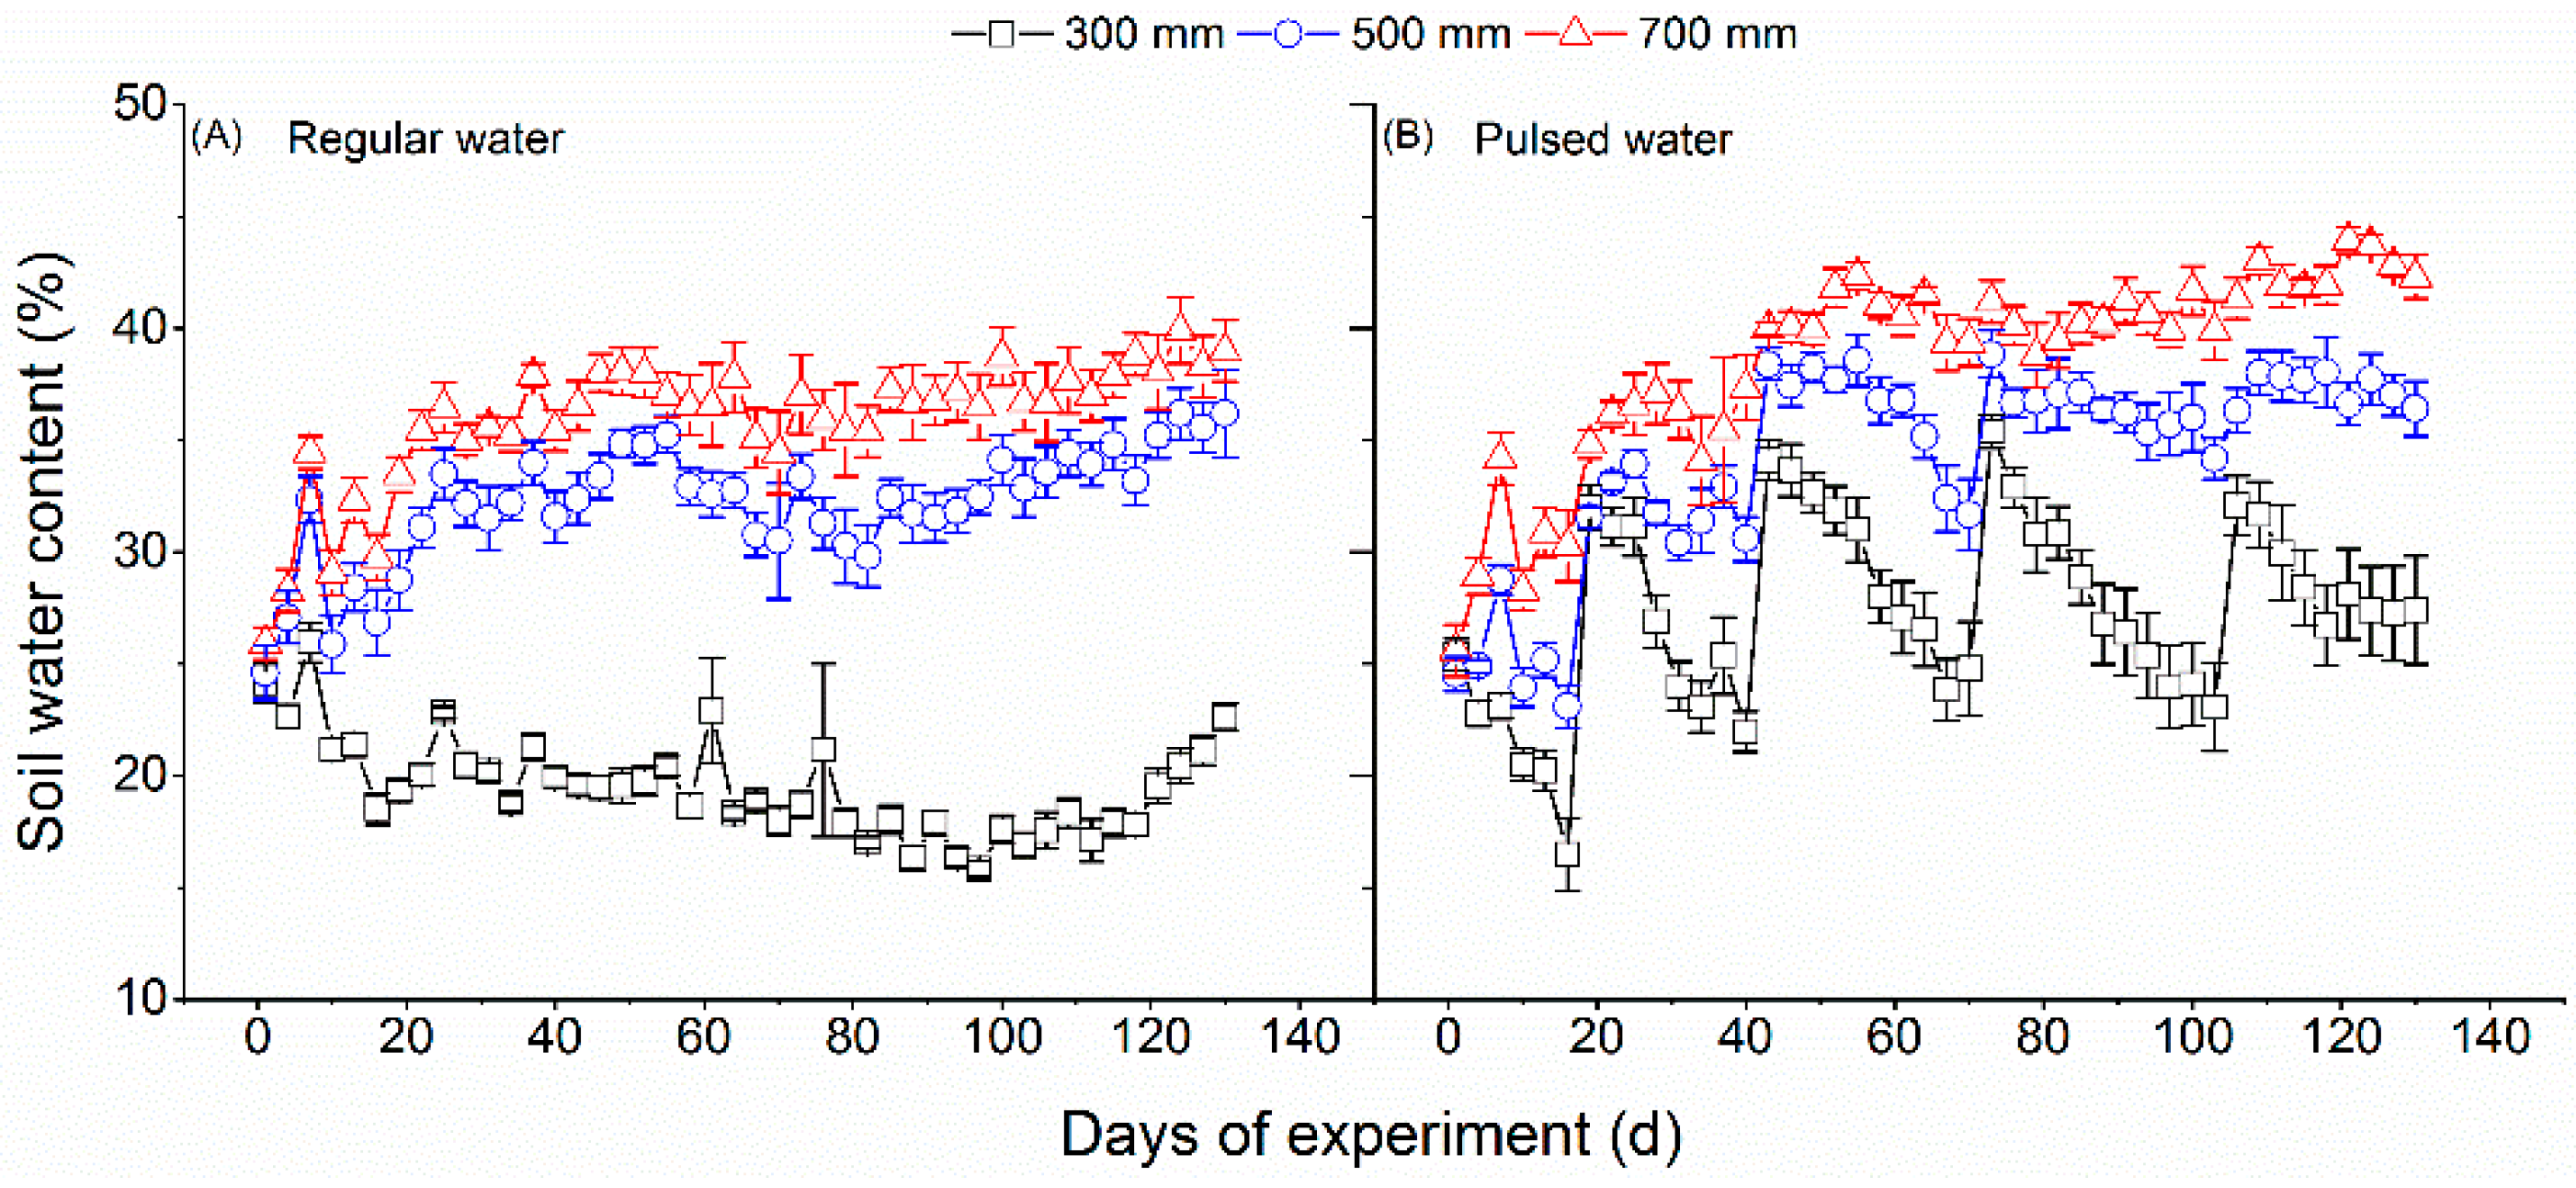
After one month of recovery growth, we started the water treatment on 16 March 2020, and continued it for 240 days until November 10 (end-season), 2020. The water treatments included three water amount levels (300, 500, and 700 mm) and two watering regimes (regular and pulsed). The growing season precipitation amount of 700 mm was selected because it corresponds to that amount occurring in Zhejiang province. Six pots (n = 6) were treated by each of the six water treatments (6 replicates × 3 amount levels × 2 watering regime levels = 36 pots). The water was added during the experiment period according to the following procedure. The water amount of 300, 500, or 700 mm regular watering treatment was added in 80 equal amounts (3.75, 6.25, and 8.75 mm, respectively) every three days across the experiment period (80 × 3 = 240 treatment days). For the pulsed watering treatment, two heavy rainfall events (2 times × 38 mm each = 76 mm) and two intense rainfall events (2 times × 52 mm each = 104 mm) were arranged during the rainy season (see Figure 1B). The remaining water amount of 120 (300 – 76 – 104 = 120), 320 (500 − 76 − 104 = 320), and 520 mm (700 − 76 − 104 = 520) was then added in 76 (80 times − 4 special rainfall events) equal amounts (0.68, 4.21, and 6.84 mm, respectively). The soil water content (%) was measured before each watering from day 1 to day 240 of the experiment when pulsed watering occurred, using a soil water probe (Procheck, Decagon Devices, Inc., Pullman, WA, USA), however, only the data from day 1 to day 140 were shown due to the loss of the subsequent data (Figure 1).
At the end of the growing season on 16 November 2020, one week after the last watering, individual plant height was measured. Then plants were harvested and oven-dried at 65 °C for 72 h, and the dry weight of needles, stems, and roots was separately measured. After that, oven-dried samples of needles, stems, and roots were ground into a fine powder and then stored for the measurements of NSC, total N, and total P concentrations. A composite soil sample was collected from each pot, sieved (2 mm), air-dried, and ground for nutrient analysis (N and P).
2.3. Chemical Analysis
The total non-structural carbohydrates (NSCs) are defined as the sum of soluble sugars and starch within a sample (i.e., organ or tissue). The powdered sample (0.1 g) was put into a 10 mL centrifuge tube, and 5 mL of 80% ethanol was added. The mixture was incubated at 80 °C in a water bath-shaker for 30 min and then centrifuged at 3500 rpm for 10 min. The pellets were extracted two more times with 80% ethanol. Supernatants were retained, combined, and stored at 4 °C to determine the concentration of soluble sugars [24].
The ethanol-insoluble pellet was used for starch extraction. Ethanol was removed by evaporation. Starch in the residue was released in 2 mL distilled water for 15 min in a boiling water bath. After being cooled to room temperature, 2 mL of 9.2 M HClO4 was added. Starch was hydrolyzed for 15 min. Then 4 mL distilled water was added to the samples, which were then centrifuged at 4000 rpm for 10 min. The pellets were extracted one more time with 2 mL of 4.6 M HClO4. Supernatants were retained, combined, and filled to 25 mL to determine starch. The soluble sugar and starch concentrations were measured spectrophotometrically (ultraviolet-visible spectrophotometer 752 S, Cany Precision Instruments Co., Ltd., Shanghai, China) at 620 nm using the anthrone method, and the starch concentration was calculated by multiplying the glucose concentrations by a conversion factor of 0.9 [24].
The total N and P concentrations in plant tissues and soil were determined colorimetrically using an Auto Continuous Flow Analyzer (Bran & Luebbe, Norderstedt, Germany) after being digested with a mixture of sulfuric and perchloric acid (5:1). Soil organic carbon (SOC) was determined in ground soil samples using an elemental analyzer (Vario MACRO Cube, Elementar, Germany). Soil pH was determined in a 1:2.5 (w/v) soil: water slurry.
2.4. Statistical Analyses
A two-way ANOVA was used to determine the effects of water amount, watering regime and their interactions on sapling biomass and height, concentrations, and the pool size (concentration × tissue biomass) of NSCs and nutrients (N and P) of P. massoniana saplings, as well as the SOC, N and P concentrations in soils. The initial height of P. massoniana saplings was considered a covariate. All data were checked for normality using the Kolmogorov-Smirnov test and for homogeneity of variance using Levene’s test. Data for total biomass that did not meet the assumption was transformed into a log (x + 1) prior to analysis. All statistical analyses were performed using SPSS software version 22.0 (IBM Corp., Armonk, NY, USA).
3. Results
3.1. Soil Parameters
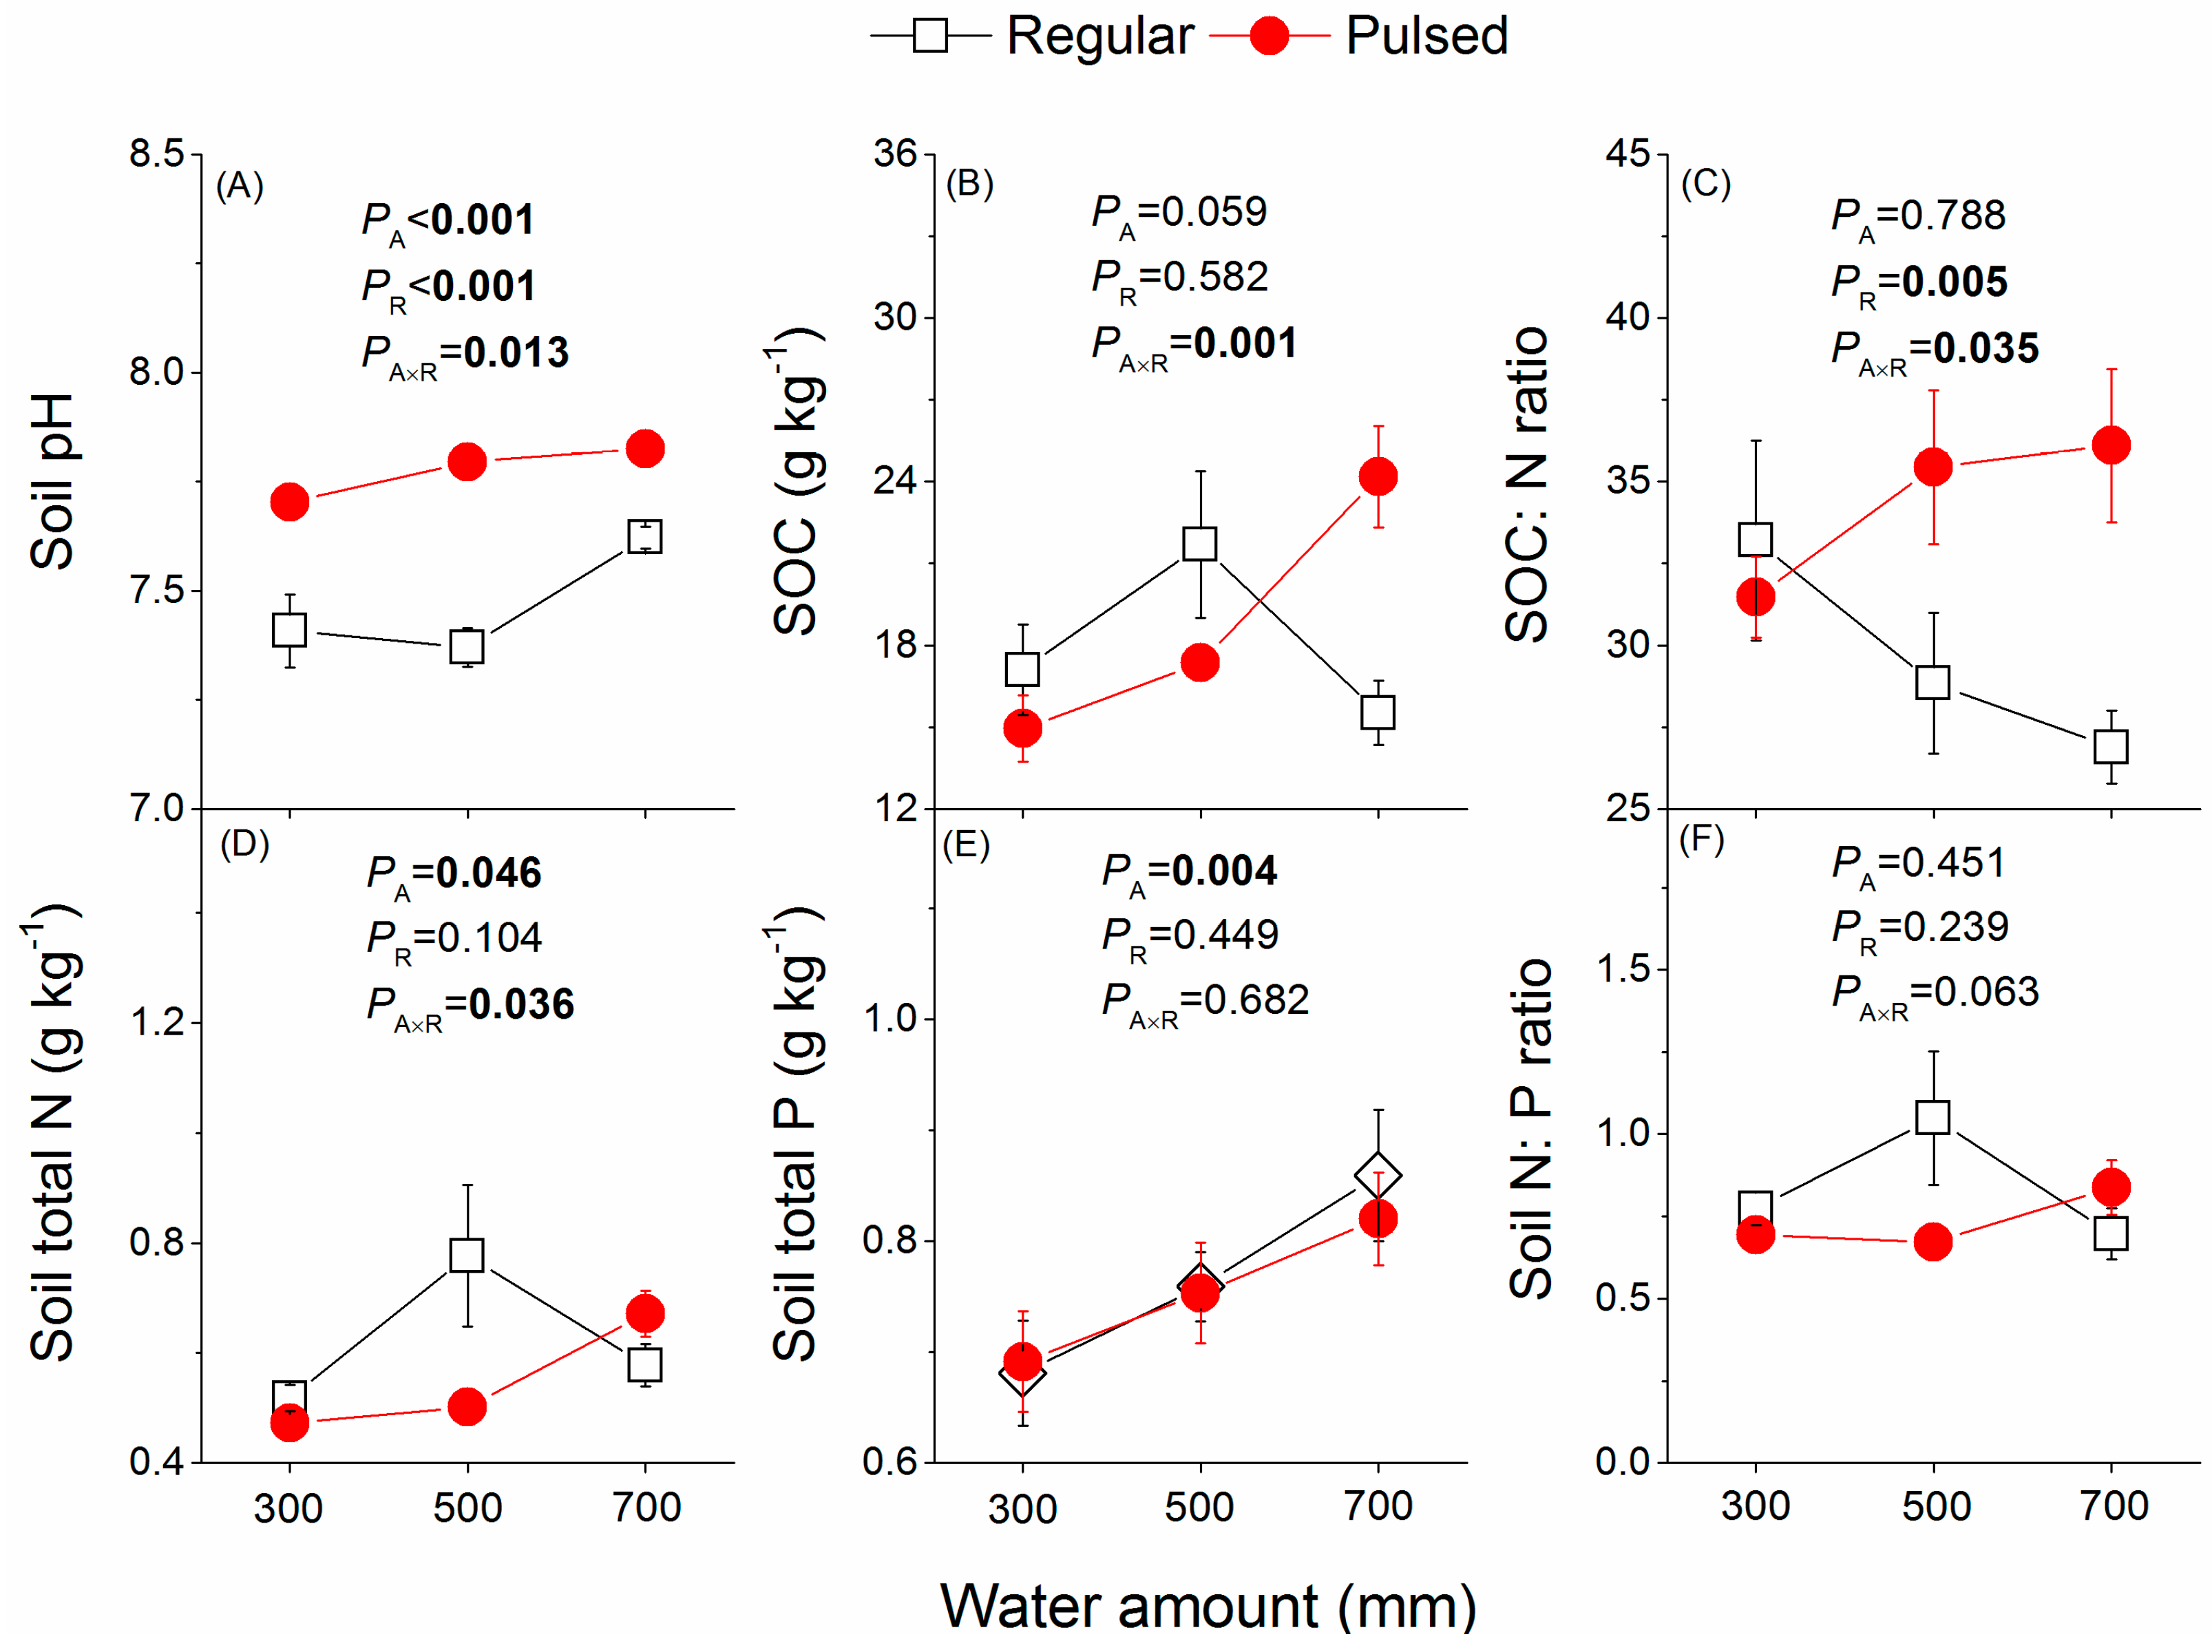
The soil water content increased significantly with increasing water amount (Figure 1). The soil water content fluctuated significantly under pulsed watering supply, especially under the water amounts of 300 and 500 mm (Figure 1B). Regardless of the watering regime, the soil water content exceeded the field capacity (32%) under the water amount of 700 mm (Figure 1), indicating an excess of water supply and even an effect of slight waterlogging. The soil pH was significantly higher under pulsed watering than under regular watering supply (Figure 2A). Neither the water amount nor the watering regime had a significant effect on SOC (Figure 2B). There was a significant effect of the water amount and watering regime on the ratio of SOC to N, showing that the ratio value increased along with water amount under pulsed watering, but decreased along with water amount under regular watering (Figure 2C). The water amount had a significant effect on soil total N (Figure 2D), but this effect varied with the watering regime (significant interaction between water amount and watering regime). Soil total N increased with increasing water amount under pulsed watering supply but exhibited a peak-shaped trend under regular watering supply with increasing water amount (Figure 2D). Regardless of the watering regime, total soil P increased with increasing water amount (Figure 2E).
3.2. Sapling’s Growth Response
Both sapling’s biomass (Figure 3A–D) and height (Figure 3F) showed a similar pattern along with the water treatment and were significantly higher under regular watering supply than under pulsed watering supply. Neither water amount nor watering regime influenced the ratio of roots to shoots (Figure 3E).
3.3. Responses of Soluble Carbohydrates
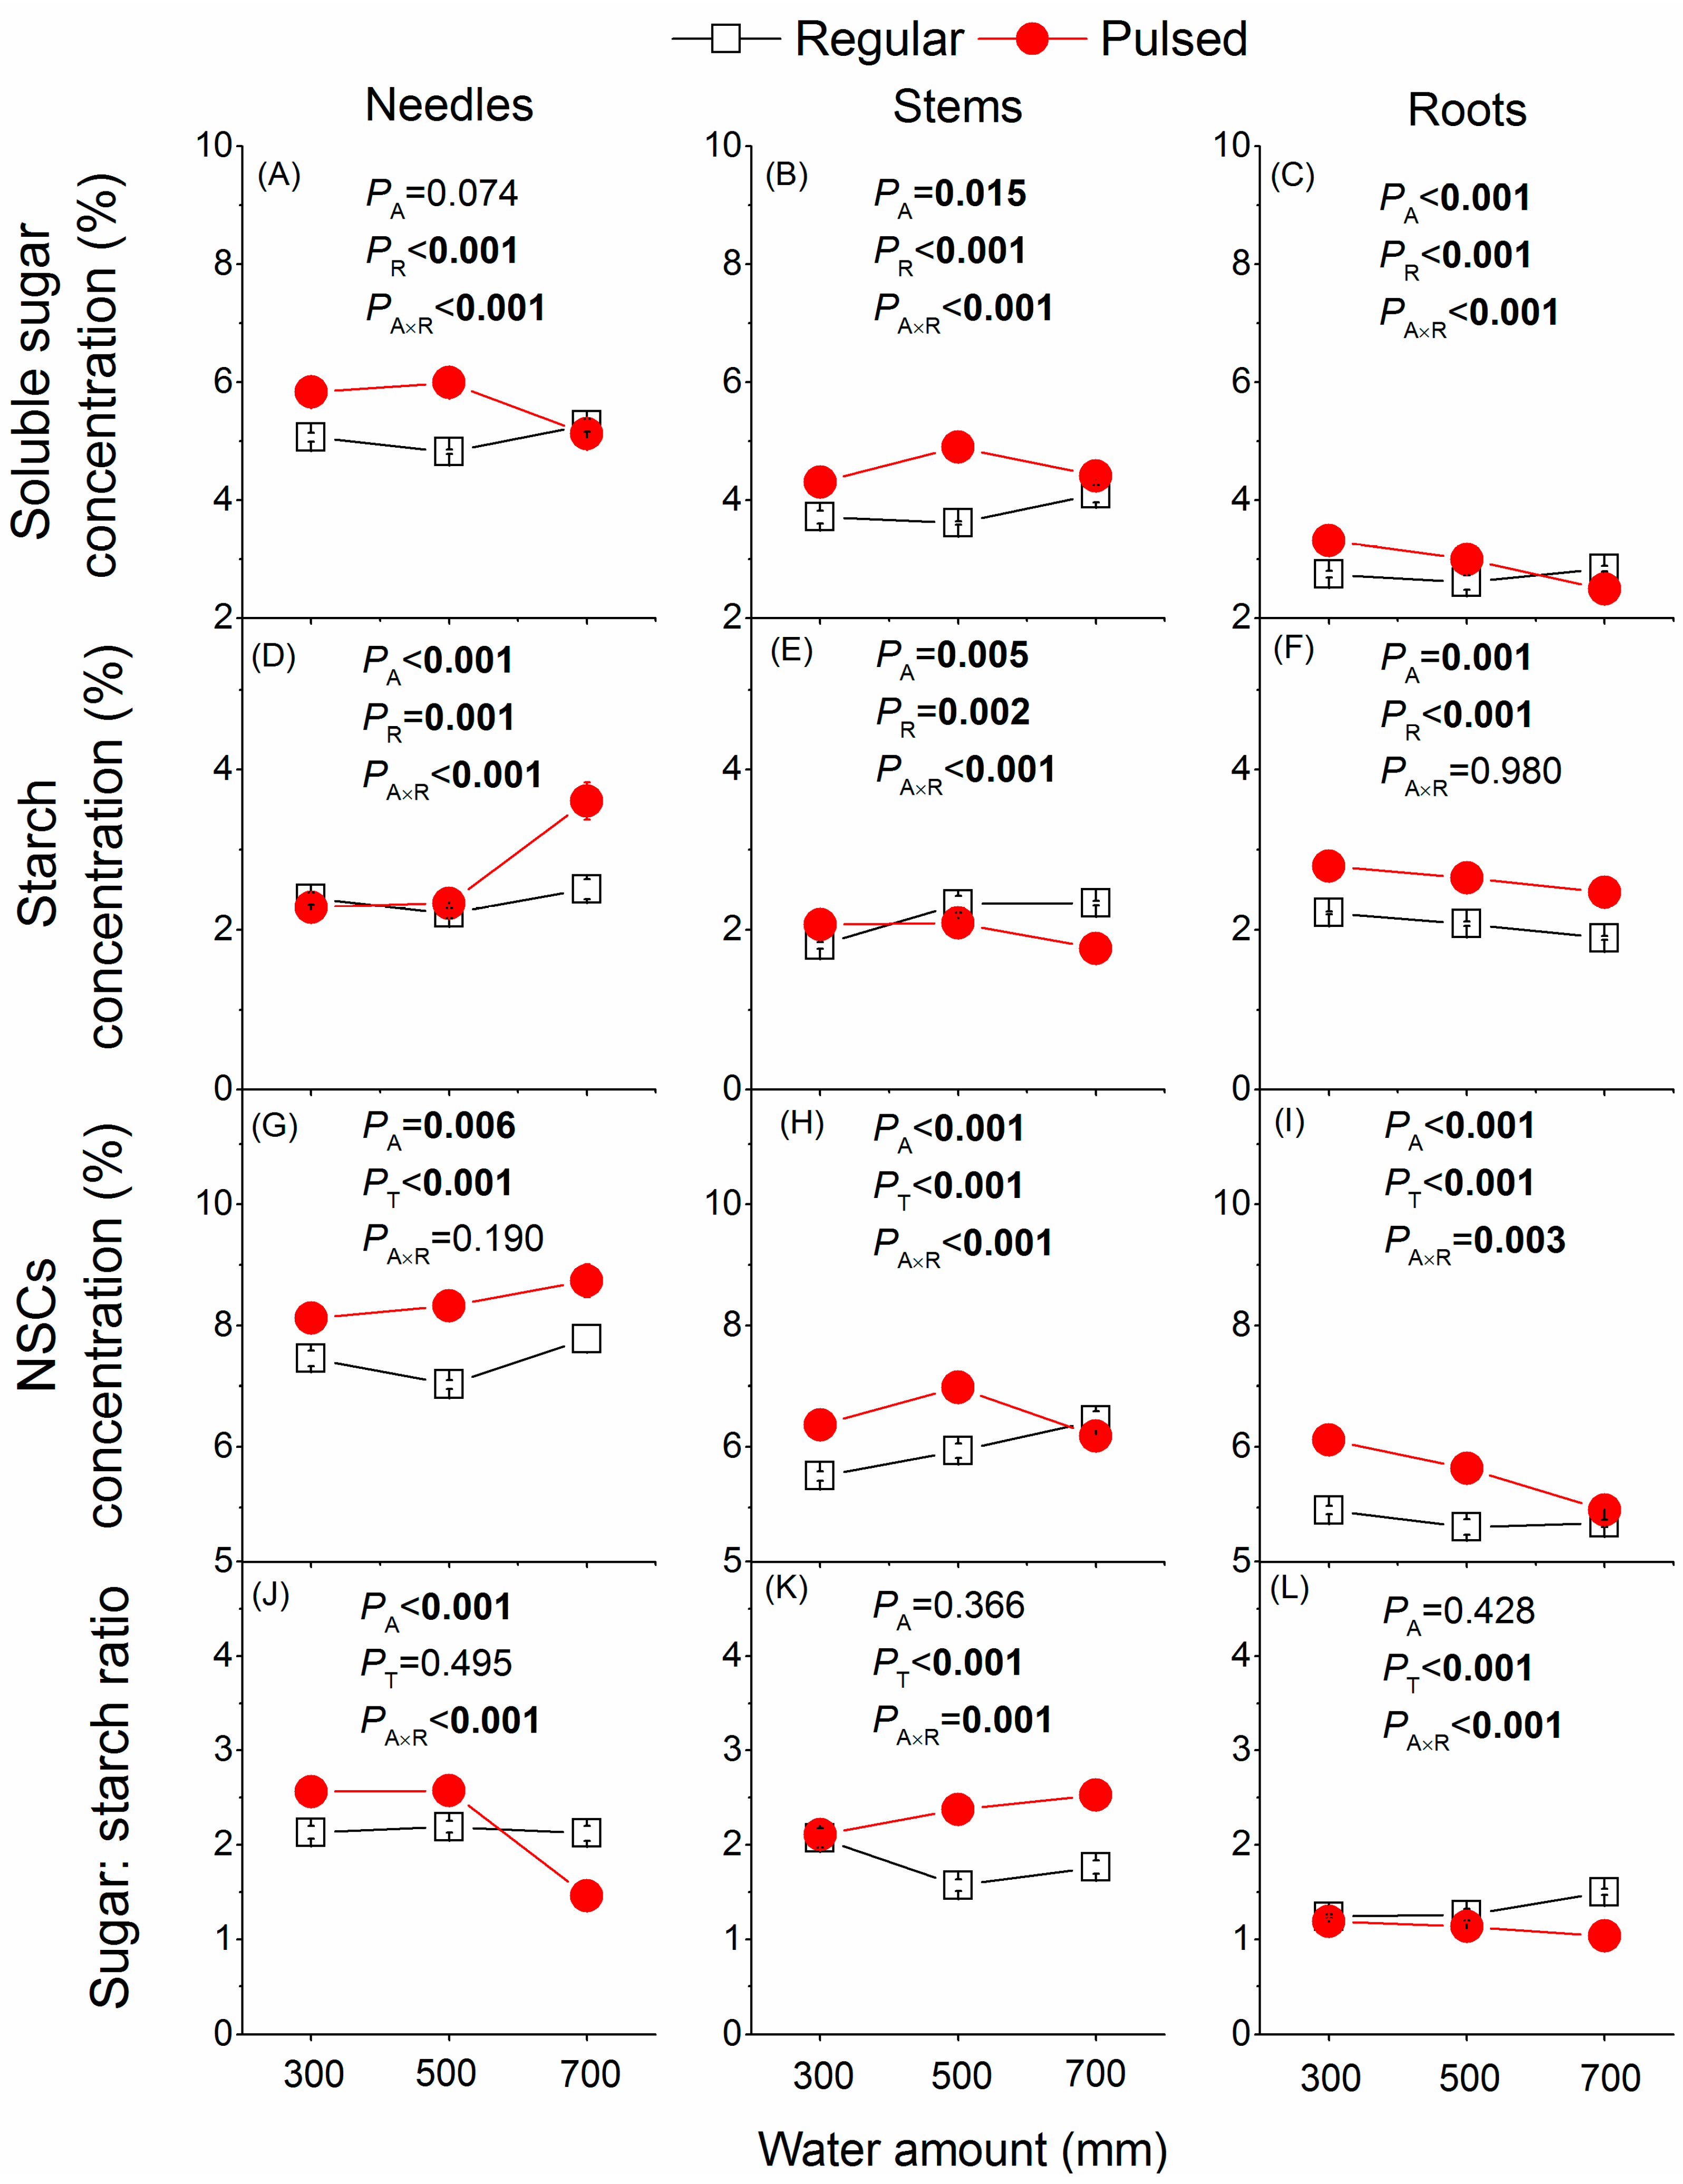
Both water amount and the watering regime had significant effects on the concentrations of soluble sugars, starch, and NSCs in needles, stems, and roots, and their effects exhibited significant two-way interactions (Figure 4), except for needle NSCs (Figure 4G) and root starch (Figure 4F). The concentrations of NSCs were significantly higher in plants under pulsed watering supply than under regular watering supply across the three plant tissues (Figure 4) except for stem starch (Figure 4E). The ratio of soluble sugars to starch was also significantly affected by the interaction between water amount and watering regime (Figure 4J–L), but the water amount affected the ratio in needles (Figure 4J) and the watering regime influenced that ratio in stem and roots (Figure 4K,L).
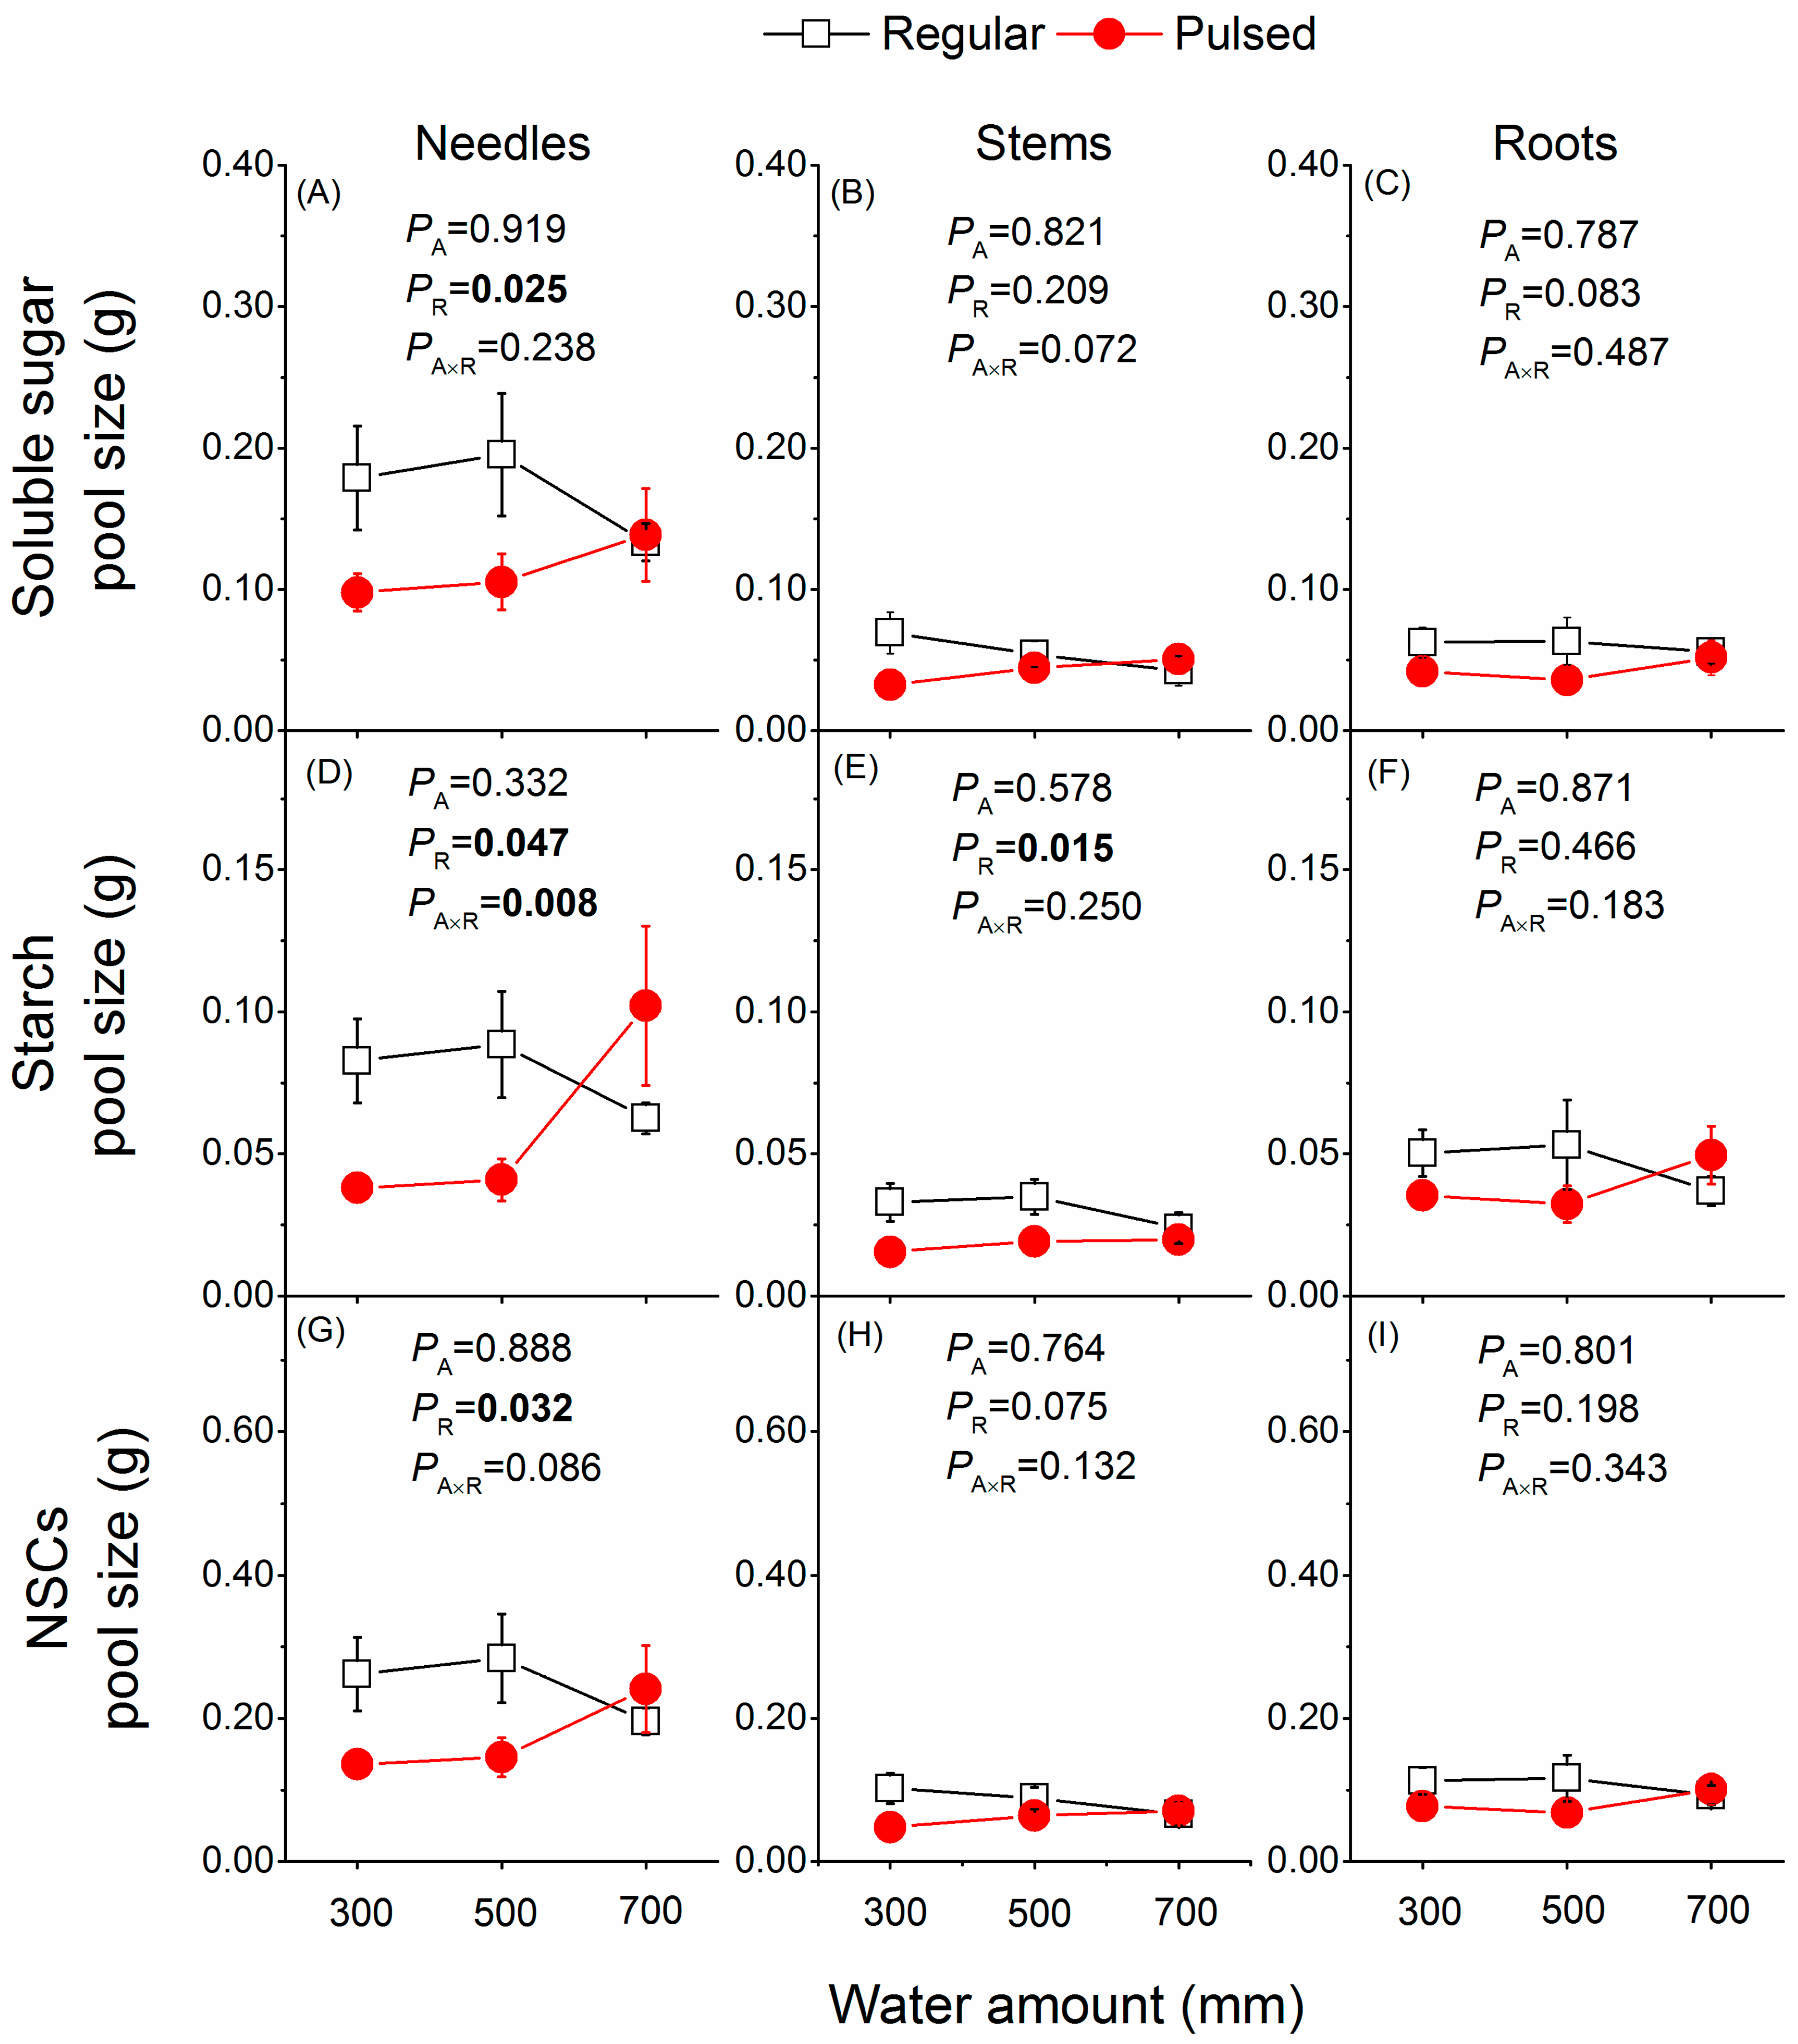
Irrespective of water amount, overall the pool size of NSCs seemed to be somewhat greater in plants under regular than under pulsed watering regime (Figure 5), although significant effects of the watering regime were found only for needle NSCs pools (Figure 5A,D,G) and stem starch pools (Figure 5E).
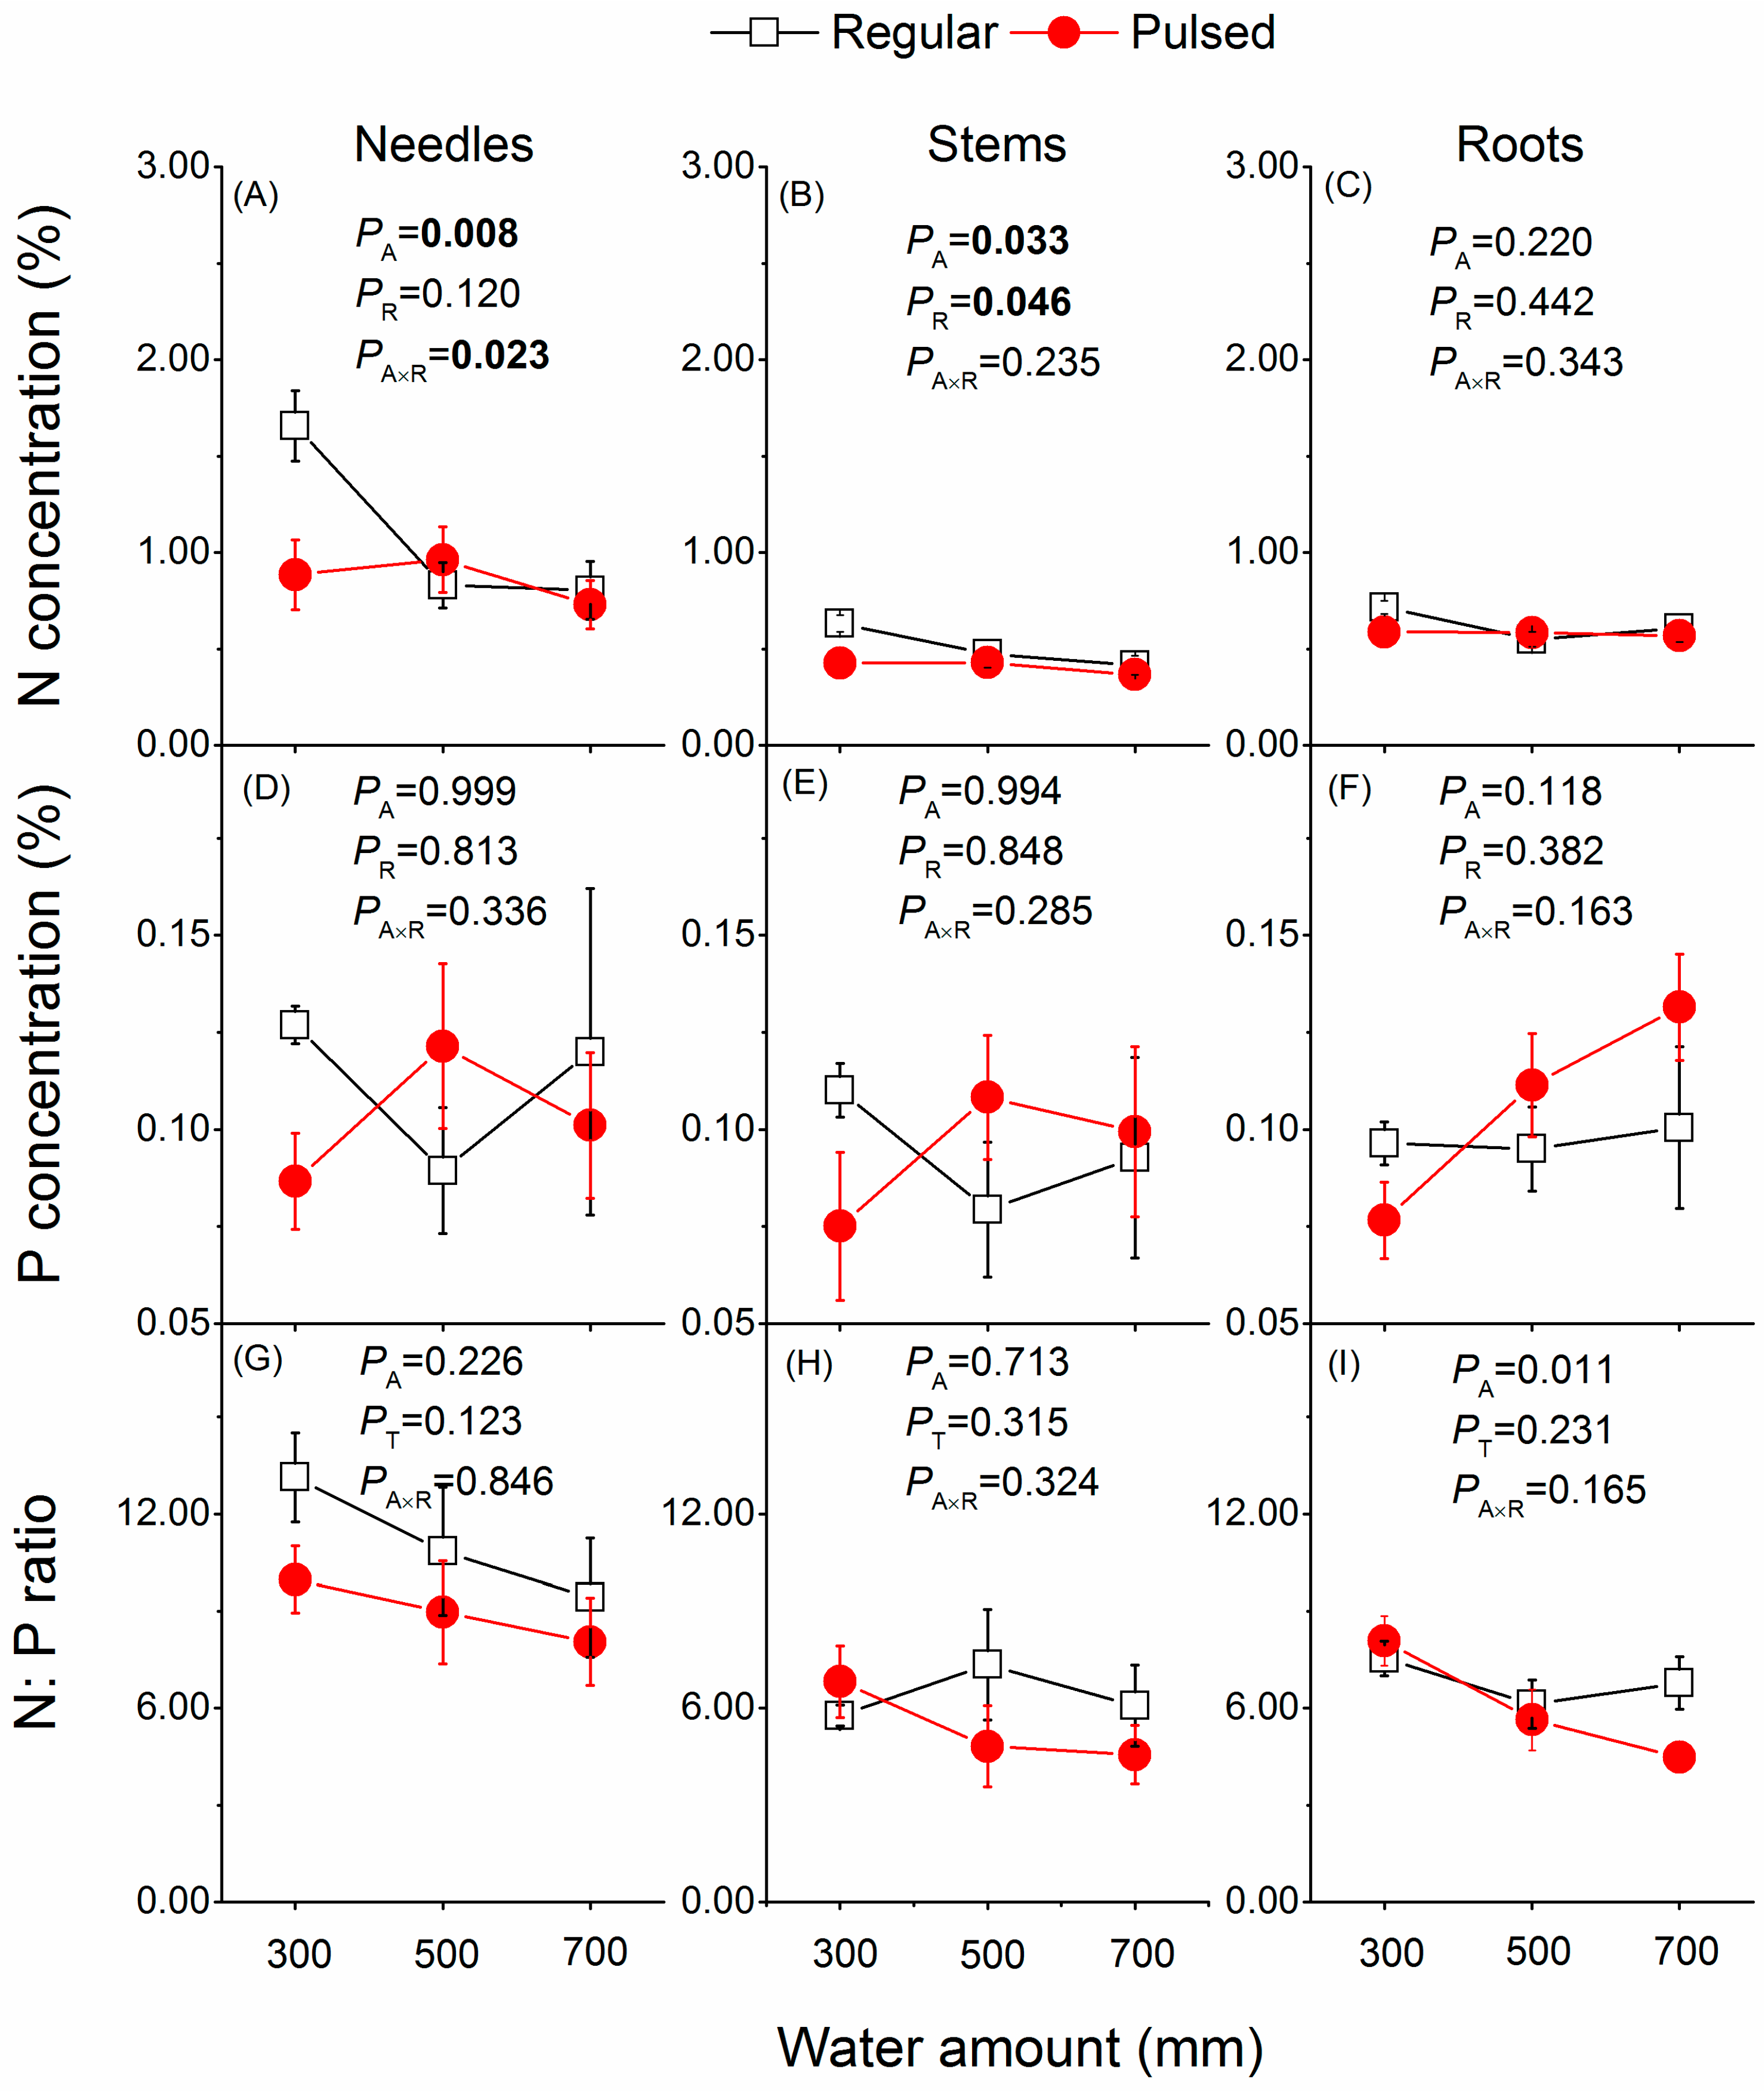
3.4. Nutrient Responses
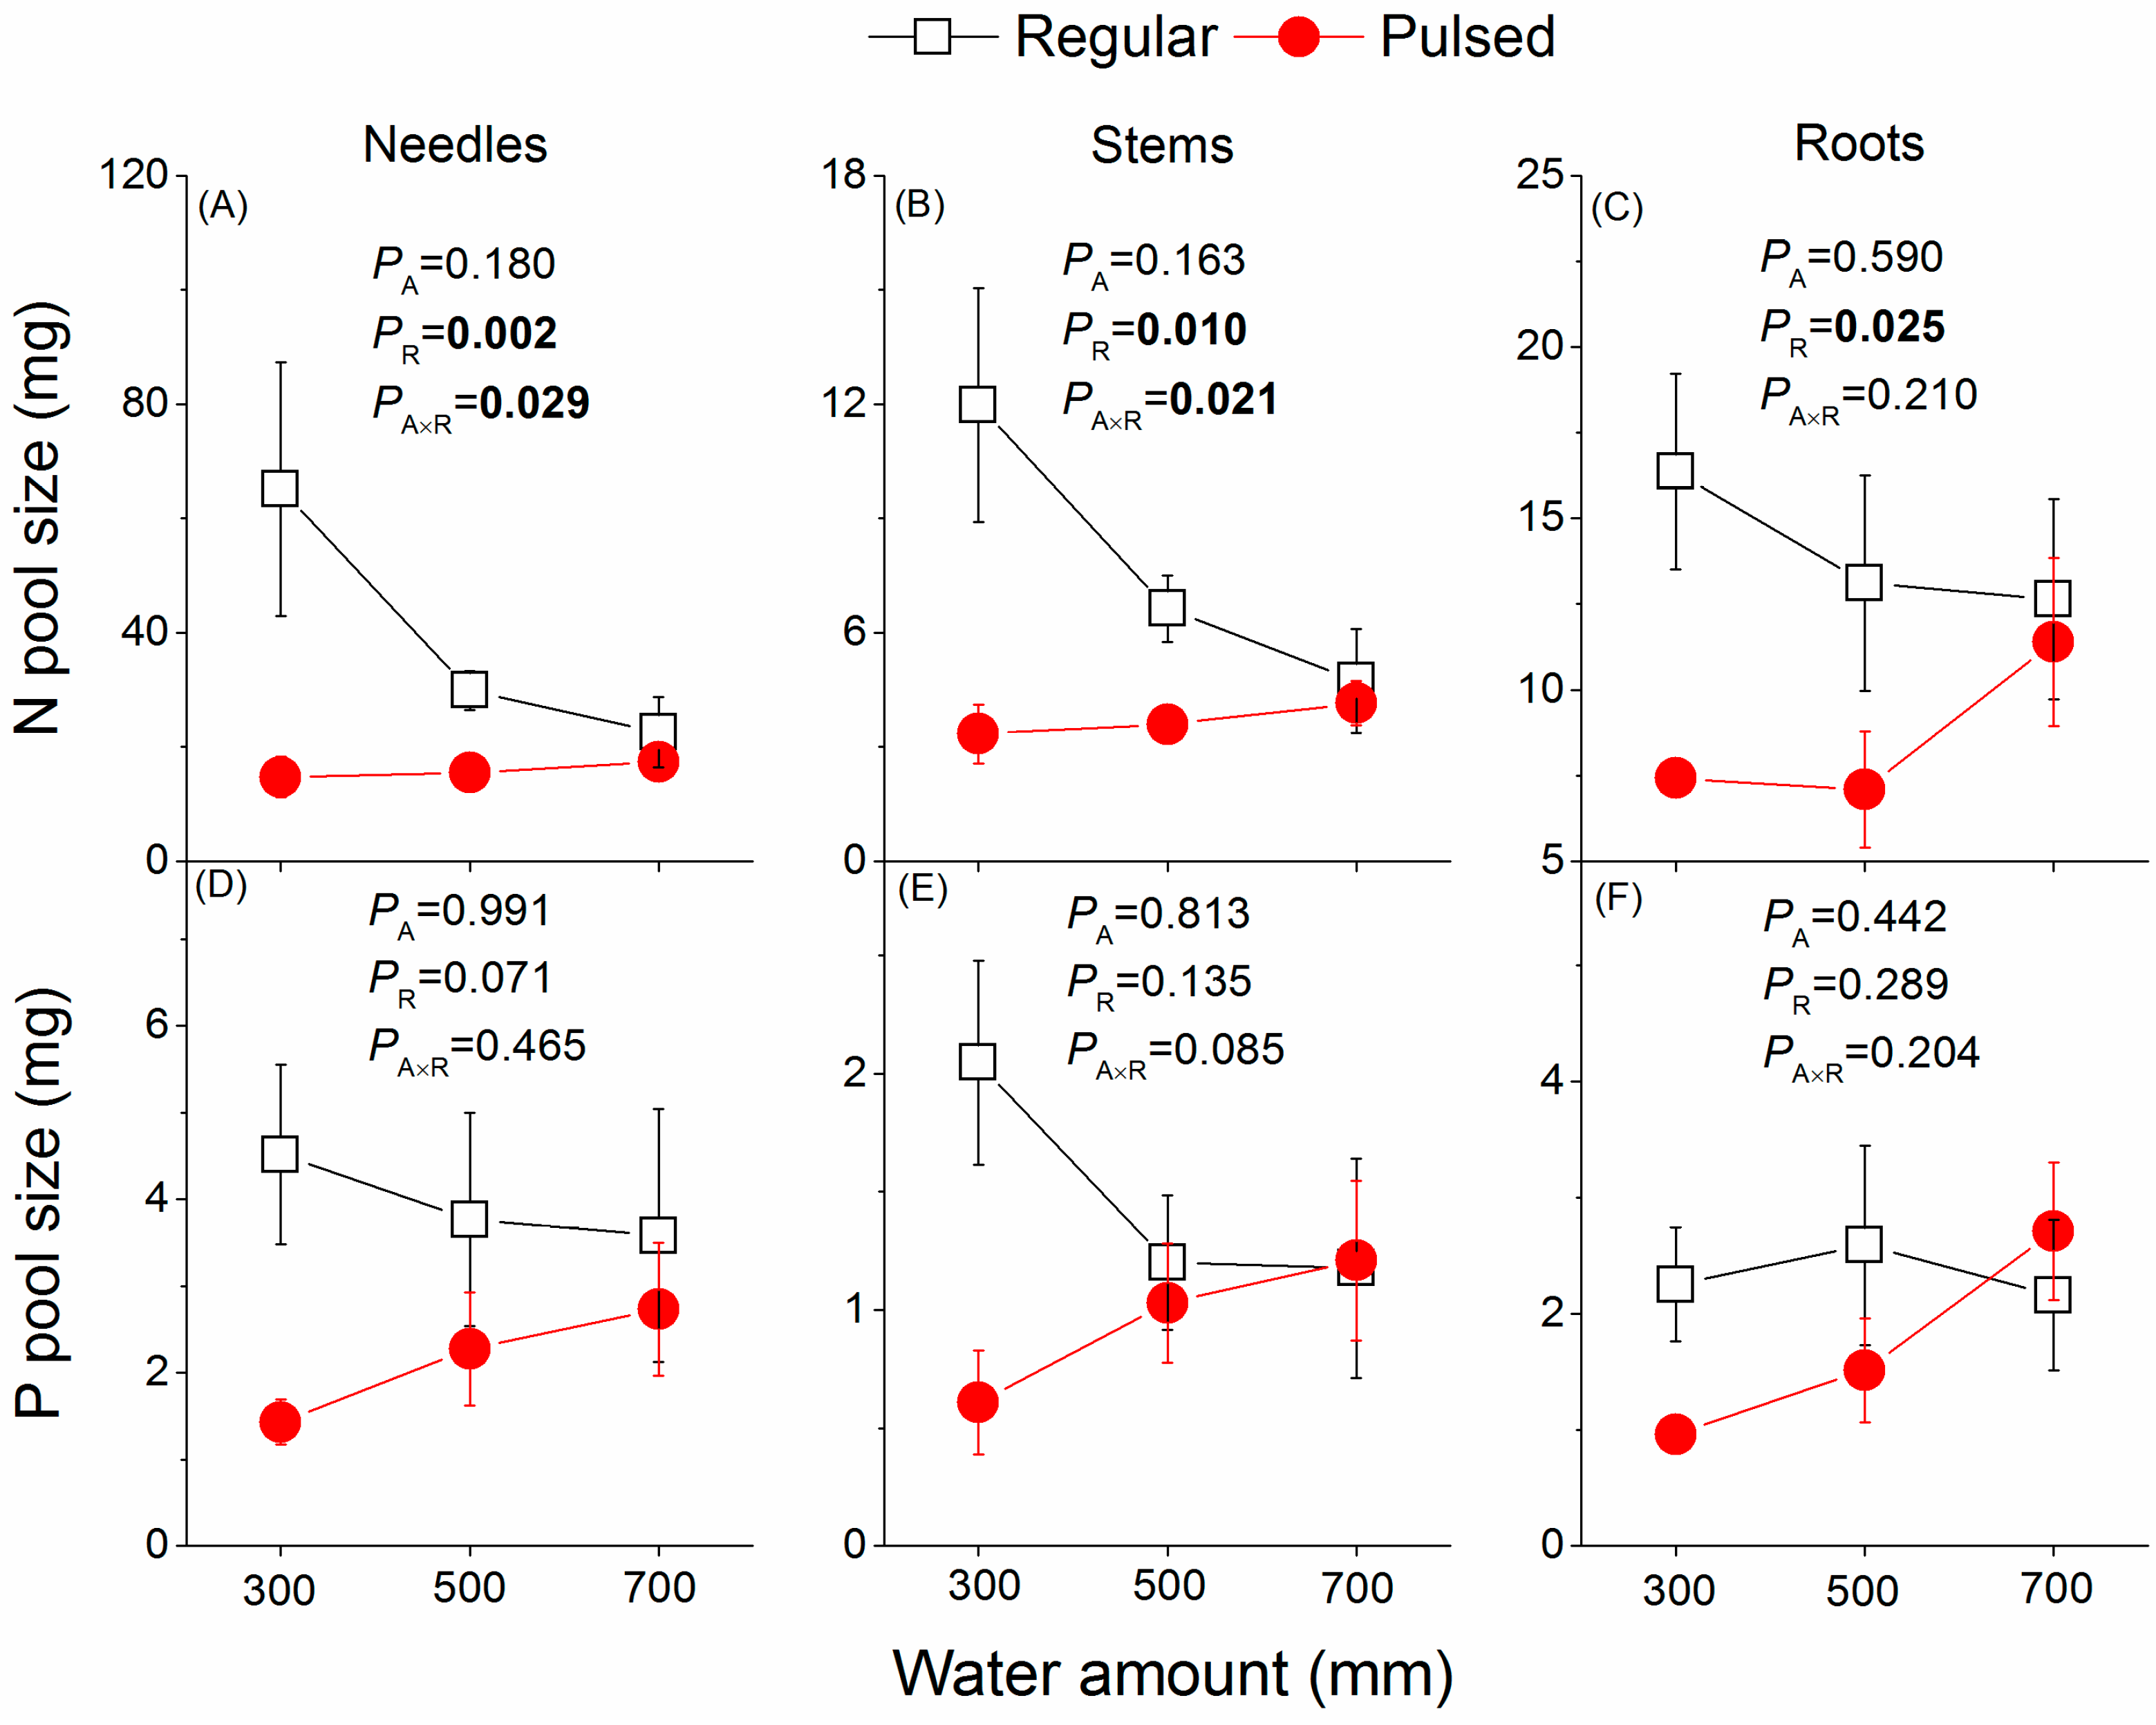
Unlike NSCs, plant tissue N, P, and N:P ratios were less affected by water treatments. Only N in both needles and stem decreased significantly with increasing water amount (Figure 6A,B), and the stem N concentration was significantly higher under regular watering supply than under pulsed watering supply (Figure 6B). Although the tissue N and P pool size seemed to be greater in plants under regular than under pulsed watering supply (Figure 7A), only the former was significantly increased (Figure 7A–C).
4. Discussion
Not water amount but regular watering, compared to pulsed watering, significantly positively affected the growth of P. massoniana saplings (Figure 3). This result suggests that increasing the intensity and frequency of extremely heavy precipitation events observed and projected [1,25] in the rainy season will negatively influence tree growth in subtropical China. This deleterious effect of pulsed watering on the growth of P. massoniana saplings seemed to be a result of increased soil pH (Figure 2A) and decreased soil N availability (Figure 2D,F) and thus increased soil SOC:N ratio (Figure 2C). P. massoniana prefers to grow in light (sandy) and medium (loamy), well-drained, mildly acid to neutral soils [26]. We found that pulsed watering significantly increased soil pH (>7.5), which led to an alkaline soil environment that may have inhibited the saplings’ growth of P. massoniana. We also found lower SOC and soil N concentrations under pulsed watering at the water amount of 300 and 500 mm compared to regular watering (Figure 2B,D), which might contribute to the lower biomass and height of P. massoniana saplings. Moreover, frequent small rainfall events accompanied by short-duration heavy/intense rainfall events are likely to result in periodical waterlogging, leading to reduced root activity due to limited air amount in the soil. Subsequently, this would have a negative impact on the saplings’ growth. High soil water availability exceeding the needs for plant growth can inhibit root growth and even threaten plant survival [27,28] due to oxygen shortage and thus anaerobic respiration. For example, there was no significant difference in the influence of pulsed watering and regular watering on saplings’ growth in the water amount treatment of 700 mm, which was likely due to excess water (more than field capacity) under both watering regimes. Thus, our results suggest that soil characteristics such as pH, SOC, and nitrogen content were likely the limiting factors influencing the growth of saplings, and pulsed watering negatively influences the growth of P. massoniana saplings by influencing these soil variables.
The concentration of mobile carbohydrates in plants is determined by the balance between photosynthetic carbon production and carbon utilization [29,30]. Therefore, plants growing in suitable environments (i.e., regularly well-watered conditions) may have lower tissue concentrations of NSCs due to increased carbohydrate consumption for a higher growth rate [31,32,33,34], compared to plants in stressful conditions where plants prioritize storing carbon resources over their growth [35,36,37]. Thus, we found lower tissue concentrations of soluble sugars, starch, and NSCs (Figure 4) but a higher growth rate in saplings under regular watering (Figure 3). Alternatively, a higher growth rate and thus larger plant size and biomass (Figure 3) may cause a dilution effect [38], leading to lower tissue concentrations of NSCs (Figure 4) but greater pool size of NSCs (Figure 5) in plants under regular watering found in the present study. Inversely, the higher tissue concentrations of NSCs in plants under pulsed watering (Figure 4) may be a result of decreased growth rate (Figure 3) and thus less NSCs used for growth but more NSCs stored for survival. For example, plants under stressful conditions such as drought [39] and low temperature [35,36] showed a priority to store NSCs for survival over their growth [40].
The ratio of soluble sugar to starch in aboveground tissues (needles and stems) was higher than it was in belowground tissue (roots) (Figure 4J–L) largely due to higher concentrations of soluble sugars in aboveground tissues (Figure 4A,B). This is because the roots are the main storage tissue [41,42] and the root sugars at the end-season have already been converted to starch stored in the roots. Pulsed watering, compared to regular watering, showed a lower growth rate for both stem and roots (Figure 3B,C) but a higher ratio of soluble sugar to starch in stems (Figure 4K) and a lower ratio in roots (Figure 4L), probably implying that pulsed watering inhibited the downward transport of sugars from aboveground tissue to roots.
Pulsed watering significantly decreased soil total N under the water amount treatment of 300 and 500 mm, which may be a result of increased denitrification and nitrate leaching caused by pulsed watering in water-limited soil conditions, as previously reported [43,44]. Correspondingly, plant tissue N concentration (Figure 6A,B) and plant N pool size (Figure 7A–C) were lower under pulsed watering than under regular watering. Compared to the water amount treatment of 300 and 500 mm, the 700 mm treatment decreased both needle and stem N concentrations (Figure 6A,B), which might be due to increased N consumption for growth on the one hand, and increased denitrification and nitrate leaching on the other hand. Moreover, the water amount treatment of 700 mm may cause waterlogging and thus decreases the soil oxygen availability, and further may limit the N uptake by roots and the N supply to leaves. Further explanation may be the decreased transcript levels of many genes encoding transporters [21] and the decreased levels of genes involved in amino acid biosynthesis [45,46] under waterlogging.
Previous studies indicated large fluctuations of soil P in response to pulsed watering [47,48]. In the present study, however, P was found to be less sensitive to watering regimes. One reason might be the different experimental design including the duration and intensity of pulsed watering [49], as well as the soil used in the present experiment [50]. We found that soil total P increased with increasing water amount (Figure 2E), which may be largely due to the change of ferric phosphates into more soluble ferrous compounds under sufficient water conditions and even waterlogging [51]. However, the increased soil P with increasing water amount did not increase plant P concentrations (Figure 6D–F), which may be a result of a balanced N:P stoichiometry of plants on the one hand, and an excess water-induced N limitation, showing low N:P ratios in both soil (Figure 2F) and plants (Figure 6G–I) on the other hand.
5. Conclusions
Inconsistent with our hypothesis, we found that pulsed water supply had a negative effect on the growth of P. massoniana saplings when the total precipitation amount is limited, while it acted as excessive water that did not affect plants when the total precipitation amount is sufficient. The growing season water amount of 300, 500, and 700 mm had no significant effects on the performance of P. massoniana saplings, indicating that the growing season precipitation amount of 300 mm is also sufficient for the drought-tolerant tree species P. massoniana. The overall effects indicated that the growing season precipitation regime rather than the precipitation amount (if it is not a limiting factor) will have a greater impact on tree performance.
Author Contributions
Conceptualization, X.W. and F.-H.Y.; methodology, Y.-M.T. and N.-N.F.; formal analysis, W.-L.Z.; writing—original draft preparation, X.W.; writing—review and editing, M.-H.L.; supervision, F.-H.Y. and M.-H.L.; funding acquisition, X.W. All authors have read and agreed to the published version of the manuscript.
Funding
This work was supported by the Natural Science Foundation of Zhejiang Province of China (LQ20C160008).
Institutional Review Board Statement
Not applicable.
Informed Consent Statement
Not applicable.
Data Availability Statement
Data can be obtained via personal communication with the corresponding author.
Conflicts of Interest
The authors declare no conflict of interest.
References
- Masson-Delmotte, V.; Zhai, P.; Pirani, A.; Connors, S.L.; Péan, C.; Berger, S.; Caud, N.; Chen, Y.; Goldfarb, L.; Gomis, M.I.; et al. (Eds.) IPCC Climate Change 2021: The Physical Science Basis. In Contribution of Working Group I to the Sixth Assessment Report of the Intergovernmental Panel on Climate Change; Cambridge University Press: Cambridge, UK, 2021. [Google Scholar]
- Spinoni, J.; Vogt, J.V.; Naumann, G.; Barbosa, P.; Dosio, A. Will drought events become more frequent and severe in Europe? Int. J. Clim. 2018, 38, 1718–1736. [Google Scholar] [CrossRef] [Green Version]
- Li, W.; Pan, R.; Jiang, Z.; Chen, Y.; Li, L.; Luo, J.-J.; Zhai, P.; Shen, Y.; Yu, J. Future changes in the frequency of extreme droughts over China based on two large ensemble simulations. J. Clim. 2021, 34, 6023–6035. [Google Scholar] [CrossRef]
- Allen, C.D.; Macalady, A.K.; Chenchouni, H.; Bachelet, D.; McDowell, N.; Vennetier, M.; Kitzberger, T.; Rigling, A.; Breshears, D.D.; Hogg, E.H.; et al. A global overview of drought and heat-induced tree mortality reveals emerging climate change risks for forests. For. Ecol. Manag. 2010, 259, 660–684. [Google Scholar] [CrossRef] [Green Version]
- Choat, B.; Brodribb, T.; Brodersen, C.R.; Duursma, R.A.; López, R.; Medlyn, B. Triggers of tree mortality under drought. Nature 2018, 558, 531–539. [Google Scholar] [CrossRef] [PubMed]
- McDowell, N.; Allen, C.D.; Anderson-Teixeira, K.; Brando, P.; Brienen, R.; Chambers, J.; Christoffersen, B.; Davies, S.; Doughty, C.; Duque, A.; et al. Drivers and mechanisms of tree mortality in moist tropical forests. New Phytol. 2018, 219, 851–869. [Google Scholar] [CrossRef] [Green Version]
- O'Brien, M.; Leuzinger, S.; Philipson, C.; Tay, J.; Hector, A. Drought survival of tropical tree seedlings enhanced by non-structural carbohydrate levels. Nat. Clim. Chang. 2014, 4, 710–714. [Google Scholar] [CrossRef]
- Gessler, A.; Schaub, M.; McDowell, N.G. The role of nutrients in drought-induced tree mortality and recovery. New Phytol. 2016, 214, 513–520. [Google Scholar] [CrossRef] [Green Version]
- McDowell, N.G. Mechanisms linking drought, hydraulics, carbon metabolism, and vegetation mortality. Plant Physiol. 2011, 155, 1051–1059. [Google Scholar] [CrossRef] [Green Version]
- Sala, A.; Woodruff, D.R.; Meinzer, F.C. Carbon dynamics in trees: Feast or famine? Tree Physiol. 2012, 32, 764–775. [Google Scholar] [CrossRef] [Green Version]
- Ghashghaie, J.; Saugier, B. Effects of nitrogen deficiency on leaf photosynthetic response of tall fescue to water deficit. Plant Cell Environ. 1989, 12, 261–271. [Google Scholar] [CrossRef]
- Fotelli, M.N.; Rennenberg, H.; Geßler, A. Effects of drought on the competitive interference of an early successional species (Rubus fruticosus) on Fagus sylvatica L. Seedlings: 15N uptake and partitioning, responses of amino acids and other N compounds. Plant Biol. 2002, 4, 311–320. [Google Scholar] [CrossRef]
- McDowell, N.; Pockman, W.T.; Allen, C.D.; Breshears, D.D.; Cobb, N.; Kolb, T.; Plaut, J.; Sperry, J.; West, A.; Williams, D.G. Mechanisms of plant survival and mortality during drought: Why do some plants survive while others succumb to drought? New phytol. 2008, 178, 719–739. [Google Scholar] [CrossRef] [PubMed]
- Wuebbles, D.J.; Fahey, D.W.; Hibbard, K.A.; Dokken, D.J.; Stewart, B.C.; Maycock, T.K. (Eds.) USGCRP Climate Science Special Report: A Sustained Assessment Activity of the U.S. Global Change Research Program; U.S. Global Change Research Program: Washington, DC, USA, 2017; pp. 301–335.
- Boever, C.J.; Dixon, M.D.; Johnson, W.C.; Scott, M.L.; Malloy, T.P., Jr. Effects of a large flood on woody vegetation along the regulated Missouri River, USA. Ecohydrology 2019, 12, e2045. [Google Scholar] [CrossRef] [Green Version]
- Moser, P.; Simon, M.F.; De Medeiros, M.B.; Gontijo, A.B.; Costa, F.R.C. Interaction between extreme weather events and mega-dams increases tree mortality and alters functional status of Amazonian forests. J. Appl. Ecol. 2019, 56, 2641–2651. [Google Scholar] [CrossRef]
- Resende, A.F.; Piedade, M.T.F.; Feitosa, Y.O.; Andrade, V.H.F.; Trumbore, S.E.; Durgante, F.M.; Macedo, M.O.; Schongart, J. Flood-pulse disturbances as a threat for long-living Amazonian trees. New Phytol. 2020, 227, 1790–1803. [Google Scholar] [CrossRef]
- Martínez-Alcántara, B.; Jover, S.; Quinones, A.; Forner-Giner, M.á.; Rodríguez-Gamir, J.; Legaz, F.; Primo-Millo, E.; Iglesias, D.J. Flooding affects uptake and distribution of carbon and nitrogen in citrus seedlings. J. Plant Physiol. 2012, 169, 1150–1157. [Google Scholar] [CrossRef]
- Ferner, E.; Rennenberg, H.; Kreuzwieser, J. Effect of flooding on C metabolism of flood-tolerant (Quercus robur) and non-tolerant (Fagus sylvatica) tree species. Tree Physiol. 2012, 32, 135–145. [Google Scholar] [CrossRef] [Green Version]
- Kreuzwieser, J.; Fürniss, S.; Rennenberg, H. The effects of flooding on the N metabolism of flood tolerant and sensitive tree species. Plant Cell Environ. 2002, 25, 1039–1050. [Google Scholar] [CrossRef]
- Kreuzwieser, J.; Gessler, A. Global climate change and tree nutrition: Influence of water availability. Tree Physiol. 2010, 30, 1221–1234. [Google Scholar] [CrossRef]
- Kreuzwieser, J.; Rennenberg, H. Molecular and physiological responses of trees to waterlogging stress. Plant Cell Environ. 2014, 37, 2245–2259. [Google Scholar] [CrossRef]
- Zhang, W.; Furtado, K.; Wu, P.; Zhou, T.; Chadwick, R.; Marzin, C.; Rostron, J.; Sexton, D. Increasing precipitation variability on daily-to-multiyear time scales in a warmer world. Sci. Adv. 2021, 7, eabf8021. [Google Scholar] [CrossRef] [PubMed]
- Li, M.-H.; Xiao, W.-F.; Wang, S.-G.; Cheng, G.-W.; Cherubini, P.; Cai, X.-H.; Liu, X.-L.; Wang, X.-D.; Zhu, W.-Z. Mobile carbohydrates in Himalayan treeline trees I. Evidence for carbon gain limitation but not for growth limitation. Tree Physiol. 2008, 28, 1287–1296. [Google Scholar] [CrossRef] [PubMed] [Green Version]
- Myhre, G.; Alterskjaer, K.; Stjern, C.W.; Hodnebrog, O.; Marelle, L.; Samset, B.H.; Sillmann, J.; Schaller, N.; Fischer, E.; Schulz, M.; et al. Frequency of extreme precipitation increases extensively with event rareness under global warming. Sci. Rep. 2019, 9, 16063. [Google Scholar] [CrossRef] [Green Version]
- Chai, X.; Feng, X. Effects of soil pH on forest trees. Zhejiang For. Sci. Technol. 1984, 2, 9–12, (In Chinese with English Abstract). [Google Scholar]
- Sauter, M. Root responses to flooding. Curr. Opin. Plant Biol. 2013, 16, 282–286. [Google Scholar] [CrossRef] [PubMed]
- Loreti, E.; van Veen, H.; Perata, P. Plant responses to flooding stress. Curr. Opin. Plant Biol. 2016, 33, 64–71. [Google Scholar] [CrossRef] [Green Version]
- Li, M.H.; Hoch, G.; Korner, C. Spatial variability of mobile carbohydrates within Pinus cembra trees at the alpine treeline. Phyton-Ann. Rei Bot. 2001, 41, 203–213. [Google Scholar]
- Li, M.H.; Hoch, G.; Korner, C. Source/sink removal affects mobile carbohydrates in Pinus cembra at the Swiss treeline. Trees 2002, 16, 331–337. [Google Scholar] [CrossRef] [Green Version]
- King, C.; McEniry, J.; Richardson, M.; O'Kiely, P. Yield and chemical composition of five common grassland species in response to nitrogen fertiliser application and phenological growth stage. Acta Agr. Scand B–Soil Plant Sci. 2012, 62, 644–658. [Google Scholar] [CrossRef]
- Liu, J.-F.; Deng, Y.-P.; Wang, X.-F.; Ni, Y.-Y.; Wang, Q.; Xiao, W.-F.; Lei, J.-P.; Jiang, Z.-P.; Li, M.-H. The concentration of non-structural carbohydrates, N, and P in Quercus variabilis does not decline toward its northernmost distribution range along a 1500 km transect in China. Front. Plant Sci. 2018, 9, 1444. [Google Scholar] [CrossRef] [Green Version]
- Li, M.H.; Cherubini, P.; Dobbertin, M.; Arend, M.; Xiao, W.F.; Rigling, A. Responses of leaf nitrogen and mobile carbohydrates in different Quercus species/provenances to moderate climate changes. Plant Biol. 2013, 15, 177–184. [Google Scholar] [CrossRef] [PubMed]
- Zhu, W.-Z.; Xiang, J.-S.; Wang, S.-G.; Li, M.-H. Resprouting ability and mobile carbohydrate reserves in an oak shrubland decline with increasing elevation on the eastern edge of the Qinghai–Tibet Plateau. For. Ecol. Manag. 2012, 278, 118–126. [Google Scholar] [CrossRef]
- Li, M.-H.; Jiang, Y.; Wang, A.; Li, X.; Zhu, W.; Yan, C.-F.; Du, Z.; Shi, Z.; Lei, J.; Schönbeck, L.; et al. Active summer carbon storage for winter persistence in trees at the cold alpine treeline. Tree Physiol. 2018, 38, 1345–1355. [Google Scholar] [CrossRef] [PubMed]
- Wang, X.; Yu, F.-H.; Jiang, Y.; Li, M.-H. Carbon and nutrient physiology in shrubs at the upper limits: A multispecies study. J. Plant Ecol. 2020, 14, 301–309. [Google Scholar] [CrossRef]
- Liu, J.-F.; Arend, M.; Yang, W.-J.; Schaub, M.; Ni, Y.-Y.; Gessler, A.; Jiang, Z.-P.; Rigling, A.; Li, M.-H. Effects of drought on leaf carbon source and growth of European beech are modulated by soil type. Sci. Rep. 2017, 7, 42462. [Google Scholar] [CrossRef] [Green Version]
- Wang, X.; Xu, Z.; Yan, C.; Luo, W.; Wang, R.; Han, X.; Jiang, Y.; Li, M.-H. Responses and sensitivity of N, P and mobile carbohydrates of dominant species to increased water, N and P availability in semi-arid grasslands in northern China. J. Plant Ecol. 2016, 10, 486–496. [Google Scholar] [CrossRef] [Green Version]
- Wiley, E.; Helliker, B. A re-evaluation of carbon storage in trees lends greater support for carbon limitation to growth. New Phytol. 2012, 195, 285–289. [Google Scholar] [CrossRef]
- Muller, B.; Pantin, F.; Génard, M.; Turc, O.; Freixes, S.; Piques, M.; Gibon, Y. Water deficits uncouple growth from photosynthesis, increase C content, and modify the relationships between C and growth in sink organs. J. Exp. Bot. 2011, 62, 1715–1729. [Google Scholar] [CrossRef] [Green Version]
- Kozlowski, T.T. Carbohydrate sources and sinks in woody plants. Bot. Rev. 1992, 58, 107–222. [Google Scholar] [CrossRef]
- Chapin, F.S.; Schulze, E.-D.; Mooney, H.A. The ecology and economics of storage in plants. Annu. Rev. Ecol. Syst. 1990, 21, 423–447. [Google Scholar] [CrossRef]
- Austin, A.T.; Yahdjian, L.; Stark, J.M.; Belnap, J.; Porporato, A.; Norton, U.; Ravetta, D.A.; Schaeffer, S. Water pulses and biogeochemical cycles in arid and semiarid ecosystems. Oecologia 2004, 141, 221–235. [Google Scholar] [CrossRef] [PubMed]
- Dijkstra, F.A.; Augustine, D.J.; Brewer, P.; von Fischer, J.C. Nitrogen cycling and water pulses in semiarid grasslands: Are microbial and plant processes temporally asynchronous? Oecologia 2012, 170, 799–808. [Google Scholar] [CrossRef] [PubMed]
- Christianson, J.A.; Llewellyn, D.J.; Dennis, E.S.; Wilson, I.W. Comparisons of early transcriptome responses to low-oxygen environments in three dicotyledonous plant species. Plant Signal. Behav. 2010, 5, 1006–1009. [Google Scholar] [CrossRef] [PubMed] [Green Version]
- Kreuzwieser, J.; Hauberg, J.; Howell, K.A.; Carroll, A.; Rennenberg, H.; Millar, A.H.; Whelan, J. Differential response of gray poplar leaves and roots underpins stress adaptation during hypoxia. Plant physiol. 2009, 149, 461–473. [Google Scholar] [CrossRef] [PubMed] [Green Version]
- Turner, B.L.; Haygarth, P.M. Phosphorus solubilization in rewetted soils. Nature 2001, 411, 258. [Google Scholar] [CrossRef] [PubMed] [Green Version]
- Brödlin, D.; Kaiser, K.; Kessler, A.; Hagedorn, F. Drying and rewetting foster phosphorus depletion of forest soils. Soil Biol. Biochem. 2018, 128, 22–34. [Google Scholar] [CrossRef]
- Wang, Y.; Jensen, C.R.; Liu, F. Nutritional responses to soil drying and rewetting cycles under partial root-zone drying irrigation. Agric. Water Manag. 2017, 179, 254–259. [Google Scholar] [CrossRef]
- Augusto, L.; Achat, D.L.; Jonard, M.; Vidal, D.; Ringeval, B. Soil parent material—A major driver of plant nutrient limitations in terrestrial ecosystems. Glob. Chang. Biol. 2017, 23, 3808–3824. [Google Scholar] [CrossRef]
- Patrick, W.; Mahapatra, I. Transformation and availability to rice of nitrogen and phosphorus in waterlogged soils. In Advances in Agronomy; Elsevier: Amsterdam, The Netherlands, 1968; pp. 323–359. [Google Scholar] [CrossRef]
Figure 1.
Soil water content from day 1 to day 140 of the experiment. Plotted are means ± SE.

Figure 2.
Effects of the watering regime (regular vs. pulsed) and water amount (300, 500, and 700 mm) on soil pH (A), soil organic carbon (SOC) (B), the ratio of SOC to soil N (C), soil total N (D), soil total P (E) and soil N to soil P ratio (F). p values of two-way ANOVAS are given. A and R represent water amount and watering regime, respectively. Plotted are means ± SE.

Figure 3.
Effects of the watering regime (regular vs. pulsed) and water amount (300, 500, and 700 mm) on needle biomass (A), stem biomass (B), root biomass (C), total biomass (D), root to shoot ratio (E) and height (F) of P. massoniana saplings. p values of two-way ANOVAS are given. A and R represent water amount and watering regime, respectively. Plotted are means ± SE.

Figure 4.
Effects of the watering regime (regular vs. pulsed) and water amount (300, 500, and 700 mm) on concentrations of soluble sugars (A–C), starch (D–F), NSCs (G–I), and soluble sugar to starch ratio (J–L) in different tissues of P. massoniana saplings. p values of two-way ANOVAS are given. A and R represent water amount and watering regime, respectively. Plotted are means ± SE.

Figure 5.
Effects of the watering regime (regular vs. pulsed) and water amount (300, 500, and 700 mm) on pool size of soluble sugars (A–C), starch (D–F), and NSCs (G–I) in different tissues of P. massoniana saplings. p values of two-way ANOVAS are given. A and R represent water amount and watering regime, respectively. Plotted are means ± SE.

Figure 6.
Effects of the watering regime (regular vs. pulsed) and water amount (300, 500, and 700 mm) on concentrations of N (A–C), P (D–F), and N to P ratio (G–I) in different tissues of P. massoniana saplings. p values of two-way ANOVAS are given. A and R represent water amount and watering regime, respectively. Plotted are means ± SE.

Figure 7.
Effects of the watering regime (regular vs. pulsed) and water amount (300, 500, and 700 mm) on pool size of N (A–C) and P (D–F) in different tissues of P. massoniana saplings. p values of two-way ANOVAS are given. A and R represent water amount and watering regime, respectively. Plotted are means ± SE.

Publisher’s Note: MDPI stays neutral with regard to jurisdictional claims in published maps and institutional affiliations. |
© 2022 by the authors. Licensee MDPI, Basel, Switzerland. This article is an open access article distributed under the terms and conditions of the Creative Commons Attribution (CC BY) license (https://creativecommons.org/licenses/by/4.0/).
Share and Cite
MDPI and ACS Style
Wang, X.; Tao, Y.-M.; Fang, N.-N.; Zheng, W.-L.; Yu, F.-H.; Li, M.-H. Impact of Growing Season Precipitation Regime on the Performance of Masson Pine Saplings. Forests 2022, 13, 627. https://0-doi-org.brum.beds.ac.uk/10.3390/f13040627
AMA Style
Wang X, Tao Y-M, Fang N-N, Zheng W-L, Yu F-H, Li M-H. Impact of Growing Season Precipitation Regime on the Performance of Masson Pine Saplings. Forests. 2022; 13(4):627. https://0-doi-org.brum.beds.ac.uk/10.3390/f13040627
Chicago/Turabian StyleWang, Xue, Yi-Min Tao, Ni-Na Fang, Wei-Long Zheng, Fei-Hai Yu, and Mai-He Li. 2022. "Impact of Growing Season Precipitation Regime on the Performance of Masson Pine Saplings" Forests 13, no. 4: 627. https://0-doi-org.brum.beds.ac.uk/10.3390/f13040627
Note that from the first issue of 2016, this journal uses article numbers instead of page numbers. See further details here.