
Tree Water Status Affects Tree Branch Position
by
 , , , and
Samuli Junttila
1,* ,
,
Mariana Campos
2,
Teemu Hölttä
3,
Lauri Lindfors
3,
Aimad El Issaoui
2,4,
Mikko Vastaranta
1 ,
,
Hannu Hyyppä
4 and
Eetu Puttonen
2 1
School of Forest Sciences, University of Eastern Finland, 80101 Joensuu, Finland
2
Department of Remote Sensing and Photogrammetry, Finnish Geospatial Research Institute, National Land Survey of Finland, 02431 Masala, Finland
3
Department of Forest Sciences, University of Helsinki, 00014 Helsinki, Finland
4
Institute of Measuring and Modeling for the Built Environment, Aalto University, 00076 Aalto, Finland
*
Author to whom correspondence should be addressed.
Forests 2022, 13(5), 728; https://0-doi-org.brum.beds.ac.uk/10.3390/f13050728
Submission received: 16 March 2022
/
Revised: 29 April 2022
/
Accepted: 4 May 2022
/
Published: 6 May 2022
(This article belongs to the Special Issue Ecophysiology of Forest Trees and Responses to Environmental Changes)
Abstract
:Physiological processes cause movements of tree stems and branches that occur in a circadian rhythm and over longer time periods, but there is a lack of quantitative understanding of the cause-and-effect relationships. We investigated the movement of tree branches in a long-term drought experiment and at a circadian time scale using time-series of terrestrial laser scanning measurements coupled with measurements of environmental drivers and tree water status. Our results showed that movement of branches was largely explained by leaf water status measured as leaf water potential in a controlled environment for both measured trees (R2 = 0.86 and R2 = 0.75). Our hypothesis is that changes in leaf and branch water status would cause branch movements was further supported by strong relationship between vapor pressure deficit and overnight branch movement (R2 = [0.57–0.74]). Due to lower atmospheric water demand during the nighttime, tree branches settle down as the amount of water in leaves increases. The results indicate that the quantified movement of tree branches could help us to further monitor and understand the water relations of tree communities.
1. Introduction
Trees have seemed to be relatively static objects from the human perspective, but some trees have shown diurnal movements, such as the so-called “Praying Palm of Faridpore”, that was regarded as a “miracle” in Bengal in the early 20th century [1]. This date palm tree (Phoenix sylvestris Roxb.) leaned at a large vertical angle and the angle varied diurnally causing a movement of over a meter at the plant’s tip due to thermonasty, according to plant biologist Dr. Bose [1]. Despite these early findings, until nowadays, there has been little research on the diurnal movements of tree branches that is not related to wind due to the difficulty in measuring branch movement [2,3,4,5].
Recent advancements in laser remote sensing technologies have enabled millimeter-level accuracy in obtaining the 3D structure of plants with light detection and ranging (LiDAR) methods allowing forest structure analyses that have not been achievable by any other manually techniques [6,7,8,9,10]. After a century of research recent findings have shown, with the aid of terrestrial laser scanning (TLS) technology that trees move their branches in a diurnal pattern, in which tree branches settle down during the nighttime [3,4,5]. Species and tree individuals have shown different patterns in their overnight movements, but there is limited knowledge on the driving forces behind diurnal branch movement [5]. Recent findings, however, have indicated a link between atmospheric water demand and branch movement for a woody shrub species [2].
Trees and forests transport a major part of the water that goes to the atmosphere from the soil through their canopies using a part of it for their own processes, whereas most of it is evaporated through stomata as they take carbon in as exchange [11]. Understanding the water relations of individual trees is crucial for understanding tree responses to changes in environmental conditions, such as drought periods, and for modeling the movement of water within the biosphere due to the major contribution of forests to the global terrestrial water cycle.
The driving force for water movement through the soil-plant-atmosphere continuum is the transpiration of water at leaves [12,13,14]. The transpiration decreases leaf water potential and water content creating a negative pressure which draws more water from the branches, the stem, and the roots through the xylem transport tissue. This results in decreasing water content in the branches and the stem, which can be observed as a small decrease in the diameter of the xylem, which can be measured using dendrometers [15,16,17,18]. The change in stem diameter has been shown to be in high agreement with xylem water potential, i.e., water pressure in the xylem, with a coefficient of determination of as high as 0.96 [19]. The evaporation rate of water is proportional to air vapor pressure deficit (VPD) for a given stomatal conductance [20]. The transpiration decreases water content in the branches, although with a time lag due to hydraulic resistance and capacitance of the leaf and xylem tissues. Leaf water content has been shown to have a linear relationship with VPD with several species [21]. In addition to VPD, changes in soil water content can also result in changes in the water content of both leaves and the stem [22]. When transpiration starts to decrease in the afternoon, the water content of leaves, branches and xylem tissues also start to increase again to replenish their water storages before the sun rises the following day. Stomata remain partially open also during night-time allowing the movement of water between the leaf and the air also during the night [23].
Here, we theorize that variation in leaf and branch water content could explain the diurnal branch movement that has been recently observed [3,4]. The daily fluctuation of leaf water content imposes a large fluctuation in weight load on the branches when converted to shoot units. Because the weight load of each branch varies, also the branching angle and branch tip position fluctuates during the day. The heaviest load during a given day (resulting in the lowest branch position) would then occur when stem and leaf water content is at its highest, which is during the early morning hours before sunrise when VPD is typically at its lowest [17,18,21]. We therefore hypothesize that:
- Changes in leaf water content and tree water potential are causing systematic branch movement. Decrease in water content is related to an upward branch movement.
- Overnight movement of tree branches can be linked to changes in VPD, which drives the changes in leaf water content.
We tested our hypotheses by utilizing a time-series of TLS measurements to acquire accurate 3D snapshots of the environment that can capture the movement of tree branches between the measurements. To separate external drivers (such as VPD) of branch movement from the internal drivers (water content), experiments were conducted both in (1) controlled laboratory conditions where VPD and light were kept constant, whereas soil and tree water content gradually decreased over 39 days and (2) outside where light and VPD varied naturally overnight, but trees did not experience drought stress. The long-term branch movement measurements in a laboratory were coupled with measurements of leaf water potential (LWP) and relative water content (RWC).
This study contributes to the understanding of the diurnal rhythm and different branch movement patterns of trees. Improved understanding of branch movements could help us to explore further various ecophysiological processes, including tree water relations, and to enable new methods for monitoring these processes within and between tree communities.
2. Materials and Methods
2.1. Laboratory Experiment
A drought experiment with controlled reduction in water availability was conducted with two seven-year-old 1.5 m tall potted Scots pine (Pinus sylvestris L.) at ~21 °C in a laboratory at the Viikki campus of University of Helsinki between December 2019 and January 2020. The saplings were kept outside of greenhouses until they were taken indoors for the experiments. Thereafter, the saplings were well-watered for 7 days, after which watering was stopped and the drought treatment started. A light source (High Pressure Sodium) was fixed on top of each sapling and lights were configured to 12 h/12 h light/darkness illumination cycle. Light intensity was tested with a PAR sensor (Li-190 Quantum sensor, LI-COR Inc., Lincoln, NE, USA) resulting in ~1200 μmol m−2 s−1 at the top and ~300 μmol m−2 s−1 at the bottom of canopies of the seedlings.
The saplings were monitored with TLS measurements at 16-time intervals during the monitoring period between 4 December and 13 January. A single TLS measurement was conducted from a 1.5 m distance from the saplings using a Trimble TX5 scanner (Trimble Inc., Sunnyvale, CA, USA), which utilizes a 905 nm wavelength and phase-shifting measurement technique to measure distance to the target. Five pieces of white 99 mm diameter spheres were used as reference targets for registering all of the 16 multitemporal point clouds spatially together.
Measurements of water status were carried out 16 times, right after the respective TLS measurements by taking needle samples. The needle samples were used to measure leaf water potential (LWP) and relative water content (RWC). A set of five needles was taken from the sapling at each time point for both measurements. The needles were selected randomly from the current year needles and from the upper half of the canopy. LWP was measured from the five needles using the Scholander pressure chamber (PMS-1000; PMS Instruments, Albany, OR, USA) with the help of binoculars. A mean value was calculated from the five LWP measurements. The five needles, which were used for measurement of RWC, were cut in half and weighed for fresh mass (FM). Then, the pieces were tied together with tin string and merged into milliQ water. After 24 h in 5 °C water, the turgid mass (TM) was measured. Then, the samples were placed into the oven to 60 °C and their dry mass (DM) was measured 48 h later. RWC was then calculated using Equation (1).
RWC(%) = [(FM − DM)/(TM − DM)] × 100.
2.2. Field Experiment
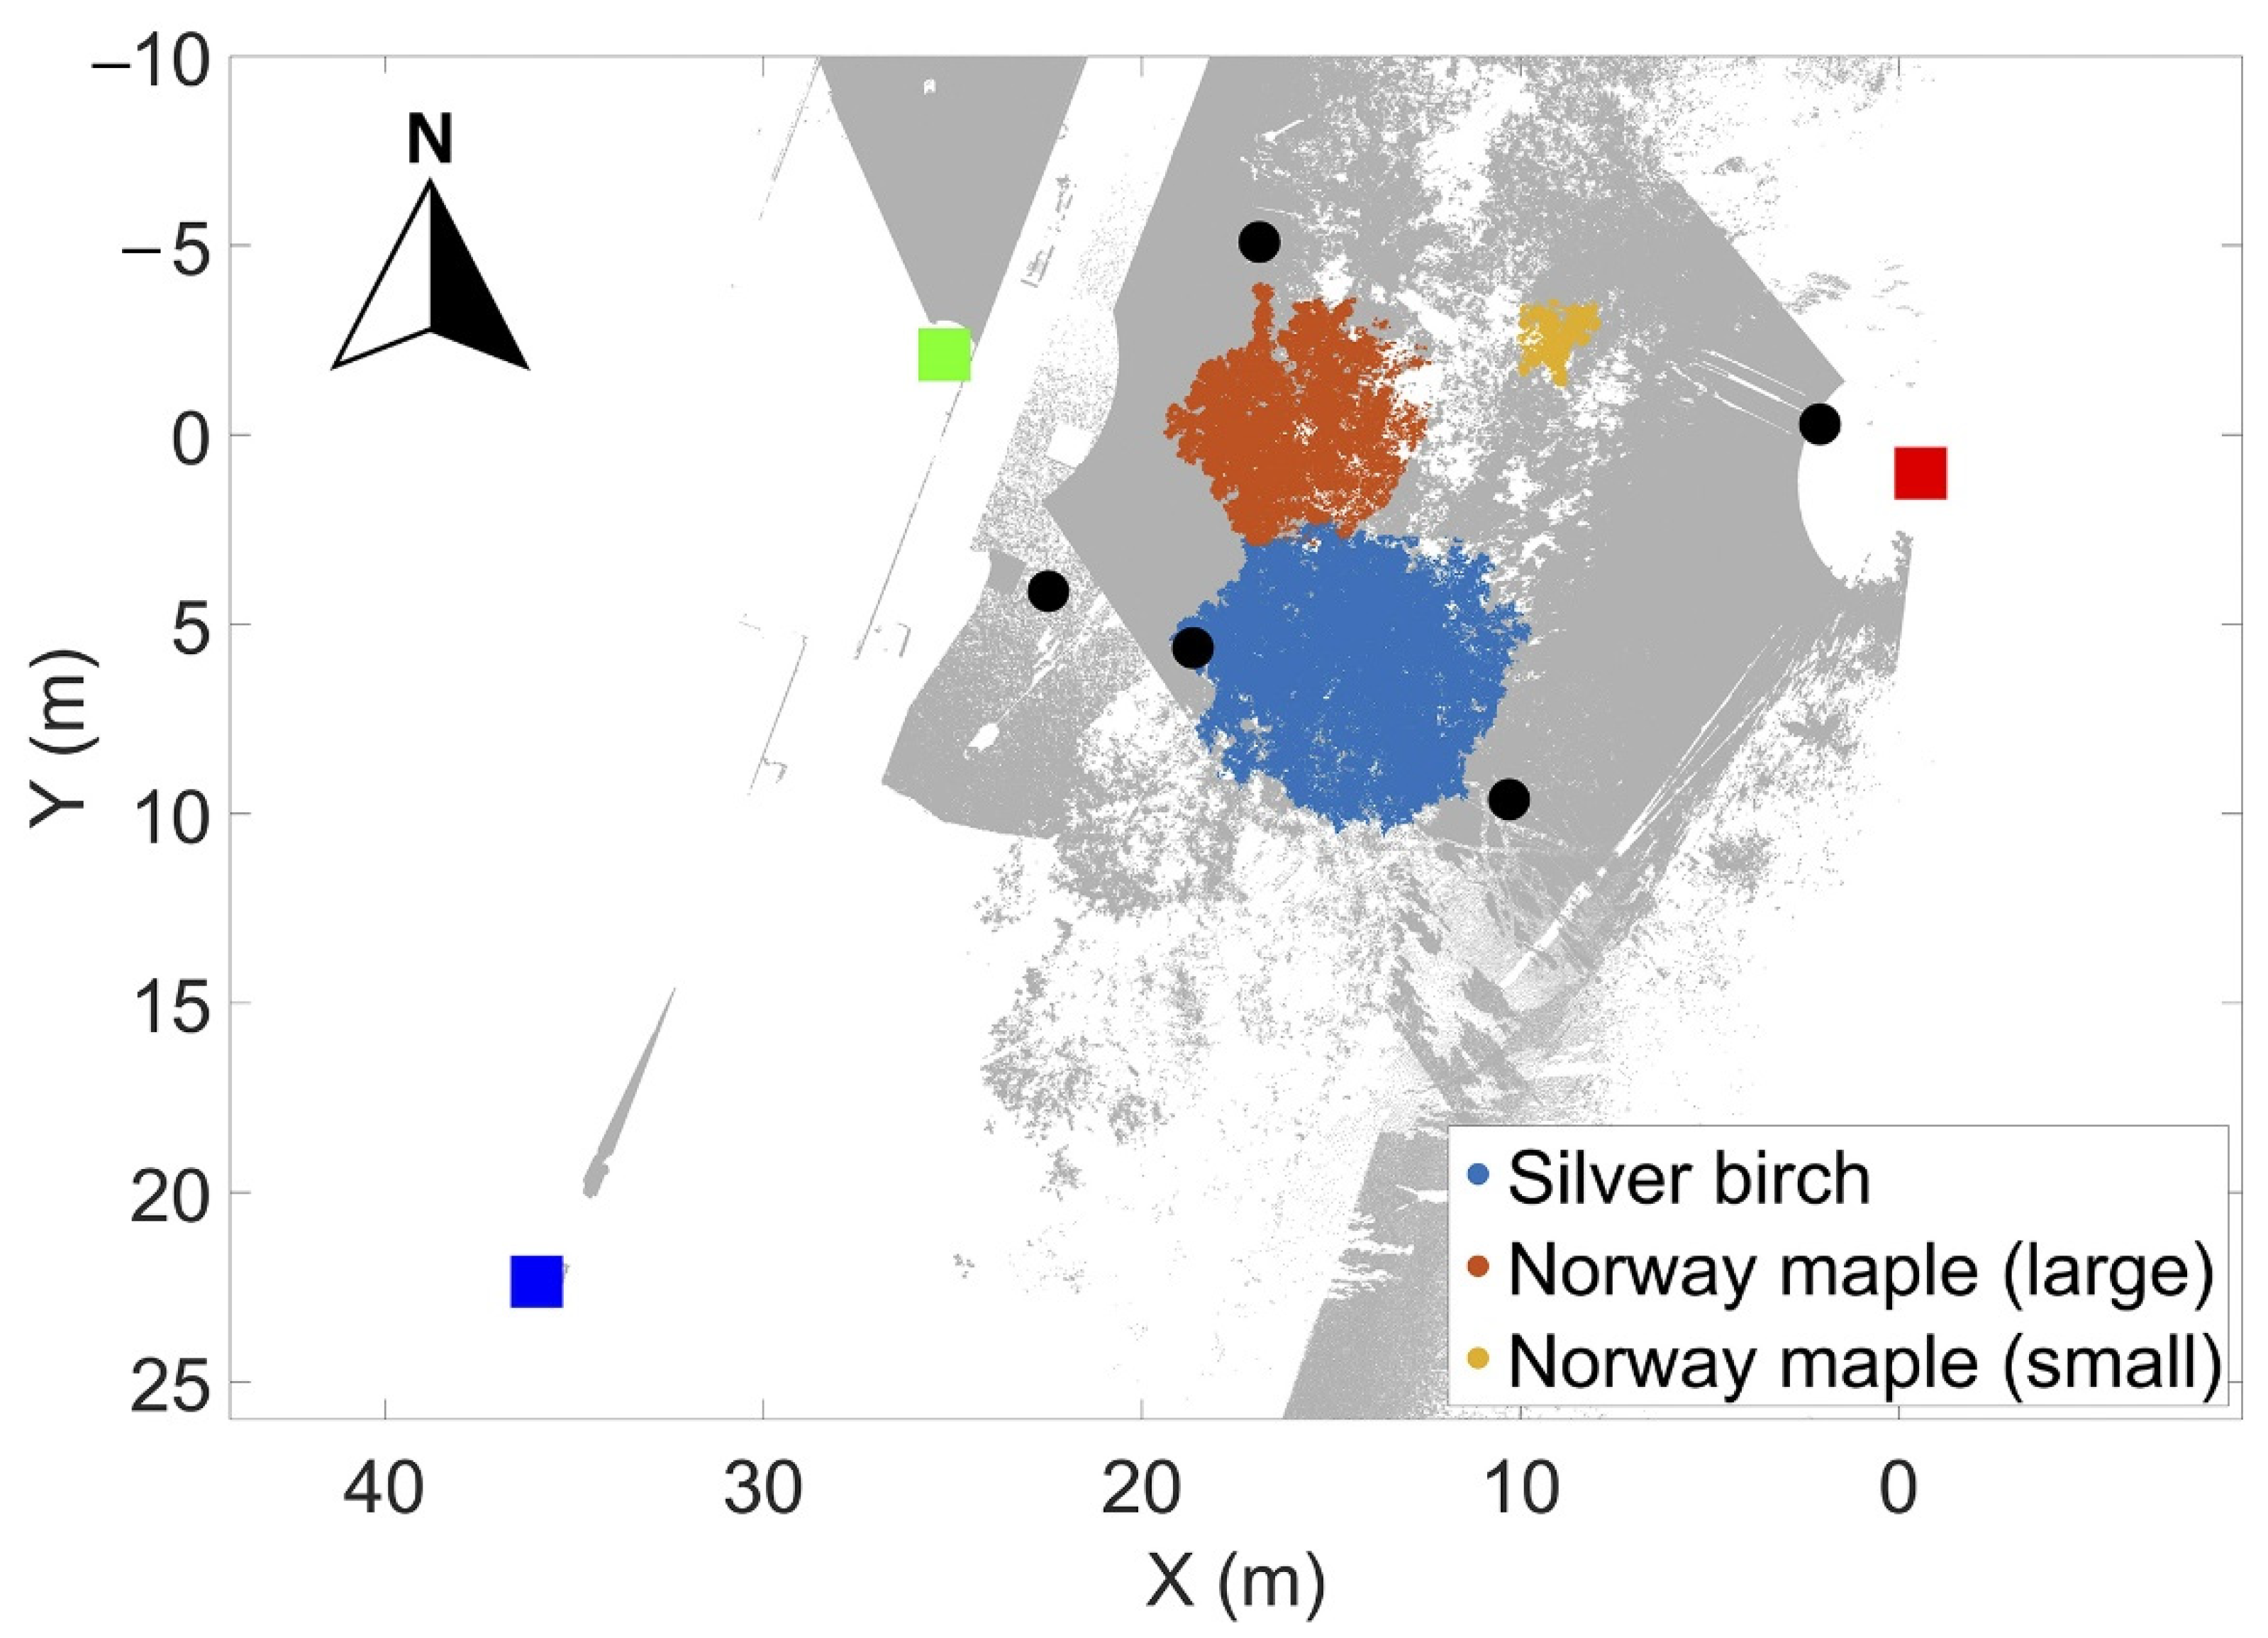
To test how tree branch movement can be explained by VPD, we collected a TLS time-series in Masala, Southern Finland (Kirkkonummi, N. 60°9.7′, W. 24°32.8′). The experiment focused on quantifying overnight branch movement coupled with measurements of environmental conditions that can be linked to tree physiological processes. The experiment site was on the edge of a semi-eutrophic mixed boreal forest stand, consisting of Norway spruce (Picea abies H. Karst.), silver birch, Norway maple, European oak (Quercus robur L.) and small-leaved lime (Tilia cordata Mill.). The overnight measurements were taken on 24 and 25 August 2016. Both measurements focused on two Norway maples and a silver birch (Table 1). The rationale for selecting deciduous tree species for the overnight measurements was the larger amount of leaf area near the tip of the branches, which based on our hypothesis would increase overnight branch movement and facilitate the detection of the branch movement. Figure 1 shows the overview of the measurement site and the scanner locations.
The overnight measurements in August were conducted between 21:00 and 10:00. The measurements were carried out using three terrestrial laser scanners mounted on tripods. The positions of the laser scanners were selected based on the best possible visibility to the tree crowns for the measurements. FARO Focus 3D X 330 (FARO Inc., Lake Mary, FL, USA) was located on an open road approximately 20 m from the trees. The other two scanners were located on the roof of a nearby building (FARO Focus 3D S 120—southern, Trimble TX5—northern) approximately 35 and 20 m from the trees, respectively. The height difference between the scanner on the road and those on the roofs was approximately 10 m. The trees were monitored for 9 h in total, in which 130 separate scans were collected. Altogether 123 of 130 scans, representing 41 data acquisition times, were selected based on subjective estimation of wind speed (not detectable or very small airflows). Five spheres of 0.099 m radius were used as reference targets in the measurements facilitating the co-registration of the TLS scans. The ranging accuracy of the laser scanners was ±2 mm.
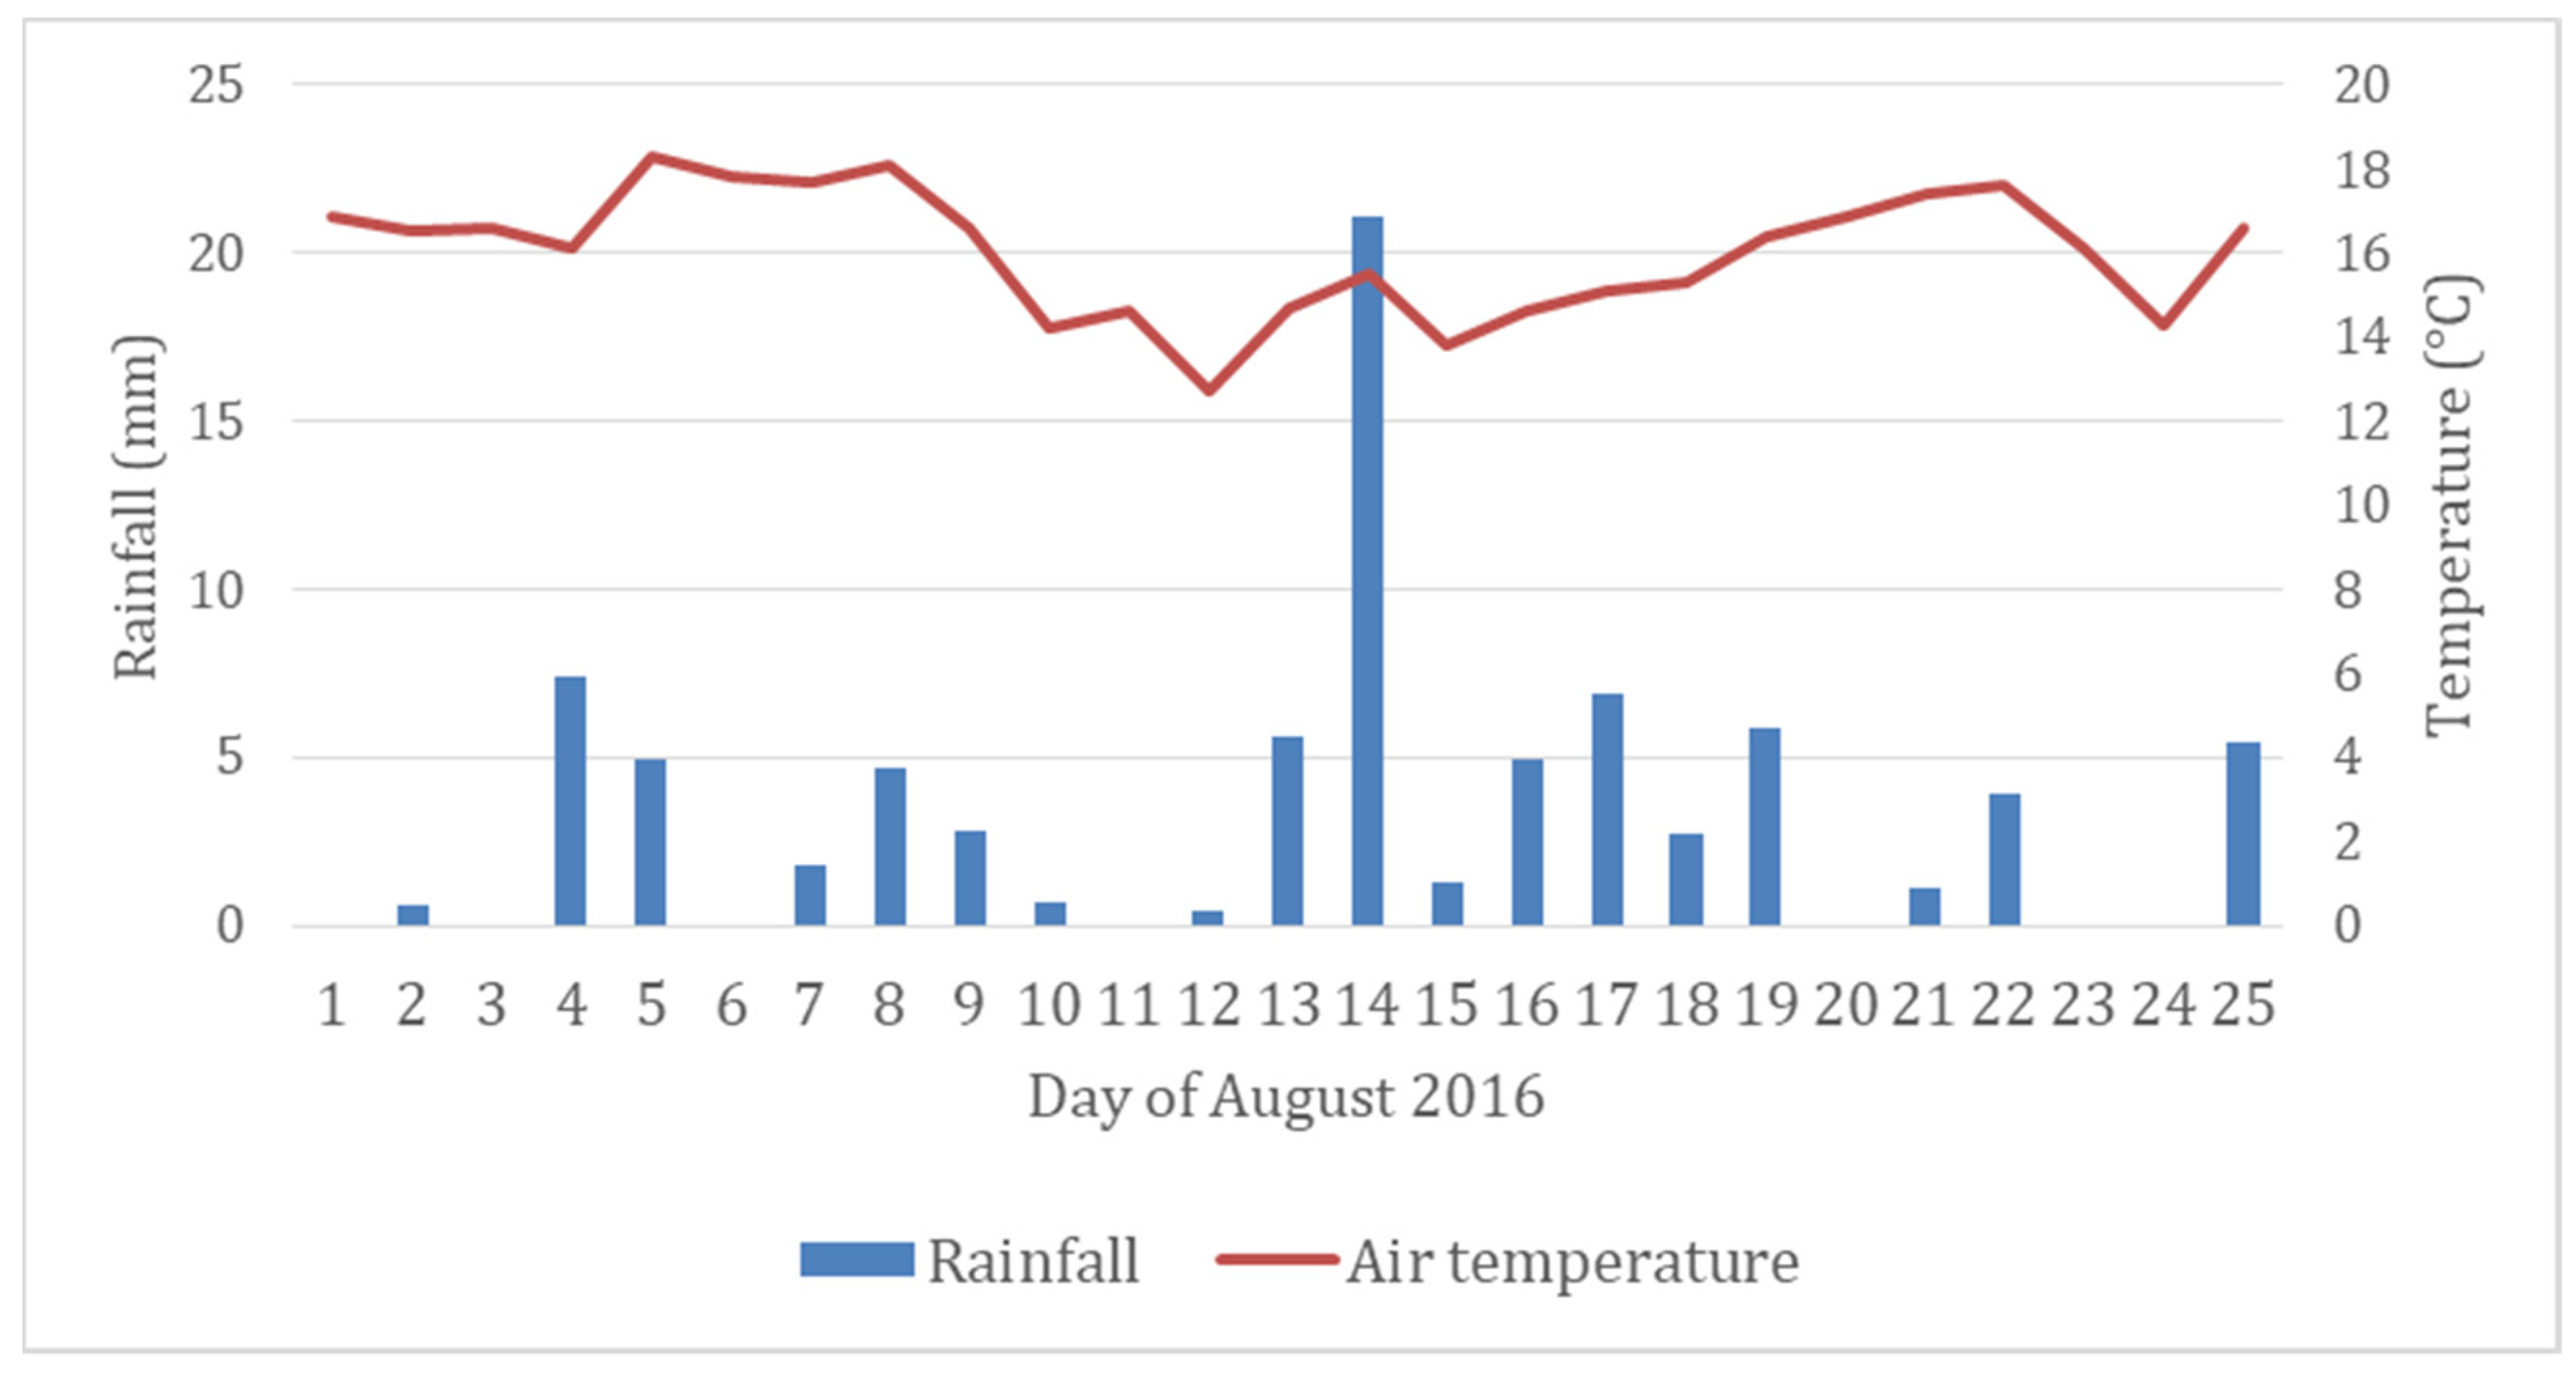
Figure 2 shows the daily rainfall and mean temperature in the test area during August 2016. There was 54 mm of rainfall in total two weeks before the measurements were conducted. The average air temperature during that time was 15.4 °C. Thus, there was no significant drought during the field measurements.
2.3. TLS Data Processing
The point clouds from each measurement location were co-registered to a common local coordination system using the external sphere targets as reference points. The registration was performed in FARO Scene point cloud processing software (FARO Inc., Lake Mary, FL, USA). The spheres were located automatically in the point cloud and a sphere fitting was performed. After all spheres were located, their coordinates were registered with the sphere coordinates scanned from the first scan file. Point cloud data collected with the Leica scanner were pre-processed with Leica Cyclone (v. 7.3), following the same described procedure for point cloud registration. Each tree was then manually delineated from the point clouds for further processing.
To monitor the crown dynamics, each delineated tree point cloud was segmented using a similar approach as presented in [24]. The segmentation approach begins by doing a Euclidean clustering for the initial point cloud with predefined minimum cluster size and point number. After this initial segmentation, the subsequently measured point clouds are labeled based on the initial segmentation. Individual segment movement over time is monitored by following the movement of their centroid. The segmentation framework works under the assumption that segment movement between the consequent scans is smaller than the monitored cluster size.
2.4. Quantifying Branch Movement
For the laboratory experiment, six and five branches from seedlings 1 and 2, respectively, were selected for further investigation. The movement of branches was quantified as the Euclidean distance from the first measurement in all the experiments. Two additional features were measured for the pine seedlings: branch length and branch angle in relation to the stem. These features were measured manually from the point clouds to explore their effect on branch movement.
For the field experiment, the timing of the movement maximums was determined from consensus of cluster centers located on the tips of branches. Stable branch clusters were determined with following thresholds: (i) They had to be present throughout the experiment window, (ii) the relative standard deviation of their point number had to be less than 30% compared with their initial size, and (iii) their maximum movement within the timeframe had to be more than 3.0 cm. The last threshold filtered out clusters located on the tree stems and large branches. The number of observed branches were 14, 13 and 17 for silver birch, small Norway maple and moderate-sized Norway maple, respectively.
For all trees, one to two clusters located on the stem were selected as fixed references to confirm the point cloud clustering stability. In all cases, the stem cluster centers showed less than one-centimeter displacement from their initial position thus confirming the clustering stability.
2.5. Statistical Analysis
Multiple regression modelling was used to investigate how leaf water status (RWC and LWP), branch length and branch angle explain variations in branch movement using the observations collected at laboratory experiment.
Linear regression modelling was used to determine the relationship between leaf water status and branch movement for the laboratory experiment as well as for the overnight branch movement and VPD. Regression models were built between the movement of each branch, which was our response variable, and RWC, LWP and VPD, which were our predicting variables. Coefficient of determination (R2) and root-mean-square-error (RMSE) were used to examine the goodness of fit of the developed regression models. All the analysis were conducted within the R software package [25].
3. Results
3.1. Variation in Leaf Water Content Causes Branch Movement in Controlled Environments
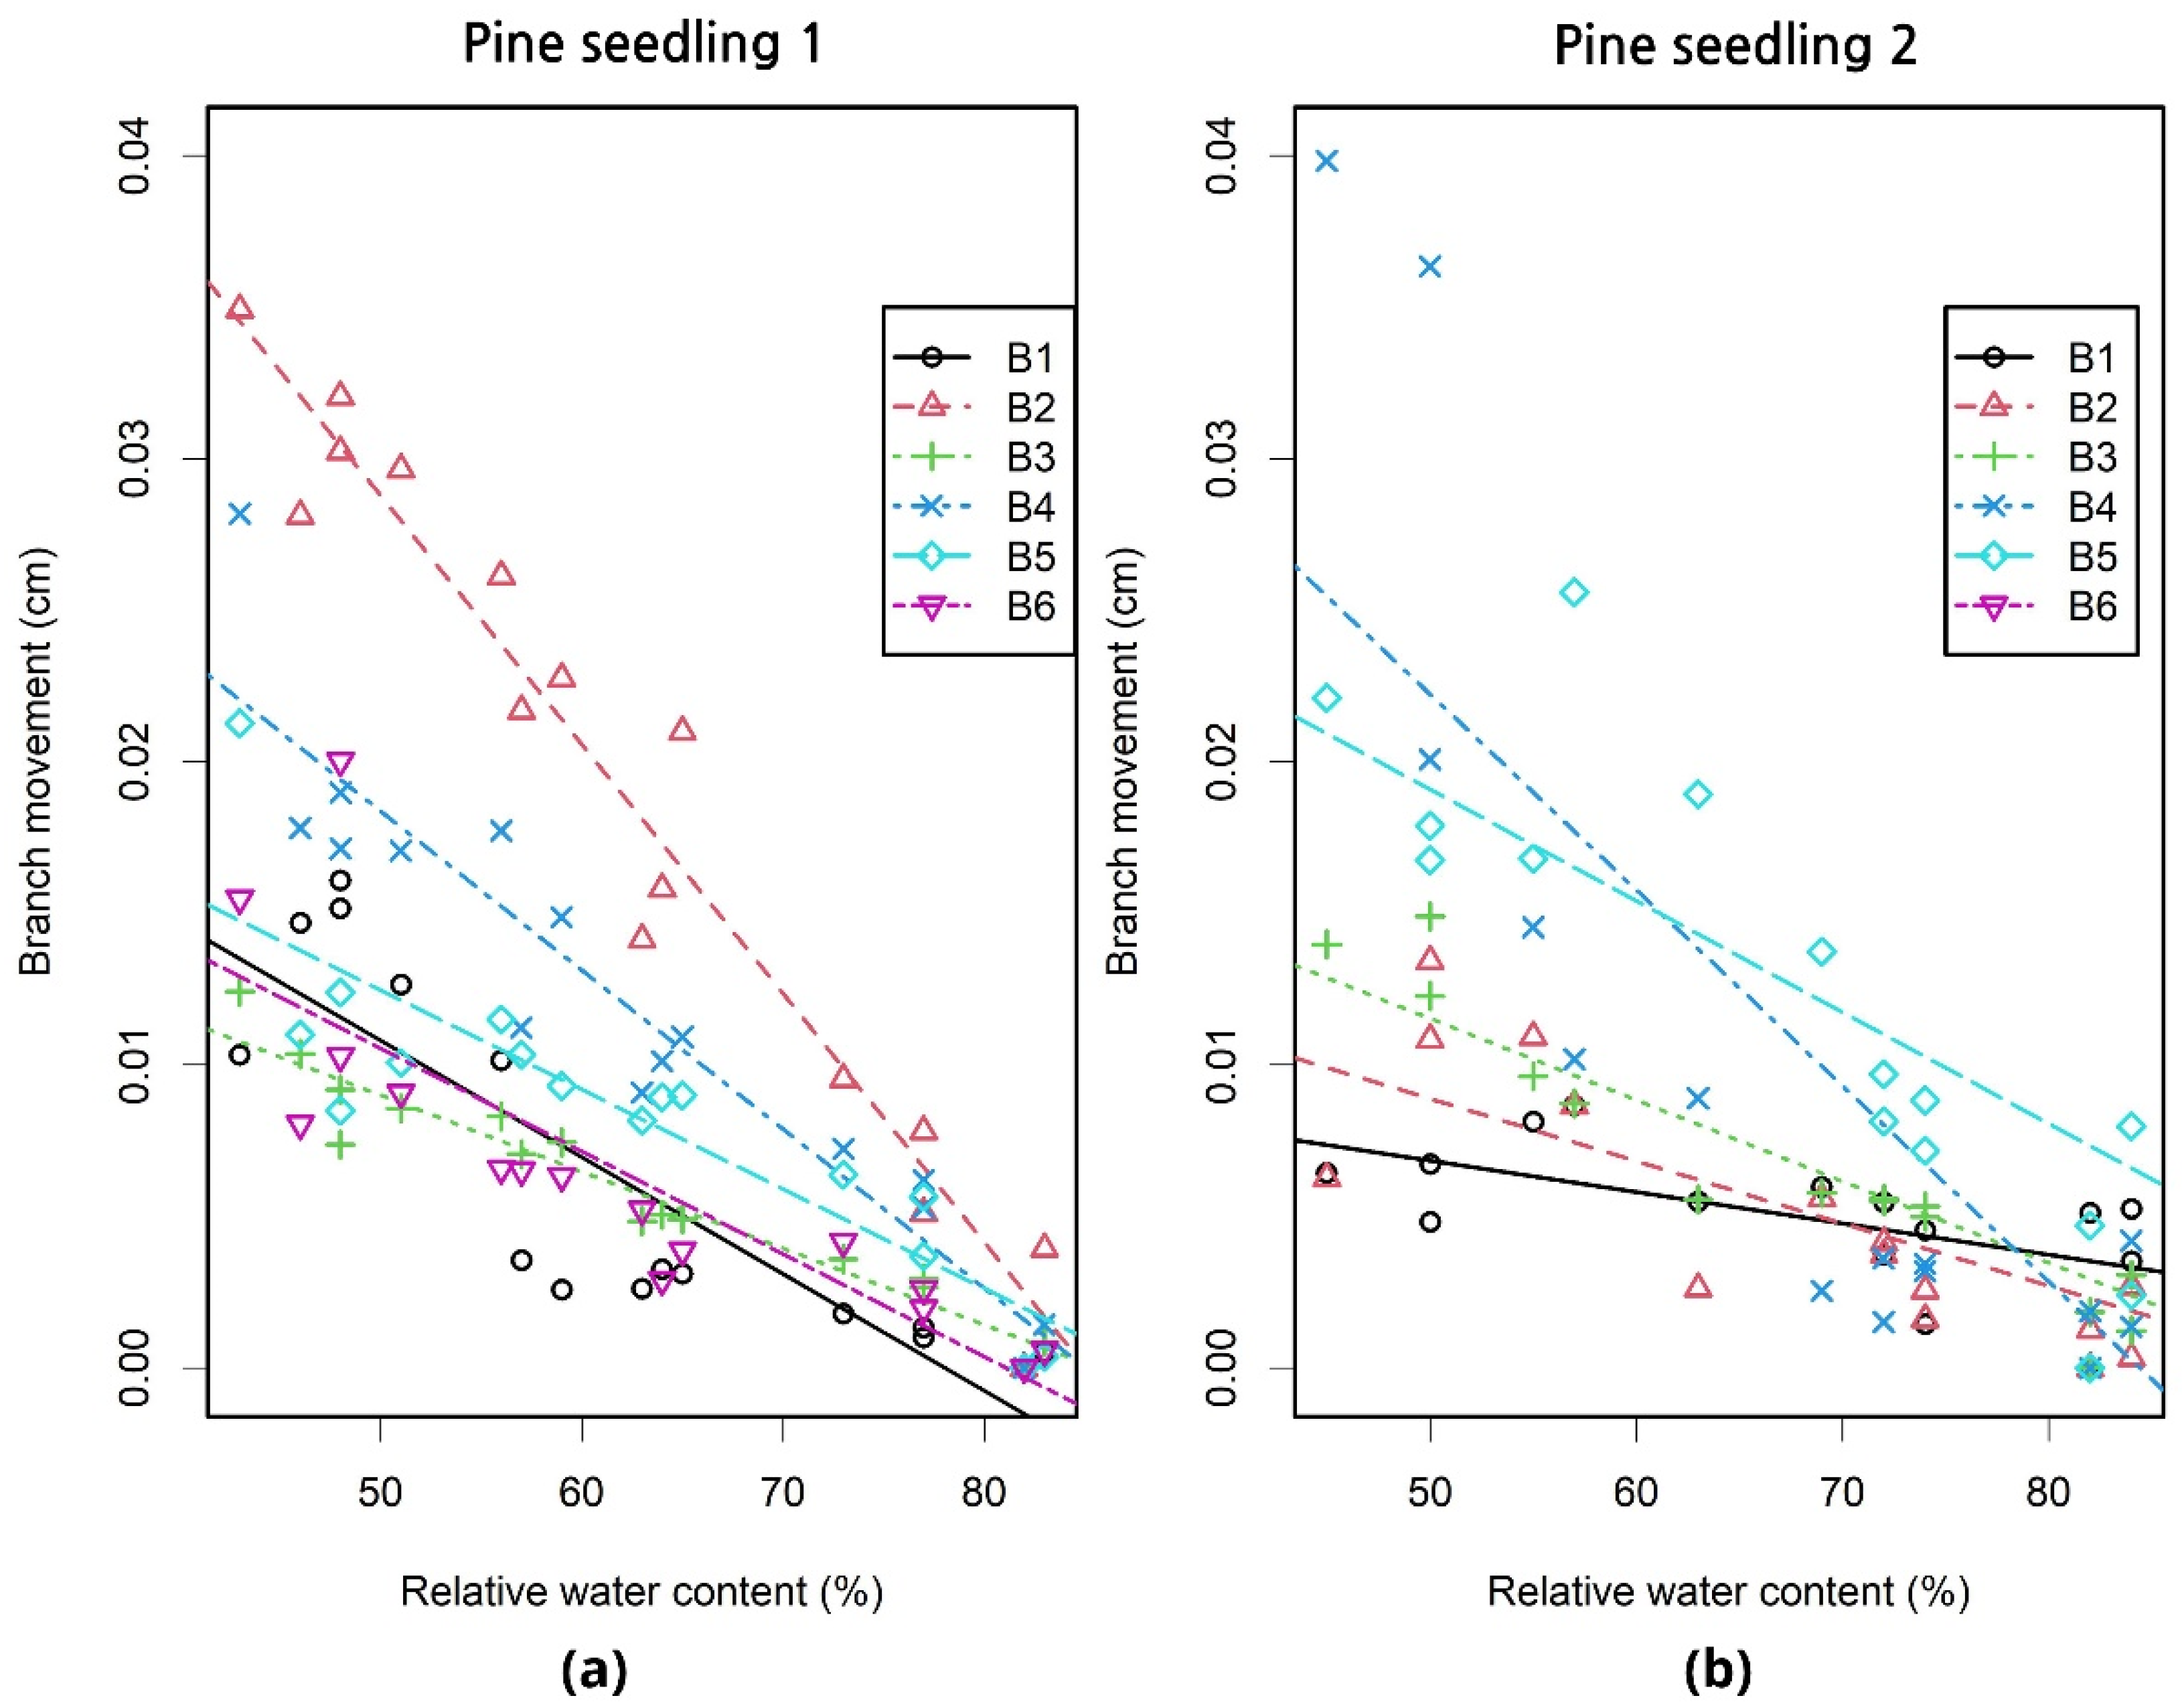
We tested how changes in leaf water content affect branch movement with Scots pine (Pinus sylvestris L.) seedlings in a controlled laboratory environment with minimum variation in environmental variables other than soil water availability. We found strong relationships between LWP and branch position (n = 15) for both trees (R2 = 0.86 and 0.75) during the monitoring period of 38 days (Table 2). Distinct upward branch movement occurred as the LWP decreased. A similar relationship was found between RWC and branch movement for the trees (R2 = 0.83 and 0.64). The strength of the relationships was dependent on the measured branch, i.e., different branches showed variation in their movement during the monitoring period. Additionally, the slope of the relationship differed between branches (Figure 3).
We used multiple regression to determine the relative effects of tree water status (defined using LWP and RWC), branch length and branch angle on observed branch movement. We observed that RWC explained significant amount of the variation (49%) in branch movement across all measured branches (Table 3). The inclusion of branch angle as an explanatory variable increased the proportion of explained variation to 55% and further the inclusion of branch length improved the model performance to explain 63% of the variation in branch position.
3.2. Overnight Branch Movement Is Controlled by Atmospheric Water Demand
The measured tree branches showed significant movement overnight that varied between 2 and 16 cm. The largest movements were observed in the moderate-sized Norway maple and silver birch. All three trees showed considerable variation in the amplitude of overnight branch movement between branches.
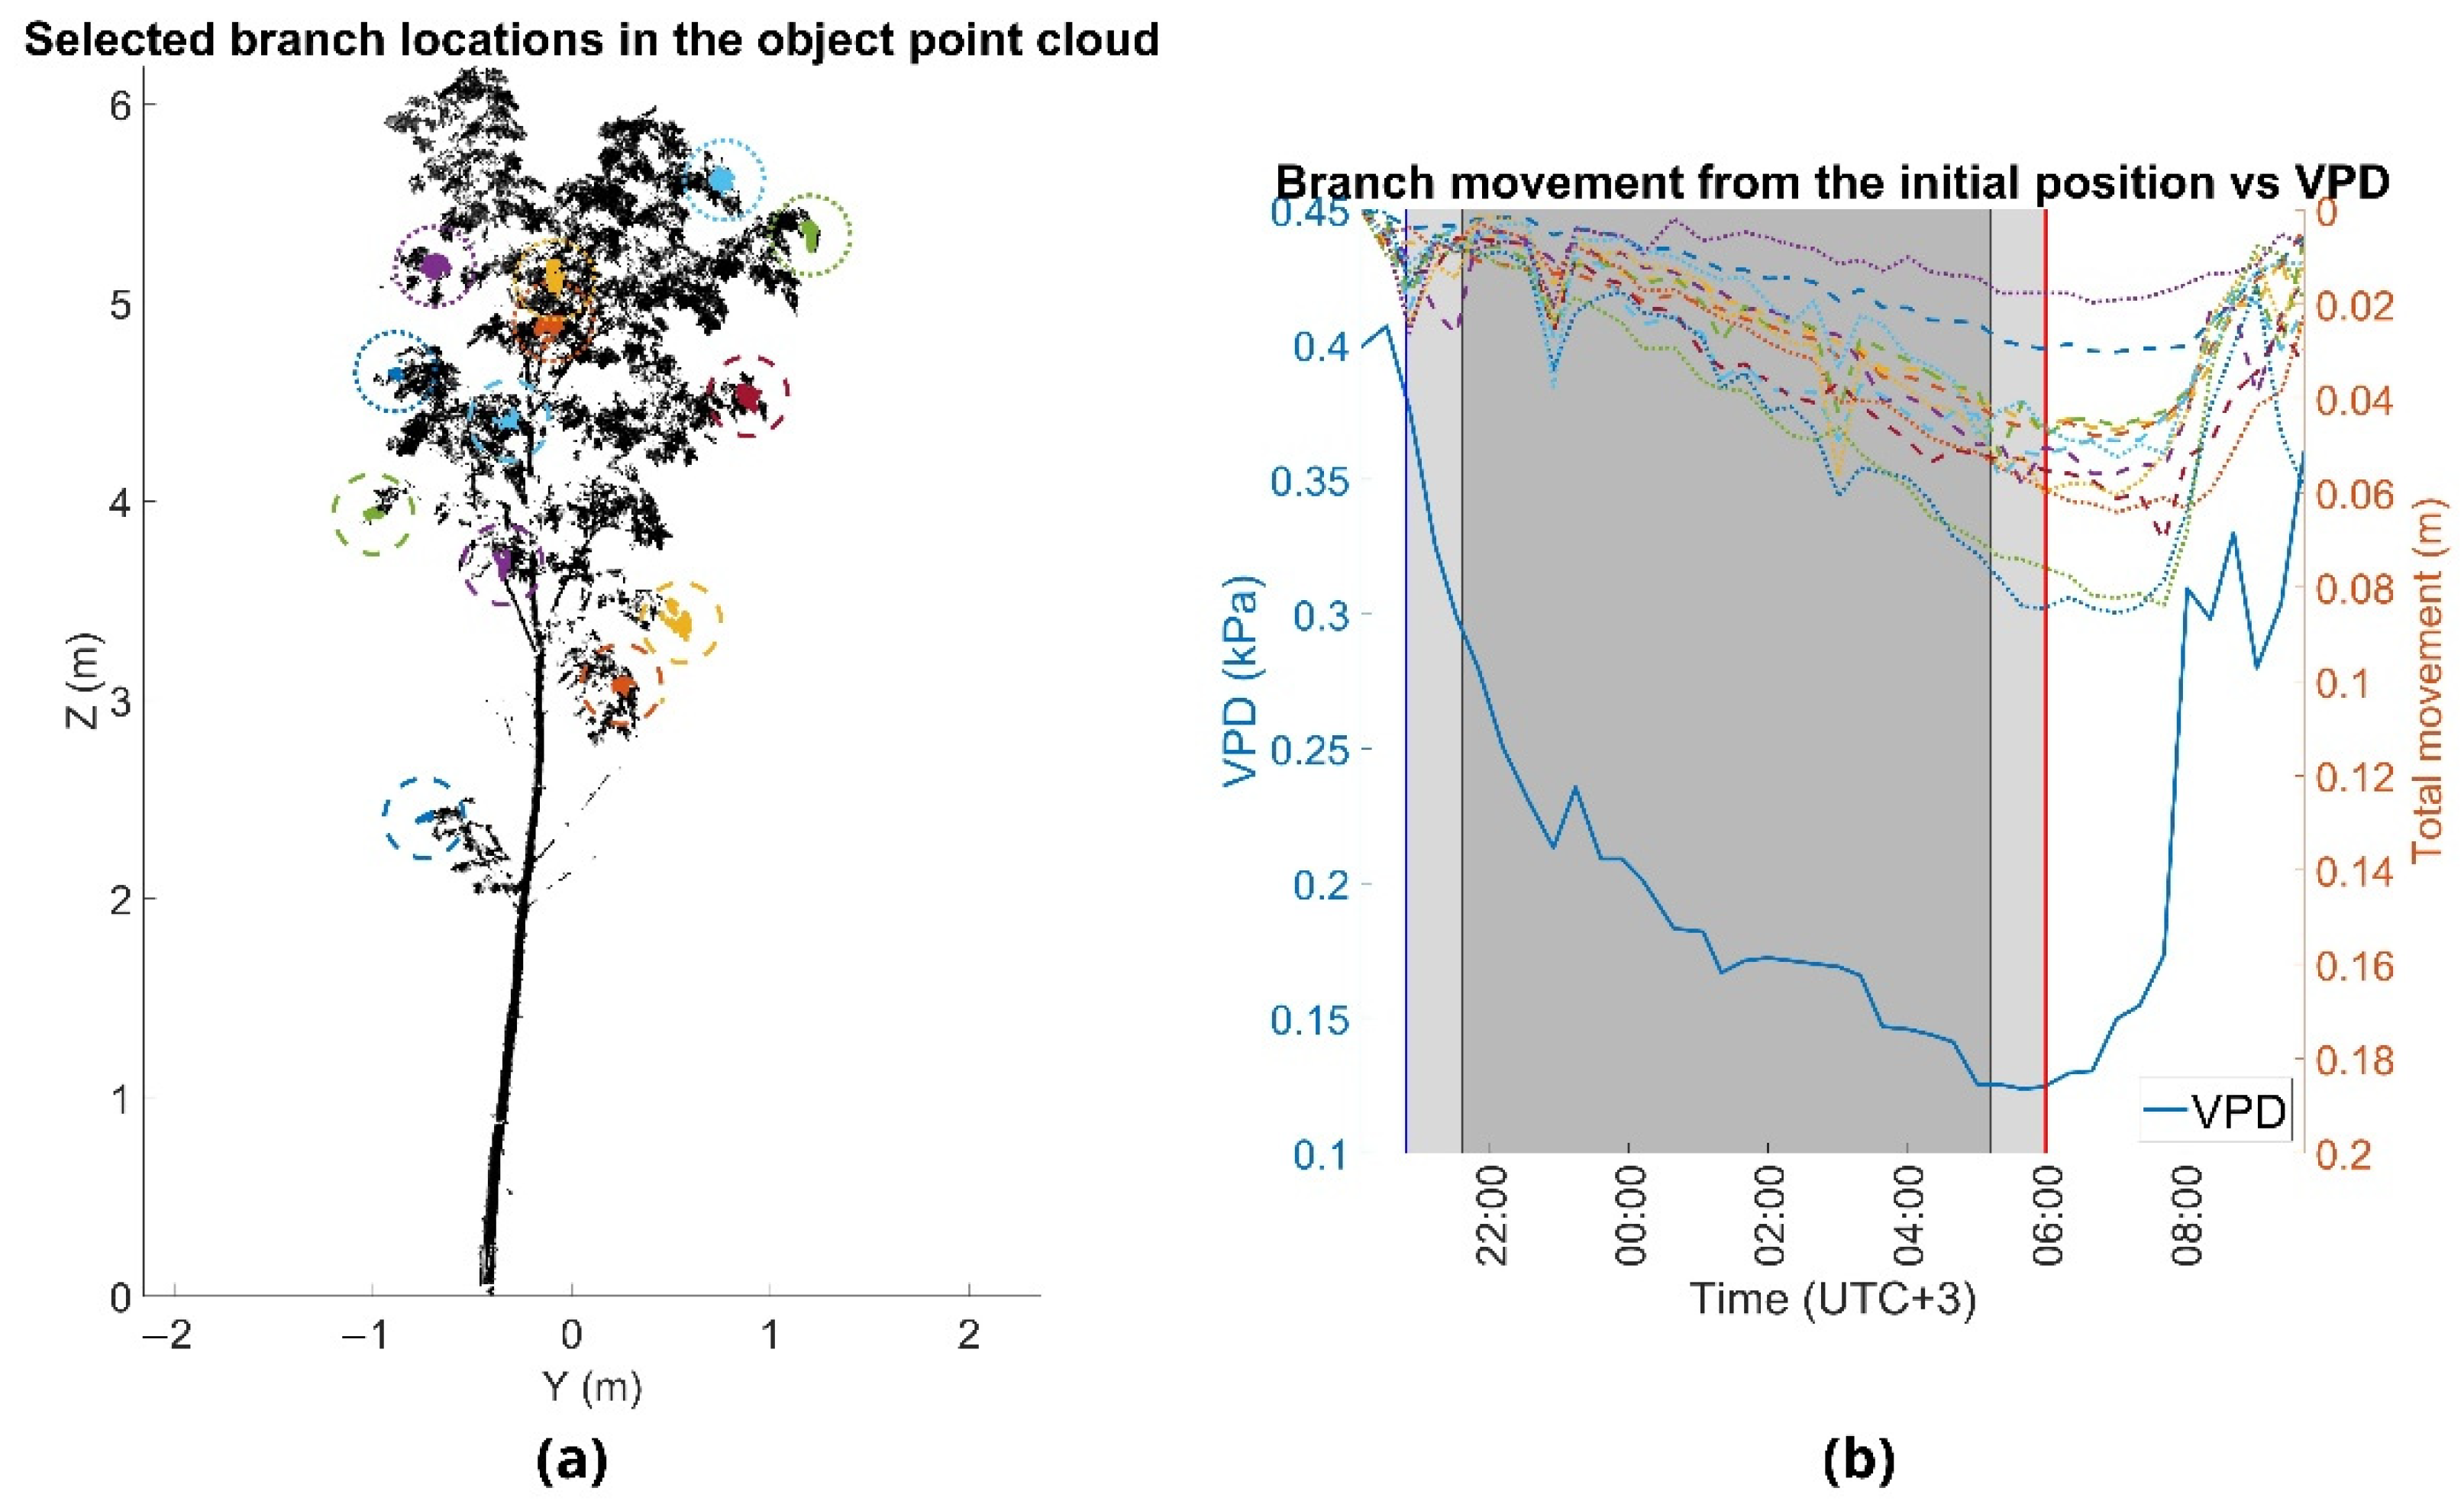
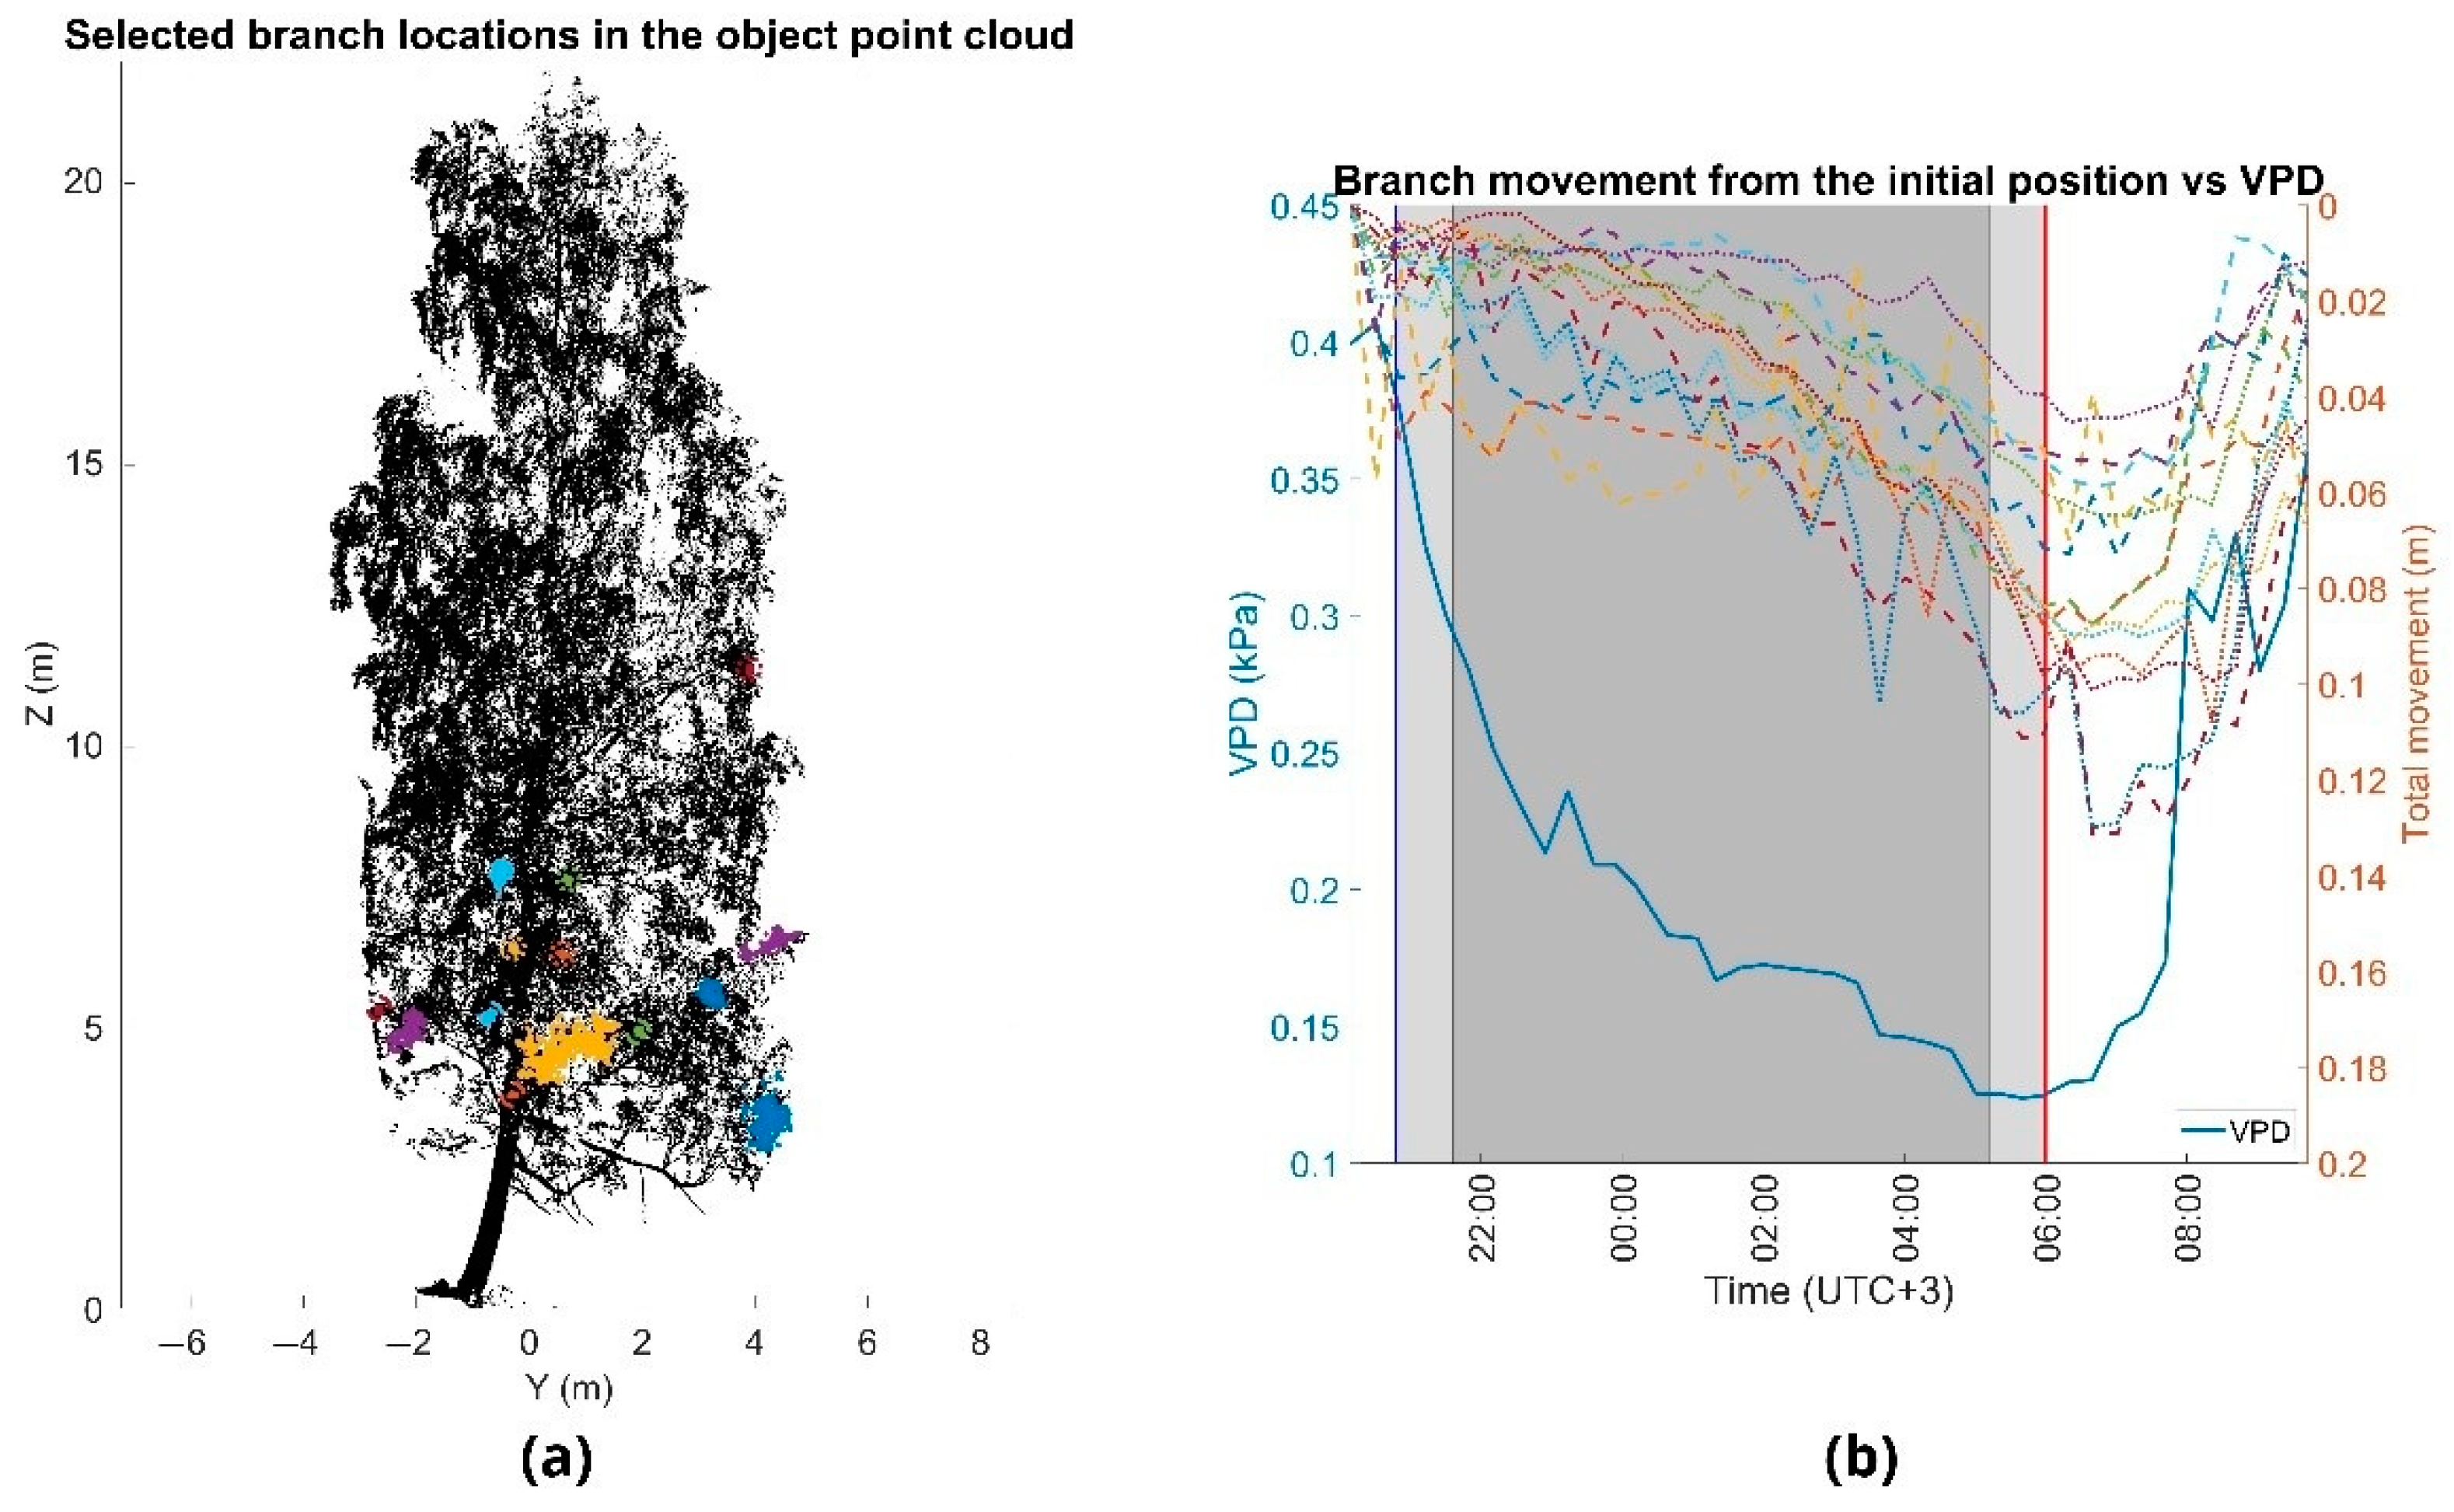
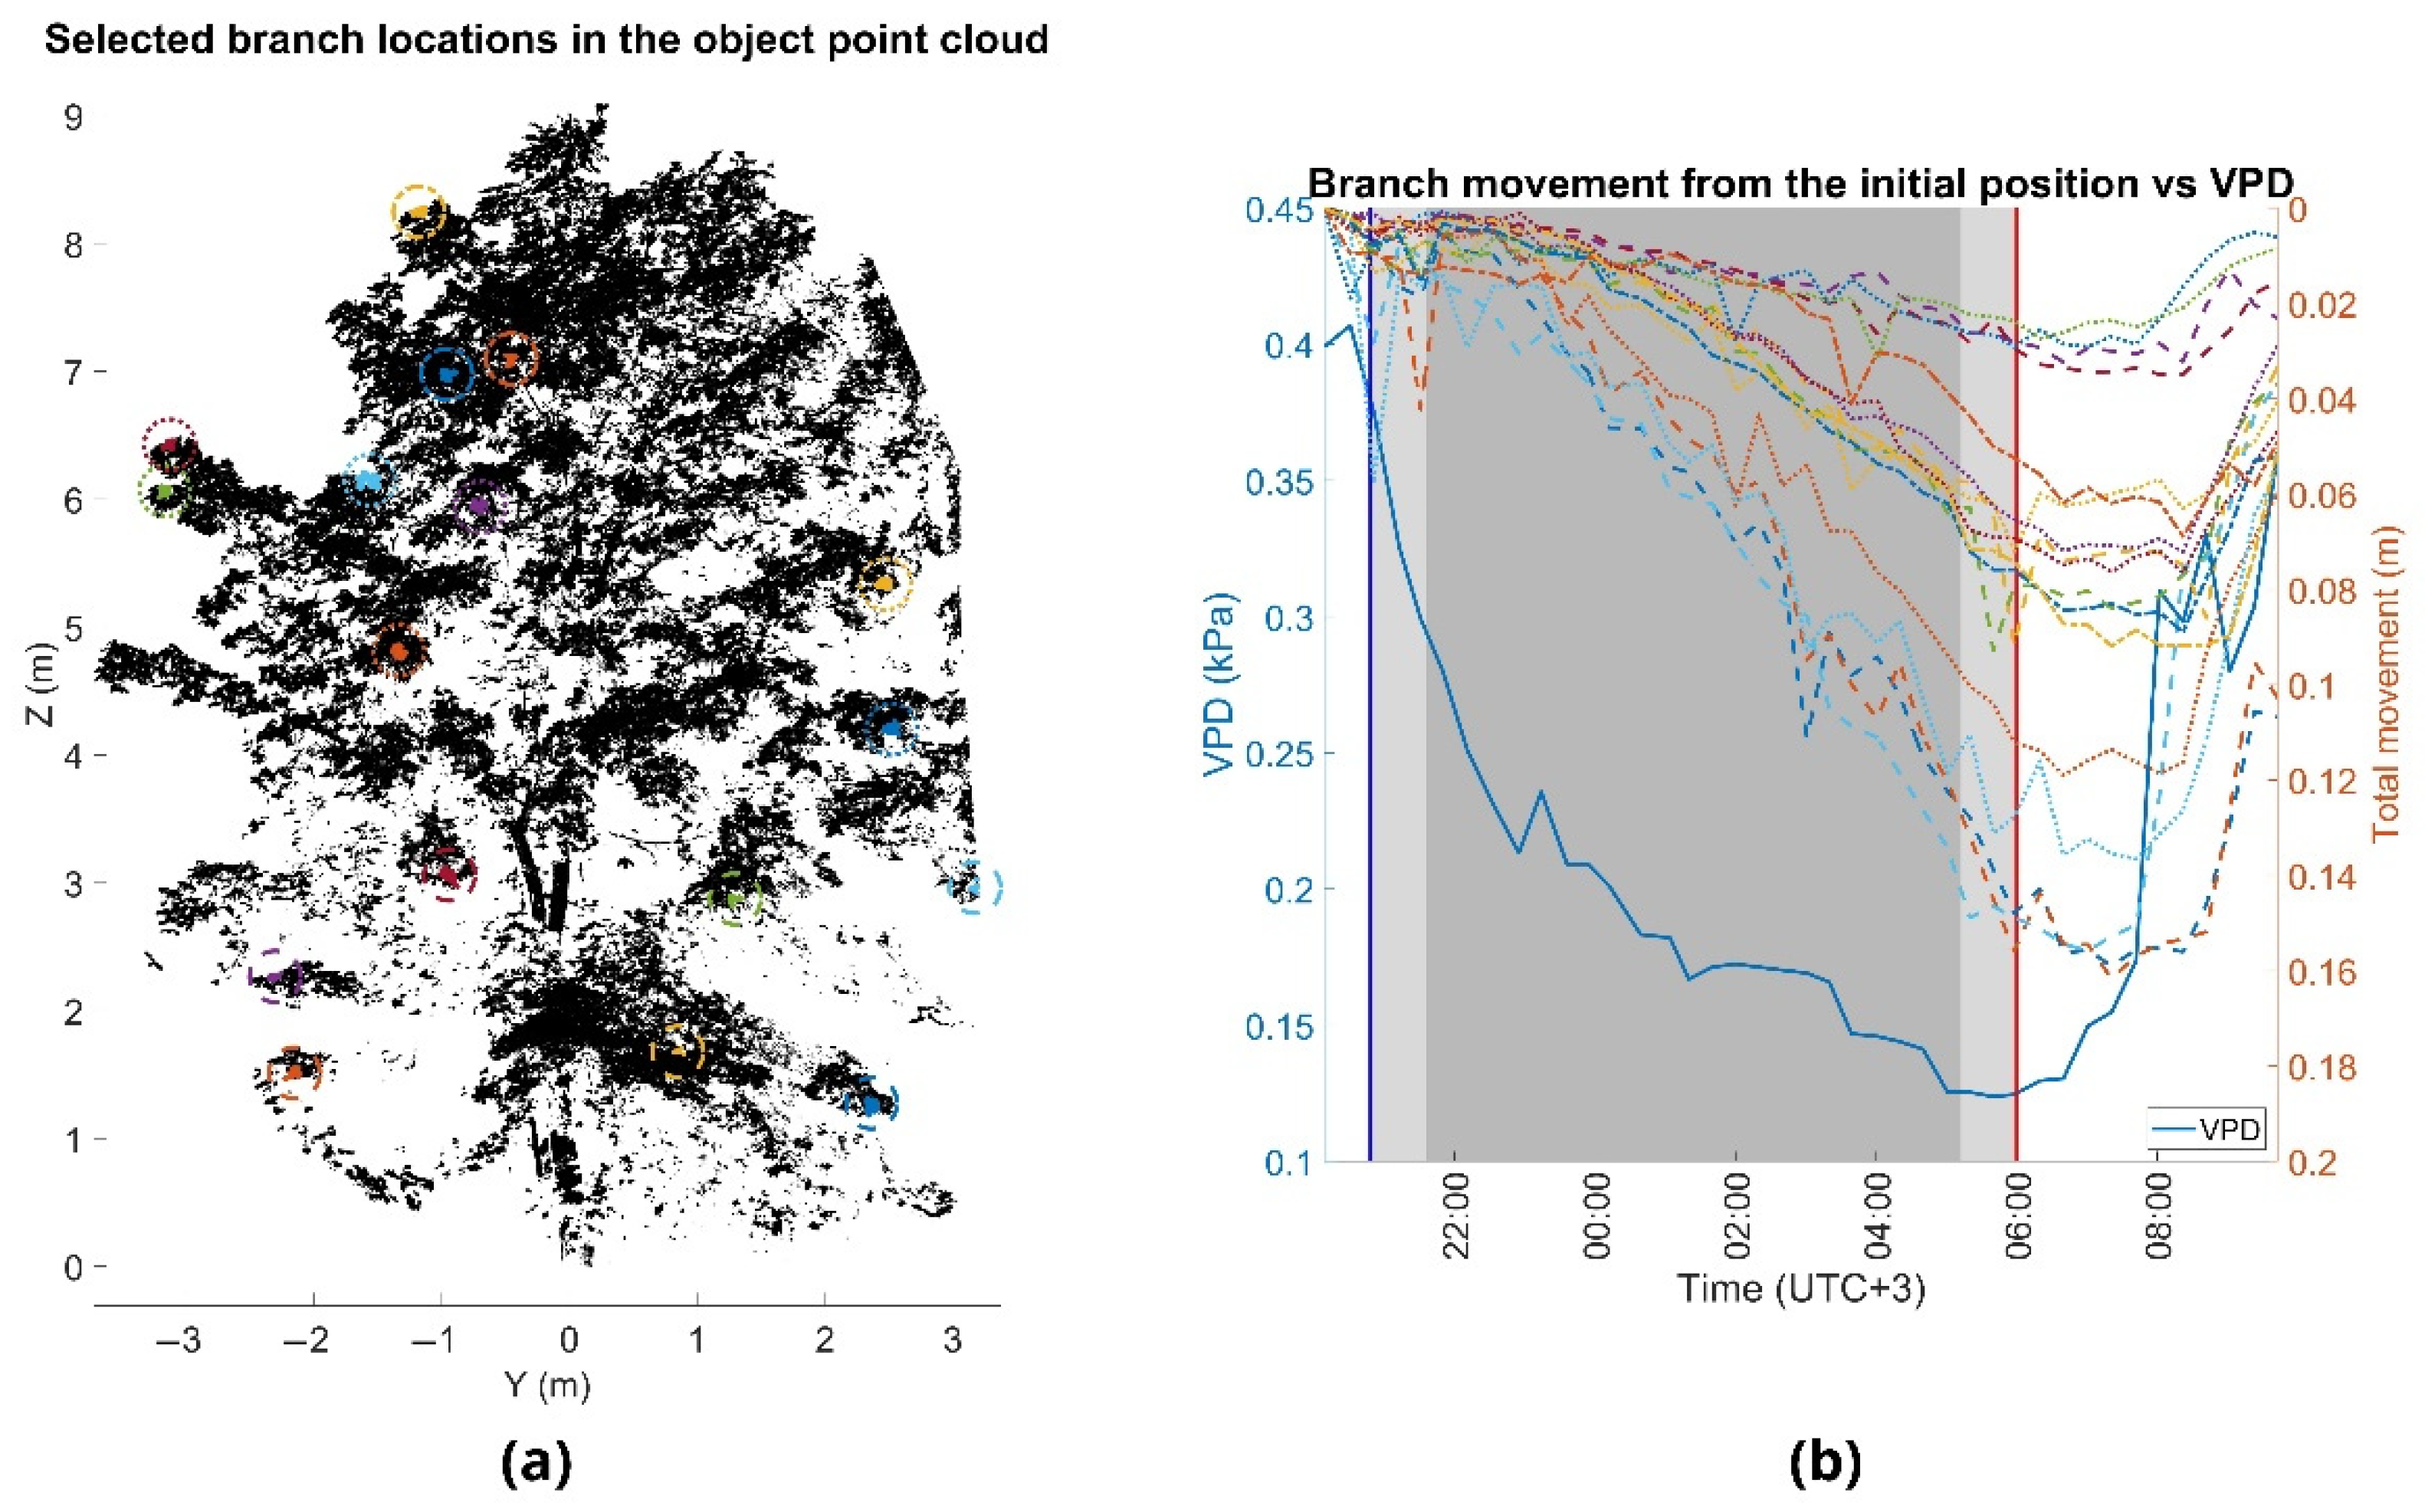
The overnight movement patterns were similar between all the observed test trees. As VPD decreased during the night, the branches moved downwards. VPD reached its minimum value at the time of sunrise at 06:00 and the lowest branch positions took place 40 min (small Norway maple) (Figure 4), 60 min (silver birch) (Figure 5) and 80 min (moderate-sized Norway maple) (Figure 6) after the VPD minimum and started moving upwards towards the initial position at sunset. We found that overnight branch position showed a relatively good agreement with VPD and that there was a time lag between the change in VPD and branch movement (Table 4). The agreement between VPD and overnight branch position was the highest with a time lag of 2.5 h and 3 h for individual branches of the smaller Norway maple and the larger trees, respectively. At the tree-level, the best agreement between VPD and overnight branch movement was observed at 2 h for the silver birch and the smaller Norway maple, and at 3 h for the moderate-sized Norway maple.
The Norway maples showed slightly higher correlations with VPD than the silver birch, but all the trees showed strong (R2 > 0.57) correlations with VPD. The time lag between VPD and overnight branch movement seemed to vary to some extent also within trees, as can be observed from the variation in the R2 in Table 4. The smaller Norway maple showed slightly smaller time lags between VPD, and branch movement compared with the larger trees. It could be observed that there were differences between trees in the time that it took branches to move upwards after VPD increased substantially in the morning (approximately 7:30). The branches of the smaller Norway maple moved upwards faster than the branches of the larger trees.
4. Discussion
We had two hypotheses aiming to explain the observed branch movement and their spatiotemporal patterns. The first one was that in a controlled environment variation in leaf water content would be related to changes in branch position. This was tested in a drought experiment where leaf water content decreased gradually. The water stress was characterized by measures of RWC and LWP, which both explained up to 95% and 97% of the changes in position (upward movement) of individual branches, respectively. On average LWP explained a slightly larger portion of the branch movement, which may be due to smaller variability of values between individual needles. There was, however, significant variation in the observed branch movements between individual branches and the slope in the relationship between water status and branch position varied. It was observed that the branch angle and branch length significantly affected the changes in branch position during the monitoring period in addition to water status. We were able to explain 63% of the variation in branch movement, when a general model of all branches was built to describe variation in branch movement using RWC, branch angle and branch length.
Often, changes in leaf water content are driven by atmospheric water demand (or VPD) as water vapor diffusion rate through the stomata is proportional to VPD, especially in conditions where soil water availability is not a limiting factor [26]. Although stomata partially close for the night, significant overnight stomatal conductance in boreal trees has been observed allowing the movement of water between the air and the leaf [23]. Therefore, we hypothesized that a decrease in VPD would cause a downward branch movement, because a decreasing VPD increases leaf water content. Although we cannot explicitly prove this, because we did not measure leaf water content, our findings supported this hypothesis as VPD explained 57–74% of overnight branch movement of single trees. Similar relationship between VPD and branch movement has been found for a woody shrub species recently [2]. It should be noted that there were differences in the time lag between VPD and overnight movement between branches. Based on visual observations of the movement of branches in Figure 5 and Figure 6, it seems that the larger the overnight branch movement is, the longer is the time lag between VPD and branch movement. Branches with a larger number of leaves and leaf area are likely to show greater overnight movement due to the larger mass of water within the leaves, and therefore the amount of water exchanged with the atmosphere is also greater. It was observed that the amplitude of overnight branch movement was greater in the larger trees with more foliage supporting this theory. Additionally, the branches of the smaller tree showed to react faster to increased VPD during the morning than the branches of the larger trees.
The main limitation in the field is the requirement of windless conditions, which hampers the measurements and applications. Thus, we focused on measuring overnight branch movement during a windless night in the summer and ensured that air flows did not influence our measurements using subjective estimation of air flows. Furthermore, the constant trends in branch movement between individual branches verify that our results were not a result of the effect of wind. More investigations are needed also with daytime measurements in windless conditions to further confirm the findings of this study. Continuous TLS measurements of tree canopies over longer time periods may bring new possibilities to study the phenomenon of branch movement [27]. Growth during the summer can influence branch length and the distribution of weight, which can affect branch position as well, and thus further complicate deductions based on branch position and movement. Other techniques on the other hand rely on interactions between trees and wind. Tree sway has been shown to be affected by tree water status and could possibly complement branch measurements in evaluating tree-water relations [28,29].
Monitoring the movement of branches could have applications in determining the water status of plants, especially in controlled environments. The benefit of the technique lies in its ability to measure several entire trees simultaneously rather than just a part of trees such as dendrometers [24]. Variation in water content dynamics within trees could be detected using the presented technique, which could help us to monitor and understand within tree water dynamics in detail. The cost of laser scanning instruments is decreasing enabling novel practical solutions to water status monitoring that do not involve spectral measurements or tedious manual measurements of leaf water content or water potential using the pressure chamber or more expensive measurements of water potential using psychrometers which also require close monitoring and maintenance [30,31,32]. The benefit of laser scanning in a greenhouse environment would be that it is not so sensitive to viewing angle or illumination conditions compared with spectral information and can give accurate distance measurements from a 50 m distance and beyond. Plant growth can also be measured using the same instrument [33].
Further studies should be conducted to verify the results with a wider range of tree and plant species and environmental conditions. Other factors that could influence the movement of branches include local illumination and atmospheric conditions. Branches that receive a greater photon influx and are warmed more by the sun should transpire more and therefore have a greater amplitude of diurnal branch movement based on our theory. If our theory is correct and branch movement is driven by variation in leaf water content, we could expect that tree stress, which often causes changes in stomatal behavior and transpiration [34], could be detected as altered patterns of diurnal branch movement [28].
Furthermore, mechanical factors can affect the magnitude of branch movement, such as the angle of the branch relative to the stem, branch thickness and length and wood properties, requiring additional investigations. For instance, we observed that branch length and angle had a significant effect on the magnitude of branch movement in our first experiment in a controlled environment. Branches that point more straight up are less affected by gravitational differences that variation in mass can induce. Branches that have a greater leaf area in relation to branch thickness and a lower wood density are likely to show larger overnight movement. Increase in the water content and mass of the branches and needles during the night-time will cause the branch to move downwards. Changes in the turgor pressure of living cells affect the elasticity of the cells, which could further influence branch movement, but separating the effect of turgor pressure and water status is complicated by the strong correlation of the two variables [35]. The amount of movement of the branches due to a given weight load can be described mathematically if the flexural rigidity of the branch, branch length and the distribution of the weight on the branch are known [36]. Tree stem stiffness has been shown to increase with increasing water content, which could inflict a counterforce to the gravitational pull, which is caused by increasing leaf water mass [28]. A more comprehensive model including different wood properties and more detailed branch dimensions are needed to fully model and understand branch movement.
In summary, the findings of our experiments support the hypothesis that branch movement is driven by variation in leaf water content, opening new perspectives for forest analyses since branch movement can be monitored by remote sensors, such as TLS. Therefore, the measurements of branch movements could open new avenues in understanding whole plant water relations and provide implications also for forest health and resilience monitoring. Although it can be challenging to explicitly quantify the changes in leaf water content in a branch based on its dimensions, the branch movement can give rapid information on the direction and speed of change in leaf water content. When the movement of a branch has stopped, there is no change in leaf water content, and an upward or downward movement indicates that a change in leaf water content is occurring in either direction. It could be observed that there were differences between branches in the timing and the slope of overnight branch movement, which could be caused by differences, e.g., in stomatal behavior or branch mechanical or structural characteristics. When individual branches can be observed, we can simultaneously observe the changes in leaf water content in a vertical gradient in a tree or a plant.
Author Contributions
Conceptualization, S.J., E.P., T.H. and L.L.; methodology, S.J., L.L. and E.P.; validation, S.J. and M.C.; formal analysis, S.J.; resources, E.P., H.H. and M.V.; data curation, A.E.I.; writing—original draft preparation, S.J., M.C., T.H., E.P. and M.V.; writing—review and editing, S.J., M.C., E.P., M.V., H.H., A.E.I., L.L. and T.H.; visualization, S.J. and E.P.; supervision, M.V. and H.H.; funding acquisition, S.J., M.V. and E.P. All authors have read and agreed to the published version of the manuscript.
Funding
This research was funded by the Finnish Cultural Foundation and the Academy of Finland (under grant numbers 265949/292757, 295047, 330422, 316096/320075). This study has been done with affiliation to the Academy of Finland Flagship Forest-Human-Machine Interplay—Building Resilience, Redefining Value Networks and Enabling Meaningful Experiences (UNITE) [grant number 337127].
Data Availability Statement
Data are available upon request from the authors and will be made available in an online repository later.
Acknowledgments
We would like to thank the anonymous reviewers for reviewing the paper.
Conflicts of Interest
The authors declare no conflict of interest.
References
- Minorsky, P.V. American racism and the lost legacy of Sir Jagadis Chandra Bose, the father of plant neurobiology. Plant Signal. Behav. 2021, 16, 1818030. [Google Scholar] [CrossRef] [PubMed]
- Hallmark, A.J.; Maurer, G.E.; Pangle, R.E.; Litvak, M.E. Watching plants’ dance: Movements of live and dead branches linked to atmospheric water demand. Ecosphere 2021, 12, e03705. [Google Scholar] [CrossRef]
- Puttonen, E.; Briese, C.; Mandlburger, G.; Wieser, M.; Pfennigbauer, M.; Zlinszky, A.; Pfeifer, N. Quantification of Overnight Movement of Birch (Betula pendula) Branches and Foliage with Short Interval Terrestrial Laser Scanning. Front. Plant Sci. 2016, 7, 222. [Google Scholar] [CrossRef] [PubMed] [Green Version]
- Zlinszky, A.; Molnár, B.; Barfod, A.S. Not All Trees Sleep the Same—High Temporal Resolution Terrestrial Laser Scanning Shows Differences in Nocturnal Plant Movement. Front. Plant Sci. 2017, 8, 1814. [Google Scholar] [CrossRef] [Green Version]
- Zlinszky, A.; Barfod, A. Short interval overnight laser scanning suggest sub-circadian periodicity of tree turgor. Plant Signal. Behav. 2018, 13, e1439655. [Google Scholar] [CrossRef] [Green Version]
- Åkerblom, M.; Raumonen, P.; Mäkipää, R.; Kaasalainen, M. Automatic tree species recognition with quantitative structure models. Remote Sens. Environ. 2017, 191, 1–12. [Google Scholar] [CrossRef]
- Danson, F.; Hetherington, D.; Morsdorf, F.; Koetz, B.; Allgower, B. Forest Canopy Gap Fraction from Terrestrial Laser Scanning. IEEE Geosci. Remote Sens. Lett. 2007, 4, 157–160. [Google Scholar] [CrossRef] [Green Version]
- Liang, X.; Kankare, V.; Hyyppä, J.; Wang, Y.; Kukko, A.; Haggrén, H.; Yu, X.; Kaartinen, H.; Jaakkola, A.; Guan, F.; et al. Terrestrial laser scanning in forest inventories. ISPRS J. Photogramm. Remote Sens. 2016, 115, 63–77. [Google Scholar] [CrossRef]
- Malhi, Y.; Jackson, T.; Bentley, L.P.; Lau, A.; Shenkin, A.; Herold, M.; Calders, K.; Bartholomeus, H.; Disney, M.I. New perspectives on the ecology of tree structure and tree communities through terrestrial laser scanning. Interface Focus 2018, 8, 20170052. [Google Scholar] [CrossRef] [Green Version]
- Saarinen, N.; Kankare, V.; Vastaranta, M.; Luoma, V.; Pyörälä, J.; Tanhuanpää, T.; Liang, X.; Kaartinen, H.; Kukko, A.; Jaakkola, A.; et al. Feasibility of Terrestrial laser scanning for collecting stem volume information from single trees. ISPRS J. Photogramm. Remote Sens. 2017, 123, 140–158. [Google Scholar] [CrossRef]
- Ellison, D.; Morris, C.E.; Locatelli, B.; Sheil, D.; Cohen, J.; Murdiyarso, D.; Gutierrez, V.; van Noordwijk, M.; Creed, I.F.; Pokorny, J.; et al. Trees, forests and water: Cool insights for a hot world. Glob. Environ. Chang. 2017, 43, 51–61. [Google Scholar] [CrossRef]
- Aston, M.J.; Lawlor, D.W. The Relationship between Transpiration, Root Water Uptake, and Leaf Water Potential. J. Exp. Bot. 1979, 30, 169–181. [Google Scholar] [CrossRef]
- Kramer, P.J.; Kozlowski, T.T. Physiology of Trees, 1st ed.; McGraw-Hill Book Company, Inc.: London, UK, 1960; pp. 1–642. [Google Scholar]
- Tinklin, R.; Weatherley, P.E. On the Relationship between Transpiration Rate and Leaf Water Potential. New Phytol. 1966, 65, 509–517. [Google Scholar] [CrossRef]
- De Swaef, T.; De Schepper, V.; Vandegehuchte, M.W.; Steppe, K. Stem diameter variations as a versatile research tool in ecophysiology. Tree Physiol. 2015, 35, 1047–1061. [Google Scholar] [CrossRef] [PubMed]
- Kozlowski, T.T.; Winget, C.H. Diurnal and Seasonal Variation in Radii of Tree Stems. Ecology 1964, 45, 149. [Google Scholar] [CrossRef]
- Perämäki, M.; Nikinmaa, E.; Sevanto, S.; Ilvesniemi, H.; Siivola, E.; Hari, P.; Vesala, T. Tree stem diameter variations and transpiration in Scots pine: An analysis using a dynamic sap flow model. Tree Physiol. 2001, 21, 889–897. [Google Scholar] [CrossRef] [PubMed] [Green Version]
- Sevanto, S.; Vesala, T.; Peramaki, M.; Nikinmaa, E. Time lags for xylem and stem diameter variations in a Scots pine tree. Plant Cell Environ. 2002, 25, 1071–1077. [Google Scholar] [CrossRef]
- Offenthaler, I.; Hietz, P.; Richter, H. Wood diameter indicates diurnal and long-term patterns of xylem water potential in Norway spruce. Trees 2001, 15, 215–221. [Google Scholar] [CrossRef]
- Patanè, C. Leaf Area Index, Leaf Transpiration and Stomatal Conductance as Affected by Soil Water Deficit and VPD in Processing Tomato in Semi Arid Mediterranean Climate. J. Agron. Crop Sci. 2010, 197, 165–176. [Google Scholar] [CrossRef]
- Leuschner, C. Air humidity as an ecological factor for woodland herbs: Leaf water status, nutrient uptake, leaf anatomy, and productivity of eight species grown at low or high vpd levels. Flora-Morphol. Distrib. Funct. Ecol. Plants 2002, 197, 262–274. [Google Scholar] [CrossRef]
- Barigah, T.S.; Charrier, O.; Douris, M.; Bonhomme, M.; Herbette, S.; Ameglio, T.; Fichot, R.; Brignolas, F.; Cochard, H. Water stress-induced xylem hydraulic failure is a causal factor of tree mortality in beech and poplar. Ann. Bot. 2013, 112, 1431–1437. [Google Scholar] [CrossRef] [PubMed]
- Hoshika, Y.; Osada, Y.; de Marco, A.; Peñuelas, J.; Paoletti, E. Global diurnal and nocturnal parameters of stomatal conductance in woody plants and major crops. Glob. Ecol. Biogeogr. 2018, 27, 257–275. [Google Scholar] [CrossRef] [Green Version]
- Puttonen, E.; Lehtomäki, M.; Litkey, P.; Näsi, R.; Feng, Z.; Liang, X.; Wittke, S.; Pandžić, M.; Hakala, T.; Karjalainen, M.; et al. A Clustering Framework for Monitoring Circadian Rhythm in Structural Dynamics in Plants from Terrestrial Laser Scanning Time Series. Front. Plant Sci. 2019, 10, 486. [Google Scholar] [CrossRef] [PubMed] [Green Version]
- R Core Team. A Language and Environment for Statistical Computing; R Foundation for Statistical Computing: Vienna, Austria, 2013. [Google Scholar]
- Elfving, D.C.; Kaufmann, M.R.; Hall, A.E. Interpreting Leaf Water Potential Measurements with a Model of the Soil-Plant-Atmosphere Continuum. Physiol. Plant. 1972, 27, 161–168. [Google Scholar] [CrossRef]
- Campos, M.B.; Litkey, P.; Wang, Y.; Chen, Y.; Hyyti, H.; Hyyppä, J.; Puttonen, E. A Long-Term Terrestrial Laser Scanning Measurement Station to Continuously Monitor Structural and Phenological Dynamics of Boreal Forest Canopy. Front. Plant Sci. 2021, 11, 2132. [Google Scholar] [CrossRef]
- Ciruzzi, D.M.; Ii, S.P.L. Monitoring Tree Sway as an Indicator of Water Stress. Geophys. Res. Lett. 2019, 46, 12021–12029. [Google Scholar] [CrossRef]
- van Emmerik, T.; Steele-Dunne, S.; Gentine, P.; Oliveira, R.S.; Bittencourt, P.; Barros, F.; van de Giesen, N. Ideas and perspectives: Tree–atmosphere interaction responds to water-related stem variations. Biogeosciences 2018, 15, 6439–6449. [Google Scholar] [CrossRef] [Green Version]
- Boren, E.; Boschetti, L. Landsat-8 and Sentinel-2 Canopy Water Content Estimation in Croplands through Radiative Transfer Model Inversion. Remote Sens. 2020, 12, 2803. [Google Scholar] [CrossRef]
- Boyer, J.S.; Knipling, E.B. Isopiestic technique for measuring leaf water potentials with a thermocouple psychrometer. Proc. Natl. Acad. Sci. USA 1965, 54, 1044. [Google Scholar]
- Zhu, X.; Skidmore, A.K.; Darvishzadeh, R.; Wang, T. Estimation of forest leaf water content through inversion of a radiative transfer model from LiDAR and hyperspectral data. Int. J. Appl. Earth Obs. Geoinform. ITC J. 2018, 74, 120–129. [Google Scholar] [CrossRef]
- Tompalski, P.; Coops, N.C.; White, J.C.; Goodbody, T.R.; Hennigar, C.R.; Wulder, M.A.; Socha, J.; Woods, M.E. Estimating Changes in Forest Attributes and Enhancing Growth Projections: A Review of Existing Approaches and Future Directions Using Airborne 3D Point Cloud Data. Curr. For. Rep. 2021, 7, 1–24. [Google Scholar] [CrossRef]
- Zhou, S.; Medlyn, B.; Sabaté, S.; Sperlich, D.; Prentice, I.C.; Whitehead, D. Short-term water stress impacts on stomatal, mesophyll and biochemical limitations to photosynthesis differ consistently among tree species from contrasting climates. Tree Physiol. 2014, 34, 1035–1046. [Google Scholar] [CrossRef] [PubMed] [Green Version]
- Tyree, M.T.; Hammel, H.T. The Measurement of the Turgor Pressure and the Water Relations of Plants by the Pressure-bomb Technique. J. Exp. Bot. 1972, 23, 267–282. [Google Scholar] [CrossRef]
- Niklas, K.J. Changes in the factor of safety within the superstructure of a dicot tree. Am. J. Bot. 1999, 86, 688–696. [Google Scholar] [CrossRef]
Figure 1.
The measurement configuration in August 2016. Scanner locations are marked with colored boxes, being the FARO Focus X330 (red); FARO Focus 3D 120 S 1 (dark blue); and TRIMBLE T5X (green). The gray points denote the combined measured point cloud of all three scanners viewed from above. The trees monitored are marked with different colors in the figure; in addition, the small Norway maple is highlighted with a red rectangle. The five reference sphere locations are marked with black circles in the figure.

Figure 2.
Daily rainfall and mean air temperature at the Kirkkonummi field site during August. The measurements were carried out between 24 and 25 August 2016.
Figure 2.
Daily rainfall and mean air temperature at the Kirkkonummi field site during August. The measurements were carried out between 24 and 25 August 2016.

Figure 3.
Relationship between relative water content (%) and branch movement (cm) for each branch in (a) Pine seedling 1 and (b) Pine seedling 2. Each line represents a regression line between branch movement and relative water content. The different symbols denote different branches.
Figure 3.
Relationship between relative water content (%) and branch movement (cm) for each branch in (a) Pine seedling 1 and (b) Pine seedling 2. Each line represents a regression line between branch movement and relative water content. The different symbols denote different branches.

Figure 4.
(a) Point cloud of the small Norway maple (Norway maple L.) in August 2016. Movements were analyzed by detecting the same cluster of points from each time point. Horizontal axis shows the distance of the tree width with respect to the point cloud mean and the vertical axis shows the tree height. Point sizes in the colored clusters are emphasized for visual clarity. (b) Overnight branch movement during monitoring period. Branch movements are marked with the dashed and dotted lines (right y-axis) and the vapor-pressure deficit (VPD) with the solid blue line (left y-axis). The times of sunset and sunrise are marked with the blue and red vertical lines, at 8:40 p.m. and 6:00 a.m., respectively (y-axis). Civil twilight time is marked with the light gray area, and time of nautical and astronomical twilight with the dark gray area.

Figure 5.
(a) Point cloud of the silver birch (Betula pendula Roth.) in August 2016. (b) Overnight branch movement during monitoring period. Branch movements are marked with the dashed lines and the vapor-pressure deficit (VPD) with the solid blue line. The times of sunset and sunrise are marked with the blue and red vertical lines, at 8:40 p.m. and 6:00 a.m., respectively. Civil twilight time is marked with the light gray area, and time of nautical and astronomical twilight with the dark gray area.

Figure 6.
(a) Point cloud of the moderate-sized Norway maple (Acer platanoides L.) in August 2016. (b) Overnight branch movement during monitoring period. Branch movements are marked with the dashed lines and the vapor-pressure deficit (VPD) with the solid blue line. The times of sunset and sunrise are marked with the blue and red vertical lines, at 8:40 p.m. and 6:00 a.m., respectively. Civil twilight time is marked with the light gray area, and time of nautical and astronomical twilight with the dark gray area.


Table 1.
Tree characteristics: diameter at breast height (DBH) and height for the investigated trees in the field.
Table 1.
Tree characteristics: diameter at breast height (DBH) and height for the investigated trees in the field.
| Species | DBH (cm) | Height (m) |
|---|---|---|
| Silver birch (Betula pendula Roth.) | 42.1 | 22.1 |
| Small Norway maple (Acer Platanoides L.) | 6.2 | 5.9 |
| Moderate-sized Norway maple | 19.5 | 9.1 |
Table 2.
Summary of statistics for linear regression models for individual branches between relative water content (RWC), leaf water potential (LWP) and branch movement for Scots pine. Mean, minimum (Min), maximum (Max) and standard deviation (Std) for coefficient of determination (R2) and root mean square error (RMSE) calculated from six and nine branches from seedlings 1 and 2, respectively.
| Pine Seedling 1 | Pine Seedling 2 | |||
|---|---|---|---|---|
| Movement vs. RWC | Movement vs. LWP | Movement vs. RWC | Movement vs. LWP | |
| Mean R2 | 0.83 | 0.86 | 0.64 | 0.75 |
| Min R2 | 0.71 | 0.50 | 0.38 | 0.57 |
| Max R2 | 0.95 | 0.94 | 0.84 | 0.97 |
| Std R2 | 0.11 | 0.18 | 0.16 | 0.13 |
| Mean RMSE (%-units/bars) | 4.98 | 4.02 | 8.86 | 4.66 |
| Min RMSE (%-units/bars) | 2.72 | 2.82 | 5.94 | 1.70 |
| Max RMSE (%-units/bars) | 6.96 | 8.34 | 11.82 | 6.39 |
| Std RMSE (%-units/bars) | 1.81 | 2.12 | 2.04 | 1.50 |
Table 3.
Coefficient of determination (R2) and adjusted R2 (Adj. R2) of multiple regression models explaining variation in branch movement (n = 171) in Scots pine seedlings. The predictors were relative water content (RWC), branch angle and branch length. Variable coefficients are given for the model including all predictors.
| Predictors | R2 | Adj. R2 |
| RWC | 0.49 | 0.49 |
| RWC + branch angle | 0.55 | 0.54 |
| RWC + branch angle + branch length | 0.63 | 0.62 |
| Variable Coefficients | Estimate | p-Value |
| Intercept | 0.034 | <0.0001 |
| RWC | −0.00041 | <0.0001 |
| Branch angle | −0.00013 | <0.0001 |
| Branch length | 0.00029 | <0.0001 |
Table 4.
Median, minimum (Min) and maximum (Max) of coefficient of determination (R2) of linear regression models between vapor-pressure deficit (VPD) and the overnight branch movements measured in August. Number of observed branches were 14, 13 and 17 for silver birch, small Norway maple and moderate-sized Norway maple, respectively. Characteristics of the trees are presented in Table 2.
| Silver Birch | Norway Maple (Small) | Norway Maple (Moderate-Size) | |||||||
|---|---|---|---|---|---|---|---|---|---|
| Lag (h) | Median R2 | Min R2 | Max R2 | Median R2 | Min R2 | Max R2 | Median R2 | Min R2 | Max R2 |
| 0 | 0.26 | 0.08 | 0.57 | 0.42 | 0.07 | 0.60 | 0.20 | 0.03 | 0.51 |
| 0.5 | 0.35 | 0.03 | 0.52 | 0.51 | 0.05 | 0.73 | 0.30 | 0.07 | 0.62 |
| 1.0 | 0.45 | 0.06 | 0.57 | 0.62 | 0.07 | 0.77 | 0.40 | 0.14 | 0.73 |
| 1.5 | 0.53 | 0.01 | 0.69 | 0.66 | 0.27 | 0.77 | 0.52 | 0.21 | 0.75 |
| 2 | 0.57 | 0.01 | 0.70 | 0.66 | 0.31 | 0.79 | 0.63 | 0.31 | 0.73 |
| 2.5 | 0.55 | 0.00 | 0.72 | 0.60 | 0.27 | 0.80 | 0.70 | 0.44 | 0.77 |
| 3 | 0.54 | 0.00 | 0.78 | 0.48 | 0.22 | 0.77 | 0.74 | 0.39 | 0.83 |
| 0 | 0.26 | 0.08 | 0.57 | 0.42 | 0.07 | 0.60 | 0.20 | 0.03 | 0.51 |
| 0.5 | 0.35 | 0.03 | 0.52 | 0.51 | 0.05 | 0.73 | 0.30 | 0.07 | 0.62 |
| 1.0 | 0.45 | 0.06 | 0.57 | 0.62 | 0.07 | 0.77 | 0.40 | 0.14 | 0.73 |
| 1.5 | 0.53 | 0.01 | 0.69 | 0.66 | 0.27 | 0.77 | 0.52 | 0.21 | 0.75 |
Publisher’s Note: MDPI stays neutral with regard to jurisdictional claims in published maps and institutional affiliations. |
© 2022 by the authors. Licensee MDPI, Basel, Switzerland. This article is an open access article distributed under the terms and conditions of the Creative Commons Attribution (CC BY) license (https://creativecommons.org/licenses/by/4.0/).
Share and Cite
MDPI and ACS Style
Junttila, S.; Campos, M.; Hölttä, T.; Lindfors, L.; El Issaoui, A.; Vastaranta, M.; Hyyppä, H.; Puttonen, E. Tree Water Status Affects Tree Branch Position. Forests 2022, 13, 728. https://0-doi-org.brum.beds.ac.uk/10.3390/f13050728
AMA Style
Junttila S, Campos M, Hölttä T, Lindfors L, El Issaoui A, Vastaranta M, Hyyppä H, Puttonen E. Tree Water Status Affects Tree Branch Position. Forests. 2022; 13(5):728. https://0-doi-org.brum.beds.ac.uk/10.3390/f13050728
Chicago/Turabian StyleJunttila, Samuli, Mariana Campos, Teemu Hölttä, Lauri Lindfors, Aimad El Issaoui, Mikko Vastaranta, Hannu Hyyppä, and Eetu Puttonen. 2022. "Tree Water Status Affects Tree Branch Position" Forests 13, no. 5: 728. https://0-doi-org.brum.beds.ac.uk/10.3390/f13050728
Note that from the first issue of 2016, this journal uses article numbers instead of page numbers. See further details here.